Tracking Changing Evidences of Water in Wetland Using the Satellite Long-Term Observations from 1984 to 2017
Abstract
1. Introduction
2. Data and Methods
2.1. Study Area and Data
2.1.1. Study Area
2.1.2. Satellite Data
2.2. Method
2.2.1. Detection of Open Water in the Wetland
2.2.2. Clustering Analysis of Wetland Habitats
3. Results
3.1. Periodic Changing of Open Water Extent in the Wetland
3.2. Interchanges of Water Body and Aquatic Vegetation in Wetland
4. Discussion
5. Conclusions
- (1)
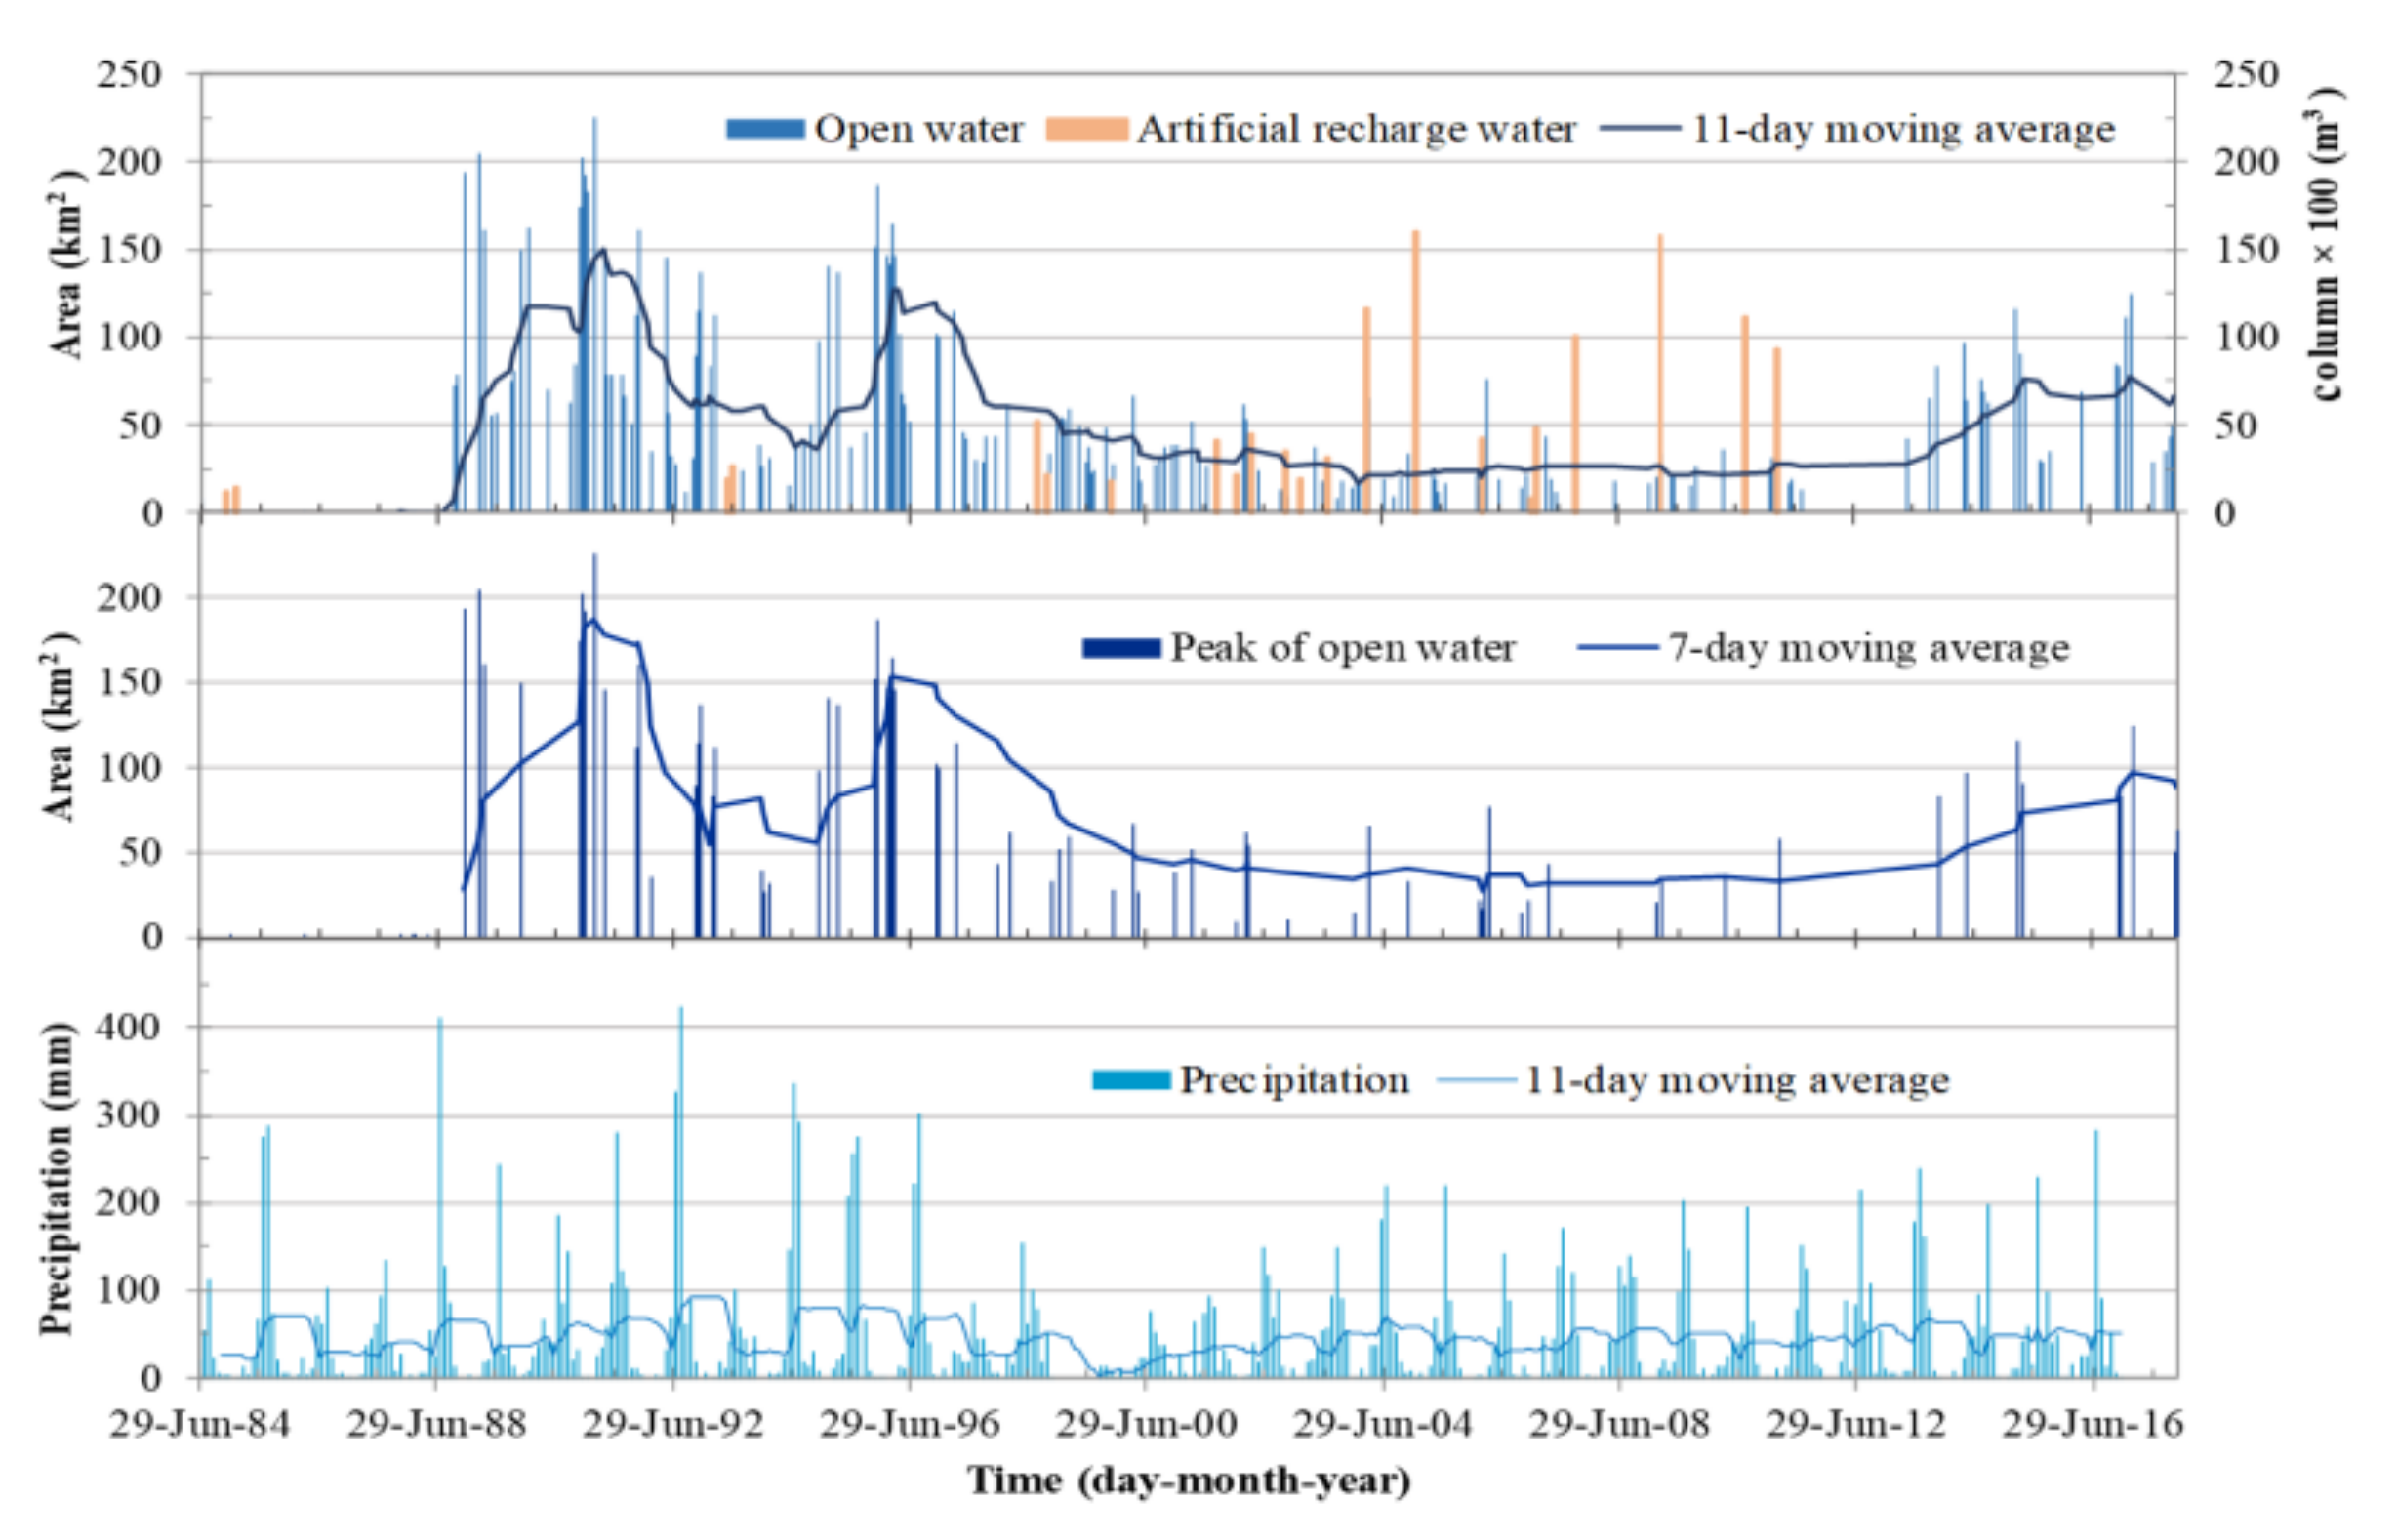
- The evidence of open water and aquatic vegetation in the wetland changing from 1984 to 2017 showed phasic changes in three phases: 1988–1998, 1999–2011 and 2013–2017, which are mostly caused by artificial activities. The artificial activities damaged the wetland by decreasing the water flowing into wetland due to massive water consumption in its upstream watersheds. On the other hand, the results demonstrated the artificial water recharge implemented by governmental wetland management has supported the basic demand of water in wetland.
- (2)
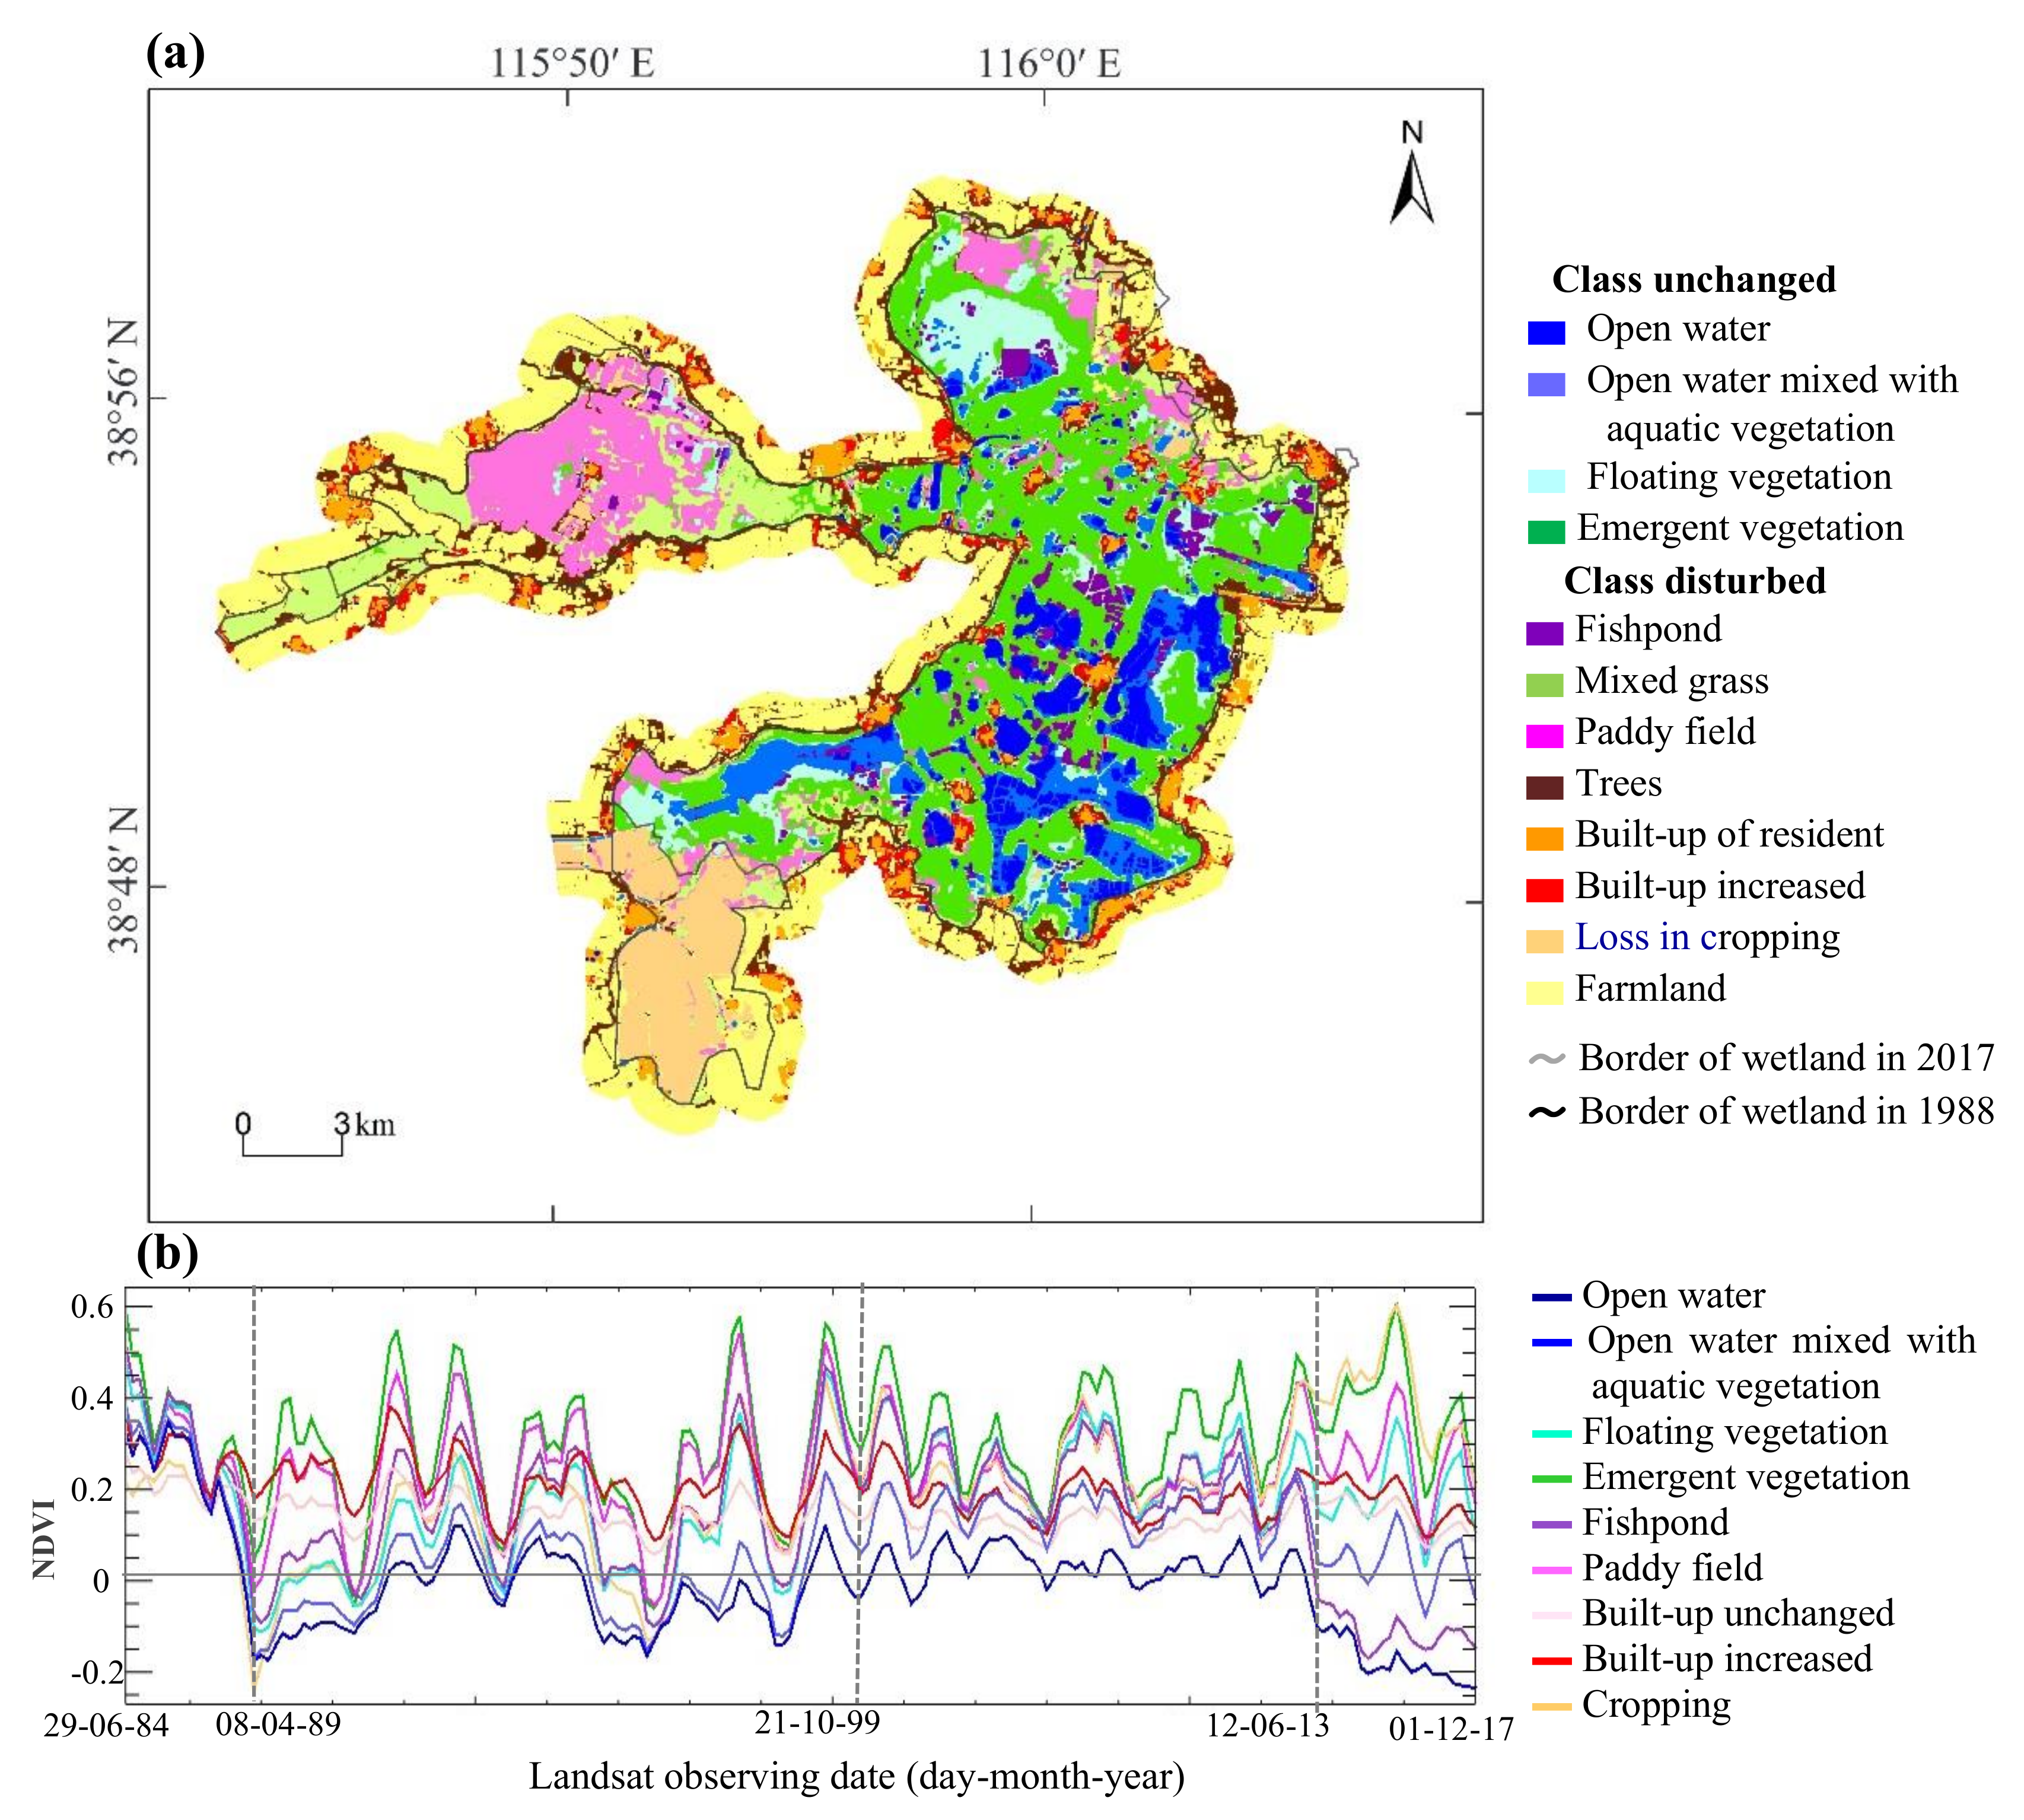
- The water body and aquatic vegetation only were remained 61% of the whole wetland currently while they accounted for 94% during the early years of 1989–1999. A total of 38% of wetland range is disturbed by artificial activities such as cultivating rice and lotus, fish farming, built-up, and leisure, currently. It has to be noticed that the northwestern wing of wetland and the areas around the northeastern edge of wetland are at the risk of wetland loss as farmers drain the water of wetlands to grow crops there frequently.
- (3)
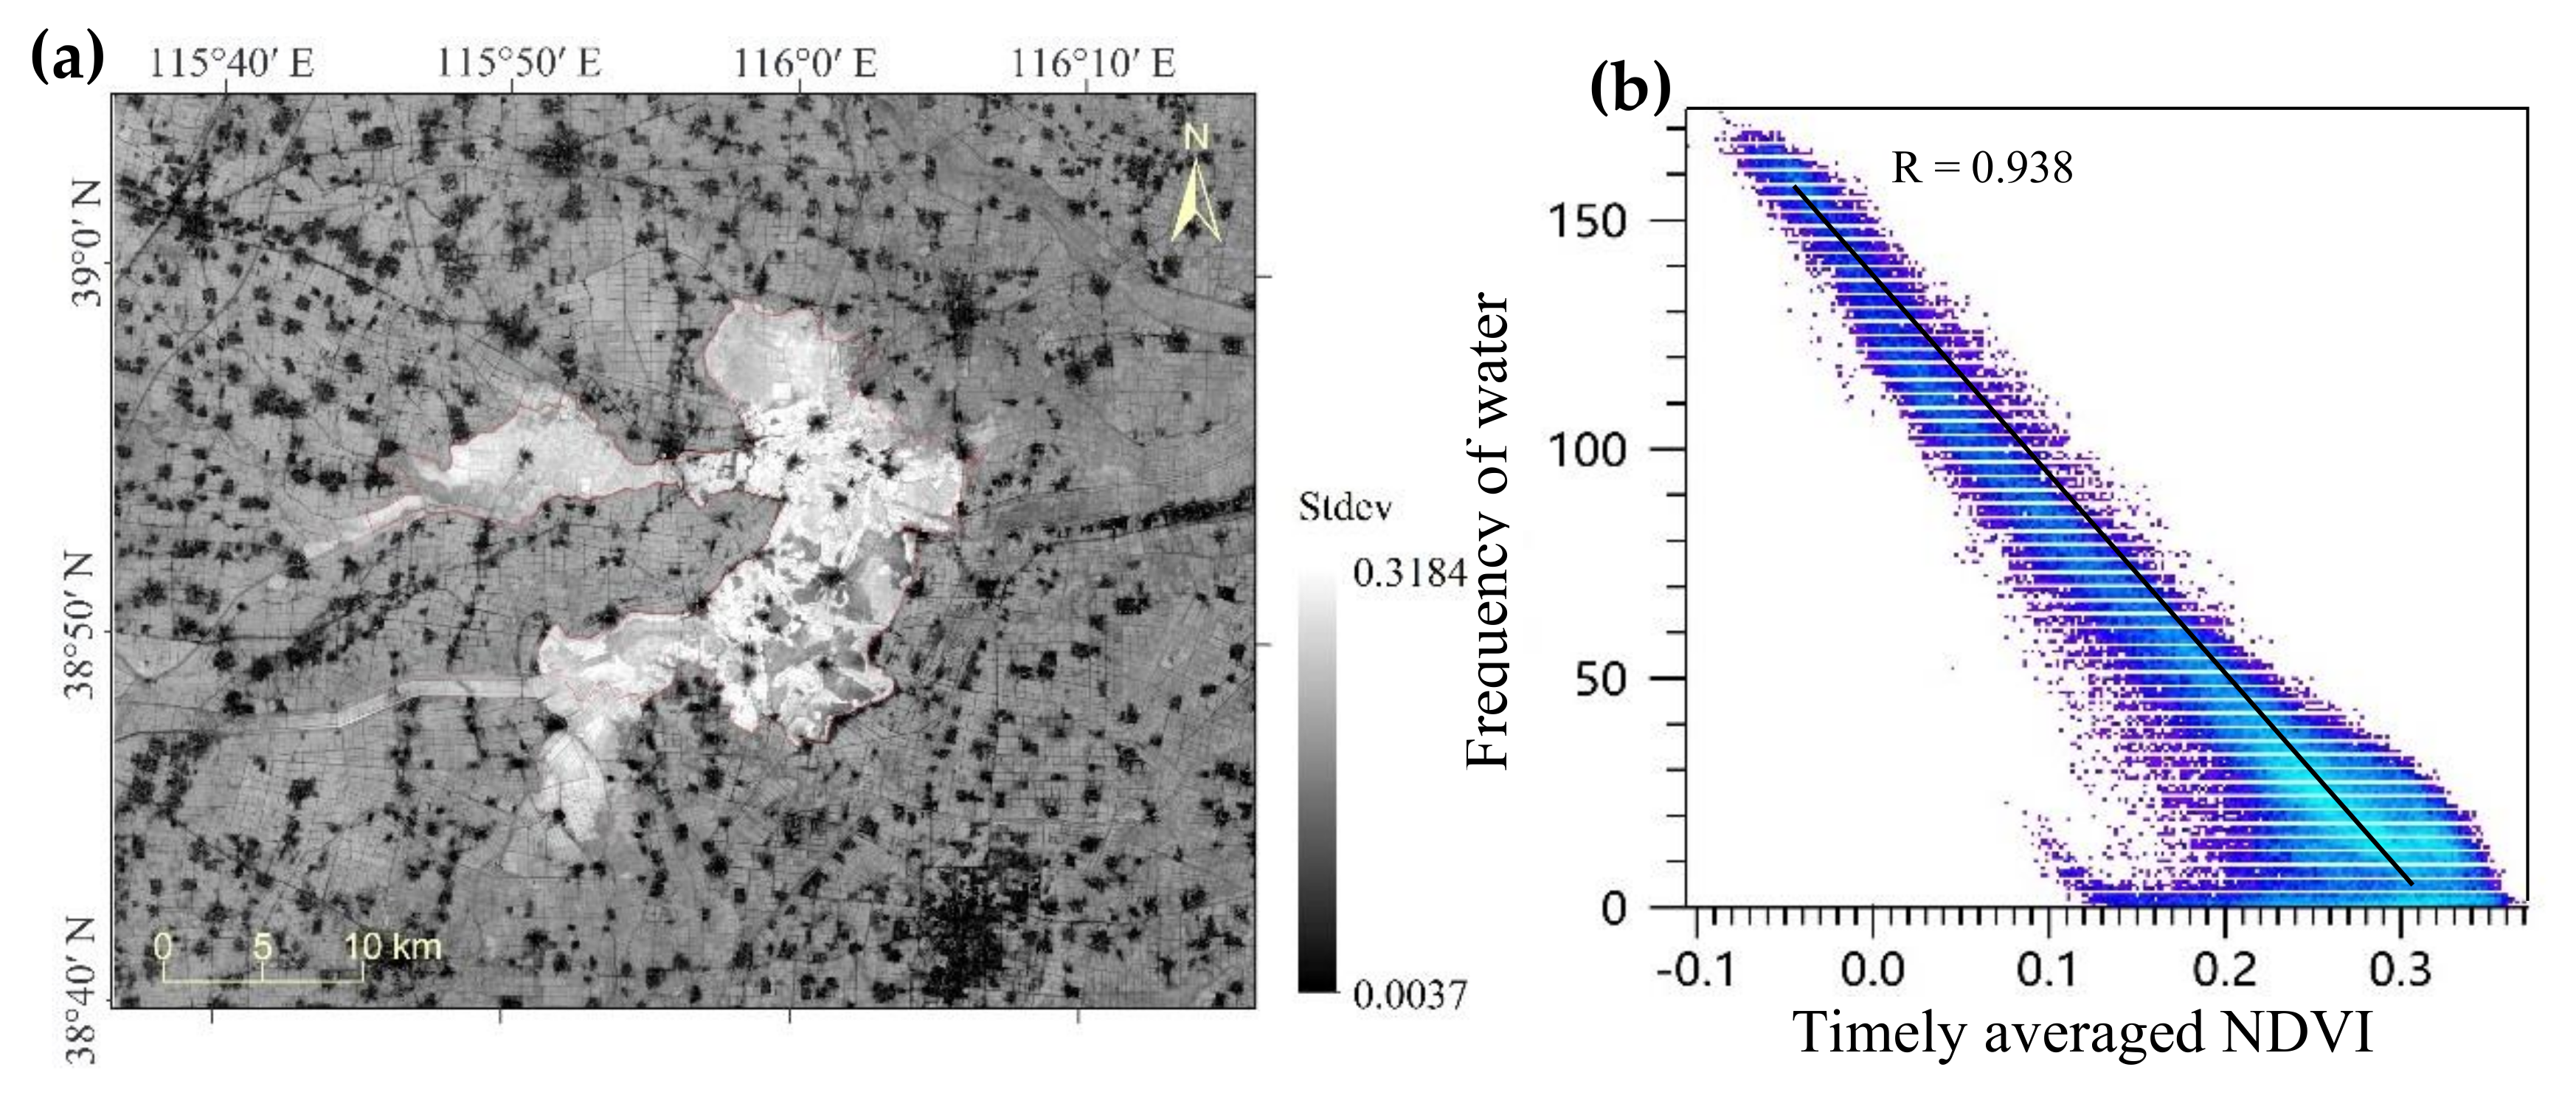
- The water environment in wetland habitats showed improved trend from the 2010s owing to the wetland restoration and protection project implemented by the government, which demonstrated the encouraging effects of environment management starting from the year 2010. The current landscape of wetland habitats, however, presents fragmented and patchy textures cut by lots of linear belts that are blocking the water cycles and ecological channels of aquatic plants and animals in the wetland compared to the landscape of wetland habitats in the first phase of 1989–1999. The landscape of wetland habitats during 1989–1999 mostly show us a natural spatial pattern with less human disturbances. This landscape may be what we should restore in the wetland environment reconstruction.
Author Contributions
Funding
Acknowledgments
Conflicts of Interest
References
- Mitsch, W.J.; Gosselink, J.G.; Anderson, C.J.; Zhang, L. Wetland Ecosystems; John Wiley: New York, NY, USA, 2009. [Google Scholar]
- Gallant, A.L. The Challenges of Remote Monitoring of Wetlands. Remote Sens. 2015, 7, 10938–10950. [Google Scholar] [CrossRef]
- Tiner, R.W.; Lang, M.W.; Klemas, V.V. Book Review—Remote Sensing of Wetlands Applications and Advances. Photogramm. Eng. Remote Sens. 2016, 82, 917–918. [Google Scholar]
- Ji, L.; Zhang, L.; Wylie, B.K. Analysis of Dynamic Thresholds for the Normalized Difference Water Index. Photogramm. Eng. Remote Sens. 2009, 75, 1307–1317. [Google Scholar] [CrossRef]
- Ludwig, C.; Walli, A.; Schleicher, C.; Weichselbaum, J.; Riffler, M. A highly automated algorithm for wetland detection using multi-temporal optical satellite data. Remote Sens. Environ. 2019, 224, 333–351. [Google Scholar] [CrossRef]
- Feyisa, G.L.; Meilby, H.; Fensholt, R.; Proud, S.R. Automated Water Extraction Index: A new technique for surface water mapping using Landsat imagery. Remote Sens. Environ. 2014, 140, 23–35. [Google Scholar] [CrossRef]
- Fisher, A.; Flood, N.; Danaher, T. Comparing Landsat water index methods for automated water classification in eastern Australia. Remote Sens. Environ. 2016, 175, 167–182. [Google Scholar] [CrossRef]
- Gong, P.; Niu, Z.G.; Cheng, X.; Zhao, K.Y.; Zhou, D.M.; Guo, J.H.; Liang, L.; Wang, X.F.; Li, D.D.; Huang, H.B.; et al. China’s Wetland Change (1990–2000) Determined by Remote Sensing. China Earth Sci. 2010, 53, 1036–1042. [Google Scholar] [CrossRef]
- Schaffer-Smith, D.; Swenson, J.J.; Barbaree, B.; Reiter, M.E. Three decades of Landsat-derived spring surface water dynamics in an agricultural wetland mosaic; Implications for migratory shorebirds. Remote Sens. Environ. 2017, 193, 180–192. [Google Scholar] [CrossRef] [PubMed]
- Fickas, K.C.; Cohen, W.B.; Yang, Z. Landsat-based monitoring of annual wetland change in the Willamette Valley of Oregon, USA from 1972 to 2012. Wetl. Ecol. Manag. 2015, 24, 73–92. [Google Scholar] [CrossRef]
- Wulder, M.A.; Li, Z.; Campbell, E.M.; Virtanen, J.-P.; Hobart, G.W.; Hermosilla, T.; Coops, N.C. A National Assessment of Wetland Status and Trends for Canada’s Forested Ecosystems Using 33 Years of Earth Observation Satellite Data. Remote Sens. 2018, 10, 1623. [Google Scholar] [CrossRef]
- Daniel, D.; Craig, D.; Monica, P. Mapping and Hydrologic Attribution of Temporary Wetlands Using Recurrent Landsat Imagery. Wetlands 2016, 36, 431–443. [Google Scholar]
- Niu, Z.; Gong, P.; Cheng, X.; Guo, J.; Wang, L.; Huang, H.; Shen, S.; Wu, Y.; Wang, X.; Wang, X.; et al. Geographical characteristics of China’s wetlands derived from remotely sensed data. Sci. China Ser. D Earth Sci. 2009, 52, 723–738. [Google Scholar] [CrossRef]
- Niu, Z.; Zhang, H.; Wang, X.; Yao, W.; Zhou, D.; Zhao, K.; Zhao, H.; Li, N.; Huang, H.; Li, C.; et al. Mapping wetland changes in China between 1978 and 2008. Chin. Sci. Bull. 2012, 57, 2813–2823. [Google Scholar] [CrossRef]
- Chen, L.; Jin, Z.; Michishita, R.; Cai, J.; Yue, T.; Chen, B.; Xu, B. Dynamic monitoring of wetland cover changes using time-series remote sensing imagery. Ecol. Inform. 2014, 24, 17–26. [Google Scholar] [CrossRef]
- Zhu, J.; Zhou, Y.; Wang, S.; Wang, L.T.; Liu, W.L.; Li, H.T.; Mei, J.J. Analysis of Changes of Baiyangdian Wetland from 1975 to 2018 Based on Remote Sensing. J. Remote Sens. 2019, 23, 1993–2002. [Google Scholar]
- Zhang, M.; Gong, Z.; Zhao, W.; Duo, A. Landscape pattern change and the driving forces in Baiyangdian wetland from 1984 to 2014. Acta Ecol. Sin. 2016, 36, 4780–4791. [Google Scholar] [CrossRef]
- Chen, X.; Wang, F.; Lu, J.; Li, H.; Zhu, J.; Lv, X. Simulation of the Effect of Artificial Water Transfer on Carbon Stock of Phragmites australis in the Baiyangdian Wetland, China. Science 2017, 2017, 1–11. [Google Scholar] [CrossRef]
- Li, F.; Xie, Y.; Yang, G.; Ren, B.; Hou, Z.-Y.; Qin, X.-Y. Preliminary survey on aquatic vegetations in Baiyangdian Lake. J. Appl. Ecol. 2008, 19, 1597–1603. [Google Scholar]
- Yang, C. Analysis on the Deposited Quantity Variation and its Influenced Factors in BaiyangDian. Groundwater 2010, 32, 110–112. [Google Scholar]
- Li, C.M.; Ye, X.Q.; Wu, M.; Shao, X.X. Effects of Water Depth and Coexistence on Growth Characteristics of Phragmites australis and Typha domingensis. Wetl. Sci. 2015, 13, 609–615. [Google Scholar]
- Yang, W.; Yang, Z.; Qin, Y. An optimization approach for sustainable release of e-flows for lake restoration and preservation: Model development and a case study of Baiyangdian Lake, China. Ecol. Model. 2011, 222, 2448–2455. [Google Scholar] [CrossRef]
- Zhou, Y.; Yan, G. Diversion Recharge to Maintain the Ecological Effect of Baiyangdian Lake. Water Sci. Eng. Technol. 2012, 6, 29–32. [Google Scholar]


| Class | Area (km2) (Percent in 1989 Wetland) | Area (km2) (Percent in 2017 Wetland) | NDVI in Growing Season (10 July 2017) | Frequency of Open Water for 2017 Classes |
|---|---|---|---|---|
| Open water | 37.04 (12%) | 20.88 (8%) | −0.19 | 137 |
| Open water mixed with aquatic vegetation | 30.75 (31%) | 24.98 (10%) | 0.29 | 94 |
| Floating vegetation | 28.14 (9%) | 26.46 (10%) | 0.55 | 54 |
| Emergent vegetation | 156.40 (52%) | 84.82 (33%) | 0.71 | 30 |
| Fishpond | None | 11.58 (5%) | −0.03 | 63 |
| Mixed grass | 3.02 (1%) | 27.98 (11%) | 0.64 | 15 |
| Paddy field | 17.38 (6%) | 34.10 (13%) | 0.66 | 23 |
| Trees | 14.22 (5%) | 10.40 (4%) | 0.59 | 4 |
| Built-up of resident | 5.54 (2%) | 3.26 (1%) | 0.18 | 8 |
| Built-up increased | None | 4.50 (2%) | 0.25 | 21 |
| Loss in cropping | None | 7.64 (3%) | 0.59 | 39 |
| Farmland | 7.53 (3%) | 1.83 (1%) | 0.54 | 3 |
| Total area (km2) | 300.02 | 258.43 |
| Time of 3 Phases | Open Water | NDVI | Annual Mean Precipitation (mm) | ||
|---|---|---|---|---|---|
| Extent (km2) | Density (%) | Mean | Stdev | ||
| 1st phase 1988–1998 | 83 | 26 | 0.168 | 0.145 | 678 |
| 2nd phase 1999–2011 | 29 | 13 | 0.238 | 0.128 | 477 |
| 3rd phase 2013–2017 | 68 | 30 | 0.218 | 0.225 | 613 |
© 2020 by the authors. Licensee MDPI, Basel, Switzerland. This article is an open access article distributed under the terms and conditions of the Creative Commons Attribution (CC BY) license (http://creativecommons.org/licenses/by/4.0/).
Share and Cite
Zhang, Z.; Lei, L.; He, Z.; Su, Y.; Li, L.; Wang, X.; Guo, X. Tracking Changing Evidences of Water in Wetland Using the Satellite Long-Term Observations from 1984 to 2017. Water 2020, 12, 1602. https://doi.org/10.3390/w12061602
Zhang Z, Lei L, He Z, Su Y, Li L, Wang X, Guo X. Tracking Changing Evidences of Water in Wetland Using the Satellite Long-Term Observations from 1984 to 2017. Water. 2020; 12(6):1602. https://doi.org/10.3390/w12061602
Chicago/Turabian StyleZhang, Zhijie, Liping Lei, Zhonghua He, Yali Su, Liwei Li, Xiaofan Wang, and Xudong Guo. 2020. "Tracking Changing Evidences of Water in Wetland Using the Satellite Long-Term Observations from 1984 to 2017" Water 12, no. 6: 1602. https://doi.org/10.3390/w12061602
APA StyleZhang, Z., Lei, L., He, Z., Su, Y., Li, L., Wang, X., & Guo, X. (2020). Tracking Changing Evidences of Water in Wetland Using the Satellite Long-Term Observations from 1984 to 2017. Water, 12(6), 1602. https://doi.org/10.3390/w12061602


