Development of a Universal Water Quality Index (UWQI) for South African River Catchments


Abstract
1. Introduction
2. Methods
2.1. Research Data
2.2. Universal Water Quality Index (UWQI)
2.2.1. Selection of Water Quality Variables
2.2.2. Establishing Weight Coefficients
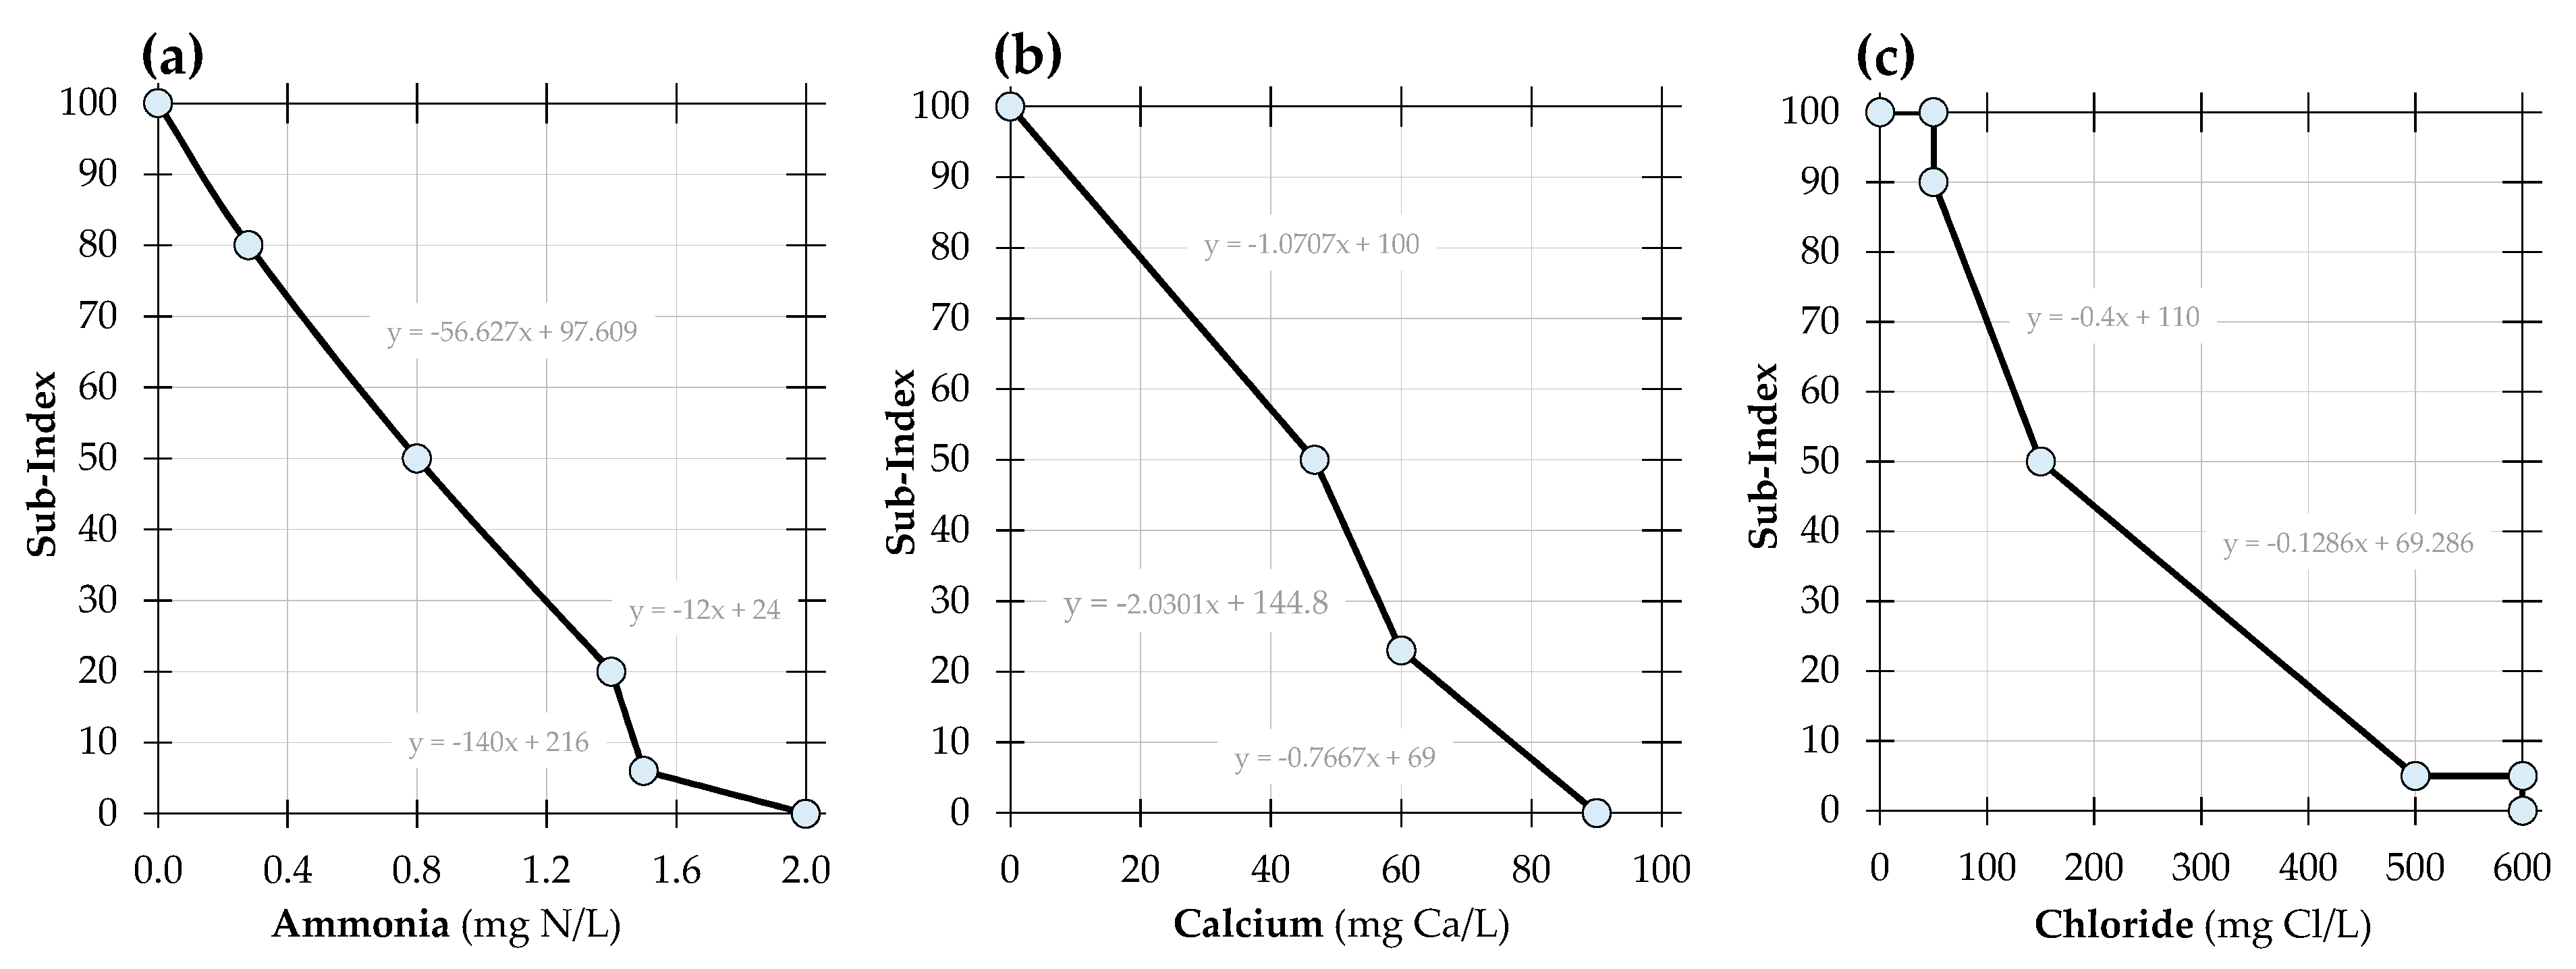
2.2.3. Formation of Sub-Indices
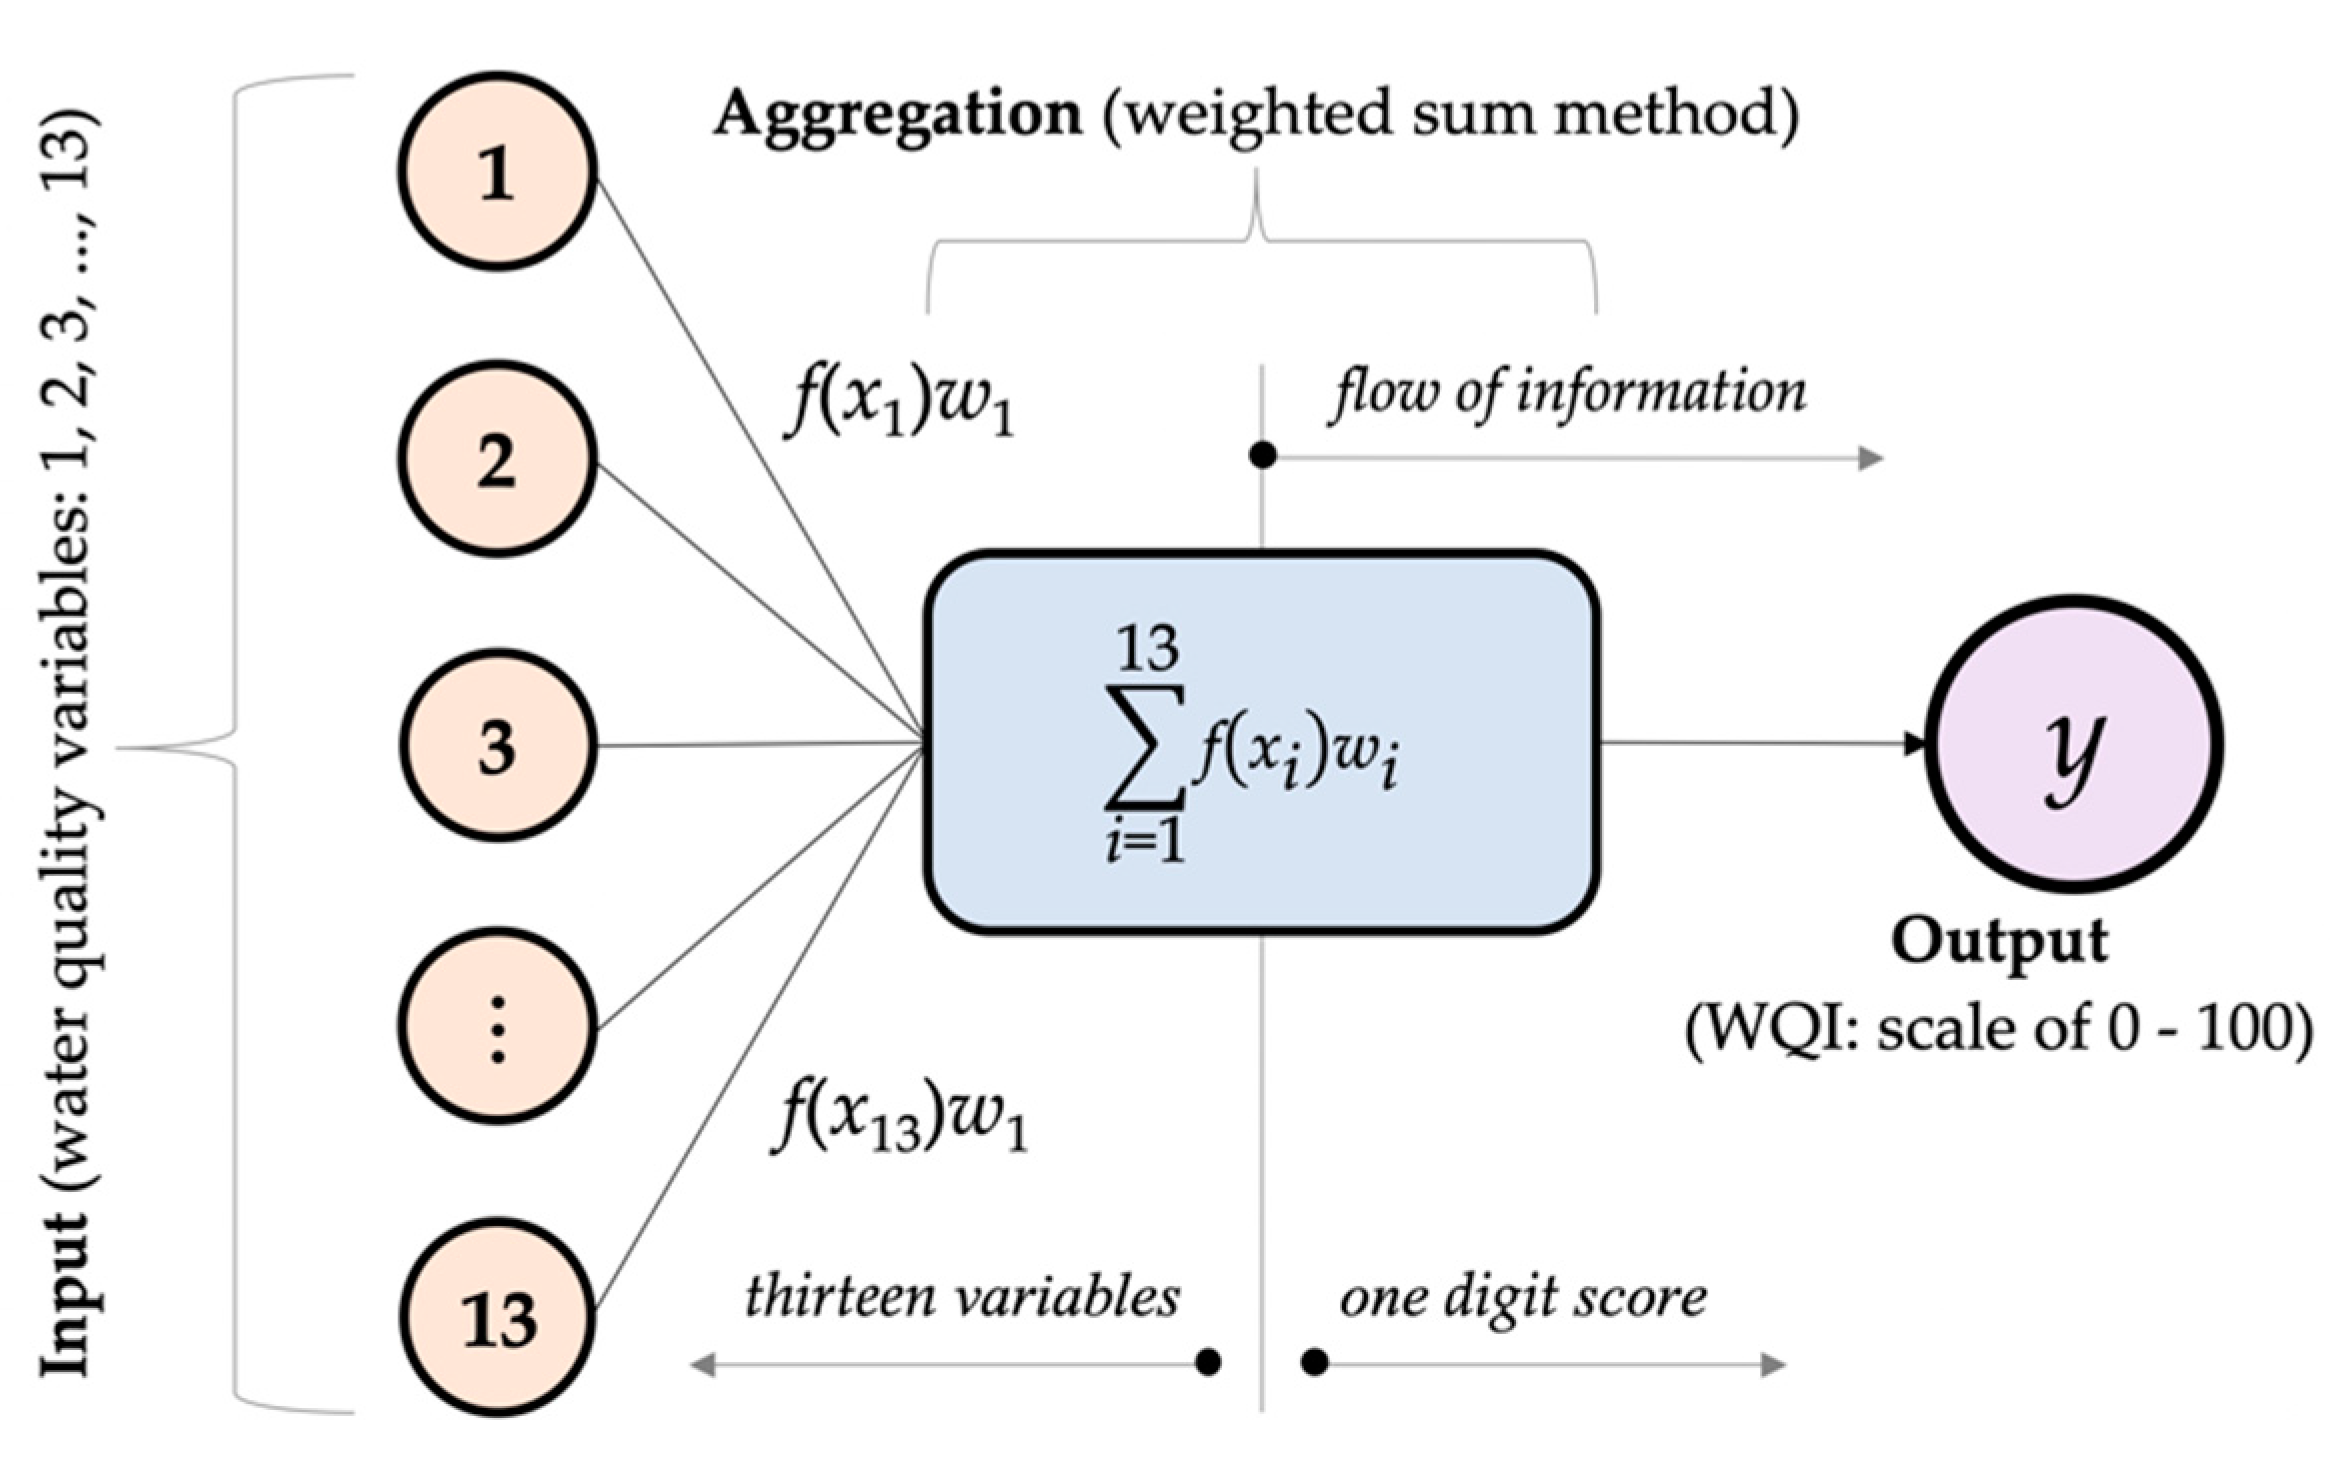
2.2.4. Aggregation Formula
WQI2 = (1/x2)(SI21w1 + SI22w2 + SI23w3 + … + SI2nwn)z2
…
WQIm = (1/xm)(SIm1w1 + SIm2w2 + SIm3w3 + … + SImnwn)zm
2.3. Water Classification
3. Area of Study
3.1. Background and Specific Considerations
3.2. Umgeni River Catchment
3.3. Umdloti River Catchment
3.4. Nungwane River Catchment
3.5. Umzinto/uMuziwezinto River Catchment
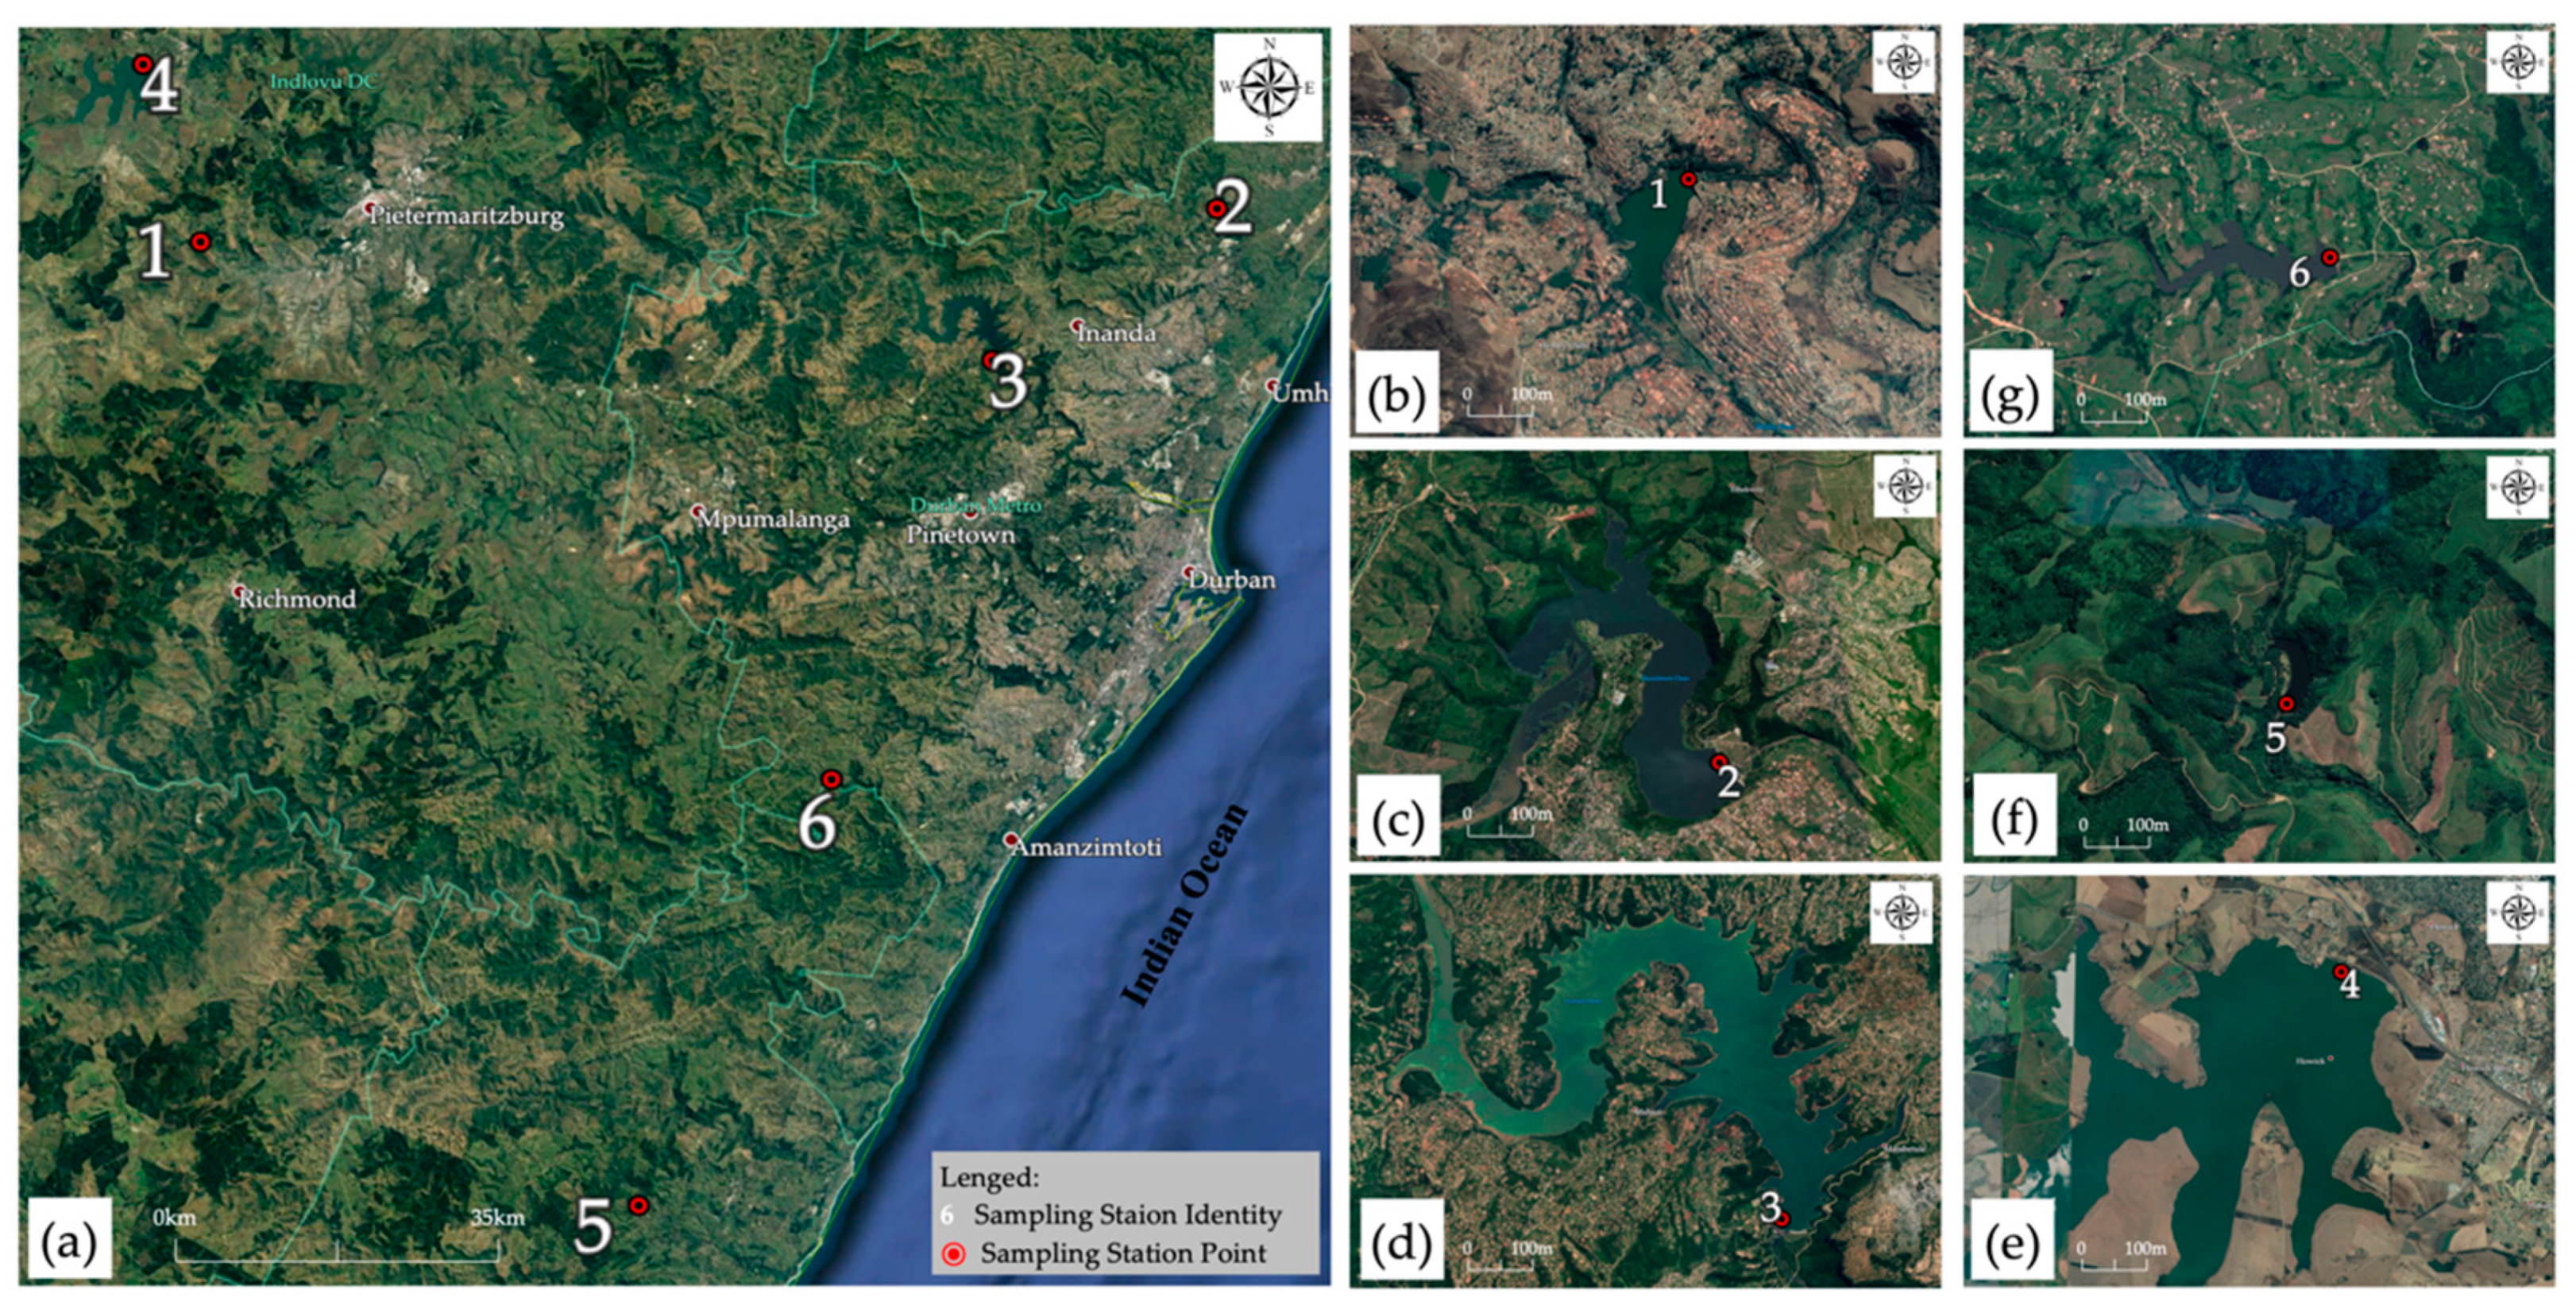
3.6. Sampling Locations
4. Results and Discussion
4.1. Research Dataset
4.2. Water Quality Variables and their Relative Weightage Coefficients
4.3. Formation of Parameter Sub-Index Rating Curves and Sub-Index Functions
4.4. Weighted Indexing Model (UWQI)
4.5. Scenario-Based Model Validation Analysis
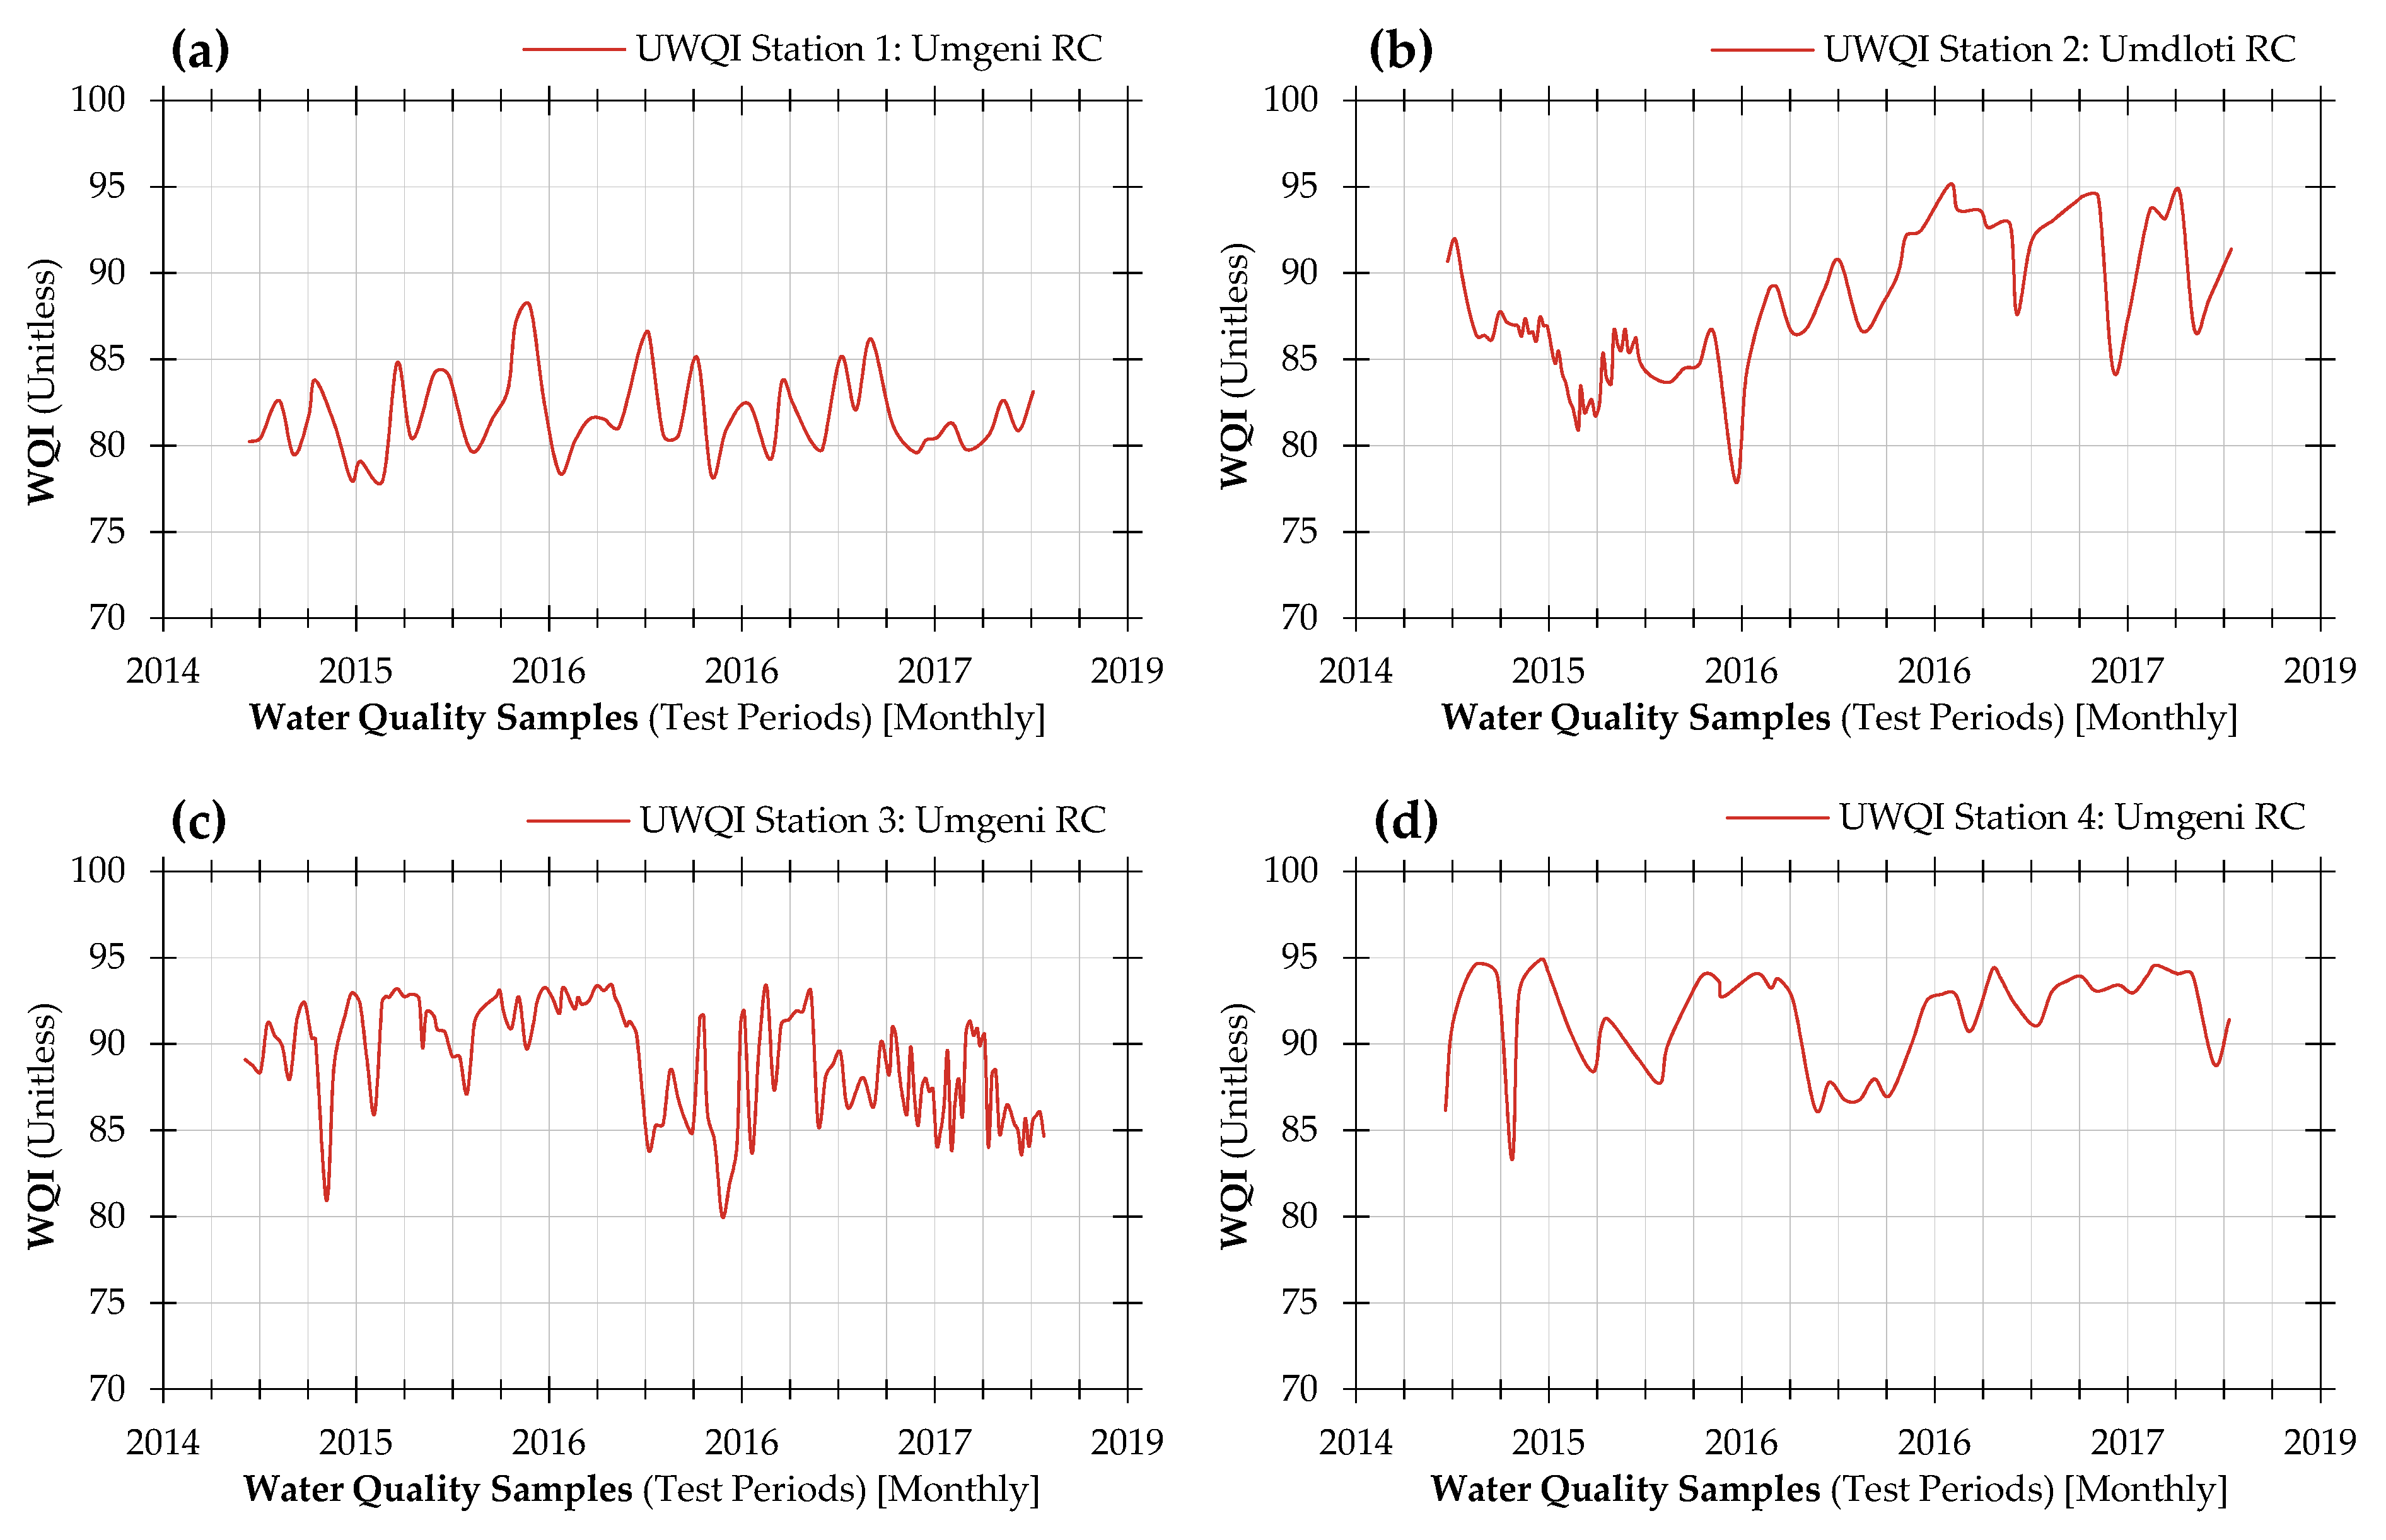
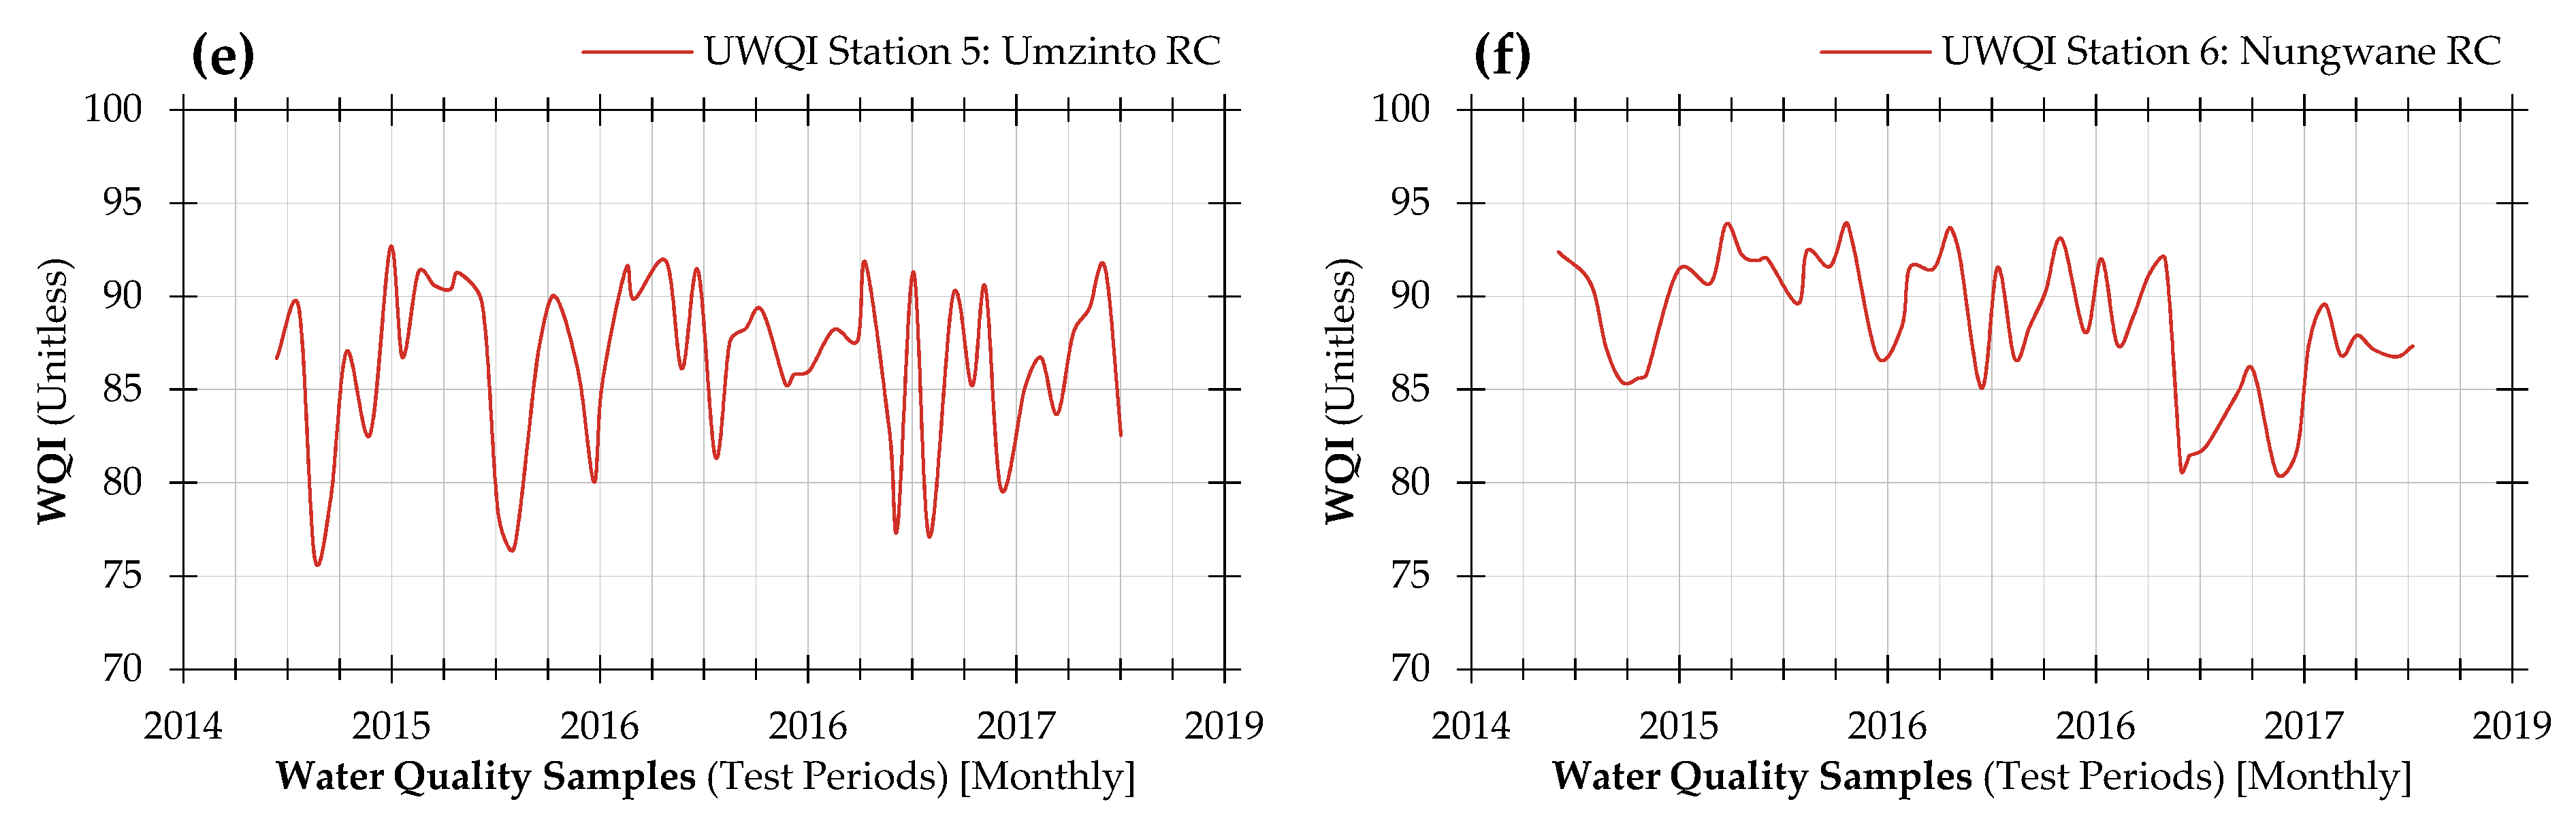
4.6. Evaluation of Water Quality
4.7. Index Categorisation Schema
5. Conclusion and Future Directions
Author Contributions
Funding
Acknowledgments
Conflicts of Interest
References
- Tripathi, M.; Singal, S.K. Use of Principal Component Analysis for parameter selection for development of a novel Water Quality Index: A case study of river Ganga India. Ecol. Indic. 2019, 96, 430–436. [Google Scholar] [CrossRef]
- Paca, J.M.; Santos, F.M.; Pires, J.C.M.; Leitão, A.A.; Boaventura, R.A.R. Quality assessment of water intended for human consumption from Kwanza, Dande and Bengo rivers (Angola). Environ. Pollut. 2019, 254, 113037–113044. [Google Scholar] [CrossRef]
- Banda, D.T. Developing an Equitable Raw Water Pricing Model: The Vaal Case Study. Ph.D. Thesis, Tshwane University of Technology, Pretoria, Republic of South Africa, 2015. [Google Scholar]
- Carvalho, L.; Cortes, R.; Bordalo, A.A. Evaluation of the ecological status of an impaired watershed by using a multi-index approach. Environ. Monit. Assess. 2011, 174, 493–508. [Google Scholar] [CrossRef] [PubMed]
- Boyacioğlu, H. Development of a water quality index based on a European classification scheme. Water Sa 2007, 33. [Google Scholar] [CrossRef]
- Unda-Calvo, J.; Ruiz-Romera, E.; Martínez-Santos, M.; Vidal, M.; Antigüedad, I. Multivariate statistical analyses for water and sediment quality index development: A study of susceptibility in an urban river. Sci. Total Environ. 2019, 711, 135026. [Google Scholar] [CrossRef] [PubMed]
- Banda, D.T.; Kumarasamy, M.V. Development of Water Quality Indices (WQIs): A Review. Pol. J. Environ. Stud. 2020, 29, 2011–2021. [Google Scholar] [CrossRef]
- Poonam, T.; Tanushree, B.; Sukalyan, C. Water quality indices - important tools for water quality assessment: A review. Int. J. Adv. Chem. 2015, 1, 15–28. [Google Scholar]
- Sutadian, A.D.; Muttil, N.; Yilmaz, A.G.; Perera, B. Development of river water quality indices-A review. Environ. Monit. Assess. 2016, 188, 58–90. [Google Scholar] [CrossRef]
- Paun, I.; Cruceru, L.V.; Chiriac, L.F.; Niculescu, M.; Vasile, G.G.; Marin, N.M. Water Quality Indices-methods for evaluating the quality of drinking water. In Proceedings of the 19th INCD ECOIND International Symposium-SIMI 2016, “The Environment and the Industry”, Bucharest, Romania, 13–14 October 2016; pp. 395–402. [Google Scholar]
- Tyagi, S.; Sharma, B.; Singh, P.; Dobhal, R. Water quality assessment in terms of water quality index. Am. J. Water Resour. 2013, 1, 34–38. [Google Scholar] [CrossRef]
- Abbasi, T.; Abbasi, S.A. Water Quality Indices. 2012, p. 353. Available online: https://doi.org/10.1016/C2010-0-69472-7 (accessed on 14 October 2015).
- Namugize, J.N.; Jewitt, G.; Graham, M. Effects of land use and land cover changes on water quality in the uMngeni river catchment, South Africa. Phys. Chem. Earthparts A/B/C 2018, 105, 247–264. [Google Scholar] [CrossRef]
- Hughes, C.; de Winnaar, G.; Schulze, R.; Mander, M.; Jewitt, G. Mapping of water-related ecosystem services in the uMngeni catchment using a daily time-step hydrological model for prioritisation of ecological infrastructure investment–Part 1: Context and modelling approach. Water Sa 2018, 44, 577–589. [Google Scholar] [CrossRef]
- Shoko, C. The Effect of Spatial Resolution in Remote Sensing Estimates of Total Evaporation in the uMgeni Catchment. Ph.D. Thesis, University of KwaZulu-Natal, Pietermaritzburg, Republic of South Africa, 2014. [Google Scholar]
- Umgeni Water. Infrastructure Master Plan 2019/2020-2049/2050, Volume 2: Mgeni System; Umgeni Water: Pietermaritzburg, South Africa, 2019; p. 185. [Google Scholar]
- Umgeni Water. Infrastructure Master Plan 2019/2020-2049/2050, Volume 3: uMkhomazi System; Umgeni Water: Pietermaritzburg, South Africa, 2019; p. 35. [Google Scholar]
- Republic of South Africa. Proposed new nine (9) water management areas of South Africa. In Government Gazette No. 35517, Notice No. 547; Department of Water and Environmental Affairs, Ed.; Republic of South Africa: Pretoria, South Africa, 2012; Volume 565, p. 72. [Google Scholar]
- Chiluwe, Q.W. Assessing the Role of Property Rights in Managing Water Demand: The Case of uMgeni River Catchment. Ph.D. Thesis, Monash South Africa, Johannesburg, Republic of South Africa, 2014. [Google Scholar]
- Sutadian, A.D.; Muttil, N.; Yilmaz, A.G.; Perera, B.J.C. Development of a water quality index for rivers in West Java Province, Indonesia. Ecol. Indic. 2018, 85, 966–982. [Google Scholar] [CrossRef]
- Horton, R.K. An Index-Number System for Rating Water Quality. J. Water Pollut. Control Fed. 1965, 37, 300–306. [Google Scholar]
- Brown, R.M.; McClelland, N.I.; Deininger, R.A.; Tozer, R.G. A water quality index-Do we dare? Water Sew. Work. 1970, 117, 339–343. [Google Scholar]
- Brown, R.; McClelland, N.; Deininger, R.; Landwehr, J. Validating the WQI. In Proceedings of the Paper Presented at National Meeting of American Society of Civil Engineers on Water Resources Engineering, Washington, DC, USA, 30 January 1973. [Google Scholar]
- SRDD. Development of a water quality index. In Applied Research & Development Report Number ARD3; Scottish Research Development Department Engineering Division, Ed.; Scottish Research Development Department Engineering Division: Edinburg, UK, 1976; Volume ARD3, p. 61. [Google Scholar]
- Ross, S. An index system for classifying river water quality. Water Pollut. Control 1977, 76, 113–122. [Google Scholar]
- House, M.A. Water Quality Indices; Middlesex Polytechnic: London, UK, 1986. [Google Scholar]
- House, M.A. A water quality index for river management. Water Environ. J. 1989, 3, 336–344. [Google Scholar] [CrossRef]
- House, M.A. Water quality indices as indicators of ecosystem change. Environ. Monit. Assess. 1990, 15, 255–263. [Google Scholar] [CrossRef] [PubMed]
- Dinius, S. Design of an index of water quality. Jawra J. Am. Water Resour. Assoc. 1987, 23, 833–843. [Google Scholar] [CrossRef]
- Smith, D.G. Water Quality Indexes for Use in New Zealand’s Rivers and Streams; National Water and Soil Conservation Authority of New Zealand, Water Quality Centre Publication: Hamilton, New Zealand, 1987; Available online: http://docs.niwa.co.nz/library/public/WQCpub12.pdf (accessed on 16 October 2015).
- Smith, D.G. A better water quality indexing system for rivers and streams. Water Res. 1990, 24, 1237–1244. [Google Scholar] [CrossRef]
- Tyson, J.; House, M. The application of a water quality index to river management. Water Sci. Technol. 1989, 21, 1149–1159. [Google Scholar] [CrossRef]
- Nagels, J.; Davies-Colley, R.; Smith, D. A water quality index for contact recreation in New Zealand. Water Sci. Technol. 2001, 43, 285–292. [Google Scholar] [CrossRef]
- Kumar, D.; Alappat, B.J. NSF-Water Quality Index: Does It Represent the Experts’ Opinion? Pract. Period. Hazard. Toxicand Radioact. Waste Manag. 2009, 13, 75–79. [Google Scholar] [CrossRef]
- Almeida, C.; González, S.O.; Mallea, M.; González, P. A recreational water quality index using chemical, physical and microbiological parameters. Environ. Sci. Pollut. Res. 2012, 19, 3400–3411. [Google Scholar] [CrossRef] [PubMed]
- Linstone, H.A.; Turoff, M. The Delphi Method: Techniques and Applications; Addison-Wesley: Reading, MA, USA, 1975; Volume 29. [Google Scholar]
- Linstone, H.A.; Turoff, M. The Delphi Method: Techniques and Applications; Addison-Wesley Publishing Company, Advanced Book Program: Newark, NJ, USA, 2002; Volume 18. [Google Scholar]
- Sharma, P.; Meher, P.K.; Kumar, A.; Gautam, Y.P.; Mishra, K.P. Changes in water quality index of Ganges river at different locations in Allahabad. Sustain. Water Qual. Ecol. 2014, 3, 67–76. [Google Scholar] [CrossRef]
- DWAF. South African Water Quality Guidelines: Volume 1: Domestic Water Use; Department of Water Affairs and Forestry: Pretoria, South Africa, 1996; p. 190. [Google Scholar]
- DWAF. South African Water Quality Guidelines: Volume 3: Industrial Use; Department of Water Affairs and Forestry: Pretoria, South Africa, 1996. [Google Scholar]
- DWAF. South African Water Quality Guidelines: Volume 7: Aquatic Ecosystems; Department of Water Affairs and Forestry: Pretoria, South Africa, 1996. [Google Scholar]
- Wang, P.; Mou, S.; Lian, J.; Ren, W. Solving a system of linear equations: From centralized to distributed algorithms. Annu. Rev. Control 2019, 47, 306–322. [Google Scholar] [CrossRef]
- Low, K.H.; Koki, I.B.; Juahir, H.; Azid, A.; Behkami, S.; Ikram, R.; Mohammed, H.A.; Zain, S.M. Evaluation of water quality variation in lakes, rivers, and ex-mining ponds in Malaysia (review). Desalin. Water Treat. 2016, 57, 28215–28239. [Google Scholar] [CrossRef]
- Nozaic, D.; Freese, S.; Thompson, P. Longterm experience in the use of polymeric coagulants at Umgeni Water. Water Sci. Technol. Water Supply 2001, 1, 43–50. [Google Scholar] [CrossRef]
- Manickum, T.; John, W.; Terry, S.; Hodgson, K. Preliminary study on the radiological and physicochemical quality of the Umgeni Water catchments and drinking water sources in KwaZulu-Natal, South Africa. J. Environ. Radioact. 2014, 137, 227–240. [Google Scholar] [CrossRef]
- Warburton, M.L.; Schulze, R.E.; Jewitt, G.P.W. Hydrological impacts of land use change in three diverse South African catchments. J. Hydrol. 2012, 414–415, 118–135. [Google Scholar] [CrossRef]
- Rangeti, I. Determinants of Key Drivers for Potable Water Treatment cost in uMngeni Basin. Ph.D. Thesis, Durban University of Technology, Durban, Republic of South Africa, 2015. [Google Scholar]
- Olaniran, A.O.; Naicker, K.; Pillay, B. Assessment of physico-chemical qualities and heavy metal concentrations of Umgeni and Umdloti Rivers in Durban, South Africa. Environ. Monit. Assess. 2014, 186, 2629–2639. [Google Scholar] [CrossRef]
- Gakuba, E.; Moodley, B.; Ndungu, P.; Birungi, G. Occurrence and significance of polychlorinated biphenyls in water, sediment pore water and surface sediments of Umgeni River, KwaZulu-Natal, South Africa. Environ. Monit. Assess. 2015, 187, 568. [Google Scholar] [CrossRef] [PubMed]
- Namugize, J.N.; Jewitt, G.P.W. Sensitivity analysis for water quality monitoring frequency in the application of a water quality index for the uMngeni River and its tributaries, KwaZulu-Natal, South Africa. Water Sa 2018, 44, 516–527. [Google Scholar] [CrossRef]
- Umgeni Water. Infrastructure Master Plan 2019/2020 - 2049/2050, Volume 5: North Coast System; Umgeni Water: Pietermaritzburg, South Africa, 2019; p. 116. [Google Scholar]
- Govender, S. An Investigation of the Natural and Human Induced Impacts on the Umdloti Catchment. Ph.D. Thesis, University of KwaZulu, Durban, South Africa, 2009. [Google Scholar]
- Umgeni Water. Infrastructure Master Plan 2019/2020-2049/2050, Volume 4: South Coast System; Umgeni Water: Pietermaritzburg, South Africa, 2019; p. 116. [Google Scholar]
- Mwelase, L.T. Non-Revenue Water: Most Suitable Business Model for Water Services Authorities in South Africa: Ugu District Municipality. Ph.D. Thesis, Durban University of Technology, Durban, Republic of South Africa, 2016. [Google Scholar]
- Pegram, G.; Görgens, A. A Guide to Non-Point Source Assessment: To Support Water Quality Management of Surface Water Resources in South Africa (WRC Project No. 696/2/01); Water Research Commission: Cape Town, Republic of South Africa, 2001; p. 127. [Google Scholar]
- Ochieng, G.M. Hydrological and water quality modelling of the Upper Vaal water management areas using a stochastic mechanistic approach. Ph.D. Thesis, Tshwane University of Technology, Pretoria, South Africa, 2007. [Google Scholar]
- Bogart, S.J.; Woodman, S.; Steinkey, D.; Meays, C.; Pyle, G.G. Rapid changes in water hardness and alkalinity: Calcite formation is lethal to Daphnia magna. Sci. Total Environ. 2016, 559, 182–191. [Google Scholar] [CrossRef]
- Beyene, G.; Aberra, D.; Fufa, F. Evaluation of the suitability of groundwater for drinking and irrigation purposes in Jimma Zone of Oromia, Ethiopia. Groundw. Sustain. Dev. 2019, 9, 100216. [Google Scholar] [CrossRef]
- Fan, A.M. Nitrate and Nitrite in Drinking Water: A Toxicological Review. Encycl. Environ. Health 2011, 137–145. [Google Scholar] [CrossRef]
- Serio, F.; Miglietta, P.P.; Lamastra, L.; Ficocelli, S.; Intini, F.; De Leo, F.; De Donno, A. Groundwater nitrate contamination and agricultural land use: A grey water footprint perspective in Southern Apulia Region (Italy). Sci. Total Environ. 2018, 645, 1425–1431. [Google Scholar] [CrossRef] [PubMed]
- Espejo-Herrera, N.; Cantor, K.P.; Malats, N.; Silverman, D.T.; Tardón, A.; García-Closas, R.; Serra, C.; Kogevinas, M.; Villanueva, C.M. Nitrate in drinking water and bladder cancer risk in Spain. Environ. Res. 2015, 137, 299–307. [Google Scholar] [CrossRef]
- Sadler, R.; Maetam, B.; Edokpolo, B.; Connell, D.; Yu, J.; Stewart, D.; Park, M.J.; Gray, D.; Laksono, B. Health risk assessment for exposure to nitrate in drinking water from village wells in Semarang, Indonesia. Environ. Pollut. 2016, 216, 738–745. [Google Scholar] [CrossRef]
- Shah, K.A.; Joshi, G.S. Evaluation of water quality index for River Sabarmati, Gujarat, India. Appl. Water Sci. 2017, 7, 1349–1358. [Google Scholar] [CrossRef]
- Robert, E.; Grippa, M.; Kergoat, L.; Pinet, S.; Gal, L.; Cochonneau, G.; Martinez, J.-M. Monitoring water turbidity and surface suspended sediment concentration of the Bagre Reservoir (Burkina Faso) using MODIS and field reflectance data. Int. J. Appl. Earth Obs. Geoinf. 2016, 52, 243–251. [Google Scholar] [CrossRef]
- Uncles, R.J.; Hooper, T.; Stephens, J.A.; Harris, C. Seasonal variability of turbidity, salinity, temperature and suspended chlorophyll in a strongly tidal sub-estuary: The Lynher Marine Conservation Zone. Estuar. Coast. Shelf Sci. 2018, 212, 253–264. [Google Scholar] [CrossRef]
- Andrade, C.; Alcântara, E.; Bernardo, N.; Kampel, M. An assessment of semi-analytical models based on the absorption coefficient in retrieving the chlorophyll-a concentration from a reservoir. Adv. Space Res. 2019, 63, 2175–2188. [Google Scholar] [CrossRef]
- Hashim, K.S.; Al Khaddar, R.; Jasim, N.; Shaw, A.; Phipps, D.; Kot, P.; Pedrola, M.O.; Alattabi, A.W.; Abdulredha, M.; Alawsh, R. Electrocoagulation as a green technology for phosphate removal from river water. Sep. Purif. Technol. 2019, 210, 135–144. [Google Scholar] [CrossRef]
- Omwene, P.I.; Kobya, M.; Can, O.T. Phosphorus removal from domestic wastewater in electrocoagulation reactor using aluminium and iron plate hybrid anodes. Ecol. Eng. 2018, 123, 65–73. [Google Scholar] [CrossRef]
- Rankinen, K.; Cano Bernal, J.E.; Holmberg, M.; Vuorio, K.; Granlund, K. Identifying multiple stressors that influence eutrophication in a Finnish agricultural river. Sci. Total Environ. 2019, 658, 1278–1292. [Google Scholar] [CrossRef]
- Abrahão, R.; Carvalho, M.; da Silva, W., Jr.; Machado, T.; Gadelha, C.; Hernandez, M. Use of index analysis to evaluate the water quality of a stream receiving industrial effluents. Water Sa 2007, 33. [Google Scholar] [CrossRef]
- Rabee, A.M.; Al-Fatlawy, Y.F.; Nameer, M. Using pollution load index (PLI) and geoaccumulation index (I-Geo) for the assessment of heavy metals pollution in Tigris river sediment in Baghdad Region. Al-Nahrain J. Sci. 2011, 14, 108–114. [Google Scholar] [CrossRef]
- Rubio-Arias, H.; Contreras-Caraveo, M.; Quintana, R.M.; Saucedo-Teran, R.A.; Pinales-Munguia, A. An overall water quality index (WQI) for a man-made aquatic reservoir in Mexico. Int. J. Environ. Res. Public Health 2012, 9, 1687–1698. [Google Scholar] [CrossRef]


| Sampling Station Identity | Identity Codes | Sampling Location Coordinates (DMS)* | |||
|---|---|---|---|---|---|
| Station | Catchment | Latitude | Longitude | ||
| 1 | Henley Dam | DHL003 | U20 | S 29°37′25.734″ | E 30°14′49.754″ |
| 2 | Hazelmere Dam | DHM003 | U30 | S 29°35′53.722″ | E 31°02′32.121″ |
| 3 | Inanda Dam 0.3 km | DIN003 | U20 | S 29°42′27.403″ | E 30°52′03.352″ |
| 4 | Midmar Dam | DMM003 | U20 | S 29°29′47.332″ | E 30°12′05.655″ |
| 5 | Umzinto Dam | DMZ009 | U80 | S 30°18′40.676″ | E 30°35′34.580″ |
| 6 | Nungwane Dam | DNW003 | U70 | S 30°00′24.473″ | E 30°44′36.150″ |
| S.No.1 | Statistics | Water Quality Variables 7 | ||||||||||||
|---|---|---|---|---|---|---|---|---|---|---|---|---|---|---|
| NH3 | Ca | Cl | Chl-a | EC | F | CaCO3 | Mg | Mn | NO3 | pH | SO4 | Turb | ||
| 1 | Min. 2 | 0.04 | 4.32 | 3.16 | 0.14 | 6.84 | 0.10 | 21.29 | 2.55 | 0.01 | 0.41 | 7.20 | 0.16 | 3.90 |
| Mean 3 | 0.12 | 6.90 | 8.67 | 6.33 | 11.13 | 0.11 | 34.59 | 4.21 | 0.07 | 1.27 | 7.78 | 2.13 | 36.64 | |
| Max. 4 | 0.56 | 14.20 | 21.40 | 68.31 | 21.80 | 0.54 | 69.55 | 8.28 | 0.59 | 2.27 | 8.60 | 3.46 | 367.00 | |
| Std. Dev.5 | 0.09 | 1.61 | 2.30 | 11.67 | 2.17 | 0.06 | 7.55 | 0.91 | 0.12 | 0.50 | 0.28 | 0.71 | 61.57 | |
| CoV 6 (%) | 72.68 | 23.37 | 26.56 | 184.30 | 19.47 | 56.76 | 21.83 | 21.59 | 166.03 | 39.19 | 3.55 | 33.45 | 168.05 | |
| 2 | Min. | 0.04 | 3.80 | 19.40 | 0.14 | 15.80 | 0.10 | 27.69 | 3.27 | 0.01 | 0.10 | 6.80 | 1.56 | 1.20 |
| Mean | 0.09 | 5.45 | 28.87 | 6.23 | 18.18 | 0.12 | 34.15 | 4.99 | 0.03 | 0.37 | 7.90 | 6.38 | 31.62 | |
| Max. | 0.16 | 18.80 | 40.50 | 92.22 | 22.30 | 0.20 | 81.45 | 8.38 | 0.14 | 3.54 | 9.10 | 13.40 | 293.00 | |
| Std. Dev. | 0.02 | 1.67 | 3.82 | 13.62 | 1.23 | 0.02 | 6.41 | 0.61 | 0.03 | 0.41 | 0.47 | 2.13 | 38.95 | |
| CoV (%) | 24.83 | 30.58 | 13.25 | 218.73 | 6.78 | 19.01 | 18.77 | 12.26 | 90.51 | 111.39 | 5.89 | 33.35 | 123.20 | |
| 3 | Min. | 0.04 | 7.35 | 18.70 | 0.14 | 7.85 | 0.13 | 31.16 | 3.11 | 0.01 | 0.05 | 0.00 | 11.50 | 0.60 |
| Mean | 0.10 | 15.87 | 32.80 | 4.66 | 28.64 | 0.16 | 71.20 | 7.67 | 0.03 | 0.71 | 7.59 | 16.51 | 2.25 | |
| Max. | 0.27 | 30.50 | 43.90 | 19.50 | 33.60 | 0.22 | 128.46 | 12.70 | 0.29 | 9.58 | 8.80 | 24.20 | 19.30 | |
| Std. Dev. | 0.03 | 4.70 | 4.36 | 3.70 | 2.53 | 0.02 | 18.32 | 1.78 | 0.05 | 0.90 | 0.76 | 2.27 | 2.00 | |
| CoV (%) | 30.18 | 29.64 | 13.30 | 79.33 | 8.84 | 12.11 | 25.74 | 23.17 | 157.57 | 125.59 | 10.02 | 13.75 | 88.90 | |
| 4 | Min. | 0.04 | 1.00 | 1.82 | 0.18 | 6.99 | 0.10 | 6.67 | 1.00 | 0.01 | 0.10 | 6.00 | 0.95 | 1.10 |
| Mean | 0.11 | 5.93 | 4.35 | 4.70 | 7.67 | 0.10 | 27.91 | 3.14 | 0.01 | 0.32 | 7.87 | 1.86 | 5.23 | |
| Max. | 0.61 | 18.50 | 7.88 | 25.62 | 8.93 | 0.21 | 79.00 | 8.08 | 0.08 | 4.50 | 8.50 | 2.64 | 19.10 | |
| Std. Dev. | 0.08 | 2.58 | 0.92 | 4.84 | 0.38 | 0.02 | 10.90 | 1.07 | 0.01 | 0.61 | 0.39 | 0.35 | 3.78 | |
| CoV (%) | 75.45 | 43.57 | 21.08 | 103.00 | 4.89 | 17.35 | 39.06 | 34.08 | 86.38 | 189.44 | 4.91 | 18.99 | 72.24 | |
| 5 | Min. | 0.04 | 1.91 | 31.90 | 0.14 | 18.80 | 0.11 | 11.07 | 1.53 | 0.01 | 0.05 | 6.80 | 1.72 | 1.24 |
| Mean | 0.12 | 10.34 | 50.83 | 3.72 | 31.95 | 0.22 | 61.44 | 8.65 | 0.18 | 0.32 | 7.81 | 10.33 | 9.43 | |
| Max. | 0.99 | 17.00 | 79.00 | 30.39 | 48.00 | 0.39 | 102.57 | 14.60 | 1.21 | 2.18 | 8.40 | 23.10 | 75.40 | |
| Std. Dev. | 0.13 | 2.98 | 12.00 | 4.95 | 6.53 | 0.07 | 17.09 | 2.53 | 0.22 | 0.39 | 0.35 | 4.70 | 12.61 | |
| CoV (%) | 110.62 | 28.79 | 23.60 | 133.02 | 20.43 | 30.67 | 27.82 | 29.30 | 126.21 | 120.10 | 4.45 | 45.52 | 133.83 | |
| 6 | Min. | 0.04 | 1.00 | 12.00 | 0.14 | 13.20 | 0.10 | 6.62 | 1.00 | 0.01 | 0.10 | 7.30 | 0.16 | 2.00 |
| Mean | 0.12 | 3.76 | 24.49 | 4.13 | 14.84 | 0.10 | 25.62 | 3.94 | 0.02 | 0.45 | 7.87 | 3.14 | 8.63 | |
| Max. | 0.68 | 7.91 | 37.10 | 11.92 | 16.60 | 0.10 | 36.39 | 5.02 | 0.15 | 1.77 | 8.70 | 7.16 | 29.20 | |
| Std. Dev. | 0.09 | 1.12 | 3.55 | 2.45 | 0.99 | 0.00 | 6.40 | 0.96 | 0.03 | 0.36 | 0.31 | 1.30 | 5.69 | |
| CoV (%) | 71.12 | 29.83 | 14.51 | 59.51 | 6.66 | 0.00 | 24.98 | 24.31 | 120.12 | 78.90 | 3.99 | 41.52 | 65.87 | |
| Variable Identity and Name | Impact Weight Ratings and Weightage Coefficients | ||||
|---|---|---|---|---|---|
| Delphi Rating (ci) | Literature Rating (di) | Weight Rating (bi) | Weight Coefficient (wi) | ||
| 1 | Ammonia | 4.3684 | 3.5033 | 3.9358 | 0.1035 |
| 2 | Calcium | 3.5263 | 1.9961 | 2.7612 | 0.0726 |
| 3 | Chloride | 3.7143 | 1.9249 | 2.8196 | 0.0742 |
| 4 | Chlorophyll a | 1.7222 | 1.0000 | 1.3611 | 0.0358 |
| 5 | Electrical Conductivity | 2.9474 | 2.3136 | 2.6305 | 0.0692 |
| 6 | Fluoride | 3.7500 | 3.4619 | 3.6059 | 0.0949 |
| 7 | Hardness | 2.5714 | 1.8943 | 2.2329 | 0.0587 |
| 8 | Magnesium | 3.4667 | 1.9334 | 2.7000 | 0.0710 |
| 9 | Manganese | 3.8125 | 3.1093 | 3.4609 | 0.0910 |
| 10 | Nitrate | 3.9048 | 3.0072 | 3.4560 | 0.0909 |
| 11 | pondus Hydrogenium | 4.3333 | 2.5949 | 3.4641 | 0.0911 |
| 12 | Sulphate | 2.9167 | 2.9712 | 2.9439 | 0.0774 |
| 13 | Turbidity | 2.6667 | 2.6226 | 2.6446 | 0.0696 |
| Totals | 38.0167 | 1.0000 | |||
| Variable | Unit | Key Points of the Sub-Index Graph (SI0, …, 100 = Sub-Index Zero to Sub-Index One Hundred) | |||||||||||
|---|---|---|---|---|---|---|---|---|---|---|---|---|---|
| Class 5 | Class 4 | Class 3 | Class 2 | Class 1 | |||||||||
| SI0 | SI5 | SI10 | SI25 | SI45 | SI50 | SI55 | SI75 | SI90 | SI95 | SI100 | |||
| 1 | NH3 | mg/L | 2.00 | 1.58 | 1.47 | 1.28 | 0.93 | 0.84 | 0.75 | 0.40 | 0.13 | 0.05 | 0.00 |
| 2 | Ca | mg/L | 90.00 | 83.47 | 76.95 | 59.01 | 49.16 | 46.70 | 42.03 | 23.35 | 9.34 | 4.67 | 0.00 |
| 3 | Cl | mg/L | 601.00 | 501.00 | 461.01 | 344.37 | 188.85 | 150.00 | 137.50 | 87.50 | 50.00 | 50.00 | 50.00 |
| 4 | Chl-a | µg/L | 29.00 | 24.00 | 20.00 | 17.00 | 13.00 | 12.00 | 11.00 | 5.50 | 1.00 | 1.00 | 1.00 |
| 5 | EC | µS/m | 492.86 | 471.44 | 450.00 | 385.77 | 300.00 | 278.58 | 257.15 | 171.45 | 70.00 | 70.00 | 70.00 |
| 6 | F | mg/L | 1.51 | 1.38 | 1.27 | 0.92 | 0.46 | 0.35 | 0.33 | 0.27 | 0.05 | 0.05 | 0.05 |
| 7 | CaCO3 | mg/L | 300.00 | 280.00 | 260.00 | 200.00 | 180.00 | 175.00 | 170.00 | 150.00 | 75.00 | 50.00 | 0.00 |
| 8 | Mg | mg/L | 91.00 | 82.00 | 74.00 | 50.00 | 46.00 | 45.00 | 44.00 | 40.00 | 32.50 | 30.00 | 0.00 |
| 9 | Mn | mg/L | 1.54 | 1.43 | 1.33 | 1.03 | 0.63 | 0.53 | 0.49 | 0.34 | 0.05 | 0.05 | 0.05 |
| 10 | NO3 | mg/L | 2.00 | 1.75 | 1.50 | 0.95 | 0.75 | 0.70 | 0.65 | 0.37 | 0.07 | 0.03 | 0.00 |
| 11 | pH a | Unitless | 4.00 | 4.00 | 4.00 | 4.19 | 4.94 | 5.12 | 5.31 | 6.06 | 6.62 | 6.81 | 7.00 |
| pH b | Unitless | 11.00 | 11.00 | 11.00 | 10.81 | 10.06 | 9.87 | 9.69 | 8.94 | 9.37 | 8.19 | 8.00 | |
| 12 | SO4 | mg/L | 350.00 | 310.00 | 270.00 | 150.00 | 113.98 | 104.99 | 95.99 | 60.00 | 37.50 | 30.00 | 0.00 |
| 13 | Turb | NTU | 45.00 | 27.50 | 10.00 | 8.75 | 7.08 | 6.67 | 6.25 | 4.60 | 3.40 | 3.00 | 0.00 |
| Sample Identity | Water Quality Index Results from Scenario-Based Analysis | |||||
|---|---|---|---|---|---|---|
| Ideal WQI Results | Modified Weighted WQI Results | Developed UWQI Results | ||||
| Index Score | WQI Class | Index Score | WQI Class | Index Score | WQI Class | |
| Maximum | 100.00 | 1.00 | 99.51 | 1.00 | 99.74 | 1.00 |
| Average | 50.00 | 4.00 | 39.39 | 4.00 | 48.83 | 4.00 |
| 1 | 0.00 | 5.00 | 0.00 | 5.00 | 0.00 | 5.00 |
| 2 | 5.00 | 5.00 | 0.18 | 5.00 | 3.18 | 5.00 |
| 3 | 10.00 | 5.00 | 0.83 | 5.00 | 7.38 | 5.00 |
| 4 | 45.00 | 4.00 | 20.25 | 5.00 | 41.95 | 4.00 |
| 5 | 50.00 | 4.00 | 25.03 | 4.00 | 47.07 | 4.00 |
| 6 | 55.00 | 3.00 | 30.27 | 4.00 | 52.20 | 3.00 |
| 7 | 90.00 | 2.00 | 84.67 | 2.00 | 91.35 | 2.00 |
| 8 | 95.00 | 2.00 | 93.76 | 2.00 | 96.56 | 1.00 |
| 9 | 100.00 | 1.00 | 99.51 | 1.00 | 99.74 | 1.00 |
| Key Point a | Calculation of WQI Using the Parameter Values Corresponding to the Key Points of the Rating Curves | ||||||||||||||
| Water Quality Parameters c | WQI Results | ||||||||||||||
| NH3 | Ca | Cl | Chl-a | EC | F | CaCO3 | Mg | Mn | NO3 | pH | SO4 | Turb | Score | Class | |
| KP1 | 2.00 | 90.00 | 601.00 | 29.00 | 492.86 | 1.51 | 301.00 | 91.00 | 1.54 | 2.10 | 4.00 | 351.00 | 46.00 | 0.00 | 5 |
| KP2 | 1.58 | 83.47 | 501.00 | 24.00 | 471.44 | 1.38 | 280.00 | 82.00 | 1.43 | 1.75 | 4.00 | 310.00 | 27.50 | 3.18 | 5 |
| KP3 | 1.47 | 76.95 | 461.01 | 20.00 | 450.00 | 1.27 | 260.00 | 74.00 | 1.33 | 1.50 | 4.00 | 270.00 | 10.00 | 7.36 | 5 |
| KP4 | 1.28 | 59.01 | 344.37 | 17.00 | 385.77 | 0.92 | 200.00 | 50.00 | 1.03 | 0.95 | 4.19 | 150.00 | 8.75 | 22.13 | 5 |
| KP5 | 0.93 | 49.16 | 188.85 | 13.00 | 300.00 | 0.46 | 180.00 | 46.00 | 0.63 | 0.75 | 4.94 | 113.98 | 7.08 | 41.95 | 4 |
| KP6 | 0.84 | 46.70 | 150.00 | 12.00 | 278.58 | 0.35 | 175.00 | 45.00 | 0.53 | 0.70 | 5.12 | 104.99 | 6.67 | 47.07 | 4 |
| KP7 | 0.75 | 42.03 | 137.50 | 11.00 | 257.15 | 0.33 | 170.00 | 44.00 | 0.49 | 0.65 | 5.31 | 95.99 | 6.25 | 52.20 | 3 |
| KP8 | 0.40 | 23.35 | 87.50 | 5.50 | 171.45 | 0.27 | 150.00 | 40.00 | 0.34 | 0.37 | 6.06 | 60.00 | 4.60 | 73.13 | 3 |
| KP9 | 0.13 | 9.34 | 50.10 | 1.01 | 70.01 | 0.05 | 75.00 | 32.50 | 0.05 | 0.07 | 6.62 | 37.50 | 3.40 | 89.16 | 2 |
| KP10 | 0.05 | 4.67 | 50.00 | 0.99 | 70.00 | 0.05 | 50.00 | 30.00 | 0.05 | 0.03 | 6.81 | 30.00 | 3.00 | 96.55 | 1 |
| KP11 | 0.00 | 0.00 | 50.00 | 0.99 | 70.00 | 0.05 | 0.00 | 0.00 | 0.05 | 0.00 | 7.00 | 0.00 | 0.00 | 99.74 | 1 |
| S.No. b | Calculation of WQI Using the Parameter Values from Umgeni Water Board for Six Different Sampling Stations | ||||||||||||||
| Water Quality Parameters c | WQI Results d | ||||||||||||||
| NH3 | Ca | Cl | Chl-a | EC | F | CaCO3 | Mg | Mn | NO3 | pH | SO4 | Turb | Score | Class | |
| 1 | 0.27 | 5.92 | 3.16 | 5.71 | 9.71 | 0.54 | 29.77 | 3.64 | 0.26 | 0.51 | 7.40 | 1.11 | 97.20 | 77.98 | 2 |
| 0.13 | 8.47 | 7.23 | 5.65 | 14.20 | 0.10 | 42.89 | 5.28 | 0.02 | 0.45 | 8.20 | 2.53 | 7.10 | 88.08 | 2 | |
| 2 | 0.10 | 5.64 | 29.50 | 20.49 | 19.20 | 0.17 | 35.66 | 5.24 | 0.01 | 0.99 | 7.70 | 7.70 | 66.70 | 77.87 | 2 |
| 0.10 | 6.36 | 22.20 | 0.14 | 20.10 | 0.10 | 38.86 | 5.58 | 0.01 | 0.10 | 7.30 | 5.81 | 1.90 | 95.15 | 1 | |
| 3 | 0.10 | 16.50 | 36.40 | 19.50 | 31.40 | 0.20 | 82.36 | 10.00 | 0.01 | 1.31 | 7.90 | 20.05 | 5.80 | 80.01 | 2 |
| 0.10 | 13.30 | 35.30 | 1.71 | 28.90 | 0.16 | 61.79 | 6.94 | 0.03 | 0.10 | 7.90 | 19.40 | 1.00 | 93.45 | 2 | |
| 4 | 0.36 | 5.19 | 5.54 | 1.28 | 8.40 | 0.10 | 24.80 | 2.83 | 0.01 | 4.50 | 7.90 | 2.26 | 4.70 | 83.30 | 2 |
| 0.04 | 1.00 | 4.79 | 1.87 | 7.85 | 0.10 | 6.67 | 1.00 | 0.01 | 0.34 | 7.80 | 1.89 | 1.90 | 94.92 | 2 | |
| 5 | 0.09 | 13.36 | 59.33 | 5.91 | 42.60 | 0.23 | 80.59 | 11.47 | 1.05 | 0.43 | 7.60 | 16.20 | 13.20 | 75.99 | 2 |
| 0.04 | 10.70 | 56.80 | 1.08 | 34.90 | 0.27 | 66.87 | 9.75 | 0.03 | 0.05 | 7.80 | 12.50 | 1.90 | 92.64 | 2 | |
| 6 | 0.10 | 3.30 | 23.70 | 2.96 | 14.20 | 0.10 | 24.84 | 4.03 | 0.01 | 1.77 | 8.00 | 2.66 | 13.30 | 80.48 | 2 |
| 0.10 | 4.28 | 26.10 | 2.63 | 16.50 | 0.10 | 29.14 | 4.48 | 0.01 | 0.10 | 7.80 | 3.60 | 3.80 | 93.95 | 2 | |
| Year | Month | Sampling Stations | |||||
|---|---|---|---|---|---|---|---|
| Station 1 | Station 2 | Station 3 | Station 4 | Station 5 | Station 6 | ||
| 2014 | July | 80.45 | 91.97 | 88.40 | 91.20 | 89.42 | 90.71 |
| October | 83.80 | 86.98 | 90.32 | 83.30 | 87.04 | 85.62 | |
| Seasonal Average 1 | 82.13 | 89.48 | 89.36 | 87.25 | 88.23 | 88.16 | |
| Annual Average 2 | 80.94 | 87.49 | 89.63 | 91.42 | 84.78 | 88.35 | |
| 2015 | January | 79.09 | 84.19 | 92.35 | 94.92 | 86.73 | 90.70 |
| April | 80.40 | 82.48 | 92.89 | 90.79 | 90.38 | 92.20 | |
| July | 79.68 | 84.04 | 87.13 | 87.72 | 78.32 | 89.61 | |
| October | 87.13 | 84.70 | 91.75 | 94.05 | 90.04 | 93.95 | |
| Seasonal Average 1 | 81.58 | 83.85 | 91.03 | 91.87 | 86.37 | 91.61 | |
| Annual Average 2 | 82.74 | 83.99 | 91.32 | 90.99 | 86.48 | 91.60 | |
| 2016 | January | 78.38 | 84.37 | 93.28 | 94.08 | 85.27 | 88.38 |
| April | 81.52 | 86.61 | 93.45 | 92.54 | 91.89 | 93.68 | |
| July | 86.51 | 90.73 | 83.93 | 86.76 | 81.37 | 91.55 | |
| October | 85.12 | 90.07 | 91.65 | 86.99 | 89.27 | 90.27 | |
| Seasonal Average 1 | 82.89 | 87.94 | 90.58 | 90.09 | 86.95 | 90.97 | |
| Annual Average 2 | 81.72 | 88.80 | 89.20 | 89.88 | 87.80 | 90.03 | |
| 2017 | January | 82.43 | 95.15 | 83.69 | 92.86 | 86.03 | 92.02 |
| April | 82.42 | 92.63 | 91.91 | 94.35 | 91.79 | 91.21 | |
| July | 85.16 | 91.87 | 86.30 | 91.05 | 91.31 | 81.90 | |
| October | 81.21 | 94.46 | 90.95 | 93.90 | 85.21 | 86.03 | |
| Seasonal Average 1 | 82.81 | 93.53 | 88.21 | 93.04 | 88.59 | 87.79 | |
| Annual Average 2 | 81.86 | 92.32 | 88.73 | 92.93 | 85.66 | 85.72 | |
| 2018 | January | 80.47 | 87.50 | 84.12 | 92.96 | 85.16 | 87.46 |
| April | 80.63 | 94.71 | 90.52 | 94.06 | 88.00 | 87.90 | |
| July | 83.14 | 91.40 | 84.65 | 91.41 | 82.55 | 87.35 | |
| Seasonal Average 1 | 81.41 | 91.20 | 86.43 | 92.81 | 85.24 | 87.57 | |
| Annual Average 2 | 81.26 | 90.80 | 86.76 | 92.83 | 86.71 | 87.58 | |
| Station Minimum WQI 3 | 77.98 | 77.87 | 80.01 | 83.30 | 75.99 | 80.48 | |
| Station Maximum WQI 4 | 88.08 | 95.15 | 93.45 | 94.92 | 92.64 | 93.95 | |
| Station Average WQI 5 | 81.81 | 87.39 | 89.05 | 91.52 | 86.39 | 88.74 | |
| ID | Water Quality Classification | |
|---|---|---|
| Description of Rank and Classification | Index Score | |
| 1 | Class 1—Good water quality Water quality is protected with a virtual absence of threat or impairment; conditions very close to natural or pristine levels | 95 < Index ≤ 100 |
| 2 | Class 2—Acceptable water quality Water quality is usually protected with only a minor degree of threat or impairment; conditions rarely depart from natural or desirable levels | 75 < Index ≤ 95 |
| 3 | Class 3—Regular water quality Water quality is usually protected but occasionally threatened or impaired; conditions sometimes depart from natural or desirable levels | 50 < Index ≤ 75 |
| 4 | Class 4—Bad water quality Water quality is frequently threatened or impaired; conditions often depart from natural or desirable levels | 25 < Index ≤ 50 |
| 5 | Class 5—Very bad water quality Water quality is almost always threatened or impaired; conditions usually depart from natural or desirable levels | 0 < Index ≤ 25 |
© 2020 by the authors. Licensee MDPI, Basel, Switzerland. This article is an open access article distributed under the terms and conditions of the Creative Commons Attribution (CC BY) license (http://creativecommons.org/licenses/by/4.0/).
Share and Cite
Banda, T.D.; Kumarasamy, M. Development of a Universal Water Quality Index (UWQI) for South African River Catchments. Water 2020, 12, 1534. https://doi.org/10.3390/w12061534
Banda TD, Kumarasamy M. Development of a Universal Water Quality Index (UWQI) for South African River Catchments. Water. 2020; 12(6):1534. https://doi.org/10.3390/w12061534
Chicago/Turabian StyleBanda, Talent Diotrefe, and Muthukrishnavellaisamy Kumarasamy. 2020. "Development of a Universal Water Quality Index (UWQI) for South African River Catchments" Water 12, no. 6: 1534. https://doi.org/10.3390/w12061534
APA StyleBanda, T. D., & Kumarasamy, M. (2020). Development of a Universal Water Quality Index (UWQI) for South African River Catchments. Water, 12(6), 1534. https://doi.org/10.3390/w12061534