Communication

Multiscale Resilience in Water Distribution and Drainage Systems

Faculty of Computing, Engineering, and Media, De Montfort University, The Gateway, Leicester LE1 9BH, UK
Water 2020, 12(6), 1521; https://doi.org/10.3390/w12061521
Submission received: 20 April 2020 / Revised: 21 May 2020 / Accepted: 25 May 2020 / Published: 27 May 2020
(This article belongs to the Section Urban Water Management)

Abstract

:
Multiscale resilience, i.e., coordinating different scales within a system to jointly cope and mitigate risks on any single scale, is identified as the feature of a complex resilient system. However, in water distribution systems (WDSs) and urban drainage systems (UDSs), the inherent resilience is usually not multiscale resilience. By referring to the larger scale to larger pipes serving both local users and some other users at smaller scales, it can be found that smaller scales are not responsible for providing resilience to cope with failures in larger scales. These are because the main function of traditional water systems is to deliver water from upstream to downstream. This study demonstrates that improving multiscale resilience in WDSs and UDSs needs to allow water to travel reversely in the system via providing extra capacities and/or connections at smaller scales. This hypothesis is verified via case studies on a real world WDS and UDS.

Graphical Abstract

1. Introduction

Multiscale resilience, i.e., coordinating different scales within a system to jointly cope and mitigate risks on any single scale (Figure 1), is identified as the feature of a complex resilient system [1]. This is based on viewing the complex systems as a number of hierarchically interconnected subsystems, and each hierarchy level refers to a scale (Figure 1). However, both the multiscale structure and the corresponding resilience are still at the conceptual stage. Accordingly, this study explores how to apply the concept of multiscale resilience in water distribution systems (WDSs) and urban drainage systems (UDSs). More specifically it will:
  • Reveal the inherent resilience in WDSs and UDSs is monoscale resilience rather than multiscale resilience;
  • Provide a practical view of multiscale resilience in WDSs and UDSs;
  • Provide methods for building multiscale resilience in both systems;
  • Provide verifications based on case studies on a real-world WDS and UDS.
This study aims to provide a new angle to look at the WDS and UDS resilience and ensure more comprehensive analysis of the resilience and will support water industry’s move towards smart networks for improved resilience. Further, the thinking and methodology from this study will be transferable to contribute to develop methods and tools for the analysis of other complex systems, particularly other infrastructure systems such as power grids, transport systems, etc.
This paper is organized as follows. The rest part of this section is to first discuss the monoscale nature of the WDS and UDS resilience, followed by a literature review of the most relevant studies on resilience enhancement in both WDSs and UDSs. In Section 2—Materials and Methods, two methods for improving multiscale resilience are introduced and tested. The method of extra capacity provision is applied to UDSs (Section 2.1) and the method of providing extra connections is applied to WDSs (Section 2.2), respectively. After that, the results are presented and discussed in Section 3, followed with the Conclusions.
For water distribution systems (WDSs) and urban drainage systems (UDSs), their resilience can be defined as “the degree to which the system minimizes levels of service failure magnitude and duration and maximizes the time to failure impact over its design life when subject to exceptional conditions (Reproduced from [2])”. Different frameworks for quantitatively assessing resilience of WDSs and UDSs have been developed in recent years [3,4,5,6,7,8,9,10,11,12], which have contributed to deepening understandings of the nature of resilience in WDSs and UDSs. In WDSs and UDSs, in most cases the inherent resilience is not multiscale resilience. By referring the larger scale to larger pipes serving both local users and some other users at smaller scales, it can be found that smaller scales are not responsible for providing resilience to cope with failures in larger scales. These are because the main function of traditional water systems is to deliver water from upstream to downstream [13,14]. In UDSs, water is delivered from households to the outlet of the system [13], i.e., from smaller scale to larger scale. Thus, the smaller upstream pipes (at smaller scales) are not expected to accommodate flooding from larger downstream pipes (at larger scales). In WDSs, the water flow is from water sources (e.g., a reservoir) to end users [14], i.e., from larger scale to smaller scale, and hence the downstream pipes (at smaller scales) are not expected to deliver water to upstream customers (at larger scales). Hence, how to build multiscale resilience in WDSs and UDSs is still an open question.
Resilience enhancement in water infrastructures is an emerging topic in both water research and industry, which has been recognized as the important need by both The World Health Organization [15] and The United Nations [16]. Resilience enhancement now has became a duty in the Water Act 2014 (in England and Wales) as noted by Ofwat (2012) [17], which requires substantial investment to adapt water infrastructures. The necessity of the adaptations in design, rehabilitation, renewal and replacement in urban water infrastructures has also been highlighted in studies on water asset management [18,19]. Typical examples of ongoing practice include the adaptation to SuDS (Sustainable Drainage Systems) in UK [20] and the recent years’ adaptation to Sponge City in China [21]. However, big funding gaps for the adaptations are also identified world widely [19], which highlight the importance of developing decision support systems (DSSs) to provide evidence-based strategies for optimizing water infrastructure performance, reliability, and resilience at the lowest possible cost within its life cycle [18]. DSS-based proactive approach is the prerequisite for advanced asset management [18].
For WDSs, the design is normally based on satisfying hydraulic performance criteria under normal conditions and firefighting conditions, while any failure scenarios (e.g., pipe failure) are not considered. Thus, an optimally designed WDS may fail to provide sufficient water supply to a number of customers if a main breaks [22]. To improve WDSs’ resilience, there are two main stream research focuses. One focus is on level-one redundant networks, which are WDSs that sustain a single pipe failure without affecting consumer services [23,24,25,26,27,28]. For example, Mugume et al. 2015b [29] provided a resilient design that can cope with any single pipe failure with a slight increase (2%) in the capital cost. The other focus is on using multiobjective evolutionary algorithm for trading off cost and the resilience index [22,30,31,32]. For UDSs, Mugume et al. 2015a [11] compared resilience of two alternative designs, i.e., centralized storage (using one big storage tank at a certain location in the UDS) and upstream distributed storages (using a number of smaller storage tanks at different locations in the UDS), and found that the distributed storage can improve UDS resilience to flooding. A few other researchers recently confirmed the effectiveness of using looped topology to improve UDSs’ resilience to urban flooding, e.g., in blockage scenarios [33], in hydrodynamic modeling-based design [34], and in eight subnetworks of the city of Dresden that have different characteristics in terms of capacity as well as structure [35]. However, the multiscale resilience has not yet been explored explicitly.

2. Materials and Methods

To develop multiscale resilience, however, it requires bi-directional coordination among scales, i.e., to enable the smaller scales to support the larger scales too. This needs allowing water to travel reversely in the system (i.e., from larger scales to smaller scales in UDSs and vice versa in WDSs) via providing extra capacities and/or connections at smaller scales. To test the hypothesis, methods were developed and tested on a real world WDS and UDS respectively.

2.1. Provision of Extra Capacity

As for providing extra capacity, the idea tested was to enlarge smaller upstream pipes in a UDS to provide buffer capacities that can accommodate excess water traveling back from downstream pipes due to surcharge and backwater effects (Figure 2). This is different from traditional design, in which surcharge and backwater effects are not allowed. The buffer capacity actually plays the role as a temporary storage, which gives an additional function to the pipes other than just being used to deliver water to downstream.

2.1.1. Methodology of Provision of Extra Capacity

  • Network Decomposition Based on the “Sewer Branch Order”
The “Sewer branch order” was used to describe the network topology [36,37]. Specifically, the Strahler numbers (SN) were assigned to each pipe [36,38]. An example of SNs determination is given in Figure 3. Based on the SNs, the system was hierarchically decomposed into a number of subsystems labeled as PSN (i; Figure 3). The superscript SN refers to the level of decomposition. The index i refers to the ID of each subsystem at the same level. Except the top level, all subsystems at each level were comprised of pipes with SNs being equal to or smaller than the current level (SN) and a downstream pipe at the higher level connected to them (as outlets). The sizes of those downstream pipes were set to be “infinite” (e.g., >100 m). For the top level, the corresponding PSN was the whole drainage system and the downstream pipe was the outlet pipe of the system. This methodology ensures that the capacity of each corresponding subsystem is first designed to be just enough for delivering water to downstream, since the back water effects from the downstream of any PSNs have been eliminated. Thus, any further increase of the capacity later will be to provide the extra buffer capacity to accommodate excess water from downstream.
  • Pipe Sizing
The pipe sizing was formulated as a single-objective optimal design problem, in which the objective function was to minimize the pipe construction cost (Equation (1)) and the constraint was to ensure the flood volume at each node is equal to zero (Equation (2)).
minimize   P i p e   C o n s t r u c t i o n   C o s t = i = 1 n p Z i ( d i ) L i
s . t . F l o o d   v o l u m e   a t   e a c h   n o d e = 0
where Z i ( d i ) is the unit length cost ($/m) of candidate pipe diameter d i (mm); n p —the number of pipes; and L i —the length of link i (m).
The optimization is carried out subsystem by subsystem following the hierarchical structure of the studied network. Specifically, the method starts from optimizing the capacity of each subsystem at the first level of decomposition (PSN = 1) until there was no flooding in all the subsystems (PSN = 1(1),..., PSN = 1(5)). Subsequently, the same process would be repeated for the two subsystems PSN = 2(1) and PSN = 2(2) at the second level, and then the PSN = 3. Within each subsystem, the automated pipe sizing procedure is illustrated via a flowchart in Figure 4. Applying this strategy ensures the storage capacity of the upstream subsystems to be maximized. As discussed above, no flooding in subsystems at the current level of decomposition is the prerequisite for the next step. For this reason, if pipes in the PSN = 1(1) are enlarged further during the optimization for PSN = 2(1), this means the capacity of PSN = 1(1) is further increased to not only deal with the local flooding in its served region but also to accommodate the excess flows from downstream due to the back water effect.
Within each level, for each subsystem the rehabilitation process (Figure 4) is described below:
(1)
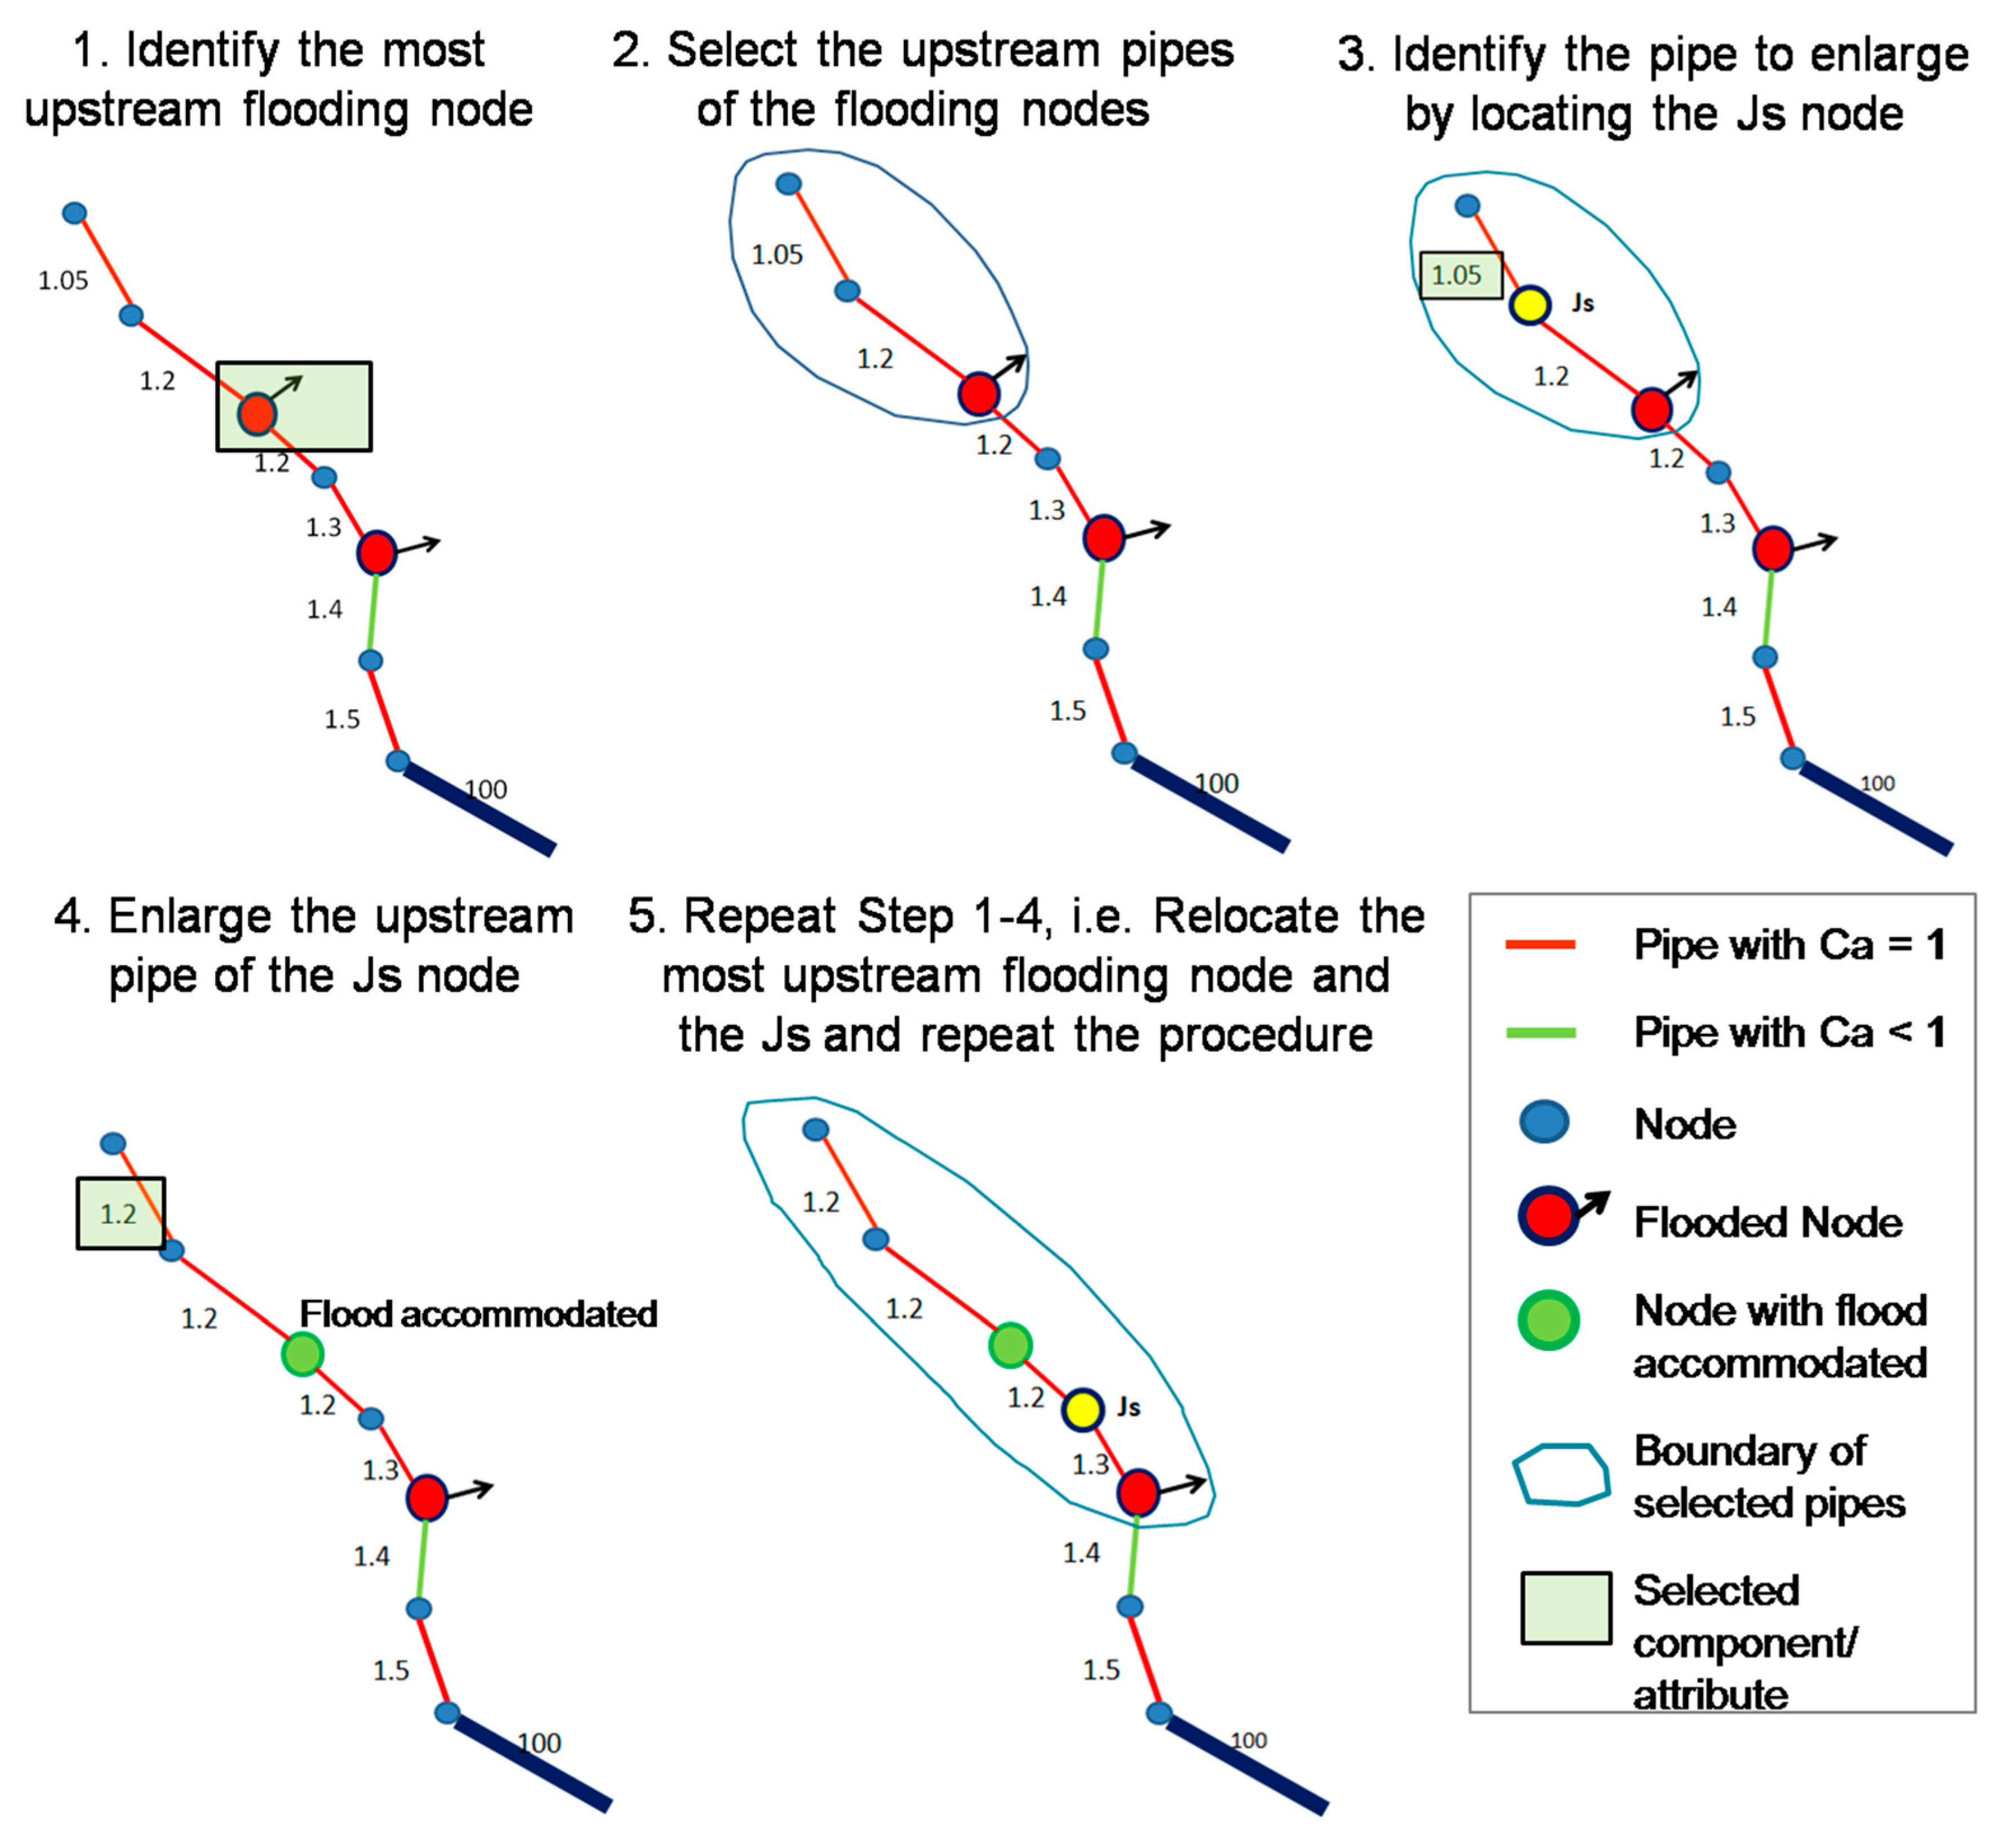
Identify the most upstream flooding node: multiple flooding nodes may occur in the same subsystem, and the process should start from the most upstream node (Figure 4).
(2)
Select the upstream pipes of the flooding node as candidate pipes for rehabilitation.
(3)
Locate the JS node. Here, a JS node refers to a node with the following two principles being satisfied. First, the upstream pipe connected to a JS node had its capacity (Ca = actual depth/max. depth) being equal to 1; second, the downstream pipe connected to that node had a larger size (max. depth) than the upstream pipe. This is to ensure that only pipes without enough capacity are enlarged, and the upstream pipes are always preferable.
(4)
Enlarge the upstream pipe of the JS node by one increment based on the used commercial pipe sizes.
(5)
Repeat Step (1)–(4) to relocate the most upstream flooding node and the JS node and repeat the process. If no JS node exists (i.e., all candidate pipes have the same size), the most downstream one before the infinite size pipe should be enlarged and next repeat Step (1)–(4).
In the application, the so-called “infinite size” should be defined with care based on trial-and-error. On the one hand, it must be large enough to eliminate the backwater effects from the downstream PSN (higher level) to the upstream PSN and the interactions between PSNs. On the other hand, it should not be too large as to avoid computation errors.

2.1.2. Case study of Provision of Extra Capacity

A case study of a real-world storm sewer network (Example USER1) [39] is carried out to test the method. The case study network serves for a 175 hectare drainage area, divided into 58 subcatchments. The network layout is given in Figure 5A, in which there are 59 circular pipes connected to 59 junctions and to a single outfall. The elevation profile of the trunks drops almost 19 meters over a distance of 2.5 km (see Figure 5B). Figure 5C describes the storm event used for the simulation. The system needs rehabilitation as a total flood volume of 1935 m3 water occurred in a few nodes during the storm event. The system was solved using the software SWMM Version 5.0022 with a 5 second flow routing time step for a 7 hours duration with a 1 minute reporting time step. A package including the SWMM input file of the UDS is provided in [39] and downloadable from the EPA’s Storm Water Management Model (SWMM) website.
As for the case study, the method was implemented based on using the default pipe sizes specified in the model as initial estimates. For a new layout, however, the initial pipe sizes could also be determined by using the time area method. For the optimization of each subsystem, all pipes except the one with infinite size were selected as decision variables. The values available for the decision variables are listed in Table 1. Two design principles were imposed in this investigation, one allowing surcharge (the multiscale concept) and the other not (consistent with the traditional design concept).

2.2. Provision of Extra Connections

Extra connections allowing reverse flows can be added among subsystems to enable subsystems to coordinate with each other during an exceptional event. This methodology is directly applicable in WDSs that have already been decomposed into a number of districted metered areas (DMAs). Adding the extra connections among DMAs allow the DMAs to support each other when any of them suffers from water supply shortage. This idea is tested on the C-Town (Figure 6), a benchmarking real-world WDS consisting of five DMAs [42]. Water is first pumped from a reservoir to DMA 1 and two tanks connected to it, and then to four booster pump stations configured at the inlets of DMA 2–5 respectively. Hence, all DMAs at scale 1 (DMA 2–5) can be feed by both the reservoir and tanks in DMA1 at scale 2 as well as their own tank(s) and booster stations. However, the DMA1 at scale 2 cannot receive any supply from any DMA at scale 1. This one-way coordination will be problematic, as in case the reservoir is disconnected from the system due to connection failure (Figure 6C), DMA1 has to supply all the system but cannot receive help from any other DMAs. In this regard, the effectiveness of allowing other DMAs to feed DMA1 was tested. Specifically, in each booster pump station a by-pass pipe was added, which will open to let water travelling backward when necessary (e.g., in a failure event needs emergent coordination), allowing DMA1 (at scale 2) to receive water from any of the other DMAs (at scale 1). Details of the four extra by-pass connections are listed in Table 2. The failure scenario of loosing pipe P100 on the path from the reservoir to the system was simulated, by closing the pipe in the EPANET model from the beginning of the simulation period. The demand shortage caused by the failure was calculated as the actual supplied demand during the failure event minus the total demand required. The actual supplied demand was a sum of actual nodal demands that is estimated based on the minimum pressure required and a pressure-demand relationship specified in [43]. More details of the demand shortage estimation method are available in [9,44]. The minimum pressure required was 20 meters for nodes with water demands and zero meters for junctions with no water demands.

3. Results and Discussions

For the UDS, the comparison between traditional design and multiscale resilient design is shown in Figure 7B. By referring to the original layout of the UDS (before the rehabilitation; Figure 7B), it can be seen that the multiscale resilient design only increased sizes of some upstream pipes (with diameters ≤ 0.6 m), and all larger downstream pipes (with diameters > 0.6 m) remained unchanged. Nevertheless, to accommodate the same volume of flood, the traditional design (with no surcharges and backwater effects allowed) needs to increase sizes of most of pipes, including large downstream pipes close to the outlet (e.g., the pipeline in orange color). Hence, the multiscale resilient design uses smaller pipes in many locations in comparison with the traditional design, particularly for downstream pipes at large scales. It thus achieves considerable cost saving (about 10%) and no loss in flood attenuation capacity via multiscale coordination. By utilizing surcharges and backwater effects, the method enabled the UDSs to store excess water during extreme events at proper locations and proper time. For example, Figure 8 shows that during peak flow hours the two pipes highlighted in red boxes were able to prevent water inside them to be discharged to downstream by using backwater effects (as reverse flow directions were observed at time steps 50 min and 51 min, and 52 min, respectively). This temporary storage ability, despite being needed for no more than 2 minutes (as Figure 8 shows), was sufficient to attenuate peak flows to avoid floods from the UDS. The temporary storage also attenuated peak flows discharged to receiving water bodies too, and thus prevented sharply rising of the water levels there to avoid local flooding. The method was computationally efficient and deterministic as well. Regarding the computation expense, the method was executed on a laptop computer configured with Intel(R) Core(TM) i5-3320M CPU @ 2.60GHz 2.60 GHz, 4.00 GB RAM, and a 240 GB SSD hard drive. The total computation time was only about 2.5 minutes. Compared with evolutionary optimization methods, the method also had its considerable advantages, since it produced unique solutions at each run (no randomness of solutions, i.e., deterministic), and did not require any parameter for configuration and execution control.
For the WDS, using any extra connection can prolong water supply in DMA1 with no significant failure impacts, i.e., 1 hour by using the support from either DMA2 or 4, 2 hours by using DMA5, and 3 hours by using DMA3. Despite it also causes some regions in DMA2–4 to lose water supply, the amount of water supply shortage is still slightly reduced over the whole system during the failure event. Hence, the extra investment of adding the extra connections is worthwhile if carefully planned. Further, opening all extra connections together will prolong water supply in DMA1 (with no significant failure impacts) for as long as 5 hours, at the expense of significantly affecting water supplies at the other DMAs. This option may not be worthwhile, compared with using a single extra connection in DMA3 to gain a three hours extension. However, all these facts revealed will help decision markers in planning of the coordination. For large and complex WDSs, locations of the connections would be case-specific, and thus should be carefully selected. A generic method is yet to be developed in future research, as this study’s scope is to first test the validity of the idea of using extra connections. It is believed that the multiscale approach is complementary to the current practice of building loops in WDSs that allows isolation of any main pipe break for repair work with little impact on customers outside of that immediate area.

4. Conclusions

This study explored how to apply the concept of multiscale resilience into urban water systems, and concluded as follows:
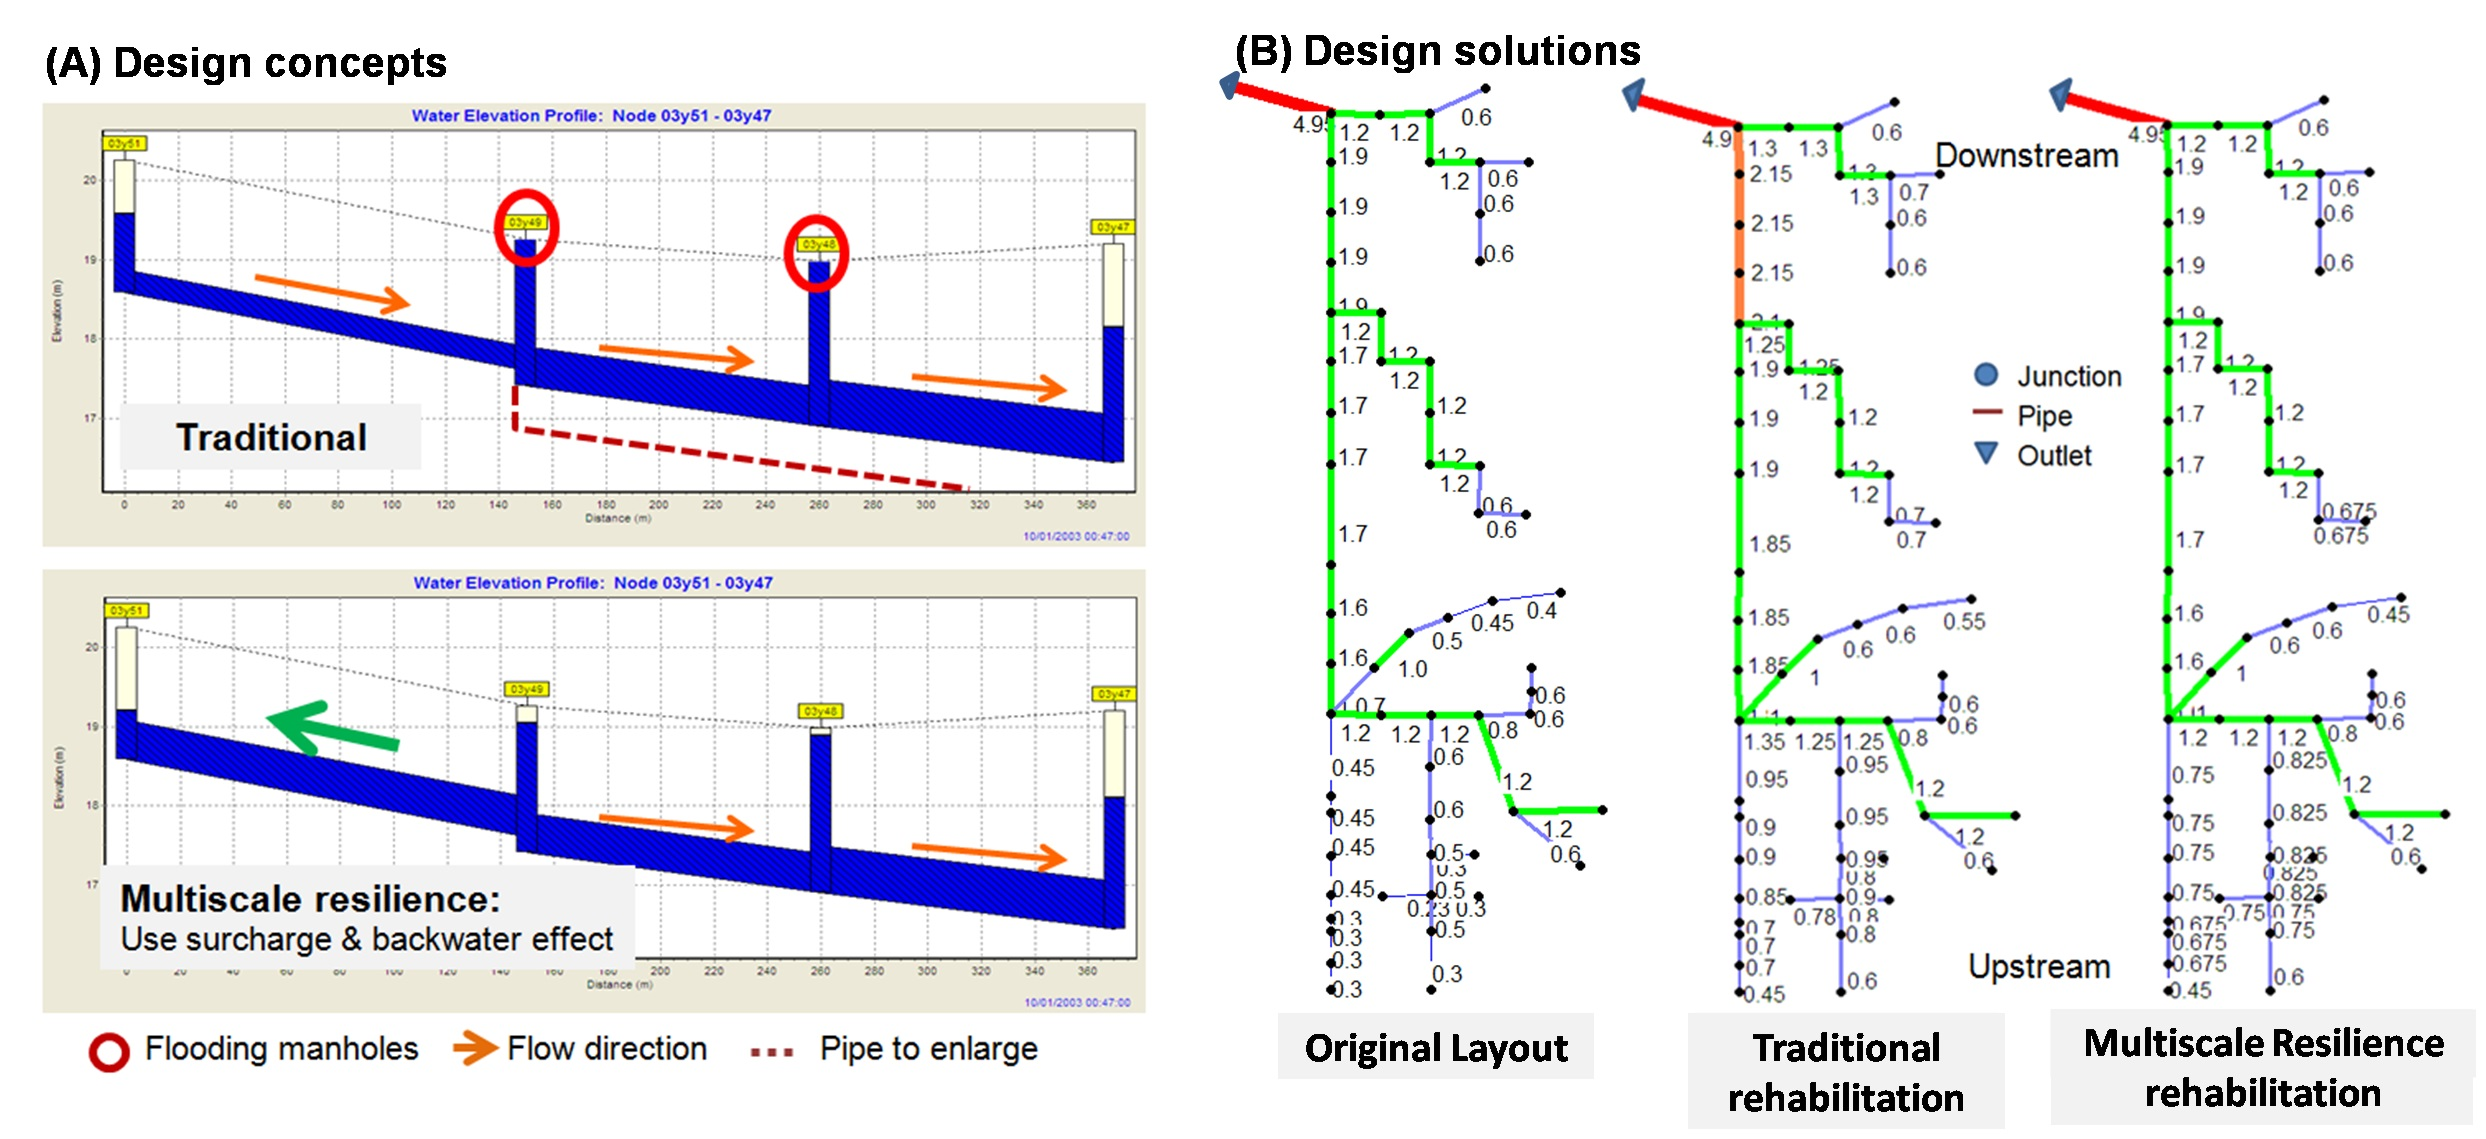
  • Traditional design of WDSs and UDSs resulted in monoscale resilience, which did not allow flexible water delivery coordination, e.g., smaller scales to support larger scales;
  • The proposed method for developing multiscale resilience was to provide extra capacities and/or connections that not only allow water to travel from upstream to downstream (as the traditional design does) but also allow reverse flow in the system during exceptional failure events (i.e., from larger scales to smaller scales in UDS and vice verse in WDS).
  • Case studies on a real world UDS and WDS verified: As for the UDS, enlarging smaller upstream pipes provided buffer capacities to accommodate excess water travelling back from downstream pipes due to surcharge and backwater effects. By allowing a temporary storage of storm water for two minutes inside a few pipes, peak flows were attenuated and thus avoided flooding in the system. The multiscale resilient design achieved considerable cost saving (about 10%) and no loss in flood attenuation capacity via the multiscale coordination. For the WDS, using extra connections that can direct flow from the smaller scale to larger scale provided flexibility in water supply coordination (e.g., allowed subsystems at downstream to feed subsystems at upstream) and reduced the total amount of water supply shortage in the system during a failure event of losing the connection to the reservoir.
  • Future work includes testing the methods on various real-world WDSs and UDSs, and meanwhile further develop the methodology. Moreover, the methodology will be applied to analyze interdependent systems of systems [45] as an outreach.
From a global perspective on the scientific-technical world, this study is an addition to the important area of research to create a multiscale view of both a single complex system and integrated complex systems to identify key interdependencies within the systems from their inherent complexity. Interdependencies between these systems and their sub-systems have consequences for the ways in which critical services are consumed and their resilience and improving decision making toward sustainable consumption is essential for society, the environment and also the infrastructure systems themselves.

Funding

This research received no external funding.

Acknowledgments

Kegong Diao would like to thank the research group leader of the Institute of Energy and Sustainable Development (IESD) at De Montfort University—Professor Subhes C Bhattacharyya for approval of covering his publication fee using the research group’s budget. He would like to thank Anne Smith and Paul Whitehall too for handling the payment process. The author would like to thank the Editors and Reviewers for bringing the paper to a scientific standard for inclusion in the journal.

Conflicts of Interest

The authors declare no conflict of interest.

References

  1. Mehaffy, M.W.; Salingaros, N.A. Design for a Living Planet: Settlement, Science, and the Human Future; Sustasis Foundation: White Salmon, WA, USA, 2015. [Google Scholar]
  2. Butler, D.; Ward, S.; Sweetapple, C.; Imani, M.; Diao, K.; Farmani, R.; Fu, G. Reliable, resilient and sustainable water management: The Safe & SuRe approach. Glob. Challenges 2016, 1, 63–77. [Google Scholar] [CrossRef]
  3. Yazdani, A.; Otoo, R.A.; Jeffrey, P. Resilience enhancing expansion strategies for water distribution systems: A network theory approach. Environ. Model. Softw. 2011, 26, 1574–1582. [Google Scholar] [CrossRef]
  4. Yazdani, A.; Jeffrey, P. Complex network analysis of water distribution systems. Chaos Interdiscip. J. Nonlinear Sci. 2011, 21, 16111. [Google Scholar] [CrossRef] [PubMed] [Green Version]
  5. Candelieri, A.; Soldi, D.; Archetti, F. Network analysis for resilience evaluation in water distribution networks. Environ. Eng. Manag. J. 2015, 14, 1261–1270. [Google Scholar] [CrossRef]
  6. Soldi, D.; Candelieri, A.; Archetti, F. Resilience and Vulnerability in Urban Water Distribution Networks through Network Theory and Hydraulic Simulation. Procedia Eng. 2015, 119, 1259–1268. [Google Scholar] [CrossRef] [Green Version]
  7. Yazdani, A.; Jeffrey, P. Robustness and Vulnerability Analysis of Water Distribution Networks Using Graph Theoretic and Complex Network Principles. Water Distrib. Syst Anal. 2011, 933–945. [Google Scholar] [CrossRef]
  8. Fernandez, M.H.; Abraham, E.; Stoianov, I.; Fernandez, M.H. A Graph-Theoretic Framework for Assessing the Resilience of Sectorised Water Distribution Networks. Water Resour. Manag. 2016, 30, 1685–1699. [Google Scholar] [CrossRef] [Green Version]
  9. Diao, K.; Sweetapple, C.; Farmani, R.; Fu, G.; Ward, S.; Butler, D. Global resilience analysis of water distribution systems. Water Res. 2016, 106, 383–393. [Google Scholar] [CrossRef] [Green Version]
  10. Mugume, S.N.; Gomez, D.E.; Butler, D. Quantifying the Resilience of Urban Drainage Systems Using a Hydraulic Performance Assessment Approach. In Proceedings of the 13th International Conference on Urban Drainage, Sarawak, Malaysia, 7–12 September 2014. [Google Scholar]
  11. Mugume, S.; Gomez, D.; Fu, G.; Farmani, R.; Butler, D. A global analysis approach for investigating structural resilience in urban drainage systems. Water Res. 2015, 81, 15–26. [Google Scholar] [CrossRef] [Green Version]
  12. Carlos, M.C.; Toloh, B.; Sanchez-Torres, A.; Vojinović, Z.; Brdjanovic, D. Flood Resilience Assessment in Urban Drainage Systems Through Multi-Objective Optimisation. In Proceedings of the 11th International Conference on Hydroinformatics, New York, NY, USA, 17–21 August 2014. [Google Scholar]
  13. Walski, T.M.; Barnard, T.E.; Harold, E.; Merritt, L.B.; Walker, N.; Whitman, B.E. Introduction to Wastewater Collection System Modeling. In Wastewater Collection System Modeling and Design, 1st ed.; Barnard, T.E., Dietrich, K., Strafaci, A., Totz, C., Eds.; Haestad Press: Waterbury, CT, USA, 2007; pp. 1–22. [Google Scholar]
  14. Walski, T.M.; Chase, D.V.; Savic, D.A.; Grayman, W.; Beckwith, S.; Koelle, E. Introduction to Water Distribution Modeling. In Advanced Water Distribution Modeling and Management, 1st ed.; Strafaci, A., Dietrich, K., Totz, C., Eds.; Haestad Press: Waterbury, CT, USA, 2003; pp. 1–18. [Google Scholar]
  15. World Health Organization (WHO) and Department of International Development (DFID) Summary and Policy Implications? Vision 2030. The Resilience of Water Supply and Sanitation in the Face of Climate Change. Available online: https://www.who.int/water_sanitation_health/vision_2030_9789241598422.pdf?ua=1 (accessed on 16 April 2020).
  16. UN-Water Climate Change Adaptation: The Pivotal Role of Water. Available online: http://www.unwater.org/downloads/unw_ccpol_web.pdf (accessed on 16 April 2020).
  17. Ofwat. Resilience–outcomes focused regulation. In Principles for Resilience Planning; The Water Services Regulation Authority for England & Wales: Birmingham, UK, 2012. [Google Scholar]
  18. Ugarelli, R.; Govindarajan, V.; Brattebo, H.; di Federico, V.; Saegrov, S. Asset Management for Urban Wastewater Pipeline Networks. J. Infrastruct. Syst. 2010, 16, 112–121. [Google Scholar] [CrossRef]
  19. Hukka, J.J.; Katko, T. Resilient Asset Management and Governance Fordeteriorating Water Services Infrastructure. Proc. Econ. Finance 2015, 21, 112–119. [Google Scholar] [CrossRef] [Green Version]
  20. Melville-Shreeve, P.; Cotterill, S.; Grant, L.; Arahuetes, A.; Stovin, V.; Farmani, R.; Butler, D. State of SuDS delivery in the United Kingdom. Water Environ. J. 2017, 32, 9–16. [Google Scholar] [CrossRef]
  21. Jia, H.; Wang, Z.; Zhen, X.; Clar, M.; Yu, S.L. China’s sponge city construction: A discussion on technical approaches. Front. Environ. Sci. Eng. 2017, 11, 18. [Google Scholar] [CrossRef]
  22. Todini, E. Looped water distribution networks design using a resilience index based heuristic approach. Urban Water 2000, 2, 115–122. [Google Scholar] [CrossRef]
  23. Ormsbee, L.; Kessler, A. Optimal Upgrading of Hydraulic? Network Reliability. J. Water Resour. Plan. Manag. 1990, 116, 784–802. [Google Scholar] [CrossRef]
  24. Park, H.; Liebman, J.C. Redundancy-Constrained Minimum-Cost Design of Water-Distribution Nets. J. Water Resour. Plan. Manag. 1993, 119, 83–98. [Google Scholar] [CrossRef]
  25. Agrawal, M.L.; Gupta, R.; Bhave, P.R. Reliability-Based Strengthening and Expansion of Water Distribution Networks. J. Water Resour. Plan. Manag. 2007, 133, 531–541. [Google Scholar] [CrossRef]
  26. Ostfeld, A. Optimal reliable design and operation of water distribution systems through decomposition. Water Resour. Res. 2012, 48, 1–14. [Google Scholar] [CrossRef] [Green Version]
  27. Gupta, R.; Kakwani, N.; Ormsbee, L. Optimal Upgrading of Water Distribution Network Redundancy. J. Water Resour. Plan. Manag. 2015, 141, 04014043. [Google Scholar] [CrossRef]
  28. Suribabu, C.R. Resilience-based optimal design of water distribution network. Appl. Water Sci. 2017, 7, 4055–4066. [Google Scholar] [CrossRef]
  29. Mugume, S.; Diao, K.; Imani, M.; Fu, G.; Farmani, R.; Butler, D. Enhancing resilience in urban water systems for future cities. Water Supply 2015, 15, 1343–1352. [Google Scholar] [CrossRef] [Green Version]
  30. Farmani, R.; Walters, G.; Savic, D. Trade-off between Total Cost and Reliability for Anytown Water Distribution Network. J. Water Resour. Plan. Manag. 2005, 131, 161–171. [Google Scholar] [CrossRef]
  31. Reca, J.; Martinez, J.; Baños, R.; Gil-Montoya, C. Optimal Design of Gravity-Fed Looped Water Distribution Networks Considering the Resilience Index. J. Water Resour. Plan. Manag. 2008, 134, 234–238. [Google Scholar] [CrossRef]
  32. Wang, Q.; Guidolin, M.; Savic, D.; Kapelan, Z. Two-Objective Design of Benchmark Problems of a Water Distribution System via MOEAs: Towards the Best-Known Approximation of the True Pareto Front. J. Water Resour. Plan. Manag. 2015, 141, 04014060. [Google Scholar] [CrossRef] [Green Version]
  33. Zhang, C.; Wang, Y.; Li, Y.; Ding, W. Vulnerability Analysis of Urban Drainage Systems: Tree vs. Loop Networks. Sustainability 2017, 9, 397. [Google Scholar] [CrossRef] [Green Version]
  34. Hesarkazzazi, S.; Hajibabaei, M.; Reyes-Silva, J.D.; Krebs, P.; Sitzenfrei, R. Assessing Redundancy in Stormwater Structures Under Hydraulic Design. Water 2020, 12, 1003. [Google Scholar] [CrossRef] [Green Version]
  35. Reyes-Silva, J.D.; Helm, B.; Krebs, P. Meshness of sewer networks and its implications for flooding occurrence. Water Sci. Technol. 2020, 81, 40–51. [Google Scholar] [CrossRef]
  36. Sitzenfrei, R.; Urich, C.; Möderl, M.; Rauch, W. Assessing the efficiency of different CSO positions based on network graph characteristics. Water Sci. Technol. 2013, 67, 1574–1580. [Google Scholar] [CrossRef]
  37. Urich, C.; Sitzenfrei, R.; Möderl, M.; Rauch, W. An agent-based approach for generating virtual sewer systems. Water Sci. Technol. 2010, 62, 1090–1097. [Google Scholar] [CrossRef]
  38. Strahler, A.N. Dynamic basis of geomorphology. Geol. Soc. Am. Bull. 1952, 63, 923–938. [Google Scholar] [CrossRef]
  39. Rossman, L.A. Storm Water Management Model Quality Assurance Report: Dynamic Wave Flow Routing; Water Supply and Water Resources Division National Risk Management Research Laboratory: Cincinnati, OH, USA, 2006.
  40. Con Cast Pipe Website. Available online: http://www.concastpipe.com/pricing/CC_2012Pricelist.pdf (accessed on 19 March 2012).
  41. Wong, L.; Nehdi, M.L. Critical Analysis of International Precast Concrete Pipe Standards. Infrastructures 2018, 3, 18. [Google Scholar] [CrossRef] [Green Version]
  42. Ostfeld, A.; Salomons, E.; Ormsbee, L.; Uber, J.G.; Bros, C.M.; Kalungi, P.; Burd, R.; Zazula-Coetzee, B.; Belrain, T.; Kang, D.; et al. Battle of the Water Calibration Networks (BWCN). Water Distrib. Syst. Anal. 2011, 138, 523–532. [Google Scholar] [CrossRef]
  43. Wagner, J.M.; Shamir, U.; Marks, D.H. Water Distribution Reliability: Simulation Methods. J. Water Resour. Plan. Manag. 1988, 114, 276–294. [Google Scholar] [CrossRef] [Green Version]
  44. Diao, K.; Farmani, R.; Fu, G.; Imani, M.; Ward, S.; Butler, D. Clustering analysis of water distribution systems: Identifying critical components and community impacts. Water Sci. Technol. 2014, 70, 1764–1773. [Google Scholar] [CrossRef]
  45. Ferreira, M.A.M. Networks of Networks: The Last Frontier of Complexity-A Book Review. Int. J. Latest Trends Financ. Econ. Sci. 2014, 4, 708. [Google Scholar]
Figure 1. A complex resilient system coordinates its multi-scale response to a disturbance on any single scale [1].
Water 12 01521 g001
Figure 2. Comparison between traditional and multiscale resilient urban drainage system (UDS0 design concept.
Water 12 01521 g002
Figure 3. Decomposition of a small drainage network based on the Strahler number.
Water 12 01521 g003
Figure 4. The pipe sizing procedure.
Water 12 01521 g004
Figure 5. (A) Schematic of the case study drainage network. (B) Elevation profile of the main stem of the case study drainage network. (C) Rainfall hyetograph for the design storm used for the case study drainage network. The figures are cited from [39].
Water 12 01521 g005
Figure 6. (A) The case study water distribution system (WDS)—the C-Town; (B) the network motif of C-Town; and (C) the motif-based visualization of C-Town.
Water 12 01521 g006
Figure 7. (A) “Sewer branch order” and network decomposition of the case study UDS and (B) comparison between traditional and multiscale resilient UDS design.
Water 12 01521 g007
Figure 8. The locations and durations of using backwater effects to provide temporary storages in the case study UDS during peak flow hours.
Water 12 01521 g008
Table 1. Price list of reinforced concrete pipes [40].
Size (mm)Unit Mass (kg/m)Class 50-D 1 ($/m)Size (mm)Unit Mass (kg/m)Class 50-D 1 ($/m)
30022565.913501939713.3
37530681.415002123872.4
45038183.9165025001044.70
52547091.5180028651262.40
600578131.5195033241464.10
675691201.6210038071680.00
750780265.7225043111909.30
825912308.3240048692234.70
9001039369.8255051792516.90
9751195405.7270057522793.30
10501277464.6300070433420.60
12001561582.3
1 The compressive strength that requires pipes ≤ 2400 mm to withstand 30 MPa loads and pipes > 2400 mm to withstand 35 MPa loads [41].
Table 2. Information of the four extra pipes.
Pipe IDLocationStart NodeEnd NodeLength (m)Diameter (mm)Roughness (Hazen-Williams)
Ex1Pump station S3J415J28915304.8120
Ex2Pump station S2J256J30015254120
Ex3Pump station S5J323J30915203.2120
Ex4Pump station S4J304J30115203.2120

