Abstract
The increase in frequency and intensity of extreme precipitation events caused by the changing climate (e.g., cloudbursts, rainstorms, heavy rainfall, hail, heavy snow), combined with the high population density and concentration of assets, makes urban areas particularly vulnerable to pluvial flooding. Hence, assessing their vulnerability under current and future climate scenarios is of paramount importance. Detailed hydrologic-hydraulic numerical modeling is resource intensive and therefore scarcely suitable for performing consistent hazard assessments across large urban settlements. Given the steadily increasing availability of LiDAR (Light Detection And Ranging) high-resolution DEMs (Digital Elevation Models), several studies highlighted the potential of fast-processing DEM-based methods, such as the Hierarchical Filling-&-Spilling or Puddle-to-Puddle Dynamic Filling-&-Spilling Algorithms (abbreviated herein as HFSAs). We develop a fast-processing HFSA, named Safer_RAIN, that enables mapping of pluvial flooding in large urban areas by accounting for spatially distributed rainfall input and infiltration processes through a pixel-based Green-Ampt model. We present the first applications of the algorithm to two case studies in Northern Italy. Safer_RAIN output is compared against ground evidence and detailed output from a two-dimensional (2D) hydrologic and hydraulic numerical model (overall index of agreement between Safer_RAIN and 2D benchmark model: sensitivity and specificity up to 71% and 99%, respectively), highlighting potential and limitations of the proposed algorithm for identifying pluvial flood-hazard hotspots across large urban environments.
1. Introduction
Over the years, extreme weather events have become increasingly frequent, causing dramatic economic and social damage. According to data on natural disasters in the EU Member States, the total reported economic losses caused by weather and climate-related extremes between 1980 and 2017 amounted to approximately EUR 426 billion (at 2017 values) accounting for about 83% of the monetary losses over that period [1].
Changing climatic conditions and the increase in the frequency and intensity of extreme precipitation events (heavy rainfall, rainstorm, heavy snow, hail) are not the primary driver of the observed increase in economic losses from river floods and storms in Europe during recent decades, which is mainly due to the increasing exposure of people and economic assets in hazard-prone areas [1]. As a matter of fact, the urban population growth, the high concentration of people and activities in urban areas and the development of cities occurred in the last two centuries represent a disruptive action for the natural system, resulting in excessive soil sealing, and alteration of the hydrological system [2,3]. As a result, the majority of land use in urban areas is impervious ground surface that produces accelerated runoff and diminished infiltration, increasing surface runoff volumes. According to the harmonized definition by Eurostat and the OECD (i.e., Organisation for Economic Co-operation and Development), urban areas—defined as cities, towns and suburbs—provide a home to over 70% of the EU-population, and this number is expected to rise to over 80% by 2050 [4,5]. The combination of these factors makes cities the most vulnerable human settlements to the impacts of extreme weather and climate events, especially pluvial floods.
Pluvial flooding is defined as flooding that results from rainfall-generated overland flow; it is usually associated with either intense and/or prolonged rainstorm events, which generate high runoff volumes that exceed the capacity of drainage systems [6]. Its formation is generated by direct surface runoff and ponding caused by rainwater [7] and by the flow caused by sewers and urban minor watercourses, whose capacity has been exceeded as a result of extreme event [8,9]. The type and intensity of the produced impacts depend on the magnitude and frequency of the event, but also on intrinsic factors of the affected urban system, both physical (geographic, morphological, typological, technical, constructional, etc.) and social urban characteristics (see e.g., [10]).
An efficient and detailed pluvial flood-hazard assessment in urban contexts is, therefore, crucial for sustainable urban development; however, pluvial flood modeling poses difficult challenges for hydrologists because of the short response time and the strong intensity of pluvial flood events [11]. Urban storm-inundation models are often classified into three categories based on calculation algorithm: hydrologic, hydrodynamic and simplified models (see e.g., [12,13,14]). Hydrologic and hydrodynamic storm-flooding models may be characterized by a higher level of accuracy relative to simplified models, but their practical application is often hampered by input data requirements and computational burden (e.g., highly complex flow paths; insufficient model efficiency for urban flooding simulations on meaningful scales; representation of microscale topographic features and blockage effects; capability of simulating both high-velocity low-depth flow on steep slopes and depression ponding typical of many urban flooding situations; uncertainty in friction parameters, etc.).
Several studies recently highlighted the potential of simplified raster-based methods for a fast and consistent flood hazard characterization across large computational domains. Their application is facilitated by their relatively low computational costs compared to hydraulic models and the steadily increasing availability and free accessibility of high-resolution Digital Elevation Models (DEMs). Actually, high-resolution terrain data from modern LiDAR (Light Detection And Ranging) systems (i.e., spatial resolution of the order of 1 m) are sufficiently accurate and resolved for simulating urban flows, making the development of raster-based algorithms extremely appealing for a prompt mapping of pluvial flood hazard across large municipalities, or for a quick assessment of potential impacts of a given modification of the urban texture (e.g., land-use change, new development, etc.).
However, to date, the literature on fast-processing DEM-based algorithms for pluvial flood-hazard in urban areas is still sparse, and flood hazard assessment using simplified models has mainly focused on fluvial flooding. In this regard, several raster-based methods have been proposed to assess fluvial flood hazard based on DEM-retrieved geomorphic methodologies using data-mining techniques involving the intersection of databases, statistics and machine learning (e.g., [15,16,17,18,19]). They have been proven to be particularly helpful for analyses over large geographical regions in which information on flooding potential is limited (see e.g., HAND, short for Height Above the Nearest Drainage, [20], or GFI, acronym of Geomorphic Flood Index, see e.g., [21]). Nevertheless, geomorphic DEM-based approaches are not suitable for assessing pluvial-flooding hazard in urbanized areas, in which topography is deeply anthropogenically altered, with abundance of flat and sub-horizontal areas and a diffuse presence of sinks and pits. Moreover, the extent of pluvial-flooded areas is largely controlled by the spatial distribution and the volume of rainfall, which are not explicitly considered in geomorphic methods such as GFI or HAND.
Our study focuses on a class of raster- or DEM-based approaches proposed in literature that has been recently shown to be very promising for the characterization of pluvial-flooding hazard in urban areas: the so-called Hierarchical Filling-&-Spilling Algorithm (HFSA) or Puddle-to-Puddle (P2P) Dynamic Filling-&-Spilling (see e.g., [11,22,23,24,25]).
In watershed modeling, the presence of surface depressions in a DEM is considered undesirable, since they result in disconnected stream-flow patterns and spurious interior sub-watersheds pouring into them. The common practice is, therefore, to locate and remove surface depressions (pit-filling) while preprocessing the DEM [26]. However, when dealing with pluvial flooding in urban areas, surface depressions and microtopography play a major role in the collection and storage of incoming precipitation, having a pronounced effect on the runoff response of a watershed. Therefore, rather than raster cells, taking depressions as the units of analysis appears to be more sensible and convenient [27,28].
Although their hydrologic importance has been long recognized (see e.g., [29,30,31]), surface depressions have not been extensively studied. The first studies that considered depression storage in hydrologic modeling dates back to the late 1970s [32,33]. The authors proposed a 4-direction raster-based technique to characterize their geometric properties and hierarchical nested structure using Digital Surface Models (DSMs).
More recently, exploiting the availability of LiDAR data and high-resolution DEMs, ref. [22,34] proposed an automated algorithm to characterize surface microtopography and surface depression storages; they actually eliminated the artificial depression-filling phase, and identified DEM depressions, or puddles, determining their mutual hierarchical relationships in order to represent the real puddle-to-puddle (P2P) filling-merging-spilling process in modeling the overland flow dynamics. The P2P Filling-&-Spilling, or Hierarchical Filling-&-Spilling, simulates the water routing among different depressions according to their hierarchical structure.
In this study, we test the potential of P2P or HFS algorithms (hereafter also referred to as HFSAs) for pluvial flood-hazard assessment and mapping in urban areas, while overcoming common current limitations of other depression-based approaches (e.g., purely static approaches, isolated depressions; see [27]). HFSA potential in this context has been first tested by [11,24,27]. Our aim is to develop a fast-processing and cost-effective algorithm for characterizing pluvial-flooding hazard on the basis of high-resolution DEMs of (large) urban areas. Specifically, we present Safer_RAIN, a raster-based tool developed within the EIT Climate-KIC research project SaferPLACES (Improved assessment of pluvial, fluvial and coastal flood hazards and risks in European cities as a mean to build safer and resilient communities), which aims at exploring and developing innovative and simplified modeling techniques to assess and map pluvial, fluvial and coastal flood hazard and risk in urban environments under current and future climates. In particular, Safer_RAIN further expands the possibilities of HFSAs by introducing the option to map pluvial flooding associated with partial filling of the depression system, or to delineate the pluvial flooding associated with spatially variable rainfall data, such as data from weather radar measurements or nowcasts, or net-rainfall reflecting losses associated with spatially variable capacities of storm water drainage systems, or land-cover and infiltration rates. We present applications of Safer_RAIN to two urban areas in Northern Italy for reproducing recent pluvial flooding events and for simulating different pluvial flooding scenarios. Detailed numerical 2D hydrodynamic simulations are used for benchmarking and validation. We discuss limitations of the algorithm and its potential for climate services and decision support systems, as well as possible future research avenues.
2. DEM-Based Hierarchical Filling-&-Spilling Algorithm “Safer_RAIN”
2.1. Algorithm Description
The idea behind HFSAs is to identify pluvial-flooded areas on the basis of nested surface depressions extracted from high-resolution DEMs; the volume of rainfall is accumulated in depressions and, as they are filled, water spills downstream to depressions located at lower elevations. HFSAs can be classified as “non-source flooding”, meaning that all points where the elevation is below a given water level belong to the flooded area.
Original formulations of HFSA were based on the following main simplifying assumptions: (i) drainage direction is identified according to the D8 method [35] (i.e., the flow direction from each cell to its downslope neighbor is retrieved accounting for the eight adjacent cells); (ii) overland flow dynamics is neglected and net-rainfall volume accumulates into the nested depression system according to the capacity and hierarchical structure of depressions themselves; (iii) the spatial distribution of rainfall is uniform; (iv) the terrain is considered an impermeable surface. We relaxed main assumptions (iii) and (iv) in developing Safer_RAIN.
Safer_RAIN consists of two main blocks: (1) DEM preprocessing, and (2) depression flooding (see e.g., Figure 1). DEM preprocessing, in turn, involves two main steps aimed at identifying the system of nested depressions: (1.1) their horizontal hydrological hierarchy, and (1.2) their vertical hierarchy; these steps define the hierarchy-tree representing the sequence of filling and spilling of the depressions.
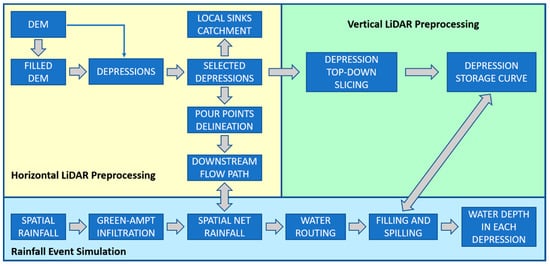
Figure 1.
Safer_RAIN work-flow, distinguishing between DEM preprocessing (horizontal and vertical) and pluvial flooding simulation.
2.1.1. Step (1.1): DEM Preprocessing, Identification of Depressions and Their Horizontal Hierarchy
This step is performed according to the method proposed by [24], which requires the identification of: (i) first-level depressions (hereinafter referred to as blue-spots, as done in [24]) and depression volumes (see e.g., depressions G and H in Figure 2) through the application of a DEM pit-filling algorithm (see e.g., [35]); (ii) blue-spot pour-points (i.e., the lowest-lying cell along the depression upper edge), from where water would pour out if the depression is filled up with water (see e.g., [36]); (iii) blue-spot contributing watersheds; (iv) the derivation of the upstream/downstream relationships and flow paths between pourpoints according to the D8 method. In particular step (i) above retains only blue-spots that have volume or area larger than a user-specified threshold value; smaller depressions are filled up to their pour point level.
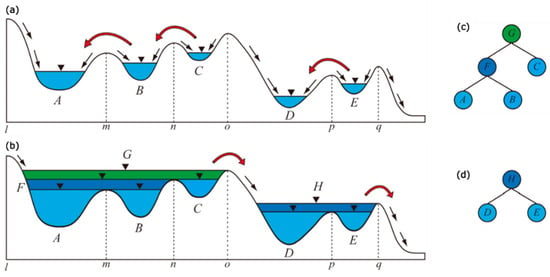
Figure 2.
Schematic representation of the Hierarchical Filling-&-Spilling method: (a) nested-depression system, and (b) blue-spots G and H under fully-filled conditions with illustration of the second-level depressions (F, C, D and E) and third-level depressions (A and B); panels (c) and (d) report the hierarchical tree of the nested depression systems on the left and the right hand side, respectively, by using different colors for different vertical hierarchical order (adapted from [23]).
2.1.2. Step (1.2): DEM Preprocessing, Vertical Structure of Depression Systems
The second step is the identification of nested higher-level depressions within each blue-spot (i.e., G, F and H in Figure 2), their vertical hierarchical relationship and water-level/volume relationship. To this aim, a top-down level-set method [25] is used: starting from a filled condition (i.e., blue-spot G is completely full), the water level decreases gradually (i.e., top-down level-set), thus progressively identifying the higher-level nested depressions (i.e., A, B, C, D and E in Figure 2) and their vertical hierarchical structure. This procedure fully characterizes the relationship between water-level and volume. In particular, to identify the vertical hierarchy of nested depressions, the contour tree method proposed by [36] is used, which has been shown to be computationally efficient and functionally effective.
Differently from [23,25], when identifying the hierarchical tree of the nested depressions, Safer_RAIN keeps track of all the intermediate levels identified in the top-down level-set (the height of each level corresponds to the slicing discretization height), also accounting for those levels which do not have a direct connection with other depressions (see Figure 3). This procedure is preparatory for the bottom-up flooding phase described below.
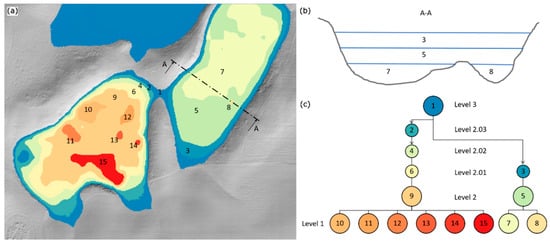
Figure 3.
Schematic representation of the hierarchical structure of nested depressions. (a) Plan view of the intermediate-level depressions, each one associated with a specific color and identification code (ID, from 1 to 15). (b) Cross-sectional view A-A of the depressions 3, 5, 7, 8 identified in panel (a). (c) Hierarchical tree of the nested depression systems: intermediate-level depressions are represented with circles (see ID and color in panel (a)); the corresponding hierarchy level of filling for the bottom-up flooding phase is indicated with numbers from 1 to 3 (2.01, 2.02, 2.03 indicate intermediate levels).
2.1.3. Step (2): Depression Flooding and Partial Filling
Relative to other HFSAs proposed in the literature, Safer_RAIN implements an original flooding phase that identifies partially flooded areas for a given rainfall volume by considering all the intermediate levels (see Figure 3). To this aim, a bottom-up level-set method is used for quantifying partial filling in nested higher-level depressions: (i) the method starts from an empty condition (see e.g., step (a) in Figure 4, the blue-spot is empty); (ii) according to their vertical hierarchy, higher-lever nested depressions are gradually filled from the bottom by adopting a user-specified water-level increment (bottom-up level-set); (iii) gradual filling is performed step-by-step, considering in turn depressions with same hierarchical order (i.e., same color in the hierarchical trees of Figure 2 or Figure 4) until they are completely filled.
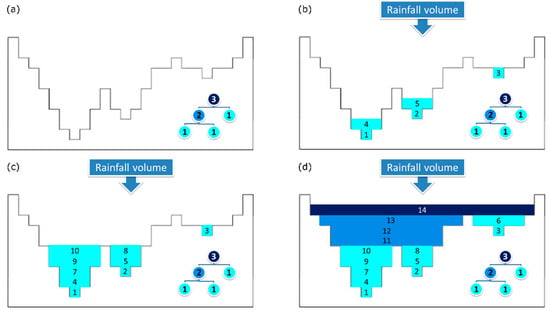
Figure 4.
Example of four different intermediate steps (from a to d) in the application of the bottom-up level-set depression flooding phase: dry domain (a), bottom-up level-set methods for partial filling, while simulating the flooding resulting from a given rainfall event (c,d).
Safer_RAIN guarantees a very fast computation of flooded areas, as DEM preprocessing (steps (1.1) and (1.2)) is run once and it fully characterizes the hierarchy for filling and spilling processes. Considering that, differently from a hydrodynamic model, it does not model flooding dynamics, it can produce an underestimation of maximum water levels; moreover, it does not allow for obtaining indication on timing and velocity.
2.2. Spatially Variable (Net) Rainfall
As mentioned in Section 2.1, Safer_RAIN implements an original flooding phase which can use either uniform or spatially variable (i.e., gridded) rainfall depths as input rainfall volume. The spatially variable precipitation enables the user to: (i) simulate flooding resulting from weather radar products (hindcasts and nowcasts); (ii) incorporate a simplified representation of stormwater drainage system capacity; (iii) represent infiltration losses, since soil infiltration can deeply influence the inundation depth resulting from a pluvial flood event.
As regards infiltration losses, a pixel-based adaptation of the event-based Green-Ampt infiltration model [37] is implemented in Safer_RAIN to represent these losses. The model can therefore handle spatially variable net-precipitation, enabling users to promptly asses pluvial-flood hazard associated with different land-use and land-cover scenarios.
The basic assumption behind the Green-Ampt model is that water infiltrates into (relatively) dry soil as a sharp wetting front. The application of the Green-Ampt method requires the estimation of the following parameters: water storage capacity (-), pre-event soil moisture (-), hydraulic conductivity (L/T), wetting front soil suction head (L). Typical values of the Green-Ampt parameters based on results of previous experiences can be derived from literature (see e.g., [38]).
The pixel-based implementation of the Green-Ampt method considers time to ponding and computes the overall infiltration depth for a given pixel with homogeneous land-cover and soil-type characteristics as:
where and are rainfall intensity and duration, respectively, and , while can be computed as:
2.3. Safer_RAIN Input Data Requirements, User-Specified Settings and Output Data
The implementation of Safer_RAIN pluvial-flood hazard assessment requires the following input data: (i) a high-resolution DEM for the identification of blue-spots; (ii) a threshold criterion for identifying blue-spots (i.e., minimum volume, or area, or maximum depth); (iii) the height of the level-set needed in the top-down preprocessing phase for identifying the vertical hierarchical structure of depressions (the thinner this height, the higher the resolution of the representation of the nested depressions vertical structure, yet the higher the computational cost); (iv) the selection of a (gridded) rainfall event of interest (this information is required for the flooding phase).
The preprocessing phase returns different vector and raster layers, each one containing the following specific information: (1) the unique identification code (ID) of each blue-spot; (2) its depth; (3) a raster layer (i.e., sinks) containing the elevation of the blue-spots and information regarding their morphology and hierarchical structure. For each blue-spot, the layer identifies all levels considered in the level-set method and their corresponding volume, elevation and level from the bottom; each level is characterized by a specific level-ID, allowing the identification of the hierarchical structure; (4) a raster layer which stores the contributing watershed to each blue-spot; (5) a vector layer which associates each blue-spot with its corresponding pour-point (i.e., the lowest cell on the depression perimeter).
Concerning the flooding phase, Safer_RAIN returns: (1) a raster layer containing the water depth associated with each blue-spot; (2) an analogous layer reporting the water surface elevation (in meters above sea level) in each blue-spot; (3) a layer indicating the spilled rain volumes (i.e., water volume associated with the contributing watershed for each blue-spot); (4) a layer reporting the water volumes that are transferred to the contributing watershed (i.e., exceeding volumes) once each blue-spot is filled; (5) a vector layer containing the nodes connecting the different blue-spots; (6) a vector layer with the reaches connecting the different blue-spots; (7) a vector layer reporting the results of the simulated flooding (i.e., volume of rainwater fallen in each contributing watershed, volume of water contained within each blue-spot, degree of filling for each blue-spot, and volume of water spilled downstream for each blue-spot).
Note that Safer_RAIN is designed to run locally on computer devices as well as on Google Colaboratory (or Colab), exploiting free-to-use virtual machines provided at zero costs from Google.
3. Lignano Sabbiadoro Case Study: Pluvial Flooding of 11 September 2017
3.1. Study Area and Rainfall Event
Lignano Sabbiadoro is a municipality in the extreme South-western area of Friuli Venezia Giulia, North-eastern Italy (Administrative district of Udine, see Figure 5), counting about 7000 permanent residents and a population in excess of 200,000 people during the summer touristic season. The municipality consists of an 8-km long peninsula that is 1430 hectares wide. The peninsula separates the Grado and Marano lagoon from the Adriatic Sea and is located on the left wing of the large delta system of the Tagliamento River, with a low and sandy coast and a morphology characterized by the presence of sand dunes that form the southern ridge of the area. From the sea towards the inner part, the territory consists of a series of strips parallel to the coastline almost totally dried up by land reclamation, and the lagoon side, with embankments, sandbanks and mudflats. The land-use dynamics in this area are influenced by the strong touristic vocation of the district, which resulted in intense urban development in the last 35 years (see panel (c) in Figure 5). In particular, the strip towards the sea is almost totally urbanized. The remaining part of the territory mainly consists of flat areas, substantially derived from the reclamation of ancient lagoon areas.
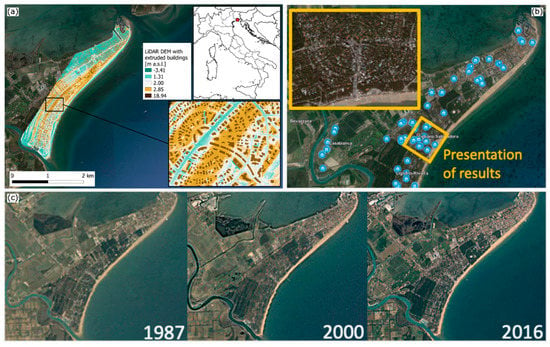
Figure 5.
Geographic and topographic setting of Lignano Sabbiadoro (Northern Italy). (a) 2 m LiDAR Digital Elevation Model (DEM) with extruded buildings; (b) reported requests for emergency services as a consequence of the 10–12 September, 2017 event, and selected area for the presentation of results. Panel (c) reports recent land-use dynamics for the years 1987, 2000 and 2016 (source: Google Earth).
In September 2017, Lignano Sabbiadoro was hit by a severe urban flooding caused by two intense rainstorms that produced a cumulative rainfall depth of 280 mm in the period 10–12 September 2017, with a maximum 5-h cumulative rainfall depth of 124 mm and a maximum rainfall intensity of 55 mm/h. According to the locally available annual maximum series of hourly rainfall depth (two sequences spanning from 1920 to 2018 with a total of 116 maxima for each duration, i.e., 1, 3, 6, 12 and 24 h) the return period of the event can be estimated in 50–100 years for duration between 6 and 12 h. The rainstorms caused the flooding of large portions of the urbanized area and serious inconvenience for commercial activities, bars, restaurants and households. The local Fire Department, Municipal Police, and Civil Protection counted about 250 emergency service requests during the event; panel (b) in Figure 5 shows the locations of recorded emergency calls reporting critical flooding during the event.
3.2. Safer_RAIN Reconstruction of 11 September 2017 Urban Flooding
We apply Safer_RAIN with the aim of reproducing the 2017 flooding event focusing, in particular, on simulating the urban flooding produced by the most intense episode of the rainfall event (cumulative 5-h rainfall depth, night between 10 and 11 September 2017). Safer_RAIN output is compared with ground evidences and benchmarking data obtained through a fully-2D hydrological-hydrodynamic model based upon the same input data.
3.2.1. Input Information
We apply Safer_RAIN using LiDAR data on a 2 m grid, obtained by resampling the 1 m resolution LiDAR DTM available from the Italian National Geoportal of the Italian Ministry of the Environment (Ministero dell’Ambiente e della Tutela del Territorio e del Mare), which we also modify for representing buildings (see Figure 5). We preprocess the DEM (i.e., top-down level-set method for identifying blue-spots and nested depressions) with a vertical resolution of 0.02 m and a user-specified threshold volume of 100 m3 (i.e., depressions with lower volumes are neglected). As shown in Figure 6, the application of the DEM preprocessing enables the identification of (i) blue-spots, (ii) spilling points (i.e., pour-points), and (iii) corresponding watersheds (see Figure 6a).
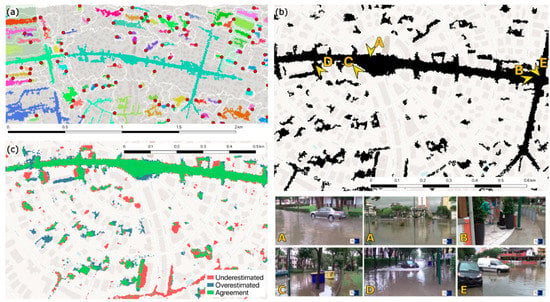
Figure 6.
Results of the application of Safer_RAIN to the case study of Lignano Sabbiadoro: (a) identification of blue-spots (binary maps, where each blue-spot is marked with a different color), spilling points (red dots) and watersheds (white lines); (b) identification of the flooded area resulting from the rainfall depth of 124 mm recorded for the urban flash-flood of the 11 September 2017; pictures (source: local TV-news footage, TGR Friuli Venezia Giulia) are provided for some points to highlight the ground evidence of flooded area; (c) comparison with a hydrodynamic model (red, blue and green colors indicate underestimation, overestimation and agreement, in this order).
3.2.2. Simulation, Validation and Benchmarking
The subsequent flooding phase is performed by considering a uniform rainfall depth of 124 mm and a completely impervious surface, given the limited spatial extent of Lignano Sabbiadoro case study and its high degree of urban development (see Figure 5). The simulation results in a map of inundated areas illustrated in Figure 6b.
We benchmark the approach by referring to the maximum water level simulated using the Hydro_AS-2D (developed by IBH, https://ib-humer.at, Geboltskirchen, Austria), a fully-2D hydrological-hydrodynamic model solving the shallow water equations, properly complemented with a special add-on which enables one to calculate pluvial flooding and to integrate a rainfall-runoff model into the calculation process. In particular, we consider the output of Hydro_AS-2D as “gold standard truth” by: referring to a duration of 5 h; considering a perfectly impervious surface; looking at the inundated areas at the end of the event (i.e., 24 h of simulation), to increase the consistency with Safer_RAIN conceptualization. Given the uncertainty of both Hydro_AS-2D and Safer_RAIN and the different discretization of the computational domain (i.e., raster-based for Safer_RAIN, unstructured mesh with triangular elements for Hydro_AS-2D), we regard as flooded only those pixels with at least 0.10 m of simulated water depth. We compare Safer_RAIN and Hydro_AS-2D output on the same 2 m discretization of the computational domain that we used for Safer_RAIN simulation. This requires a preliminary interpolation of Hydro_AS-2D output vector layer, which reports water depth simulated at each node of the computational mesh, by using the Inverse Distance Weighting (IDW) multivariate interpolation [39]. Then, we identify flooded areas according to both methods (i.e., agreement, or true positive, TP; see Figure 6c) and areas which are flooded according to one method but not the other (i.e., underestimation, or false negative, FN, and overestimation of the flooded area, or false positive, FP; see Figure 6c). In order to quantitatively assess the agreement between the two approaches, we compare the extent of flooded areas resulting from the two methods by means of the Flood Area Index (FAI; see e.g., [40,41]), defined as follows:
FAI may range from 0 to 1, where 1 indicates the perfect match between the flooded areas resulting from the comparison between the two methods (i.e., Safer_RAIN and benchmark model). For the case study of Lignano Sabbiadoro, we obtain a FAI equal to 0.53, meaning that the implemented HFSA shows an agreement of 53% for the flooded area evaluated with the benchmark model.
These results can be explained by considering that, differently from a hydrodynamic model, Safer_RAIN does not model flooding dynamics, and this can determine an underestimation of maximum water levels. On the other hand, Safer_RAIN guarantees a very fast computation of flooded areas, as terrain preprocessing is run only once and it fully characterizes the hierarchy for filling and spilling processes. The application of the algorithm on a 982 by 1068 grid (overall ~4 km2 at 2 m resolution) by means of a Google Colab virtual machine (two 2.30 GHz CPUs, cache of 46,080 kB and 12 GB RAM) running on one core required about 180 s for the preprocessing phase (with 0.02 m set-level and 100 m3 threshold volume) and about 9 s for the flooding phase (with cumulated rainfall of 124 mm), for a total of 189 s, definitely less than the 100,300 s required by Hydro_AS-2D for running on the same study area with 60 s time-step and 420 min time-frame.
4. Rimini Case Study: Sensitivity Analysis and Pluvial Flooding Scenarios
4.1. Study Area and Aims of the Investigations
Rimini is a municipality of about 150,000 inhabitants in the South-eastern zone of Emilia-Romagna, in Northern Italy (see Figure 7). Rimini is located on the Adriatic Sea; the coastal strip, made up of recent marine deposits, is bordered by a sandy beach, which is 15 km long and up to 200 m wide. Our analyses focus on a part of the historical city center and on the main and central area of the sea-front (see Figure 7), which is characterized by a high density of touristic infrastructures (accommodation, food and beverage, bathing facilities, etc.). In particular, Rimini case study is twofold: (1) on the one hand, we perform a sensitivity analysis of the Safer_RAIN algorithm for different synthetic rainfall events, carrying out a detailed comparison of its output with the output of analogous simulations run with Hydro_AS-2D, (2) on the other hand, we showcase the generation of pluvial flooding scenarios for current and future conditions, the latter referring to an extensive ongoing renovation project for the city seafront (known as “Parco del Mare”), by considering spatially distributed net-rainfall. Specifically, Parco del Mare project adopts nature-based solutions (NBSs) in improving the seafront promenade, where the existing road and parking system will be converted into an urban green infrastructure; around 2000 parking spaces are planned to be removed, restoring the area to its natural setting (vegetated sandy dunes, see Figure 7d).
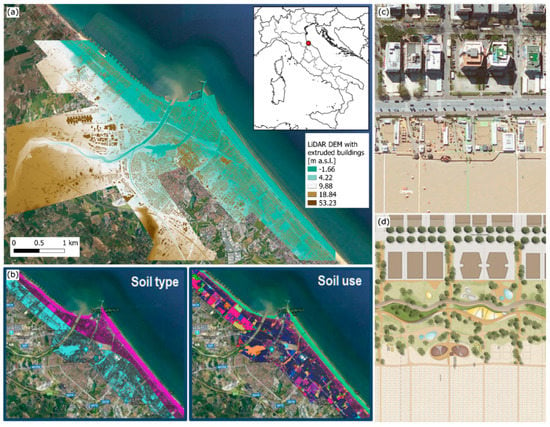
Figure 7.
Geographic and topographic setting of Rimini, Northern Italy: (a) location of the case study and 1 m LiDAR Digital Elevation Model (DEM) with extruded buildings; (b) soil-type and land-use maps for the study area; (c,d) current layout of the seafront (satellite image) and future green infrastructure according to the rehabilitation and renovation project Parco del Mare.
Safer_RAIN applications are carried out using the following input data: (i) a 1 m resolution LiDAR DEM (see Figure 7a), retrieved form the National Italian Geoportal, needed in the preprocessing phase for the identification of the blue-spots; (ii) a building footprint vector map retrieved from OpenStreetMap; (iii) land-use and soil infiltration capacity characteristics (i.e., ,,; see Equations (1)–(4) in Section 2.2) for both current and Parco del Mare scenarios (see Figure 7b).
Furthermore, our application considers a vertical resolution of 0.05 m in the preprocessing phase, to characterize each blue-spot with the level-set method. Also, we adopt a user-specified threshold volume of 200 m3, below which depressions are neglected in the flooding phase (as explained in Section 2.1).
4.2. Sensitivity Analysis
We apply Safer_RAIN to identify pluvial hazard hotspots within the municipality of Rimini by adopting uniform input rainfall depths from 10 to 130 mm (with steps of 10 mm). Based on an analysis of the annual maximum series of hourly rainfall depths that are available for the study area, a cumulative rainfall depth of 130 mm can be associated with an estimated return period ranging from 20–50 years to 200–300 years, if the duration of the event varies from 24 to 4 h, respectively. The highest 4-h cumulative rainfall depth in the archive is equal to 147.8 mm and was recorded between 4:00 p.m. and 8:00 p.m. on 24 June 2013, with a partial rainfall depth of 90.2 mm in the 30 min between 4.30 p.m. and 5:00 p.m. All synthetic rainfall depths are used as input to Safer_RAIN by assuming: (1) spatially uniform distribution; (2) perfectly impervious surface; (3) extruded buildings (see e.g., Figure 8).
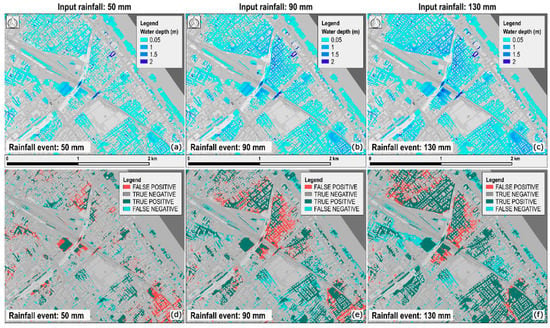
Figure 8.
Rimini case study: flooding phase output. (a–c) Water depth maps obtained under the assumptions of spatially uniform rainfall and impervious terrain and relative to three different synthetic rainfall depths (color-scale represents water depth values). (d–f) Comparison between Safer_RAIN and Hydro_AS-2D outputs: images report a classification of pixels into false positive (FP), true positive (TP), false negative (FN), and true negative (TN).
As done for the simulation of the event considered for Lignano Sabbiadoro (see Section 3), we compare Safer_RAIN and Hydro_AS-2D output and we refer to the latter as “gold standard truth”. Hydro_AS-2D simulations are performed by: referring to an event duration of 1 h; considering an impervious surface; looking at the inundated areas at the end of the event (i.e., 24 h of simulation). Comparing the output of the two approaches, we label each pixel as described for the Lignano Sabbiadoro case study, that is: true positive (TP); false positive (FP); false negative (FN). We also mark the true negative (TN) pixels, which represent a correct negative result (flood-free pixels). This enables us to perform a detailed sensitivity analysis by adopting a wide spectrum of standard performance metrics:
- True positive rate (or Sensitivity), which defines how many correct positive results occur among all positive samples of the benchmarking dataset:
- False negative rate (Error Type II, underestimation), which defines how many incorrect negative results occur among all positive samples of the benchmarking dataset:
- True negative rate (or Specificity), which defines how many correct negative results occur among all negative samples of the benchmarking dataset:
- False positive rate (Error Type I, overestimation), which defines how many incorrect positive results occur among all negative samples of the benchmarking dataset:
- Accuracy, which defines the number of correct assessments among all the samples of the benchmarking dataset:
- Matthew Correlation Coefficient (MCC), which is a measure of correlation between the binary classifications
MCC spans between −1 (total disagreement between prediction and benchmark model) and +1 (perfect match between prediction and benchmark model); a value of MCC equal to 0 suggests that results are no better than a random prediction.
The above-mentioned performance metrics related to the comparison between Safer_RAIN and Hydro_AS-2D outputs for the entire study area for the different rainfall scenarios (from 10 to 130 mm) are reported in Table 1. We observe that the proper identification of flooded areas improves noticeably with increasing rainfall depths (i.e., sensitivity, , increases from 58% to 70%, and underestimation, , decreases from 42% to 30%; Matthew Correlation, , increases from 0.07 to 0.74). At the same time, specificity () and overestimation () show good performances for all the considered rainfall depths, with values in the range of 98–99% and 1–2%, respectively. Similar results are observed in terms of accuracy (), which assumes values in the range of 0.96–0.99. All the considered metrics highlight the accuracy and reliability of pluvial flooding maps produced by Safer_RAIN for Rimini, especially for higher rainfall depths.

Table 1.
Safer_RAIN performances obtained by comparing the obtained flood hazard maps with the benchmarking maps (2D-hydrologic-hydrodynamic maps) for several rainfall scenarios.
4.3. Pluvial Flooding Scenario under Different Land-Use Hypotheses
This paragraph showcases a Safer_RAIN application to the Rimini case study aimed at assessing pluvial flooding scenarios under different land-use hypotheses. In particular, we consider current and future land-use conditions, the latter referring to the nature-based project Parco del Mare (see Figure 7). To this aim, we focus on two rainfall events characterized by the same rainfall depth (i.e., 90 mm) but different durations (i.e., a 1-h cloudburst, associated with return period of ~300 years, and a 24-h rainstorm, return period of ~3 years), and apply Safer_RAIN by implementing the pixel-based adaptation of the event-based Green-Ampt infiltration model (see Section 2.2) to handle spatially variable infiltration losses and, therefore, spatially variable net-rainfall. The pixel-based characterization of the study area in terms of the Green-Ampt parameters (i.e., , , , ; see Section 2.2) is done based on the soil use and soil type maps made available by Emilia-Romagna Region, where we also account for changes in soil use (and, therefore, reductions in soil sealing, or imperviousness) induced by Parco del Mare. From the application of the Green-Ampt infiltration module, we obtain the net-rainfall maps reported in Figure 9. As expected, for equal rainfall depth (i.e., 90 mm), the higher is the duration the lower is the net-rainfall obtained for permeable areas (see panels (a) and (b) in Figure 9 for the current land-use scenario). Figure 9 also highlights the differences in net-rainfall associated with the considered land-use scenarios, which are more marked for the 1-h than for the 24-h event (see panels (c) and (d) in Figure 9, respectively); this means that NBSs and green infrastructures adopted within the Parco del Mare project are most effective relative to high-intensity and low-duration cloudburst events, like the extreme event of June 2013.
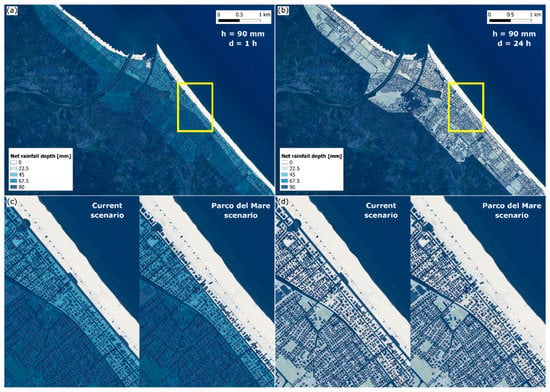
Figure 9.
Rimini case study: rainfall events used for assessing the effectiveness of Parco del Mare urban green-infrastructure. (a,b) Spatially variable net-rainfall maps relative to the current land-use scenario and to two uniformly-distributed events having same rainfall depth (i.e., 90 mm) but different duration, (a) 1 h (return period of ~300 years), and (b) 24 h (return period of ~3 years), and spatially variable infiltration losses (see also Section 2.2). For the area identified by the yellow boxes, panels (c) and (d) compare the net-rainfall maps for the current and Parco del Mare land-use scenarios and for the 1-h and 24-h events, respectively.
The water depth maps obtained for the 1-h and 24-h rainfall events are reported in Figure 10, which shows that, consistent with what observed for net-rainfall, in permeable areas water depth is expected to decrease with higher durations (see panels (a) and (b) for the current land-use scenario; analogous results are obtained also for the Parco del Mare layout). This outcome further highlights the importance of accounting for infiltration losses in the identification of flooded area and associated water depths for rainfall events with different durations.
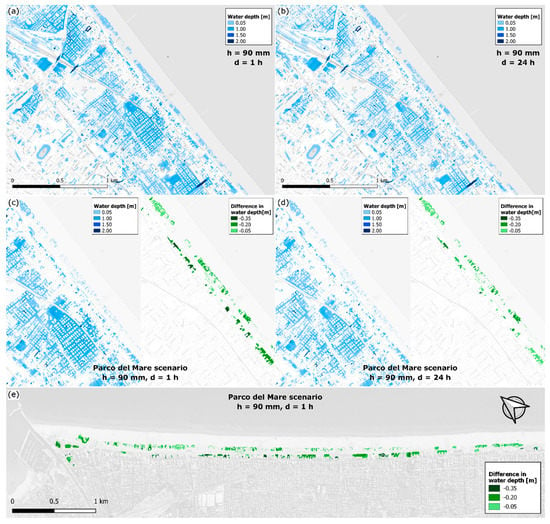
Figure 10.
Rimini case study: water depth maps simulated with Safer_RAIN for the two considered synthetic events (see also Figure 9): 1-h (a) and 24-h (b) rainfall events for the current land-use scenario; (c,d) simulated water depth for the 1-h (c) and 24-h (d) rainfall events and the Parco del Mare land-use scenario (urban green-infrastructure, left) and differences in water depth compared to the current layout (right); (e) 90 mm 1-h rainfall event, simulated water depth for the Parco del Mare urban green infrastructure minus the simulated water depth for the current land-use scenario along the seafront.
For the 1-h rainfall event, panels (c) and (e) in Figure 10 also show the advantages associated with Parco del Mare NBSs, which are much more visible along the seafront, where decreases in water depth up to 0.35 m can be reached. Less relevant improvements can be identified relative to the 24-h event (see panel (d) in Figure 10), for which the contribution of infiltration losses is more remarkable in both land-use layouts, consistent with what already observed for the corresponding net-rainfall maps (see panels (c) and (d) in Figure 9).
This application highlights the utility of Safer_RAIN for a rapid assessment of pluvial hazard hotspots considering infiltration losses under different land-use scenarios and for different rainstorm characteristics. In particular, the application of the algorithm on a 6922 by 10,335 grid (overall ~72 km2 at 1 m resolution) on a Google Colab virtual machine (two 2.30 GHz CPUs, cache of 46,080 kB, 12 GB RAM) running on one core required about 293 s for the preprocessing phase (with 0.05 m set-level and 200 m3 threshold volume) and about 29 s for the flooding phase (e.g., spatially distributed net-rainfall for the 1-h event), for a total of 322 s, definitely less than the 25,000 s required by Hydro_AS-2D for running on the same study area with 300 s time-step and 180 min time-frame.
5. Discussion and Future Work
Our analyses confirm that terrain data available from modern LiDAR technology are sufficiently accurate and resolved for simulating pluvial flooding in urban areas, and that blending such data with digital map data of building topology and land use can help to enhance pluvial flood-hazard assessment and mapping in urban areas. Small differences in water elevation and micro-topographic barriers can combine in urban settings to produce significant differences in inundated area and water depth, potentially resulting in deadly pitfalls. Accurately and effectively locating these urban hazard hotspots is therefore of paramount importance.
The application of the raster-based tool Safer_RAIN to Lignano Sabbiadoro (see Section 3) and Rimini (see Section 4) shows that observed pluvial flooding events resulting from severe and very intense cloudbursts can be accurately reproduced even under oversimplified working hypotheses (i.e., spatially uniform precipitation, impervious surface). On the other hand, Safer_RAIN characteristics make it very useful for a straightforward application to spatially variable precipitation (e.g., weather radar) and spatially variable infiltration losses (e.g., capacity of storm water drainage systems, variable land-cover and infiltration rates), as illustrated for Rimini (see Section 4). In this regard, it is important to highlight that the algorithm is capable of incorporating previous flood levels, by simply adding the upstream flooding volume as a raster input (added to the raster layer describing the precipitation); the potential of such an application could be investigated in future studies.
It must be noted that, differently from hydrodynamic models, Safer_RAIN cannot reproduce the flooding dynamics; thus, results do not provide indication on timing, nor velocity. Also, this can produce underestimation of maximum water levels, as backwater effects cannot be fully and properly reproduced, and routing is not modelled. On the other hand, Safer_RAIN guarantees a very fast computation of flooded areas, as terrain preprocessing is run only once and it fully characterizes the hierarchy of depressions for filling and spilling processes. Indeed, the application of the algorithm by means of Google Colab virtual machine (two 2.30 GHz CPUs, cache of 46,080 kB, 12 GB RAM) running on one core requires about 90 s for the preprocessing phase (with 0.05 m set-level and 100 m3 threshold volume) and about 9 s for the flooding phase (with cumulated rainfall of 124 mm) for Lignano Sabbiadoro (982 by 1068 grid, e.g., ~4 km2 at 2 m resolution), whereas the more demanding Rimini case study (6922 by 10,335 grid, e.g., ~72 km2 at 1 m resolution) requires about 293 s for the preprocessing phase (with 0.05 m set-level and 200 m3 threshold volume) and about 29 s for the flooding phase (e.g., spatially distributed net-rainfall for the 1-h event). The use of the above-mentioned virtual machine makes the computational effectiveness of Safer_RAIN algorithm even clearer: using a standard 4 GHz single core would approximately halve the runtime, and parallelization would further shrink the computational time
Overall, the outcomes of our study show that Safer_RAIN is a useful tool for the identification of pluvial-hazard hotspots and the optimal location of detention tanks and ponds; moreover, it can be used for identifying pluvial flooding scenarios useful, for instance, to define evacuation plans. Also, it is a convenient tool for rapidly assessing pluvial flooding hazard and risk dynamics associated with climate and land-use changes scenarios.
6. Conclusions
The steady increase in the last decades of economic losses and social consequences caused by hydrological extreme events in Europe (see e.g., [41,42]) has triggered the need for improving the assessment of pluvial, fluvial and coastal flood hazards and risks in European cities. Heavy rainfall events can be extremely concentrated in time and space and activate high-intensity runoff processes. In urban environments, which are mostly impervious, these reach their maximum hydraulic complexity due to quick-response runoff. Therefore, computational effective tools for rapidly assessing pluvial flooding hazard and risk in large urban areas are of paramount importance, as flood hazard and risk concentrates in these areas, where the majority of at-risk assets are located.
Nowadays, detailed and accurate flood inundation maps can be obtained by means of hydrological and hydraulic models. However, as their practical application is highly resources intensive, consistent high-resolution flood hazard maps across large residential and urban areas are still lacking. In this context, given the increasing availability of LiDAR high-resolution DEMs, our study assesses the potential of fast-processing DEM-based algorithms for consistent flood hazard characterization, with special focus on fluvial and pluvial flooding.
Urban districts are characterized by deeply altered topographic surfaces and frequent and large flat and sub-horizontal areas. Our study tests the potential of a DEM-based Hierarchical Filling-&-Spilling algorithm, named Safer_RAIN, which simulates urban flooding due to severe rainstorms by identifying surface depressions and their hierarchical structure by analyzing high resolution LiDAR DEMs. We performed a demonstrative application of Safer_RAIN for the case study of Lignano Sabbiadoro (Friuli Venezia Giulia, North-eastern Italy), with particular focus on the urban pluvial flooding caused by the severe rainstorm of the 11 September 2017, and an extensive sensitivity analysis for the city of Rimini for two different land-use scenarios. The comparison with a benchmark 2D hydrodynamic model confirmed the accuracy and reliability of pluvial flooding maps produced by Safer_RAIN in both cases, Lignano Sabbiadoro (i.e., agreement of 53% for the flooded area evaluated with the benchmark model) and Rimini (i.e., accuracy values in the range of 0.96–0.99). Main sources of error relative to the benchmark numerical 2D hydrodynamic scheme can be explained by considering that, differently from a hydrodynamic model, Safer_RAIN does not incorporate any detailed description of the dynamics of overland flow and water-depth routing. On the other hand, Safer_RAIN guarantees a very fast computation of flooded areas, and, on the basis of the results of Rimini applications, it was shown to be very effective in identifying pluvial-hazard hotspots, handling spatially distributed rainfall and rapidly assessing the pluvial flooding hazard associated with different land-use scenarios.
The outcomes of Safer_RAIN can provide useful information for risk assessment and management to different stakeholders and purposes: city council and land use planners for designing cloudburst mitigation and adaptation plans in cities (e.g., assessing the effectiveness of stormwater detentions ponds and nature-based solutions for urban flood risk mitigation), multi-utility companies for localizing sewage system hotspots where to invest in improving the drainage networks both with grey and green infrastructures; insurance companies for better profiling pluvial risk in cities and invest in climate mitigation strategies; evacuation planning for civil protection purposes, exploiting the capability to provide pluvial flood hazard maps in quasi real-time.
Author Contributions
Conceptualization, C.S., S.B., and A.C.; methodology, C.S., S.B., V.L., P.M., A.C.; software, C.S., S.P., S.B., V.L., P.M., A.C.; validation, C.S., S.P., S.B., G.H., A.R., A.E., M.A., A.C.; formal analysis, C.S., S.P., S.B., G.H., A.R.; investigation, C.S., S.P., S.B., A.C.; resources, S.B., A.C.; data curation, S.B., V.L., P.M., G.H., A.R., A.E., M.A., A.C.; writing—original draft preparation, C.S., S.P., S.B., A.C.; writing—review and editing, C.S., S.P., S.B., A.E., M.A., A.C.; visualization, C.S., S.P., S.B., A.C.; supervision, S.B., J.M., A.C.; project administration, S.B., J.M., A.C.; funding acquisition, S.B., J.M., A.C. All authors have read and agreed to the published version of the manuscript.
Funding
This research was funded by the EIT Climate-KIC Demonstrator project “SaferPLACES—Improved assessment of pluvial, fluvial and coastal flood hazards and risks in European cities as a mean to build safer and resilient communities” (Grant Agreement number: 190189; Task ID: EIT_2.2.37_200246_P125_1A).
Acknowledgments
The analyses presented in the study are conducted within the EIT Climate-KIC research project SaferPLACES (Improved assessment of pluvial, fluvial and coastal flood hazards and risks in European cities as a mean to build safer and resilient communities). The overall aim of the project is to explore and develop innovative and simplified modeling techniques to assess and map pluvial, fluvial and coastal flood hazard and risk in urban environments under current and future climates, mainly based on high-resolution LiDAR DEMs raster-based analysis. The service is designed to identify and assess flood risk mitigation measures and plans, inform climate adaptation and disaster risk reduction strategies, and foster multi-stakeholder agreements and partnership for resilience building.
Conflicts of Interest
The authors declare no conflict of interest.
References
- EEA—European Environment Agency. Economic Losses from Climate-Related Extremes in Europe. 2019. Available online: https://www.eea.europa.eu/data-and-maps/indicators/direct-losses-from-weather-disasters-3/assessment-2 (accessed on 18 April 2020).
- Apreda, C. Climate change, urban vulnerability and adaptation strategies to pluvial flooding. UPL. J. Urban Plan. Landsc. Environ. Des. 2016, 1, 233. [Google Scholar] [CrossRef]
- Pistocchi, A. Hydrological impacts of soil sealing and urban land take. In Urban Expansion, Land Cover and Soil Ecosystem Services; Routledge/Taylor & Francis Group: London, UK; New York, NY, USA, 2017; ISBN 978-1-138-88509-7. [Google Scholar]
- UN-Habitat. Cities and Climate Change; Global report on human settlements; UN-Habitat, Ed.; Earthscan: London, UK, 2011; ISBN 978-92-1-132296-5. [Google Scholar]
- Tapia, C.; Abajo, B.; Feliu, E.; Mendizabal, M.; Martinez, J.A.; Fernández, J.G.; Laburu, T.; Lejarazu, A. Profiling urban vulnerabilities to climate change: An indicator-based vulnerability assessment for European cities. Ecol. Indic. 2017, 78, 142–155. [Google Scholar] [CrossRef]
- Guerreiro, S.B.; Glenis, V.; Dawson, R.J.; Kilsby, C. Pluvial Flooding in European Cities—A Continental Approach to Urban Flood Modelling. Water 2017, 9, 296. [Google Scholar] [CrossRef]
- Parker, D.J.; Priest, S.J.; McCarthy, S.S. Surface water flood warnings requirements and potential in England and Wales. Appl. Geogr. 2011, 31, 891–900. [Google Scholar] [CrossRef]
- Schmitt, T.G.; Thomas, M.; Ettrich, N. Analysis and modeling of flooding in urban drainage systems. J. Hydrol. 2004, 299, 300–311. [Google Scholar] [CrossRef]
- Pitt, M. Learning Lessons from the 2007 Floods; The Pitt Review; Cabinet Office: London, UK, 2008. [Google Scholar]
- Leal, M.; Boavida-Portugal, I.; Fragoso, M.; Ramos, C. How much does an extreme rainfall event cost? Material damage and relationships between insurance, rainfall, land cover and urban flooding. Hydrol. Sci. J. 2019, 64, 673–689. [Google Scholar] [CrossRef]
- Zhang, S.; Pan, B. An urban storm-inundation simulation method based on GIS. J. Hydrol. 2014, 517, 260–268. [Google Scholar] [CrossRef]
- Amaguchi, H.; Kawamura, A.; Olsson, J.; Takasaki, T. Development and testing of a distributed urban storm runoff event model with a vector-based catchment delineation. J. Hydrol. 2012, 420–421, 205–215. [Google Scholar] [CrossRef]
- Looper, J.P.; Vieux, B.E. An assessment of distributed flash flood forecasting accuracy using radar and rain gauge input for a physics-based distributed hydrologic model. J. Hydrol. 2012, 412–413, 114–132. [Google Scholar] [CrossRef]
- Ouyang, W.; Guo, B.; Hao, F.; Huang, H.; Li, J.; Gong, Y. Modeling urban storm rainfall runoff from diverse underlying surfaces and application for control design in Beijing. J. Environ. Manag. 2012, 113, 467–473. [Google Scholar] [CrossRef]
- Nobre, A.D.; Cuartas, L.A.; Hodnett, M.; Rennó, C.D.; Rodrigues, G.; Silveira, A.; Waterloo, M.; Saleska, S. Height Above the Nearest Drainage—A hydrologically relevant new terrain model. J. Hydrol. 2011, 404, 13–29. [Google Scholar] [CrossRef]
- Jafarzadegan, K.; Merwade, V. A DEM-based approach for large-scale floodplain mapping in ungauged watersheds. J. Hydrol. 2017, 550, 650–662. [Google Scholar] [CrossRef]
- Manfreda, S.; Samela, C. A digital elevation model based method for a rapid estimation of flood inundation depth. J. Flood Risk Manag. 2019, 12, e12541. [Google Scholar] [CrossRef]
- Tavares da Costa, R.; Manfreda, S.; Luzzi, V.; Samela, C.; Mazzoli, P.; Castellarin, A.; Bagli, S. A web application for hydrogeomorphic flood hazard mapping. Environ. Model. Softw. 2019, 118, 172–186. [Google Scholar] [CrossRef]
- Tehrany, M.S.; Jones, S.; Shabani, F. Identifying the essential flood conditioning factors for flood prone area mapping using machine learning techniques. CATENA 2019, 175, 174–192. [Google Scholar] [CrossRef]
- Rennó, C.D.; Nobre, A.D.; Cuartas, L.A.; Soares, J.V.; Hodnett, M.G.; Tomasella, J.; Waterloo, M.J. HAND, a new terrain descriptor using SRTM-DEM: Mapping terra-firme rainforest environments in Amazonia. Remote Sens. Environ. 2008, 112, 3469–3481. [Google Scholar] [CrossRef]
- Samela, C.; Troy, T.J.; Manfreda, S. Geomorphic classifiers for flood-prone areas delineation for data-scarce environments. Adv. Water Resour. 2017, 102, 13–28. [Google Scholar] [CrossRef]
- Chu, X.; Yang, J.; Chi, Y.; Zhang, J. Dynamic puddle delineation and modeling of puddle-to-puddle filling-spilling-merging-splitting overland flow processes. Water Resour. Res. 2013, 49, 3825–3829. [Google Scholar] [CrossRef]
- Wu, Q.; Lane, C.R. Delineating wetland catchments and modeling hydrologic connectivity using lidar data and aerial imagery. Hydrol. Earth Syst. Sci. 2017, 21, 3579–3595. [Google Scholar] [CrossRef]
- Balstrøm, T.; Crawford, D. Arc-Malstrøm: A 1D hydrologic screening method for stormwater assessments based on geometric networks. Comput. Geosci. 2018, 116, 64–73. [Google Scholar] [CrossRef]
- Wu, Q.; Lane, C.R.; Wang, L.; Vanderhoof, M.K.; Christensen, J.R.; Liu, H. Efficient Delineation of Nested Depression Hierarchy in Digital Elevation Models for Hydrological Analysis Using Level-Set Method. JAWRA J. Am. Water Resour. Assoc. 2018, 55, 354–368. [Google Scholar] [CrossRef]
- Wang, L.; Liu, H. An efficient method for identifying and filling surface depressions in digital elevation models for hydrologic analysis and modelling. Int. J. Geogr. Inf. Sci. 2006, 20, 193–213. [Google Scholar] [CrossRef]
- Huang, H.; Chen, X.; Wang, X.; Wang, X.; Liu, L. A Depression-Based Index to Represent Topographic Control in Urban Pluvial Flooding. Water 2019, 11, 2115. [Google Scholar] [CrossRef]
- Wang, N.; Chu, X. A New Algorithm for Delineation of Surface Depressions and Channels. Water 2019, 12, 7. [Google Scholar] [CrossRef]
- Horton, R.E. Analysis of runoff-plat experiments with varying infiltration-capacity. Eos Trans. Am. Geophys. Union 1939, 20, 693–711. [Google Scholar] [CrossRef]
- Sharp, A.L.; Holtan, H.N. Extension of graphic methods of analysis of sprinkled-plots hydrographs to the analysis of hydrographs of control-plots Small Homogeneous watersheds. Eos Trans. Am. Geophys. Union 1942, 23, 578–593. [Google Scholar] [CrossRef]
- Crawford, N.H.; Linsley, R.K. Digital Simulation in Hydrology’ Stanford Watershed Model 4; Stanford University: Stanford, CA, USA, 1966. [Google Scholar]
- Ullah, W.; Dickinson, W.T. Quantitative description of depression storage using a digital surface model: I. Determination of depression storage. J. Hydrol. 1979, 42, 63–75. [Google Scholar] [CrossRef]
- Ullah, W.; Dickinson, W.T. Quantitative description of depression storage using a digital surface model: II. Characteristics of surface depressions. J. Hydrol. 1979, 42, 77–90. [Google Scholar] [CrossRef]
- Chu, X.; Zhang, J.; Chi, Y.; Yang, J. An Improved Method for Watershed Delineation and Computation of Surface Depression Storage. Watershed Manag. 2010, 1113–1122. [Google Scholar] [CrossRef]
- O’Callaghan, J.F.; Mark, D.M. The extraction of drainage networks from digital elevation data. Comput. Vis. Graph. Image Process. 1984, 28, 323–344. [Google Scholar] [CrossRef]
- Wu, Q.; Liu, H.; Wang, S.; Yu, B.; Beck, R.; Hinkel, K. A localized contour tree method for deriving geometric and topological properties of complex surface depressions based on high-resolution topographical data. Int. J. Geogr. Inf. Sci. 2015, 29, 2041–2060. [Google Scholar] [CrossRef]
- Green, W.H.; Ampt, G.A. Studies on Soil Physics 1, The Flow of Air and Water through Soils. J. Agric. Sci. 1911, 4, 1–24. [Google Scholar] [CrossRef]
- Chow, V.; Maidment, D.; Mays, L. Applied Hydrology, 1st ed.; McGraw-Hill Science/Engineering/Math: New York, NY, USA, 1988. [Google Scholar]
- Watson, D.F.; Philip, G.M. A Refinement of Inverse Distance Weighted Interpolation. Geoprocessing 1985, 2, 315–327. [Google Scholar]
- Falter, D.; Vorogushyn, S.; Lhomme, J.; Apel, H.; Gouldby, B.; Merz, B. Hydraulic model evaluation for large-scale flood risk assessments. Hydrol. Process. 2013, 27, 1331–1340. [Google Scholar] [CrossRef]
- Carisi, F.; Domeneghetti, A.; Gaeta, M.G.; Castellarin, A. Is anthropogenic land subsidence a possible driver of riverine flood-hazard dynamics? A case study in Ravenna, Italy. Hydrol. Sci. J. 2017, 62, 2440–2455. [Google Scholar] [CrossRef]
- Guha-Sapir, D.; Below, R.; Hoyois, P. EM-DAT | The International Disasters Database. Available online: https://www.emdat.be/ (accessed on 18 April 2020).
© 2020 by the authors. Licensee MDPI, Basel, Switzerland. This article is an open access article distributed under the terms and conditions of the Creative Commons Attribution (CC BY) license (http://creativecommons.org/licenses/by/4.0/).