Article

Determination of Empirical Rainfall Thresholds for Shallow Landslides in Slovenia Using an Automatic Tool

by
Galena Jordanova
1,*,
Stefano Luigi Gariano
2,
Massimo Melillo
2,
Silvia Peruccacci
2,
Maria Teresa Brunetti
2 and
Mateja Jemec Auflič
3
1
Faculty of Natural Sciences and Engineering, Department of Geology, University of Ljubljana, 1000 Ljubljana, Slovenia
2
CNR-IRPI—Research Institute for Geo-Hydrological Protection of the Italian National Research Council, 06127 Perugia, Italy
3
Geological Survey of Slovenia, 1000 Ljubljana, Slovenia
*
Author to whom correspondence should be addressed.
Water 2020, 12(5), 1449; https://doi.org/10.3390/w12051449
Submission received: 29 April 2020 / Revised: 14 May 2020 / Accepted: 18 May 2020 / Published: 19 May 2020

Abstract

:
Rainfall-triggered shallow landslides represent a major threat to people and infrastructure worldwide. Predicting the possibility of a landslide occurrence accurately means understanding the trigger mechanisms adequately. Rainfall is the main cause of slope failures in Slovenia, and rainfall thresholds are among the most-used tools to predict the possible occurrence of rainfall-triggered landslides. The recent validation of the prototype landslide early system in Slovenia highlighted the need to define new reliable rainfall thresholds. In this study, several empirical thresholds are determined using an automatic tool. The thresholds are represented by a power law curve that links the cumulated event rainfall (E, in mm) with the duration of the rainfall event (D, in h). By eliminating all subjective criteria thanks to the automated calculation, thresholds at diverse non-exceedance probabilities are defined and validated, and the uncertainties associated with their parameters are estimated. Additional thresholds are also calculated for two different environmental classifications. The first classification is based on mean annual rainfall (MAR) with the national territory divided into three classes. The area with the highest MAR has the highest thresholds, which indicates a likely adaptation of the landscape to higher amounts of rainfall. The second classification is based on four lithological units. Two-thirds of the considered landslides occur in the unit of any type of clastic sedimentary rocks, which proves an influence of the lithology on the occurrence of shallow landslides. Sedimentary rocks that are prone to weathering have the lowest thresholds, while magmatic and metamorphic rocks have the highest thresholds. Thresholds obtained for both classifications are far less reliable due to the low number of empirical points and can only be used as indicators of rainfall conditions for each of the classes. Finally, the new national thresholds for Slovenia are also compared with other regional, national, and global thresholds. The thresholds can be used to define probabilistic schemes aiming at the operative prediction of rainfall-induced shallow landslides in Slovenia, in the framework of the Slovenian prototype early warning system.

1. Introduction

Landslides are one of the most common hazardous natural phenomena in Slovenia and worldwide, threatening the safety of local residents and damaging infrastructure. The main triggering factor of shallow landslides in Slovenia is rainfall, especially short and intense rainstorms, combined with local geological, geomorphological and climatic conditions [1]. In recent decades, intensive rainfall events have become much more frequent. This is also due to global climate change, which leads to a high number of shallow slope failures [2]. Every year dozens to hundreds of new shallow landslides are recorded in Slovenia. Many of them cause damage to infrastructure and properties, including residential buildings and agricultural land. To mitigate possible serious consequences and damage, the use of a landslide early warning system (LEWS) is fundamental. To operate a successful LEWS, it is essential to understand the relationship between rainfall and landslide occurrence. This relationship is commonly defined by means of empirical rainfall thresholds. The calculation of rainfall thresholds for landslide triggering has been a major challenge over the last few decades. Campbell [3] was the first to demonstrate the connection between antecedent rainfall and its infiltration into low-permeable rocks with the triggering of landslides. Nilsen and Turner [4] also proved the impact of rainstorms and antecedent rainfall on the occurrence of slope mass movements and calculated threshold values for the investigated area. Caine [5] proposed a power law equation linking mean rainfall intensity (I) and duration of the rainfall event (D) based on data from different geological, morphological and climatic settings. Since then many different methods and algorithms have been developed for calculating rainfall thresholds [6,7,8]. LEWSs based on thresholds of different types have been implemented in many countries and regions [9,10], e.g., for the coastal areas of San Francisco [11,12], the metropolitan areas of Rio de Janeiro [13,14] and Vancouver [15], southern Taiwan [16], Italy [17] and regions in Italy such as Emilia-Romagna [18], Piedmont [19], Tuscany [20,21,22] and Sicily [23].
In Slovenia, Komac [1] calculated rainfall thresholds for individual lithological units on the entire Slovenian territory using the statistical chi-square method. Jemec Auflič and Komac [24] analyzed rainfall patterns for shallow landslides in the Škofjeloško-Cerkljansko hills during six major rainfall events between 1991 and 2010, while Rosi et al. [25] used the MaCumBA (MAssive CUMulative Brisk Analyzer) algorithm by Segoni et al. [26] to determine the first mean intensity-duration ID thresholds on a regional scale and for four major river zones in Slovenia. Bezak et al. [27] determined empirical thresholds for flash floods and landslides in Slovenia using a copula-based method. Bezak et al. [28] also worked on the application of hydrological modelling for temporal prediction of shallow landslides, while Jordanova et al. [29] focused on the determination of empirical thresholds for shallow landslides in the Posavsko hills, Eastern Slovenia, with an analysis of antecedent rainfall and the intensity of seven major rainfall events between 2013 and 2017.
With the aim of improving prevention measures, the prototype of a LEWS for Slovenia was developed in 2013 [30]. The system is based on the comparison between the forecasted precipitation for the next 24 h and rainfall thresholds, determined using the chi-square method and 40 years of average rainfall correlated to the lithological unit [1]. Recently, a validation of this LEWS was carried out [29,31] and demonstrated the need for new thresholds.
The definition of empirical rainfall thresholds is often affected by subjective criteria, such as the definition of the rainfall events responsible for landslide triggering, and by uncertainties, such as the quality of rainfall data and the accuracy of the location and timing of landslide occurrences [32,33]. To avoid any subjective bias in the results, Melillo et al. [34,35] proposed an algorithm for the automatic calculation of thresholds for rainfall-induced landslides, which was improved and implemented in a software tool (CTRL-T, Calculation of Thresholds for Rainfall-induced Landslides Tool) [32]. The tool uses objective, standardized criteria for the automatic reconstruction of landslide-triggering rainfall conditions, based on historical rainfall records and landslide occurrence dates. It was applied by several authors in diverse environments in Italy [32,36], India [37] and Bhutan [38].
According to the determination of the amount of rainfall responsible for the landslide occurrence, we propose new rainfall thresholds, calculated using CTRL-T, for the entire national territory of Slovenia and for climatic and geological subdivisions. The new national rainfall thresholds are compared with the global and regional thresholds proposed by Caine [5], Guzzetti et al. [6,7], Rosi et al. [24], Peruccacci et al. [39] and Palladino et al. [40].

2. Study Area

Slovenia (20,273 km2) lies in Central Europe in the southeastern part of the Alps (Figure 1). The sparse landscape and the diverse geological conditions range from the Pannonian plains and hills and their sediments in the northeast through the Alpine foothills in the Prealpine region (East to Western Slovenia) to the Alpine region in the northwest and the Eocene flysch in the southwestern Mediterranean plateau. The tectonic and structural elements, intersecting the area, have led to unstable rock masses and landslide-prone conditions [41].
The rainfall is unevenly distributed over the country due to its location between the Alps, the Dinarides, the Pannonian Basin and the Adriatic Sea, which contributes to the Mediterranean climate conditions (Figure 1). According to the Slovenian Environment Agency (ARSO), the annual average precipitation between 1981 and 2010 shows that the western part of Slovenia (excluding the southwestern coastal area) and especially the northwestern Alpine region is the rainiest part [42]. The average annual rainfall ranges from 1600 mm to over 3200 mm in the Julian Alps. Rain clouds usually move north and east towards the Alps and Dinarides, which serve as an orographic barrier. Many deep-seated landslides and debris flows (e.g., Stože, Slano Blato, Potoška Planina) are present in the western and northwestern parts of Slovenia, while the east is more prone to shallow landslides. The less rainy area in the northeast accumulates on average almost 1000 mm per year.

3. Methods and Data

3.1. CTRL-T Tool and Threshold Equation

CTRL-T is a tool for the automatic calculation of rainfall thresholds for their use in operative prediction of shallow landslides [32]. The calculation of thresholds is based on continuous sets of hourly rainfall data gathered from rain gauges, and on a landslide database, consisting of known locations (geographic coordinates) and times (accurate dates and, when available, hour) of landslide occurrences. The tool reconstructs rainfall events and determines the events that are more likely to be responsible for the observed slope failures. Two important input parameters were defined prior to the identification of rainfall events, i.e., (i) the maximum permissible distance between the representative rain gauge and the landslide (15 km) and (ii) the maximum acceptable delay between the end of a rainfall event and the occurrence of a landslide (48 h).
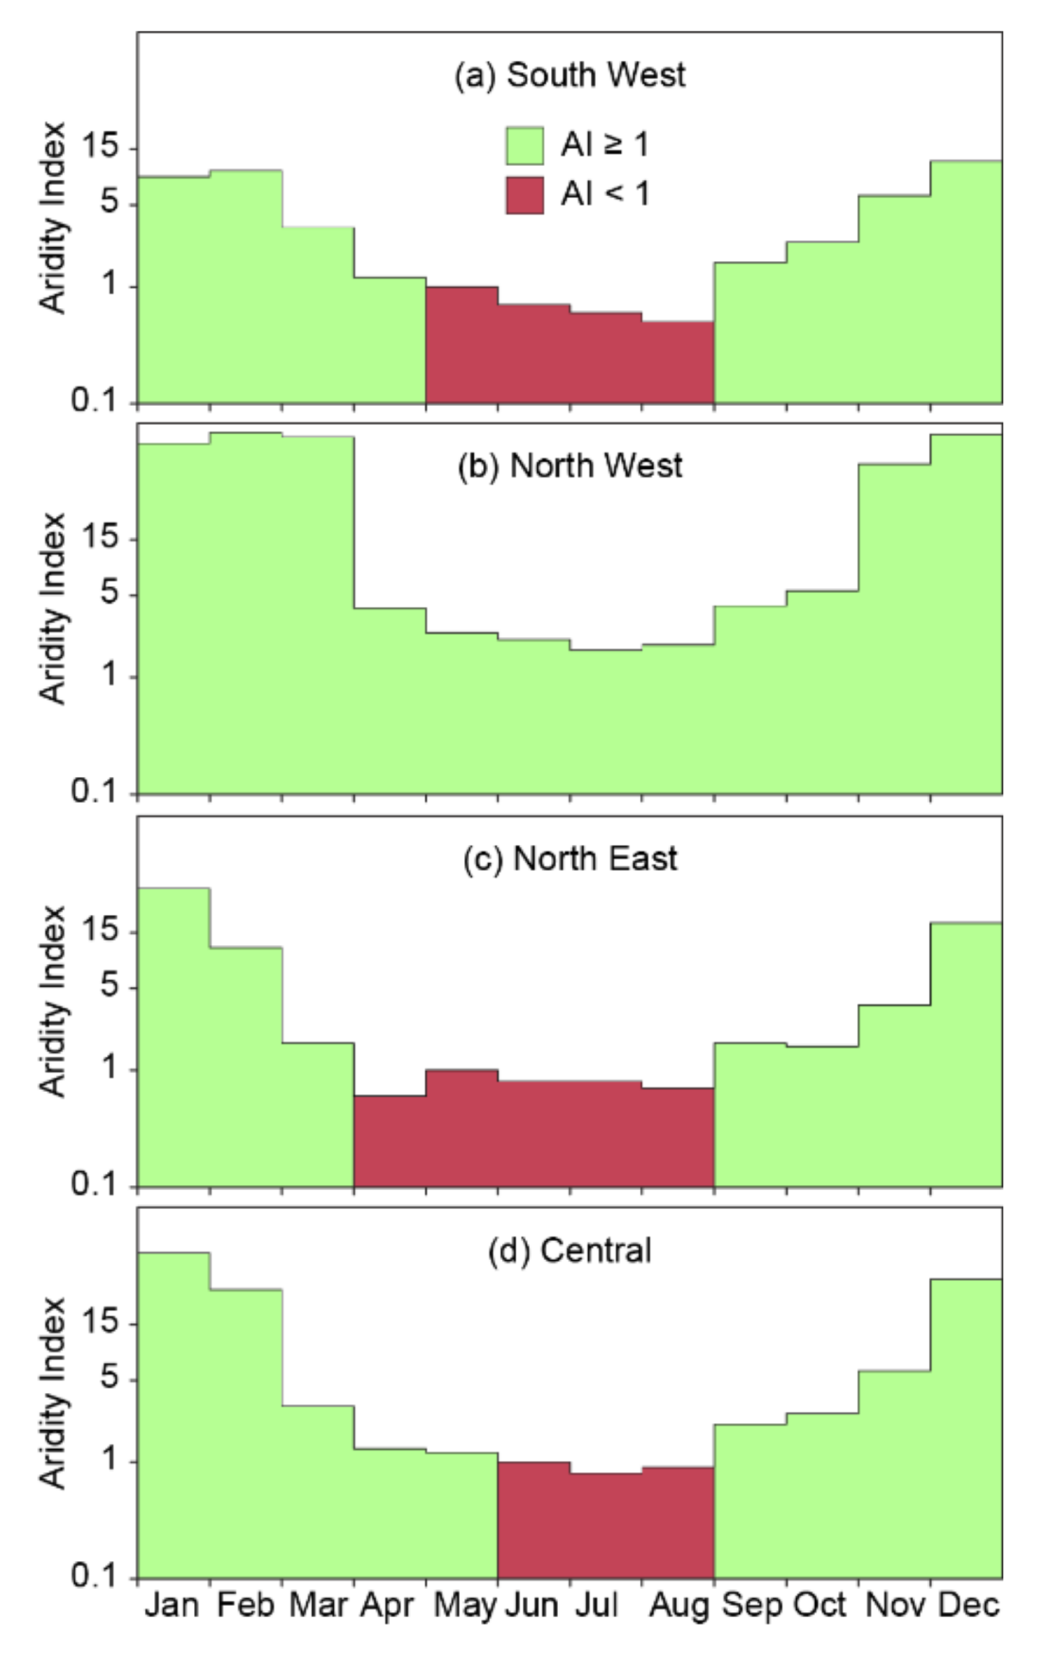
The calculations are performed by three separate segments, each of which performs specific tasks [32]. The first segment performs the reconstruction of the individual rainfall events from the continuous rainfall series and calculates the duration (D, in hours) and the cumulated rainfall (E, in mm) of the rainfall events. The separation of consecutive rainfall events is based on climatic and seasonal settings: two “no rain” time intervals are distinguished for a warm/dry and cold/rainy season, respectively. The determination of the two seasons is based on monthly soil–water balance (MSWB) model [43,44,45]. In more detail, the MSWB model exploits monthly rainfall and temperature data and allows estimating the average monthly potential and real evapotranspiration utilizing a water balance over the mean hydrological year. Furthermore, the aridity index (AI), i.e., the ratio between the average monthly rainfall and the average monthly potential evapotranspiration, is used to define the length of the two seasons for each of the four regions. The warm/dry season has AI < 1, while in the cold/rainy season AI ≥ 1. Once the length of the two seasons in each region has been defined, the ratio between the total amount of real evapotranspiration in the warm and the cold seasons is used to define the ratio between the “no rain” time intervals in each season.
The task of the second segment is to select the nearest rain gauge for each landslide. The maximum allowed distance between a landslide and a rain gauge is within a circular area of a given radius. This task is followed by the selection of single or multiple rainfall conditions (MRC) that are most likely responsible for the slope failures. Each MRC is assigned a weight to select the representative rain gauge and the rainfall conditions associated with the landslide. The weight is equal to the ratio between the cumulated rainfall (E) times the mean rainfall intensity (I) divided by the square of the distance between the rain gauge and the landslide.
The third segment is the calculation of cumulated event rainfall–rainfall duration—ED—thresholds at different non-exceedance probabilities (NEPs), and the associated uncertainties, where the MRC with the maximum weight for each failure (MPRC, Maximum Probability Rainfall Condition) are selected. The thresholds are defined using a frequentist approach [46,47] and have a power law form linking E to D:
E = α ± Δ α D γ ± Δ γ
where α is the scaling parameter and γ is the shape parameter, i.e., the intercept and slope of the power law curve respectively; Δ α and Δ γ represent the relative uncertainties of the two parameters [46,47]. A more detailed description of CTRL-T can be found in Melillo et al. [32,34,35].

3.2. Landslide Data

Initially, the landslide database consisted of 2179 landslides that occurred between 18 September 2007 and 5 May 2018. We classified all landslides in the database as shallow landslides. The failures, probably caused by snowmelt during the winter and the first months of spring (i.e., from early December to early April), were discarded. Landslides with unknown dates of occurrence or location and double entries (e.g., two landslides in the same place and time) were also excluded from the analysis. In total, we manually removed 583 landslides from the database, leaving 1596 landslides for further analysis.
The exact time of the failures was not known; therefore, all landslides were recorded as they had occurred at the end of the day. This could introduce uncertainties in the amount of rainfall responsible for the landslides (see e.g., [48]), which however were not evaluated. In particular, all rainfall up to the end of the day of the recorded dates was considered, although the landslides probably occurred earlier and could have consisted of lower amounts of rainfall.

3.3. Rainfall Data

In Slovenia, several different types of gauges measure precipitation data and other climatic variables. For this analysis, ARSO provided rainfall data of all automatic rain gauges. The measures were extracted with a temporal resolution of 30 minutes and aggregated in hourly time steps for the period between 18 September 2007 and 5 May 2018. Of the 144 available rain gauges, only 94 were used for the reconstruction of rainfall conditions that caused the landslides. Average monthly temperature data, useful for the MSWB model, was gathered from all stations.

4. Results and Discussion

4.1. Definition of the Dry and Wet Season

The identification of the warm/dry and cold/rainy seasons in Slovenia was not trivial due to sparse landscapes and different climatic conditions. Four regions were identified: (i) North East, the region with less rainfall; (ii) North West, the Alpine region; (iii) South West, the coastal region with Mediterranean climatic conditions; and (iv) the Central region, the pre-alpine that receives the highest rainfall (more than 3000 mm per year). The rain gauges in each region were classified accordingly (Figure 1). Using the average monthly rainfall and temperature data between 2007 and 2018 and applying the MSWB model, the length of the two seasons in each region was defined. Furthermore, using the aridity index, the ratio among the “no rain” intervals in each season was determined. This ratio resulted equal to 2, corresponding to a “no rain” interval of 48 h (set as minimum) in the warm season and 96 h in the cold season, respectively. Figure 2 shows the results of the analysis for the four considered regions. While the North East, South West and Central regions experience dry periods (AI ≥ 1) in the summer months (with diverse lengths), the North West part (Alpine area) has no dry period. Therefore, in North East, South West and Central regions, rainfall events were reconstructed using a “no-rain” period of 48 h and 96 h in the warm/dry and cold/rainy season, respectively. Conversely, in the North West region, rainfall events were always separated by 96 h.

4.2. Threshold Calculation

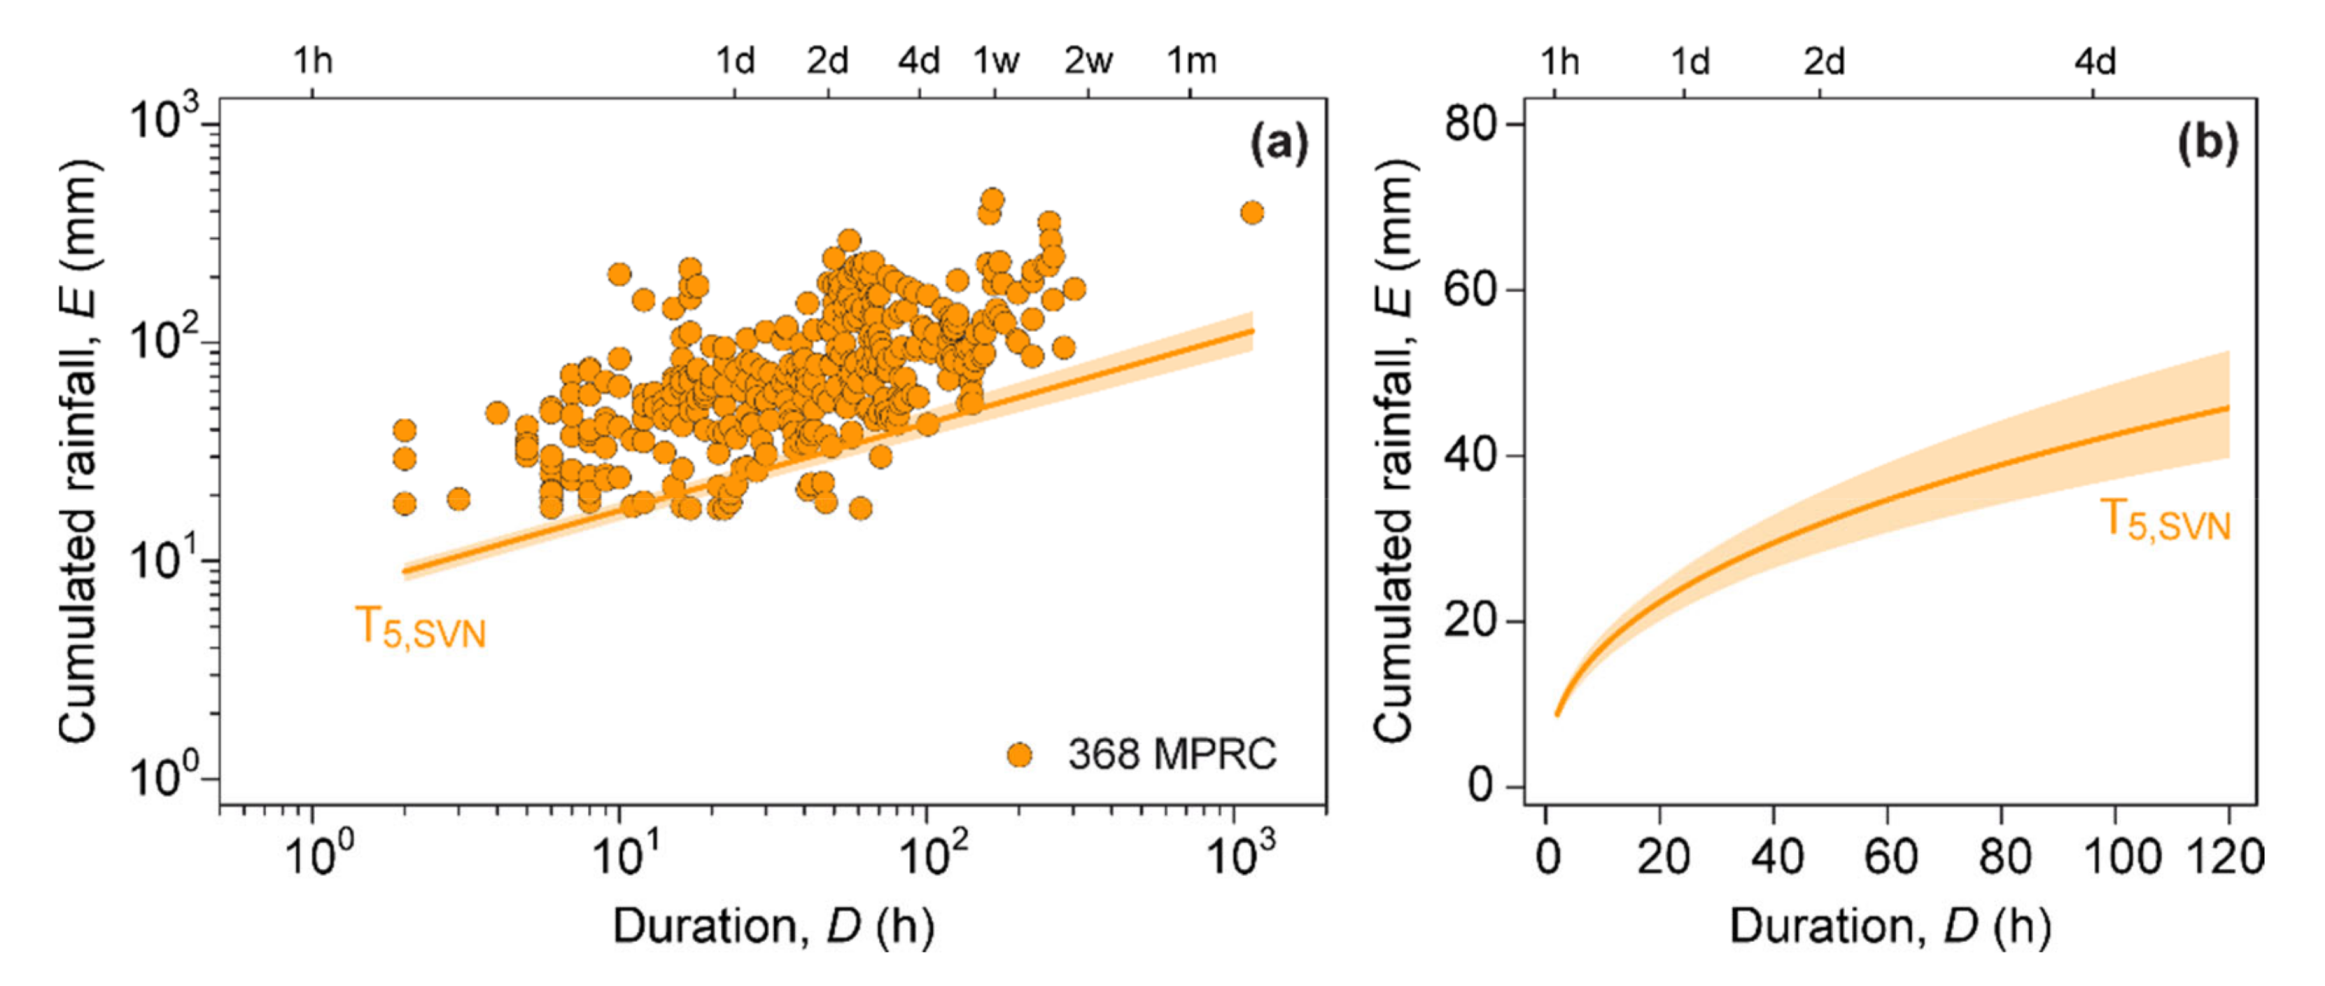
Using CTRL-T we reconstructed 1315 rainfall conditions responsible for the occurrence of landslides in the observed period. For 281 landslides it was not possible to determine the triggering rainfall event for three main reasons: (i) the distance between the landslide and the rain gauges exceeded 15 km (chosen according to the morphology and the rain gauge density of the study area); (ii) the delay between the end of the rainfall condition and the occurrence of the landslide exceeded 48 h; (iii) accurate landslide information or rainfall data were lacking. These landslides were excluded from the calculation. Several landslides occurring on the same day and near the same rain gauges were presumably triggered by the same amount of rainfall. In this case, CTRL-T selected only the rainfall condition corresponding to the first triggered landslide. As a result of the analysis, out of 1315 rainfall events, only 368 survived the selection criteria (Figure 1 and Figure 3).
The values of 15 km and 48 h for maximum distance and delay, respectively, were selected in accordance with previous works [32,33,35,38] and should be considered as conservative upper limits. Most of the landslides (305 out of 368, 83%) were associated with rain gauges located at a maximum distance of 10 km, and half of them within 6 km; in 48 cases the distance was shorter than 2 km. Regarding the delay between the end of the rainfall and the occurrence landslide time, the majority of the landslides (299 out of 368, 81%) that were associated with rainfall conditions ended within a delay of 24 h. Specifically, half of them had a delay of less than 10 h and in 60 cases the delay was null.
Based on the 368 rainfall conditions, the algorithm included in CTRL-T calculated ED (cumulated event rainfall—duration) thresholds at different non-exceedance probabilities (Table 1). As a reference with previous works (e.g., [32,33,34,35,38,46,47]), Figure 3 shows the rainfall conditions and the threshold at 5% NEP. According to the frequentist method [46,47], the 5% NEP threshold leaves 5% of the empirical ED conditions below itself. The relative uncertainties of the parameters of the thresholds were also calculated. The 5% NEP threshold has low relative uncertainties (0.7/6.8 = 10.3%; 0.02/0.4 = 5%), which means a better distribution of the rainfall conditions.

4.2.1. Thresholds for Different Mean Annual Rainfall Classes

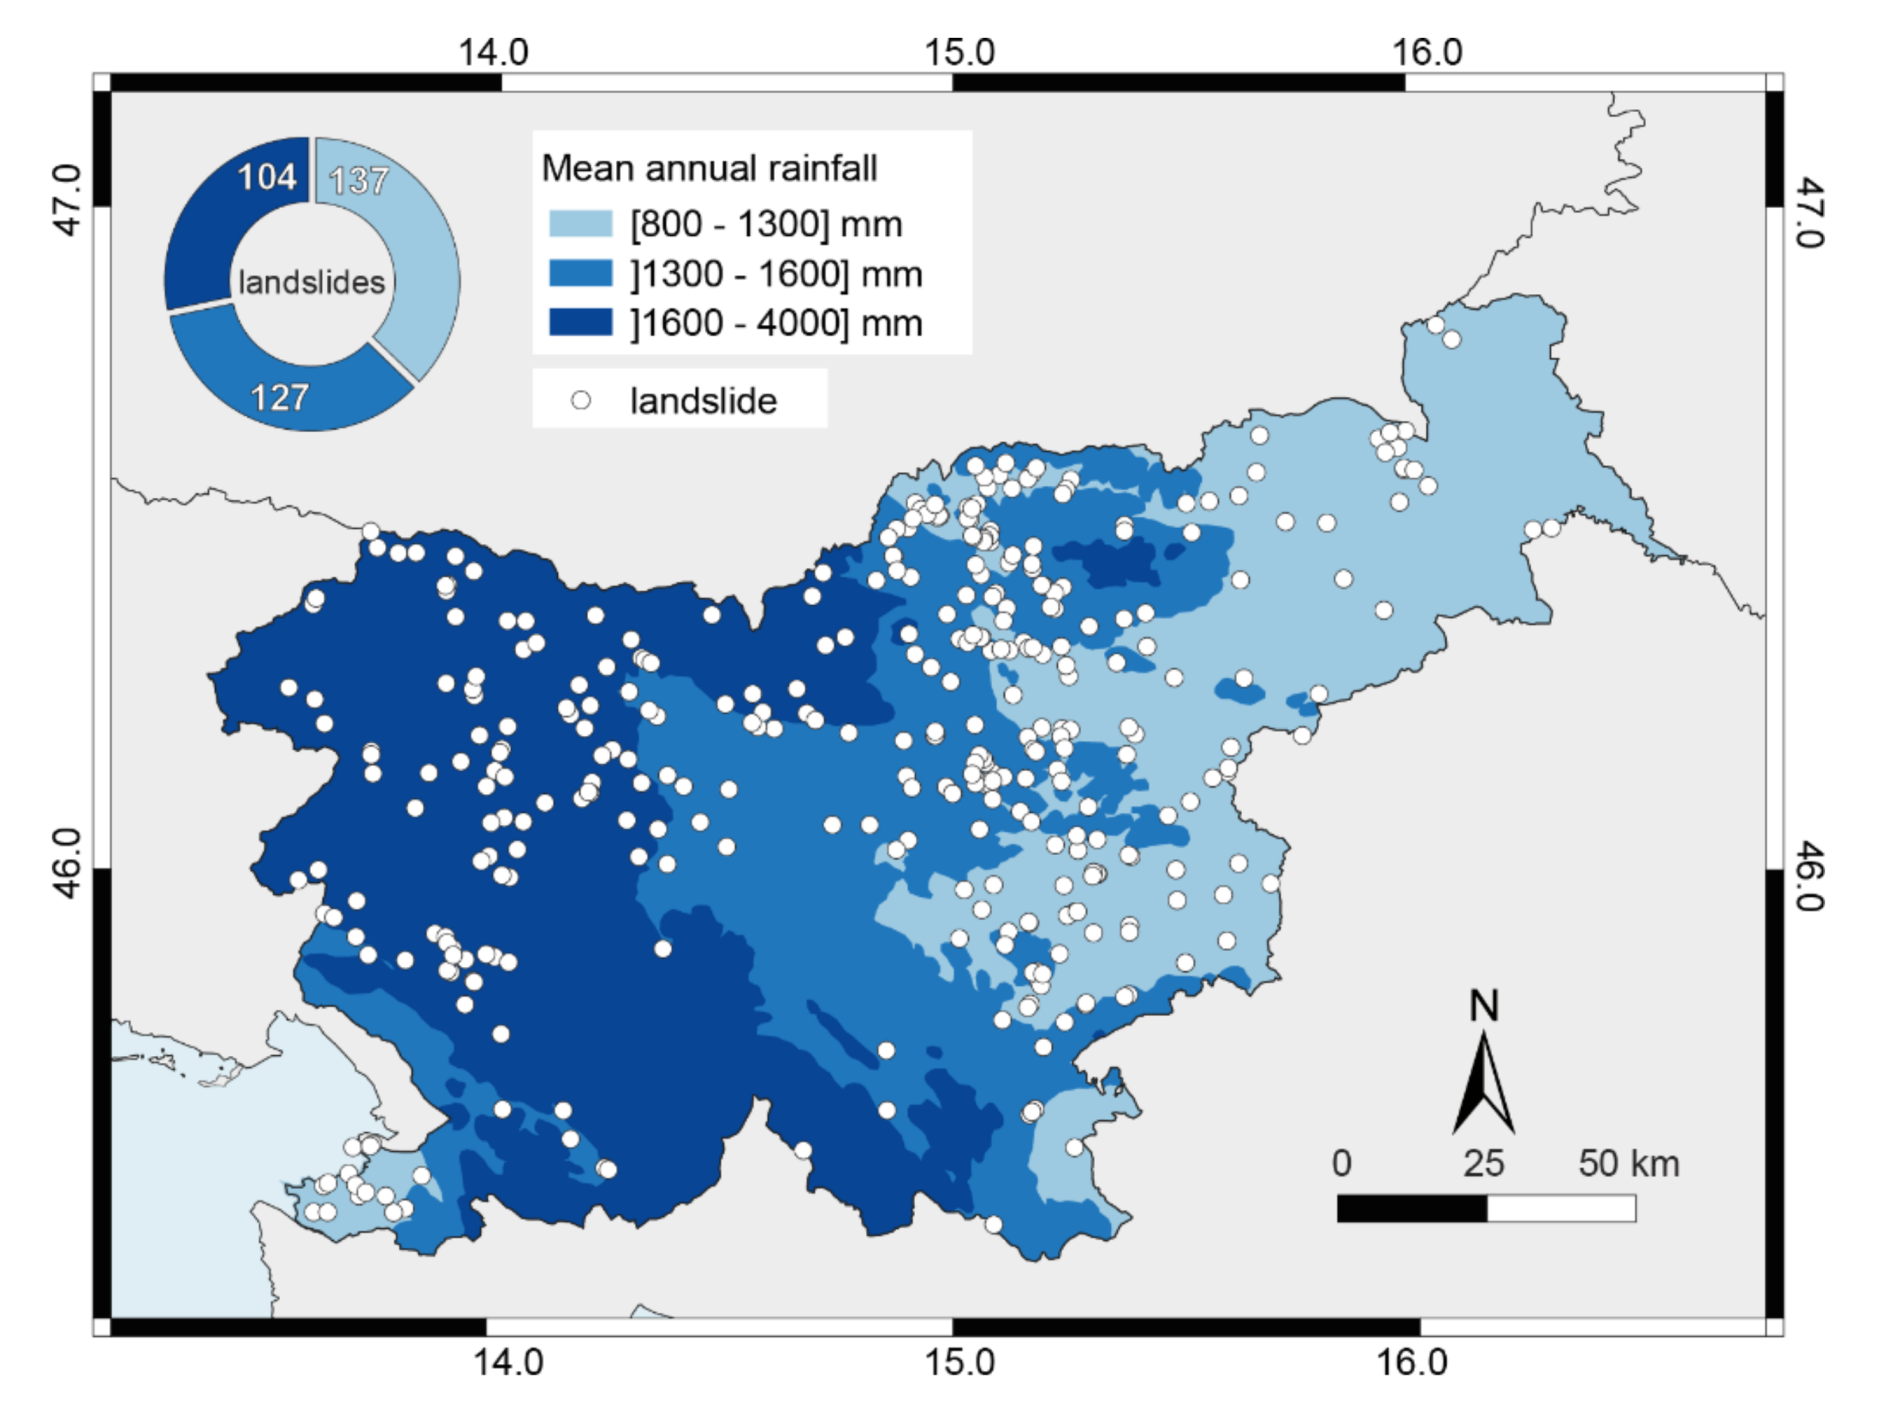
To investigate the role of the rainfall regime for the landslide triggering conditions in Slovenia, we used data on mean annual rainfall (MAR) provided by ARSO [42], which were divided into three classes. Figure 4 shows that the eastern part of Slovenia (32% of the total national territory) is characterized by low values of MAR (800 ≤ MAR ≤ 1300 mm), the central part (30%) by medium values (1300 < MAR ≤ 1600 mm) and the western part (38%) by high values (1600 < MAR ≤ 4000 mm). The number of landslides in the region characterized by a low, medium and high MAR class is 137, 127 and 104, respectively. The lowest density of landslides (one landslide every 74 km2) is found in the area with high MAR values, while the other two areas are characterized by a similarly higher value of landslide density (one every 47 km2).
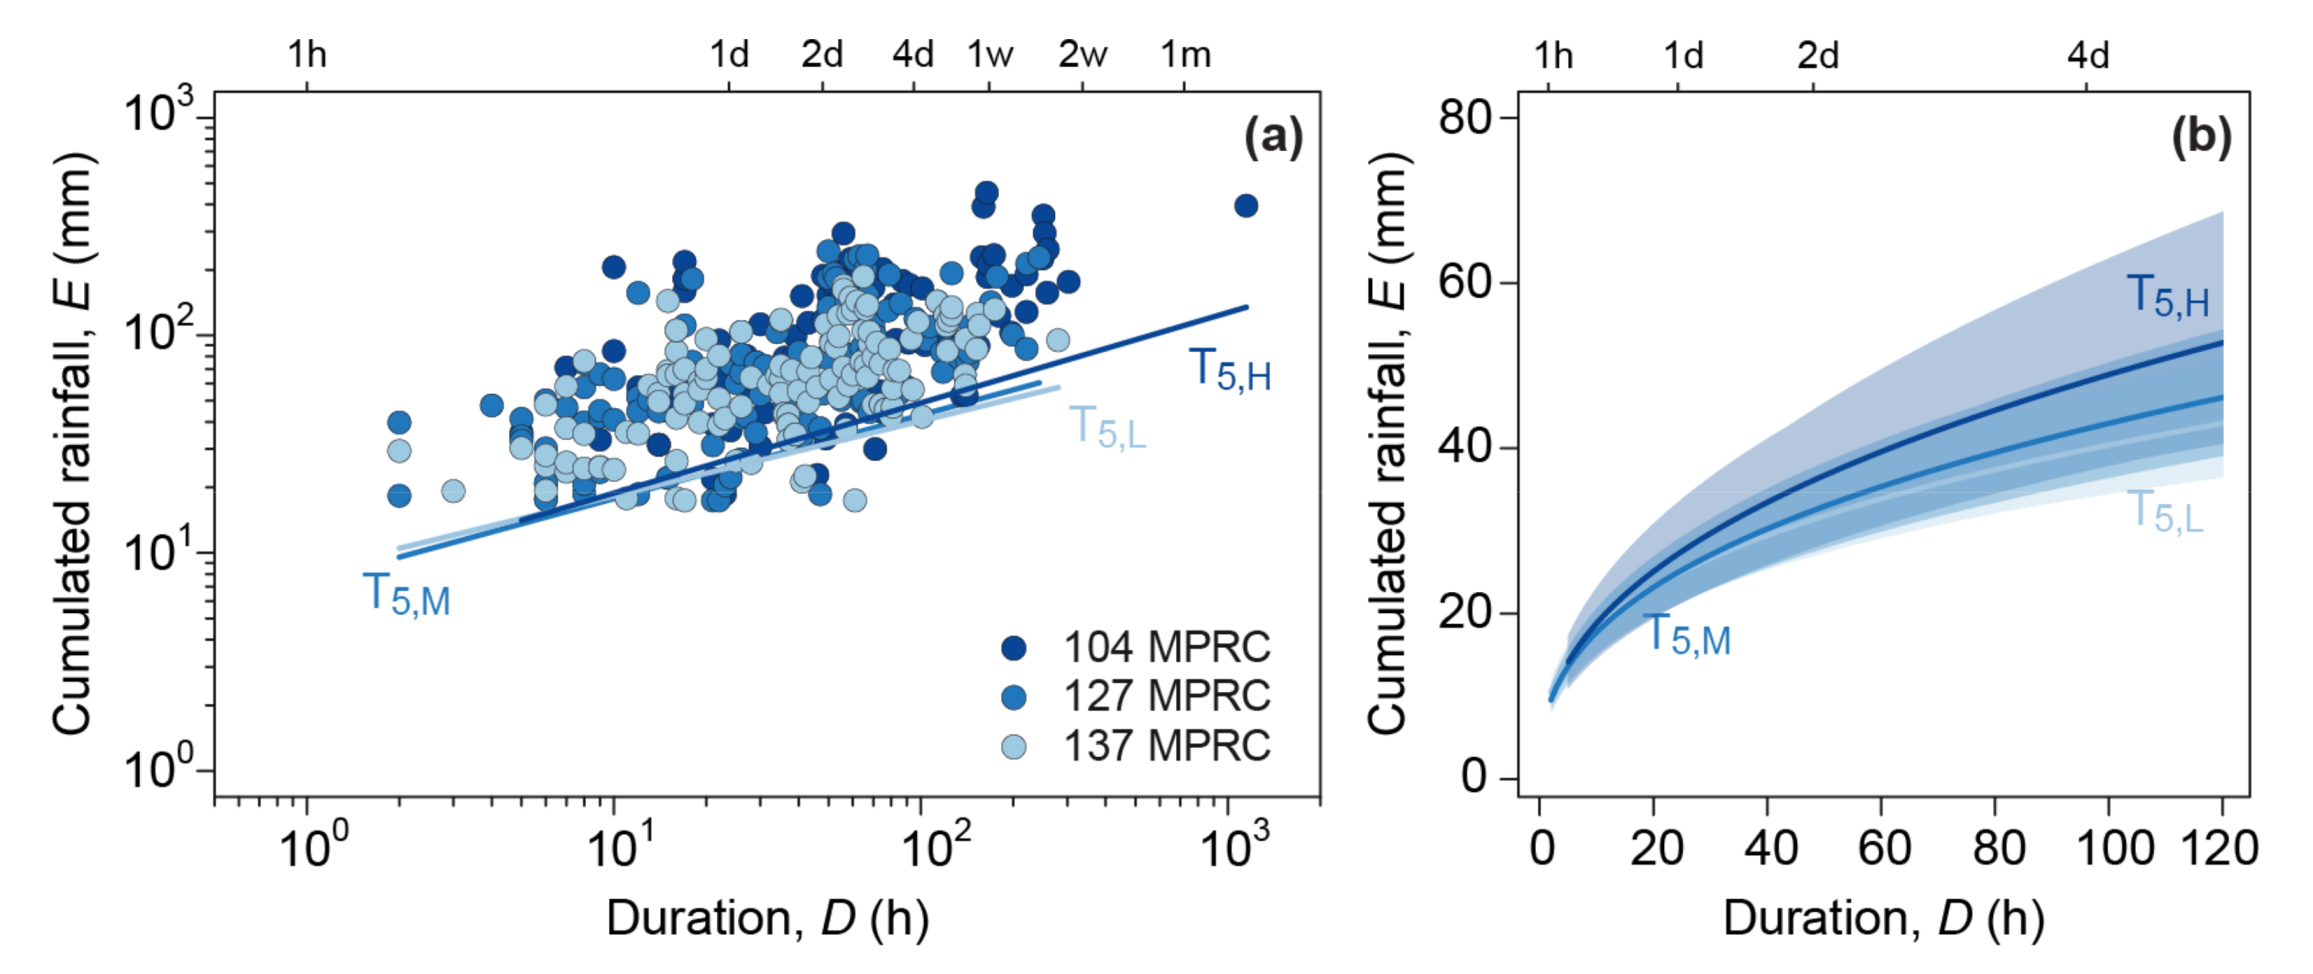
Figure 5a shows the MPRCs classified into three MAR classes, with the corresponding 5% ED thresholds, T5,L, T5,M and T5,H (Table 1). The three thresholds are also shown in Figure 5b, in linear coordinates and in the range of duration 1 ≤ D ≤ 120 h, with the shaded areas representing the uncertainty associated to each threshold. Inspection of Figure 5a and Table 1 reveals that the three point-clouds have different distributions and the subsets have diverse duration ranges, and the resulting thresholds have different parameters. In particular, α increases from 7.2 to 8.3, and γ decreases from 0.41 to 0.34 moving from T5,H to T5,L. Therefore, the curves become higher and steeper with an increasing MAR (Table 1), ranging from α = 8.3 ± 1.1 and γ = 0.34 ± 0.02 for the low MAR region to α = 7.1 ± 1.6 and γ = 0.41 ± 0.05 for the high MAR region. This behavior is in accordance with the findings of Peruccacci et al. [39] in the nearby Italian territory: the rainfall required to trigger landslides increases with the MAR, which proves a sort of adaptation of the landscape to the average rainfall conditions. The relative uncertainty of α increases as the MAR class increases, while Δγ/γ remains stable.

4.2.2. Thresholds for Lithological Classes

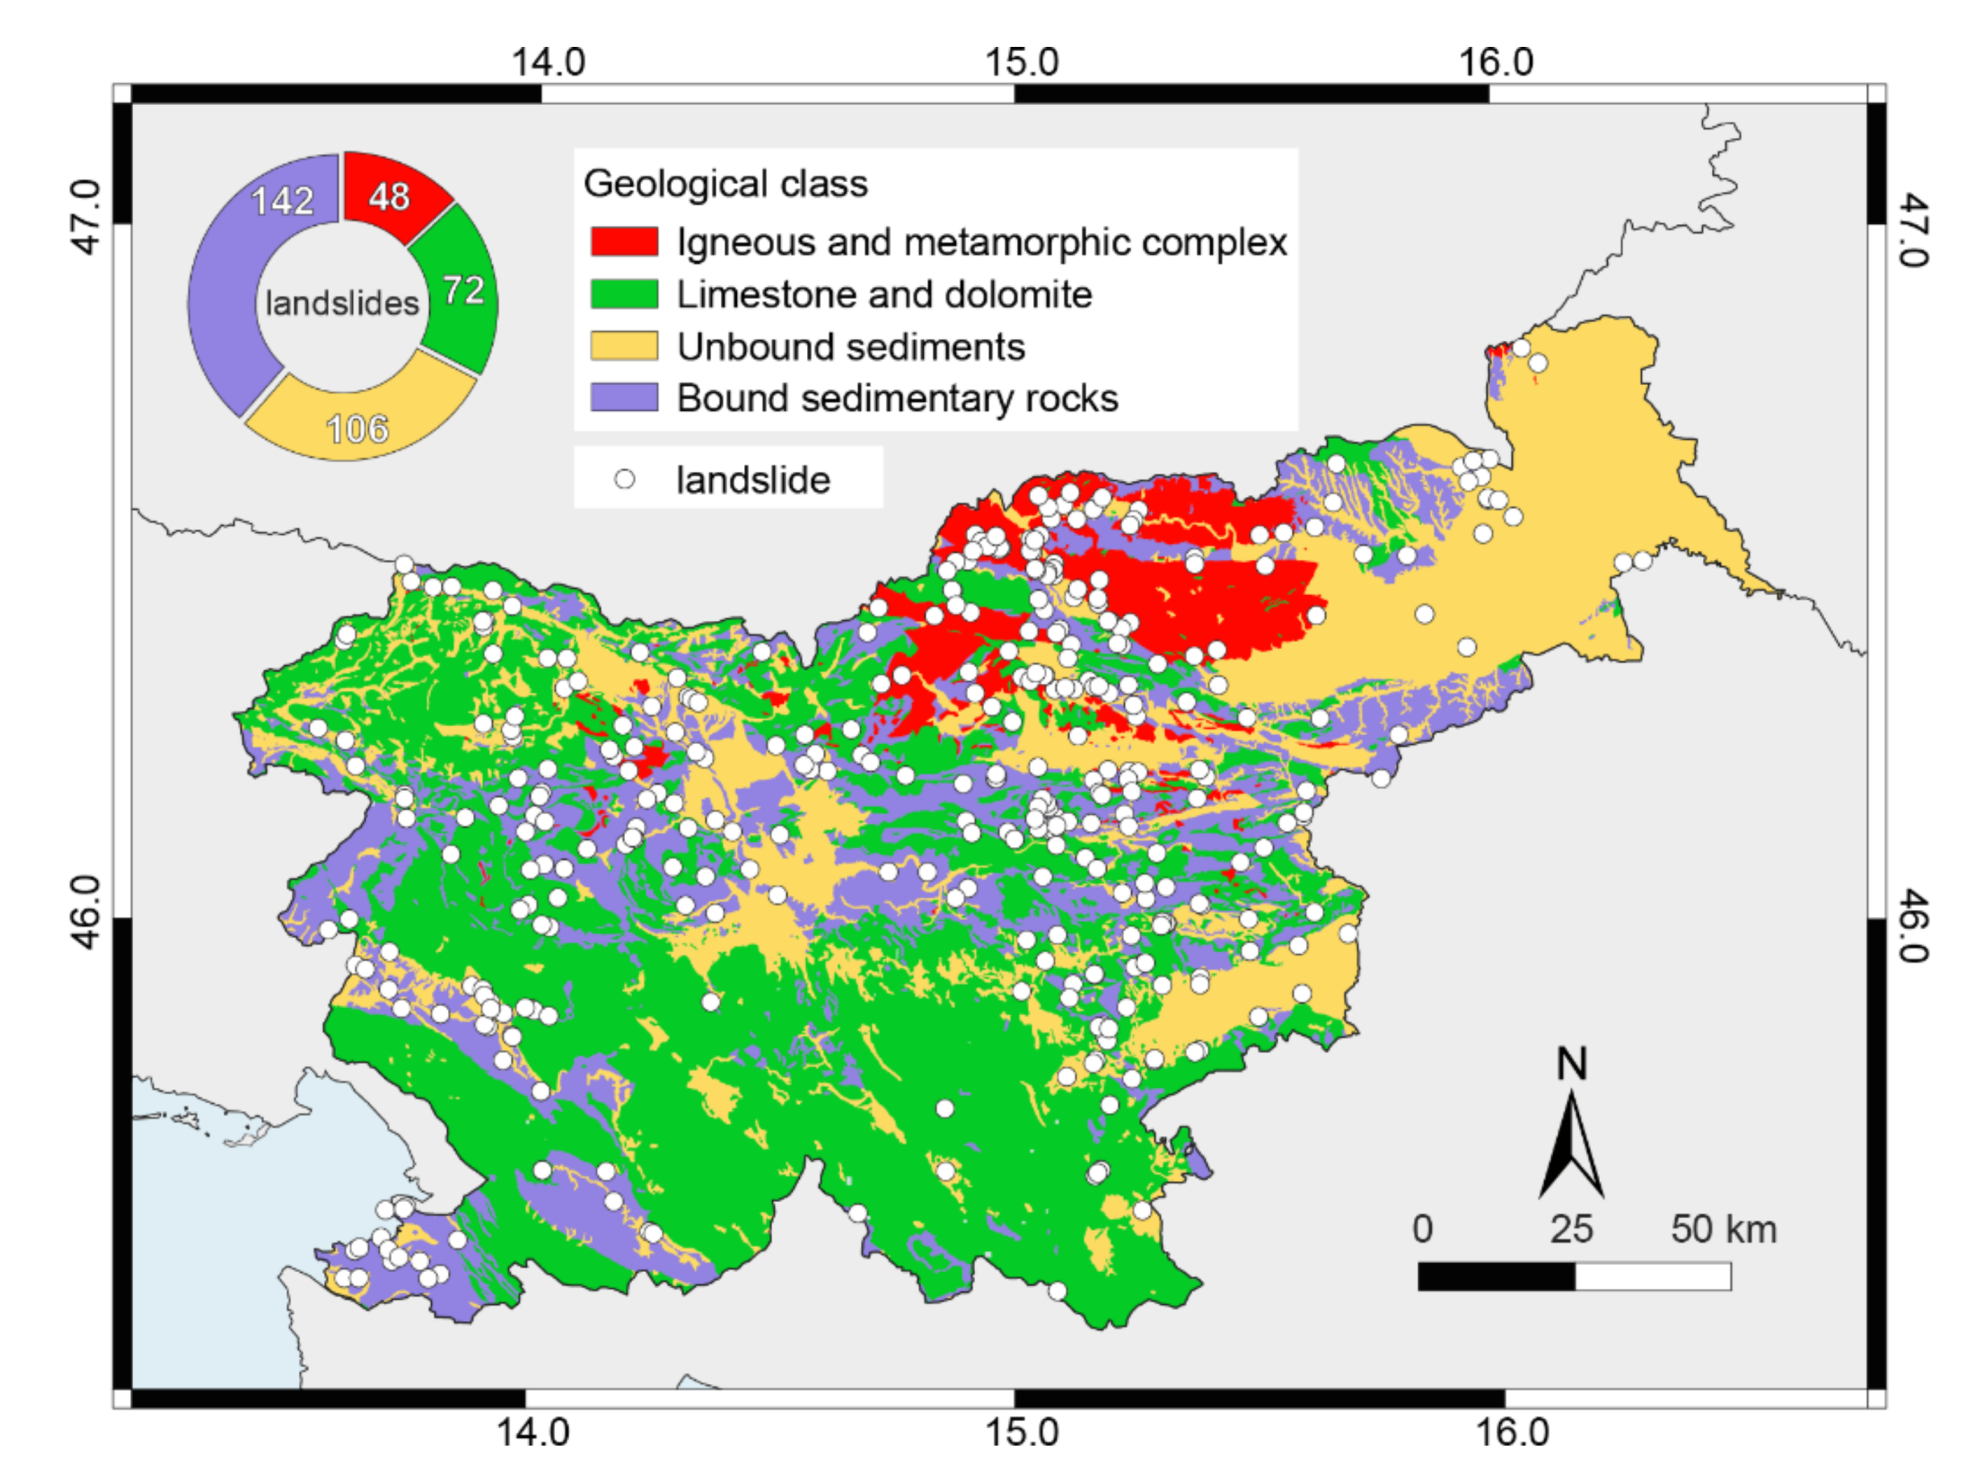
For the purpose of studying the role of lithology in the triggering of landslides in Slovenia, we used the Slovenian engineering geological map in scale 1:1,000,000 by Ribičič et al. [49] We have reclassified the 29 rock units into four classes (Figure 6): the igneous and metamorphic complex (IG class), limestone and dolomite (LD class), unbound sediments or sedimentary rocks (US class) and bound sedimentary rocks (BS class). Each class represents a unit of similar rock types that occur in Slovenia. The IG class includes diabase, andesites, granites and all types of volcanic sedimentary rocks; the LD class includes all types and forms of these occurring rocks; US class includes all the unconsolidated clastic sediments such as clay, marl, silt, sand, gravel and similar sediments, and the BS class represents all the occurring cemented fine-grained and coarse-grained clastic rocks.
Figure 6 shows the landslides considered for each class, where the class IG has the lowest number (48 of 368), class LD with 72, class US with 106, and class BS with 142 conditions. Overall, 67% of the considered landslides occurred in the areas of sedimentary rocks (bound and unbound), which take roughly half of the total territory of Slovenia (10,026 km2, 49.5%), while landslides in the area of limestones and dolomites (8803 km2, 43.4%) account for only 20% of the considered landslides. This proves the impact of lithology on landslide triggering conditions, as reported, e.g., by Jordanova et al. [29], Peruccacci et al. [39], Palladino et al. [40], Vennari et al. [50] and Gariano et al. [51] Sedimentary rocks are relatively unstable masses that are very susceptible to weathering and consequently accumulate thick eluvium, which is the main source of material for shallow landslides.
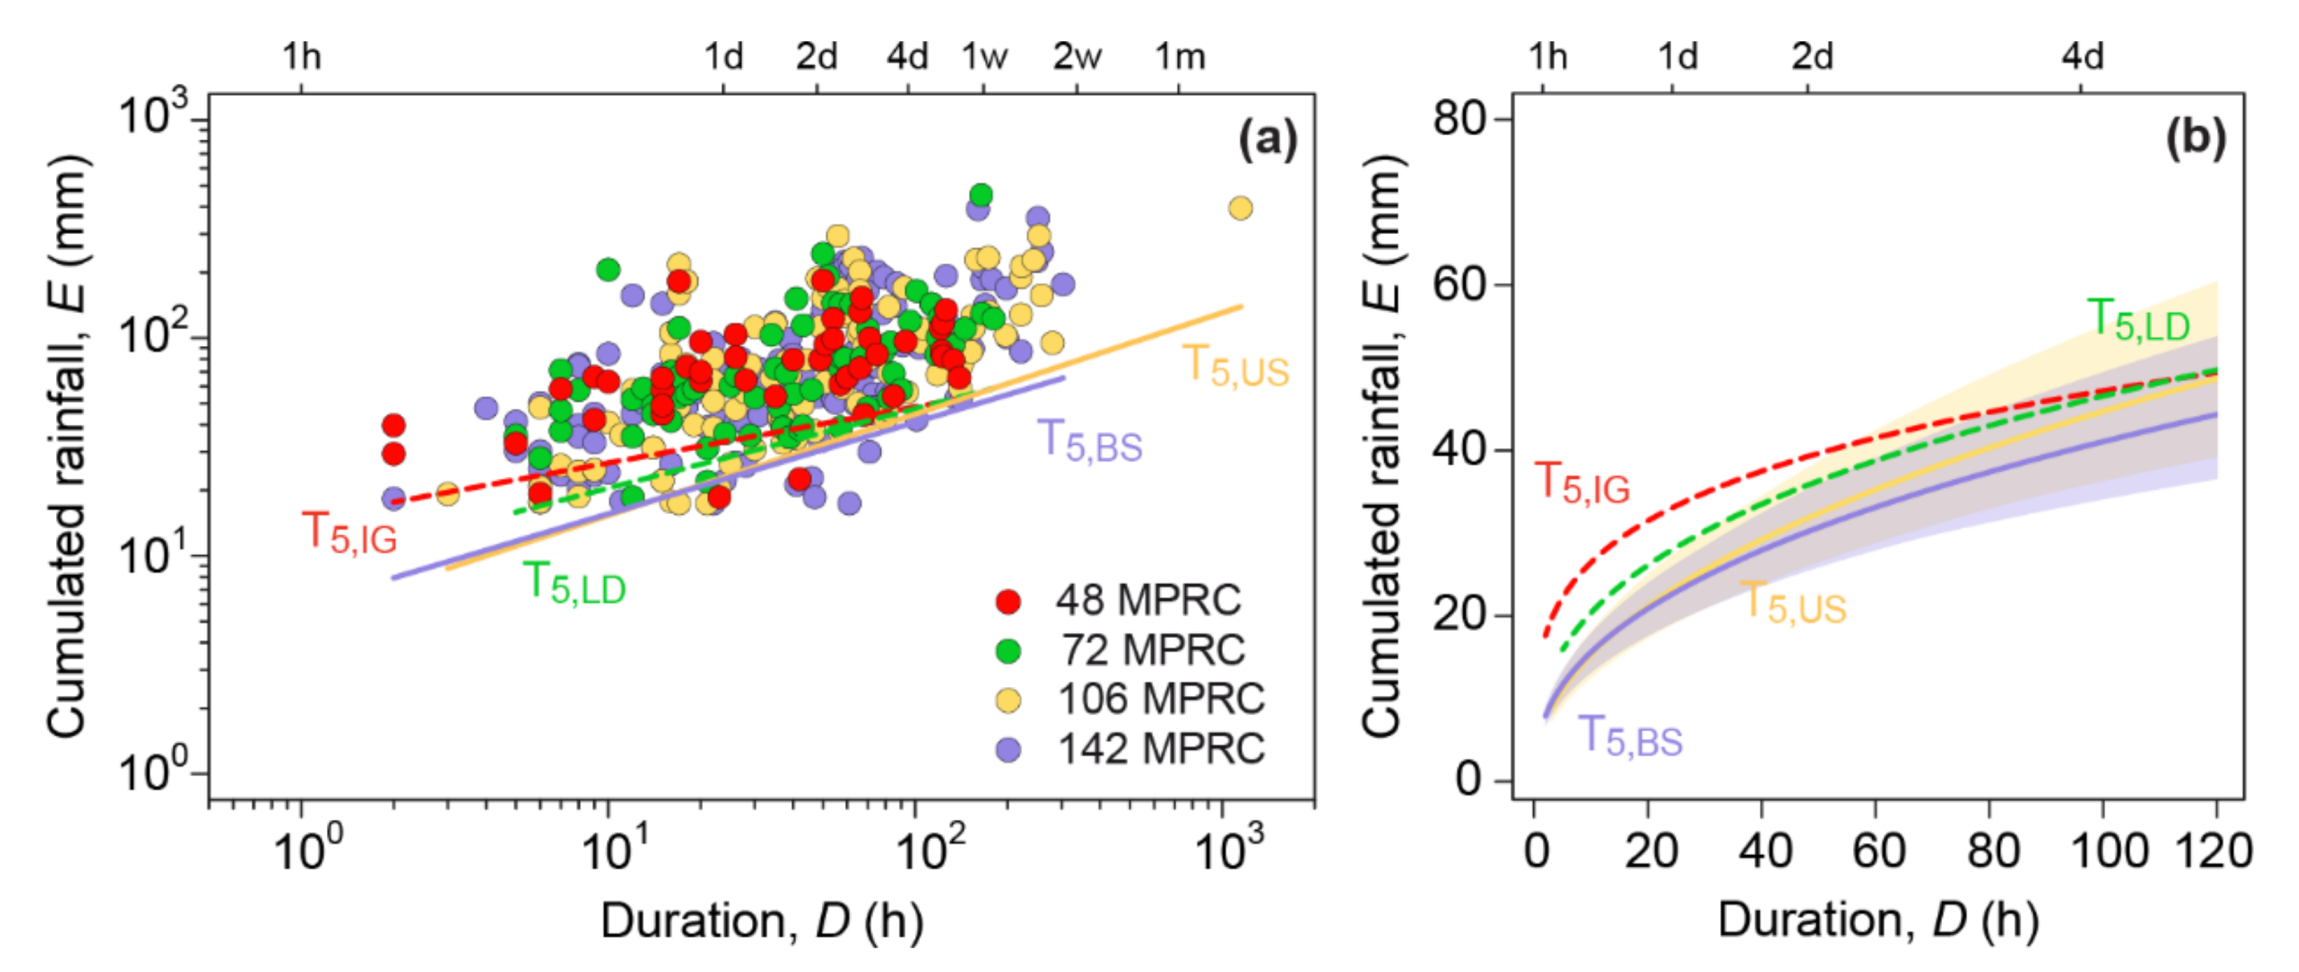
Figure 7a shows the ED conditions in each lithology class in log–log coordinates with the corresponding 5% NEP thresholds, T5,IG, T5,LD, T5,US and T5,BS (Table 1). The same thresholds are shown in linear coordinates in Figure 7b, with the range of duration (D) varying from 1 to 120 h. Due to the small number of conditions for classes IG and LD, the uncertainties are too high, and the thresholds cannot be considered significant for these classes [39,47]. Nevertheless, they indicate the differences in the triggering conditions, with the IG class having the highest threshold and bound sedimentary rocks having the lowest. For obtaining more reliable thresholds, more empirical points are needed. However, a clear distinction in the minimum triggering conditions between landslides that occurred in sedimentary rocks and those that occurred in dolomite, limestone, igneous and metamorphic complexes can be currently observed.

4.3. Threshold Validation

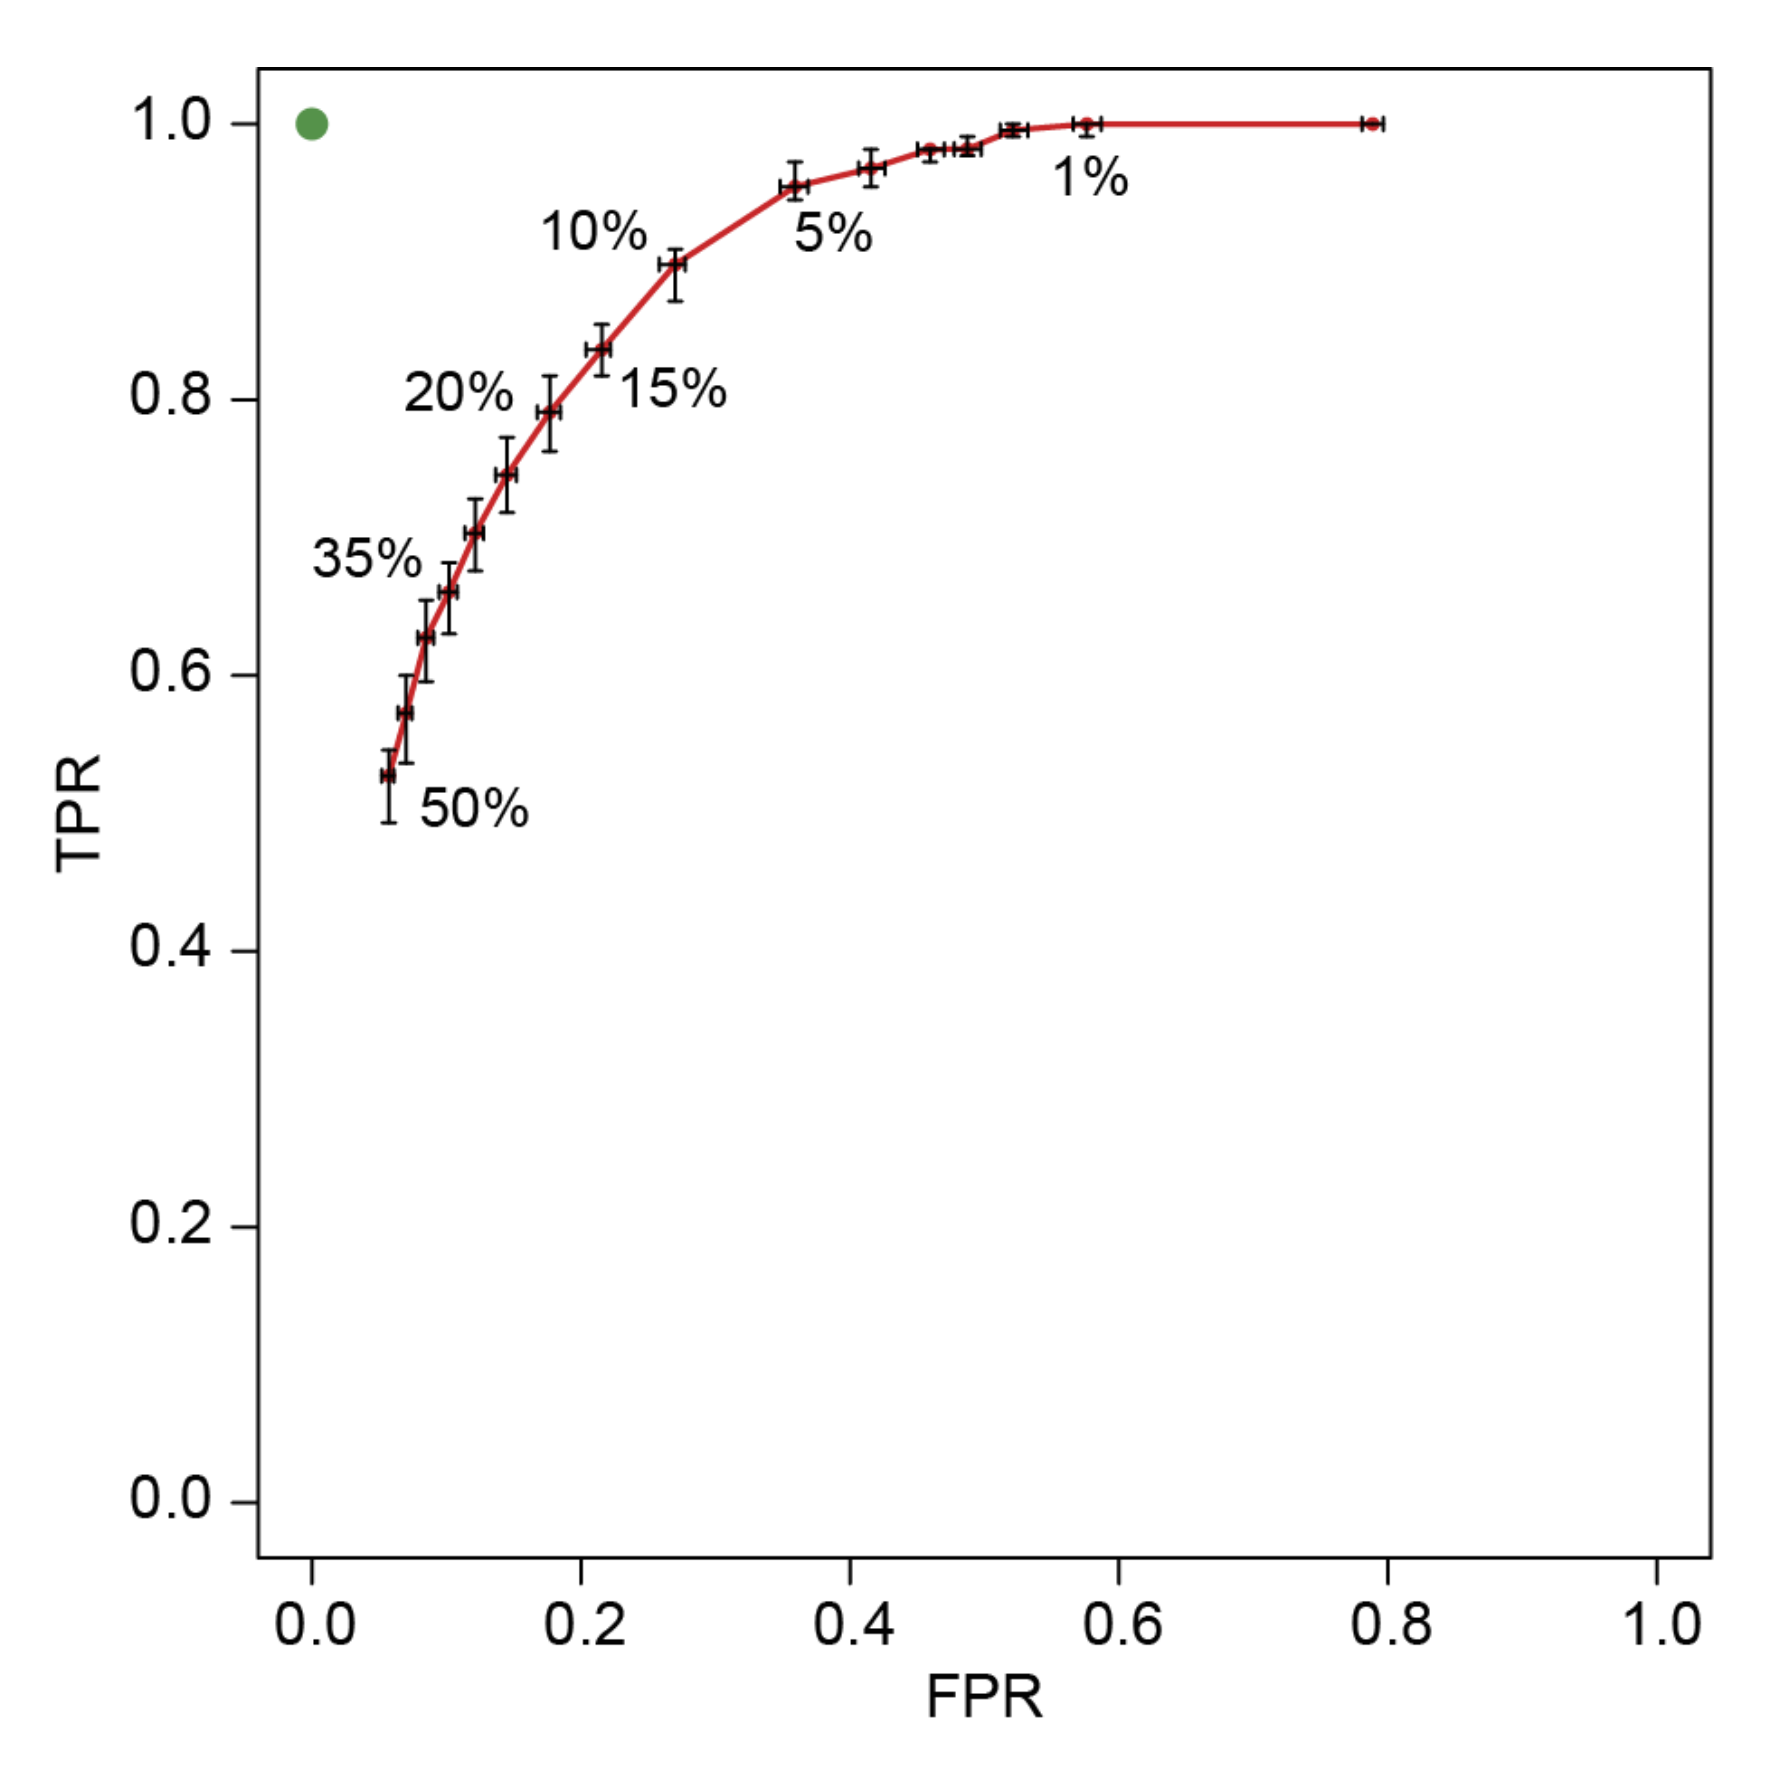
The validation of the national thresholds was based on two subsets of data: (i) a calibration set containing 70% of all reconstructed rainfall conditions (258), and (ii) a validation set containing the remaining 30% (110). The subsets were randomly selected 100 times. In addition, all those rainfall conditions that (presumably) did not cause landslides in the considered period were also reconstructed. The validation was performed 100 times, each time resulting differently; the number of conditions was always the same. The thresholds at different NEPs, calculated using the MRPC in the calibration set, are compared with the MPRC in the validation set and the rainfall conditions that did not trigger landslides. Therefore, 100 contingency tables were determined [33,51], reporting true positives (TP, i.e., landslide-triggering rainfall conditions predicted by the thresholds), false positive (FP, i.e., rainfall conditions not resulting in landslides incorrectly classified as landslide-triggering), true negatives (TN, i.e., rainfall conditions not resulting in landslides not predicted by the thresholds) and false negatives (FN, i.e., landslide-triggering rainfall conditions located below the threshold). Furthermore, three skill scores could be calculated: the true positive rate, i.e., TPR = TP/(TP + FN); the false positive rate, i.e., FPR = FP/(FP + TN); and the true skill statistics, i.e., TSS = TPR − FPR. Moreover, the FPR and TPR values were used to draw the receiver operating characteristic (ROC) curve (Figure 8). The best prediction is achieved when TPR = 1 (all observed landslides correctly detected) and FPR = 0 (no false positives) and is represented by the upper left green point in Figure 8 (best prediction point). The threshold which results closest to the best prediction point is assumed to be optimal.
Table 2 reports the mean values of the performing indexes for calculated thresholds at different NEPs, for the 100 validation runs. As the non-exceedance probability increases, the number of false negatives rises, and that of the true positives decreases. Conversely, lowering the thresholds causes an increase in the number of false positives and a decrease in the number of true negatives. In such cases, if the thresholds are used in a LEWS, false positives lead to false alarms and false negatives lead to missed alarms. It can be noted that the number of false positives can be greatly overestimated due to a lack of landslide information, i.e., many landslides may have occurred, but were not recorded. Likewise, even the true negatives can be overestimated. It has been observed that even a slight underestimation of the number of landslide occurrences can lead to an increase in uncertainty about prediction (and consequently system) performance [51].
The validation showed that the best-performing threshold is that at 15% NEP, which has the shortest distance δ from the best prediction point, and also the highest mean value TSS in the 100 validation runs (Table 2; Figure 8). This threshold is represented by the equation:
E = 8.9 ± 1.0 D 0.42   ±   0.03
The relative uncertainties of these parameters are slightly higher (Δα/α = 11.2%; Δγ/γ = 7%) than the ones reported in Table 1. The reason behind this is in the lower number of rainfall conditions available (258 out of 368).

4.4. Comparison with Other Thresholds

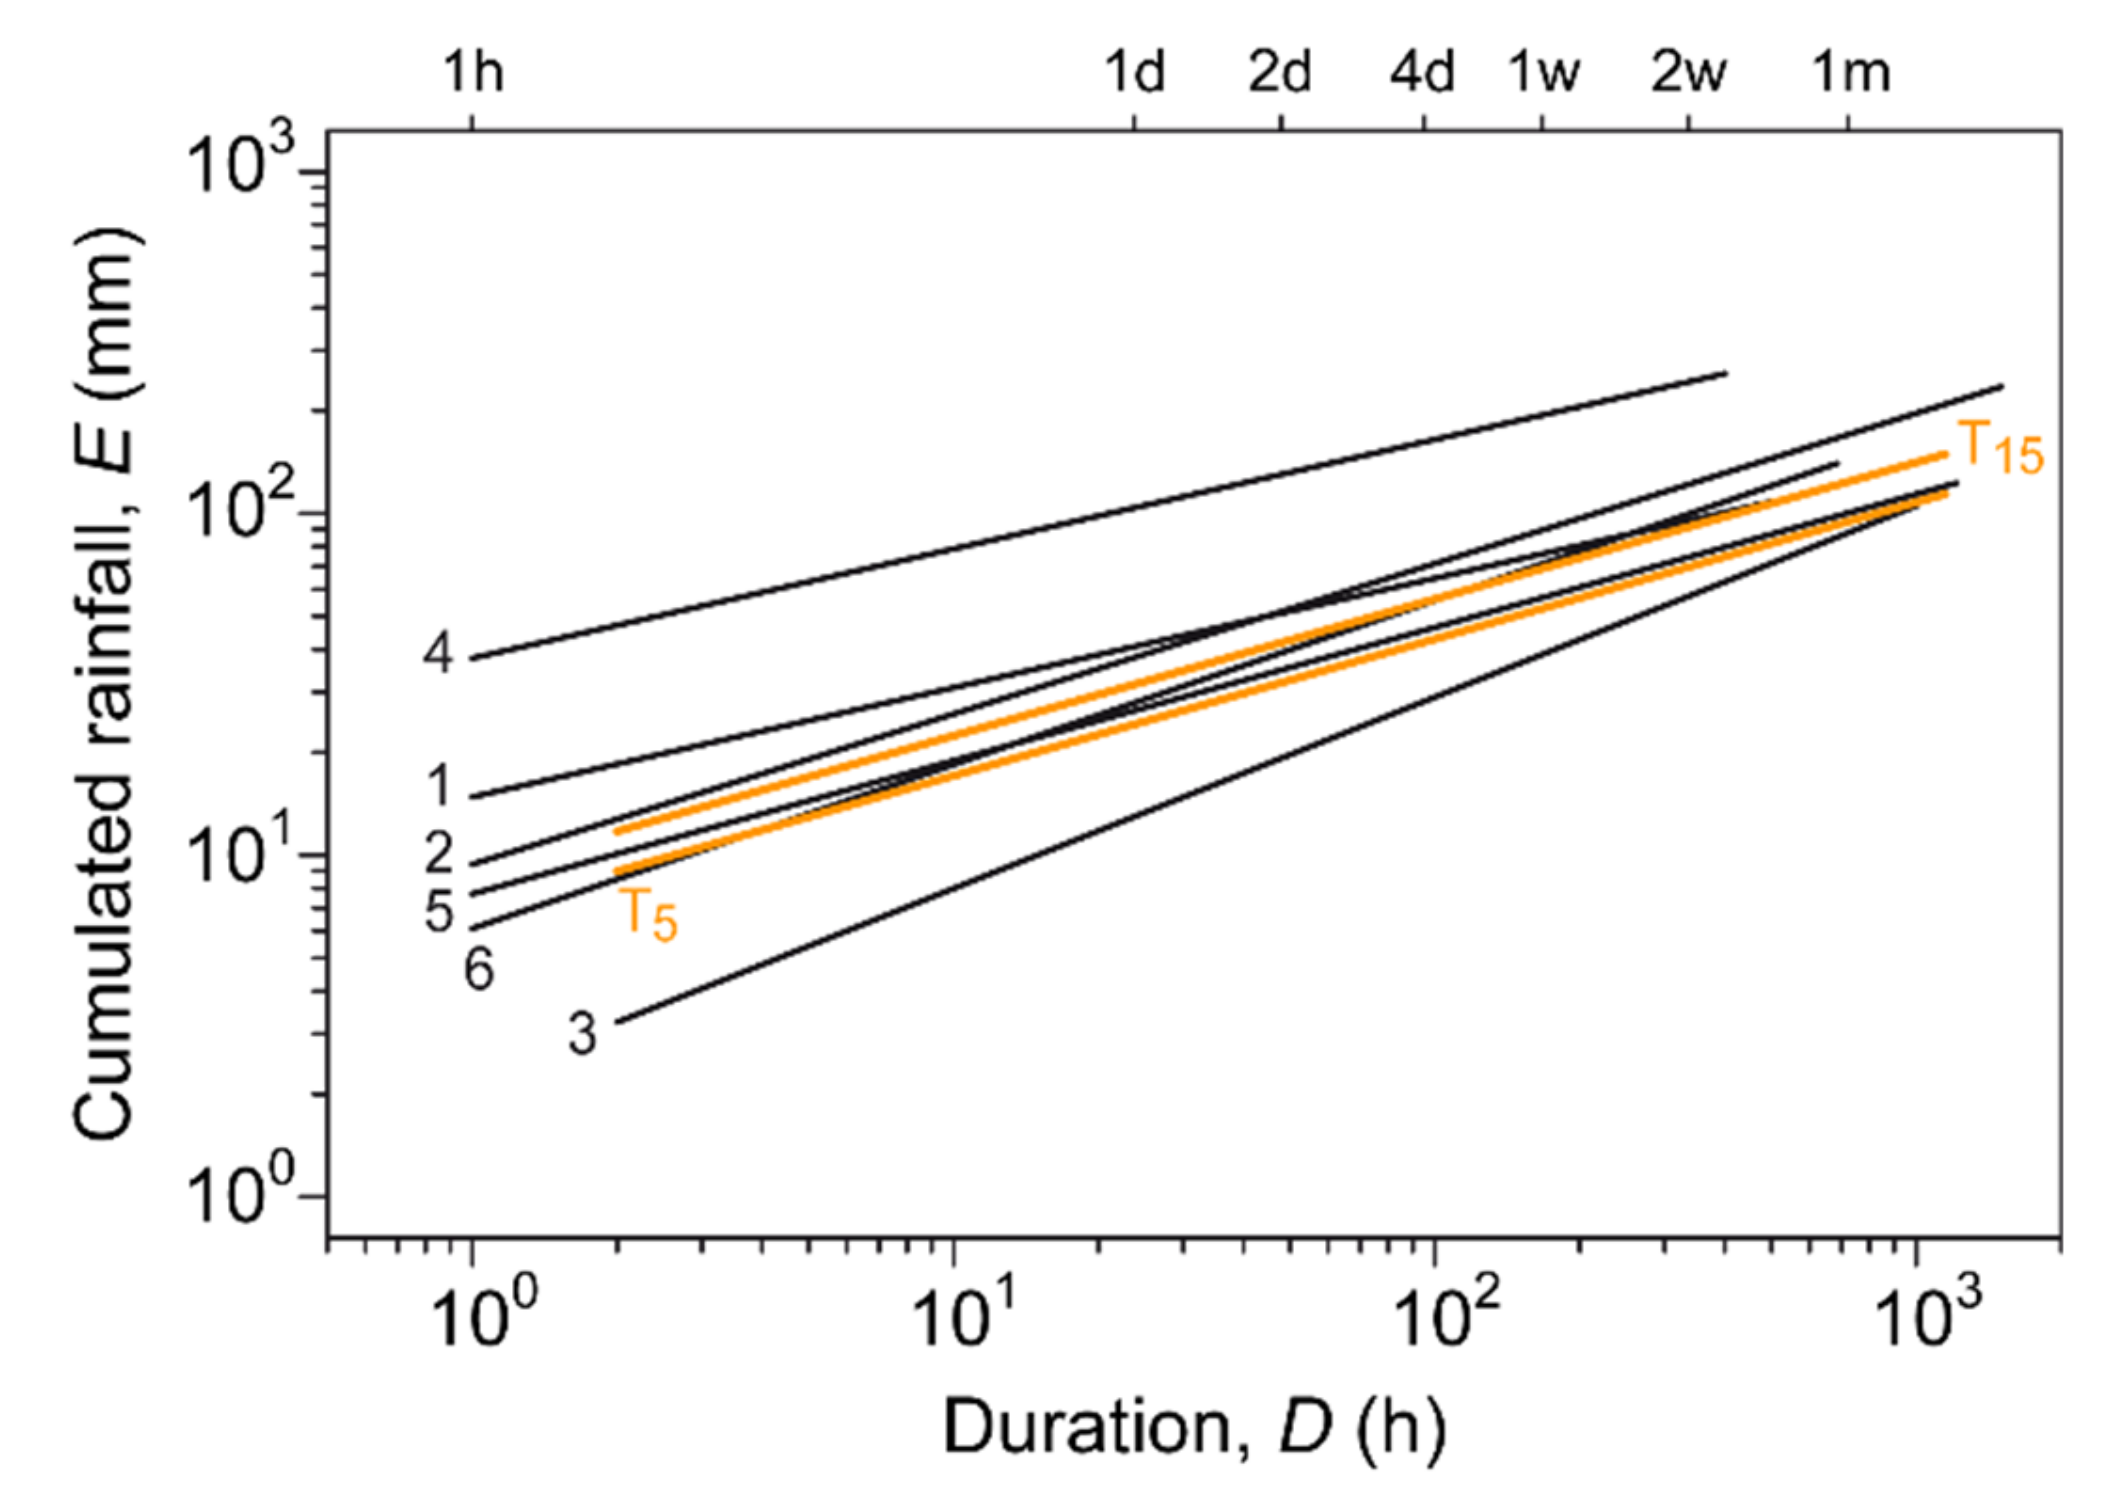
Comparing the proposed new thresholds with the existing ones, in particular with the Slovenian threshold calculated by Rosi et al. [25] (4 in Figure 9), a large difference in the intercept of the thresholds and a small difference in the slope of the functions is noticeable: the new thresholds T5,SVN, and T15,SVN are much lower than the previously calculated Slovenian thresholds [25]. Nevertheless, the thresholds defined in this work are higher than those defined for Central and Southern Europe (an area that includes Slovenia) by Guzzetti et al. [6] (2 in Figure 9) and lower, in particular at short durations, than the global thresholds by Caine [5] and Guzzetti et al. [7] (1 and 3 in Figure 9, respectively). In addition, these differences can be ascribed to the use of different sets of input data, such as the number of landslides and time period, as well as on the available rainfall data. Rosi et al. [25] used landslides that occurred between 2007 and 2014 and a limited rainfall dataset (1 rain gauge per 460 km2). On the other hand, T5,SVN was defined with the same method and has the same resolution of rainfall data (hourly) and the same non-exceeding probability as the thresholds for Italy [39] (5 in Figure 9) and for the Italian Alpine area [40] (6 in Figure 9).
Interestingly, T5,SVN is very similar to the Italian threshold, while it has a slope that is different to the Alpine threshold. Comparing the 5% threshold defined for Slovenia with that defined with the same approach for Italy, some differences are observed. The Slovenian threshold has a similar slope and a lower intersection than the Italian one. Furthermore, the relative uncertainties for the Slovenian case study are higher. This is due to the lower number of empirical data points (368 compared to the 2309 in the Italian case) and also to a different distribution of points in the ED graph. In fact, the percentage of MPRC with D ≤ 6 h is 5.4% in the Slovenian case and 12% in the Italian case. This is due to the coarser (daily vs. hourly) temporal resolution of the landslide data in Slovenia.
The difference between the new Slovenian thresholds and the threshold for the Alpine chain can be ascribed at the same cause. One could have expected that the Slovenian threshold would be similar to the Alpine one, given the similar environment and latitude. However, this difference is again related to the diverse temporal resolution of the two landslide catalogs: daily for Slovenia and hourly for the Alps. Working with daily information for landslides can result in missing several very short (<6 h) rainfall events that can drive the slope of the threshold.

5. Conclusions

In this paper, new ED thresholds for Slovenia were calculated using the automatic tool proposed by Melillo et al. [32] The main objective was to reconstruct the cumulated event rainfall and the duration of the rainfall conditions responsible for landslide occurrences in order to obtain reliable thresholds that could be implemented in a LEWS. Based on the presented results the following conclusions can be drawn.
The proposed ED thresholds were determined for the entire Slovenian territory, given that the current national landslide prediction system provides alerts at a national scale. Compared to other thresholds obtained with empirical approaches, the current curves are slightly lower. It should be noted, however, that the threshold used for the comparison is at 5% NEP. The main strength of the frequentist approach lies in the possibility of calculating thresholds at different non-exceeding probabilities, which could be used in probabilistic schemes to produce rising alert levels for landslide occurrence [17].
Thresholds for different MAR classes were also calculated. Due to the high relative uncertainties of the threshold parameters, not all the calculated thresholds can currently be implemented in a LEWS. However, they provide an idea of the landslide triggering conditions in the study area. The higher the mean annual rainfall in an area, the more rainfall is needed to trigger a landslide.
Thresholds for different geological classes were also determined. Due to the high relative uncertainties, not all the defined thresholds are reliable enough to be implemented in a LEWS. They can be considered only as an indicator of the rainfall conditions responsible for landslide occurrences in different lithological units. The sedimentary rocks are more subject to weathering and thus have the lowest thresholds and are by far more susceptible to landslide occurrences than those areas with limestone and magmatic bedrocks.
The main advantages of the tool—whose code is freely downloadable at http://geomorphology.irpi.cnr.it/tools/rainfall-events-and-landslides-thresholds/ctrl-t-algorithm/ctrl-code/ctrl_t_code.r/view—are (i) the fast processing of a large amount of data, which provides results in a short time, (ii) the reduction of subjectivity in the whole process of reconstructing rainfall conditions responsible for the failures and (iii) the definition and validation of rainfall thresholds.
The proposed 15% NEP threshold might be further tested using the national prototype LEWS and critically assessed on the basis of case studies, reviewing the landslide database and ensuring accurate information on the location and the occurrence date/time of the landslide.

Author Contributions

Conceptualization, G.J., S.L.G., M.M. and M.J.A.; Data curation, G.J. and M.J.A.; Formal analysis, G.J., S.L.G., M.M. and M.J.A.; Methodology, S.L.G., M.M., S.P. and M.T.B.; Software, S.L.G., M.M., S.P. and M.T.B.; Visualization, G.J., S.L.G., M.M. and S.P.; Writing—original draft, G.J., S.L.G., M.M., S.P. and M.T.B.; Writing—review and editing, all authors. All authors have approved the submitted version of the manuscript.

Funding

This research received no external funding.

Acknowledgments

This work was supported by the Slovenian Research Agency (Young researcher number 53536 and the research program P1-0195: “Geoenvironment and Geomaterials”). The authors would like to thank the Slovenian Administration for Civil Protection and Disaster Relief and the Ministry for Defense for financing the project Masprem, and the Slovenian Environment Agency (ARSO) for providing rainfall and rain gauge data. The authors would also like to thank the two anonymous reviewers and the editor for their constructive comments that helped to improve the manuscript. The code of CTRL-T was written using the R open-source software and can be freely downloaded at: http://geomorphology.irpi.cnr.it/tools/rainfall-events-and-landslides-thresholds/ctrl-t-algorithm/ctrl-code/ctrl_t_code.r/view. An example of the input files required by the algorithm can be freely downloaded at: http://geomorphology.irpi.cnr.it/tools/rainfall-events-and-landslides-thresholds/ctrl-t-algorithm/input-demo/INPUT.zip/view.

Conflicts of Interest

The authors declare no conflict of interest.

References

  1. Komac, M. Intenzivne padavine kot sprožilni dejavnik pri pojavljanju plazov v Sloveniji=Rainstorms as a landslide-triggering factor in Slovenia. Geologija 2005, 48, 263–279. [Google Scholar] [CrossRef]
  2. Gariano, S.L.; Guzzetti, F. Landslides in a changing climate. Earth-Sci. Rev. 2016, 162, 227–252. [Google Scholar] [CrossRef] [Green Version]
  3. Campbell, R.H. Soil Slips, Debris Flows, and Rainstorms in the Santa Monica Mountains and Vicinity, Southern California; US Government Printing Office: Washington, DC, USA, 1975; Volume 851, p. 51. [Google Scholar]
  4. Nilsen, T.H.; Turner, B.L. Influence of Rainfall and Ancient Landslide Deposits on Recent Landslides (1950-71) in Urban Areas of Contra Costa County, California; Government Printing Office: Washington, DC, USA, 1975; Volume 1388, p. 18. [Google Scholar]
  5. Caine, N. The rainfall intensity: Duration control of shallow landslides and debris flows. Geogr. Ann. 1980, 62, 23–27. [Google Scholar] [CrossRef]
  6. Guzzetti, F.; Peruccacci, S.; Rossi, M.; Stark, C.P. Rainfall thresholds for the initiation of landslides in central and southern Europe. Meteorol. Atmos. Phys. 2007, 98, 239–267. [Google Scholar] [CrossRef]
  7. Guzzetti, F.; Peruccacci, S.; Rossi, M.; Stark, C.P. The rainfall intensity-duration control of shallow landslides and debris flows: An update. Landslides 2008, 5, 3–17. [Google Scholar] [CrossRef]
  8. Segoni, S.; Piciullo, L.; Gariano, S.L. A review of the recent literature on rainfall thresholds for landslide occurrence. Landslides 2018, 15, 1483–1501. [Google Scholar] [CrossRef]
  9. Piciullo, L.; Calvello, M.; Cepeda, J.M. Territorial early warning systems for rainfall-induced landslides. Earth-Sci. Rev. 2018, 179, 228–247. [Google Scholar] [CrossRef]
  10. Guzzetti, F.; Gariano, S.L.; Peruccacci, S.; Brunetti, M.T.; Marchesini, I.; Rossi, M.; Melillo, M. Geographical landslide early warning systems. Earth-Sci. Rev. 2020, 200, 102973. [Google Scholar] [CrossRef]
  11. Cannon, S.H.; Ellen, S.D. Rainfall conditions for abundant debris avalanches, San Francisco Bay region, California. Calif. Geol. Surv. 1985, 38, 267–272. [Google Scholar]
  12. Wieczorek, G.F. Effect if rainfall intensity and duration on debris flows in central Santa Cruz Mountains. In Debris Flow/Avalanches: Process, Recognition, and Mitigation; Costa, J.E., Wieczorek, G.F., Eds.; Geological Society of America: Reviews in Engineering Geology: Boulder, CO, USA, 1987; Volume 7, pp. 93–104. [Google Scholar]
  13. Ortigao, B.; Justi, M.G. Rio-watch: The Rio de Janeiro Landslide Alarm System. Geotech. News 2004, 22, 28–31. [Google Scholar]
  14. Calvello, M.; d’Orsi, R.N.; Piciullo, L.; Paes, N.; Magalhaes, M.; Lacerda, W.A. The Rio de Janeiro early warning system for rainfall-induced landslides: Analysis of performance for the years 2010–2013. Int. J. Disaster Risk Reduct. 2015, 12, 3–15. [Google Scholar] [CrossRef]
  15. Jakob, M.; Weatherly, H. A hydroclimatic threshold for landslide initiation on the North Shore Mountains of Vancouver, British Columbia. Geomorphology 2003, 54, 137–156. [Google Scholar] [CrossRef]
  16. Wei, L.-W.; Huang, C.-M.; Chen, H.; Lee, C.-T.; Chi, C.-C.; Chiu, C.-L. Adopting the I3-R24 rainfall index and landslide susceptibility for the establishment of an early warning model for rainfall-induced shallow landslides. Nat. Hazards Earth Syst. 2018, 18, 1717–1733. [Google Scholar] [CrossRef] [Green Version]
  17. Rossi, M.; Marchesini, I.; Tonelli, G.; Peruccacci, S.; Brunetti, M.T.; Luciani, S.; Ardizzone, F.; Balducci, V.; Bianchi, C.; Cardinali, M.; et al. TXT-tool 2.039-1.1 Italian national early warning system. In Landslide Dynamics: ISDR-ICL Landslide Interactive Teaching Tools; Sassa, K., Guzzetti, F., Yamagishi, H., Arbanas, Ž., Casagli, N., McSaveney, M., Dang, K., Eds.; Springer: Cham, Switzerland, 2018; pp. 341–349. [Google Scholar] [CrossRef]
  18. Segoni, S.; Rosi, A.; Fanti, R.; Gallucci, A.; Monni, A.; Casagli, N. A Regional-Scale Landslide Warning System Based on 20 Years of Operational Experience. Water 2018, 10, 1297. [Google Scholar] [CrossRef] [Green Version]
  19. Aleotti, P. A warning system for rainfall-induced shallow failures. Eng. Geol. 2004, 73, 247–265. [Google Scholar] [CrossRef]
  20. Rosi, A.; Segoni, S.; Catani, F.; Casagli, N. Statistical and environmental analyses for the definition of a regional rainfall threshold system for landslide triggering in Tuscany (Italy). J. Geogr. Sci. 2012, 22, 617–629. [Google Scholar] [CrossRef]
  21. Segoni, S.; Rosi, A.; Rossi, G.; Catani, F.; Casagli, N. Analysing the relationship between rainfalls and landslides to define a mosaic of triggering thresholds for regional scale warning systems. Nat. Hazards Earth Syst. 2014, 14, 2637–2648. [Google Scholar] [CrossRef] [Green Version]
  22. Rosi, A.; Lagomarsino, D.; Rossi, G.; Segoni, S.; Battistini, A.; Casagli, N. Updating EWS rainfall thresholds for the triggering of landslides. Nat. Hazards 2015, 78, 297–308. [Google Scholar] [CrossRef]
  23. Brigandì, G.; Aronica, G.T.; Bonaccorso, B.; Gueli, R.; Basile, G. Flood and landslide warning based on rainfall thresholds and soil moisture indexes: The HEWS (Hydrohazards EarlyWarning System) for Sicily. ADGEO 2017, 44, 79–88. [Google Scholar] [CrossRef] [Green Version]
  24. Jemec Auflič, M.; Komac, M. Rainfall patterns for shallow landsliding in perialpine Slovenia. Nat. Hazards 2011, 67, 1011–1023. [Google Scholar] [CrossRef]
  25. Rosi, A.; Peternel, T.; Jemec Auflič, M.; Komac, M.; Casagli, N. Rainfall thresholds for rainfall-induced landslides in Slovenia. Landslides 2016, 13, 1571–1577. [Google Scholar] [CrossRef]
  26. Segoni, S.; Rossi, G.; Rosi, A.; Catani, F. Landslides triggered by rainfall: A semi-automated procedure to define consistent intensity-duration thresholds. Comput. Geosci. 2014, 63, 123–131. [Google Scholar] [CrossRef]
  27. Bezak, N.; Šraj, M.; Mikoš, M. Copula-based IDF curves and empirical rainfall thresholds for flash floods and rainfall-induced landslides. J. Hydrol. 2016, 541, 272–284. [Google Scholar] [CrossRef]
  28. Bezak, N.; Jemec Auflič, M.; Mikoš, M. Application of hydrological modelling for temporal prediction of rainfall-induced shallow landslides. Landslides 2019, 16, 1273–1283. [Google Scholar] [CrossRef] [Green Version]
  29. Jordanova, G.; Verbovšek, T.; Jemec Auflič, M. Validation and proposal of new rainfall thresholds for shallow landslide prediction in Posavsko hills, Eastern Slovenia. In Proceedings of the 4th Regional Symposium on Landslides in the Adriatic-Balkan Region, Sarajevo, Bosnia and Herzegovina, 23–25 October 2019; Uljarević, M., Zekan, S., Salković, S., Ibrahimović, D., Eds.; Geotechnical Society of Bosnia and Herzegovina: Sarajevo, Bosnia and Herzegovina, 2019; pp. 37–42. [Google Scholar]
  30. Jemec Auflič, M.; Šinigoj, J.; Krivic, M.; Podboj, M.; Peternel, T.; Komac, M. Landslide prediction system for rainfall induced landslides in Slovenia (Masprem). Geologija 2016, 59, 259–271. [Google Scholar] [CrossRef]
  31. Jemec Auflič, M.; Šinigoj, J. Validation of the Slovenian national landslide forecast system using contingency matrices. Geophys. Res. Abstr. 2019, 21, 1. Available online: https://meetingorganizer.copernicus.org/EGU2019/EGU2019-13338.pdf (accessed on 30 April 2020).
  32. Melillo, M.; Brunetti, M.T.; Peruccacci, S.; Gariano, S.L.; Roccati, A.; Guzzetti, F. A tool for the automatic calculation of rainfall thresholds for landslide occurrence. Environ. Model. Softw. 2018, 105, 230–243. [Google Scholar] [CrossRef]
  33. Gariano, S.L.; Melillo, M.; Peruccacci, S.; Brunetti, M.T. How much does the rainfall temporal resolution affect rainfall thresholds for landslide triggering? Nat. Hazards 2020, 100, 655–670. [Google Scholar] [CrossRef] [Green Version]
  34. Melillo, M.; Brunetti, M.T.; Peruccacci, S.; Gariano, S.L.; Guzzetti, F. An algorithm for the objective reconstruction of rainfall events responsible for landslides. Landslides 2015, 12, 311–320. [Google Scholar] [CrossRef]
  35. Melillo, M.; Brunetti, M.T.; Peruccacci, S.; Gariano, S.L.; Guzzetti, F. Rainfall thresholds for the possible landslide occurrence in Sicily (Southern Italy) based on the automatic reconstruction of rainfall events. Landslides 2016, 13, 165–172. [Google Scholar] [CrossRef]
  36. Bordoni, M.; Corradini, B.; Lucchelli, L.; Valentino, R.; Bittelli, M.; Vivaldi, V.; Meisina, C. Empirical and Physically Based Thresholds for the Occurrence of Shallow Landslides in a Prone Area of Northern Italian Apennines. Water 2019, 11, 2653. [Google Scholar] [CrossRef] [Green Version]
  37. Teja, T.S.; Dikshit, A.; Satyam, N. Determination of Rainfall Thresholds for Landslide Prediction Using an Algorithm-Based Approach: Case Study in the Darjeeling Himalayas, India. Geosciences 2019, 9, 302. [Google Scholar] [CrossRef] [Green Version]
  38. Gariano, S.L.; Sarkar, R.; Dikshit, A.; Dorji, K.; Brunetti, M.T.; Peruccacci, S.; Melillo, M. Automatic calculation of rainfall thresholds for landslide occurrence in Chukha Dzongkhag, Bhutan. Bull. Eng. Geol. Environ. 2019, 78, 4325–4332. [Google Scholar] [CrossRef]
  39. Peruccacci, S.; Brunetti, M.T.; Gariano, S.L.; Melillo, M.; Rossi, M.; Guzzetti, F. Rainfall thresholds for possible landslide occurrence in Italy. Geomorphology 2017, 290, 39–57. [Google Scholar] [CrossRef]
  40. Palladino, M.R.; Viero, A.; Turconi, L.; Brunetti, M.T.; Peruccacci, S.; Melillo, M.; Deganutti, A.M.; Guzzetti, F. Rainfall thresholds for the activation of shallow landslides in the Italian Alps: The role of environmental conditioning factors. Geomorphology 2018, 303, 53–67. [Google Scholar] [CrossRef]
  41. Komac, M.; Ribičič, M. Landslide susceptibility map of Slovenia at scale 1:250,000. Geologija 2006, 49, 295–309. [Google Scholar] [CrossRef]
  42. ARSO. Mean Annual Measured Precipitation between 1981 and 2010. Ministry for Environment and Spatial Planning. Environmental Agency of the Republic of Slovenia. 2016. Available online: http://www.meteo.si/uploads/probase/www/climate/image/sl/by_variable/precipitation/mean-annual-measured-precipitation_81-10.png (accessed on 18 December 2019).
  43. Thornthwaite, C.W. An approach toward a rational classification of climate. Geogr. Rev. 1948, 38, 55–94. [Google Scholar] [CrossRef]
  44. Thornthwaite, C.W.; Mather, J.R. Instructions and tables for computing potential evapotranspiration and the water balance. Publ. Climatol. Lab. Climatol. Drexel Inst. Technol. 1957, 10, 185–311. [Google Scholar]
  45. Dragoni, W.; Cambi, C.; Di Matteo, L.; Giontella, C.; Melillo, M.; Valigi, D. Possible response of two water systems in central Italy to climatic changes. In Advances in Watershed Hydrology; Moramarco, T., Barbetta, S., Brocca, L., Eds.; Water Resources Publications, LLC: Denver, CO, USA, 2015; pp. 397–424. ISBN 13 978-1-887-20185-8. [Google Scholar]
  46. Brunetti, M.T.; Peruccacci, S.; Rossi, M.; Luciani, S.; Valigi, D.; Guzzetti, F. Rainfall thresholds for the possible occurrence of landslides in Italy. Nat. Hazards Earth Syst. 2010, 10, 447–458. [Google Scholar] [CrossRef]
  47. Peruccacci, S.; Brunetti, M.T.; Luciani, S.; Vennari, C.; Guzzetti, F. Lithological and seasonal control of rainfall thresholds for the possible initiation of landslides in central Italy. Geomorphology 2012, 139, 79–90. [Google Scholar] [CrossRef]
  48. Peres, D.J.; Cancelliere, A.; Greco, R.; Bogaard, T.A. Influence of uncertain identification of triggering rainfall on the assessment of landslide early warning thresholds. Nat. Hazards Earth Syst. 2018, 18, 633–646. [Google Scholar] [CrossRef] [Green Version]
  49. Ribičič, M.; Komac, M.; Kumelj, Š.; Novak, M. Splošna Inženirsko-Geološka Karta Slovenije (General Engineering Geology Map of Slovenia). Geološki Zavod Slovenije—Geological Survey of Slovenia, 2008. Scale 1:1.000.000. Available online: http://www.egeologija.si/geonetwork/srv/eng/catalog.search#/metadata/d179cbc6-75fa-4a07-9096-814b07ff95a3 (accessed on 30 April 2020).
  50. Vennari, C.; Gariano, S.L.; Antronico, L.; Brunetti, M.T.; Iovine, G.; Peruccacci, S.; Terranova, O.; Guzzetti, F. Rainfall thresholds for shallow landslide occurrence in Calabria, southern Italy. Nat. Hazards Earth Syst. 2014, 14, 317–330. [Google Scholar] [CrossRef] [Green Version]
  51. Gariano, S.L.; Brunetti, M.T.; Iovine, G.; Melillo, M.; Peruccacci, S.; Terranova, O.; Vennari, C.; Guzzetti, F. Calibration and validation of rainfall thresholds for shallow landslide forecasting in Sicily, southern Italy. Geomorphology 2015, 228, 653–665. [Google Scholar] [CrossRef]
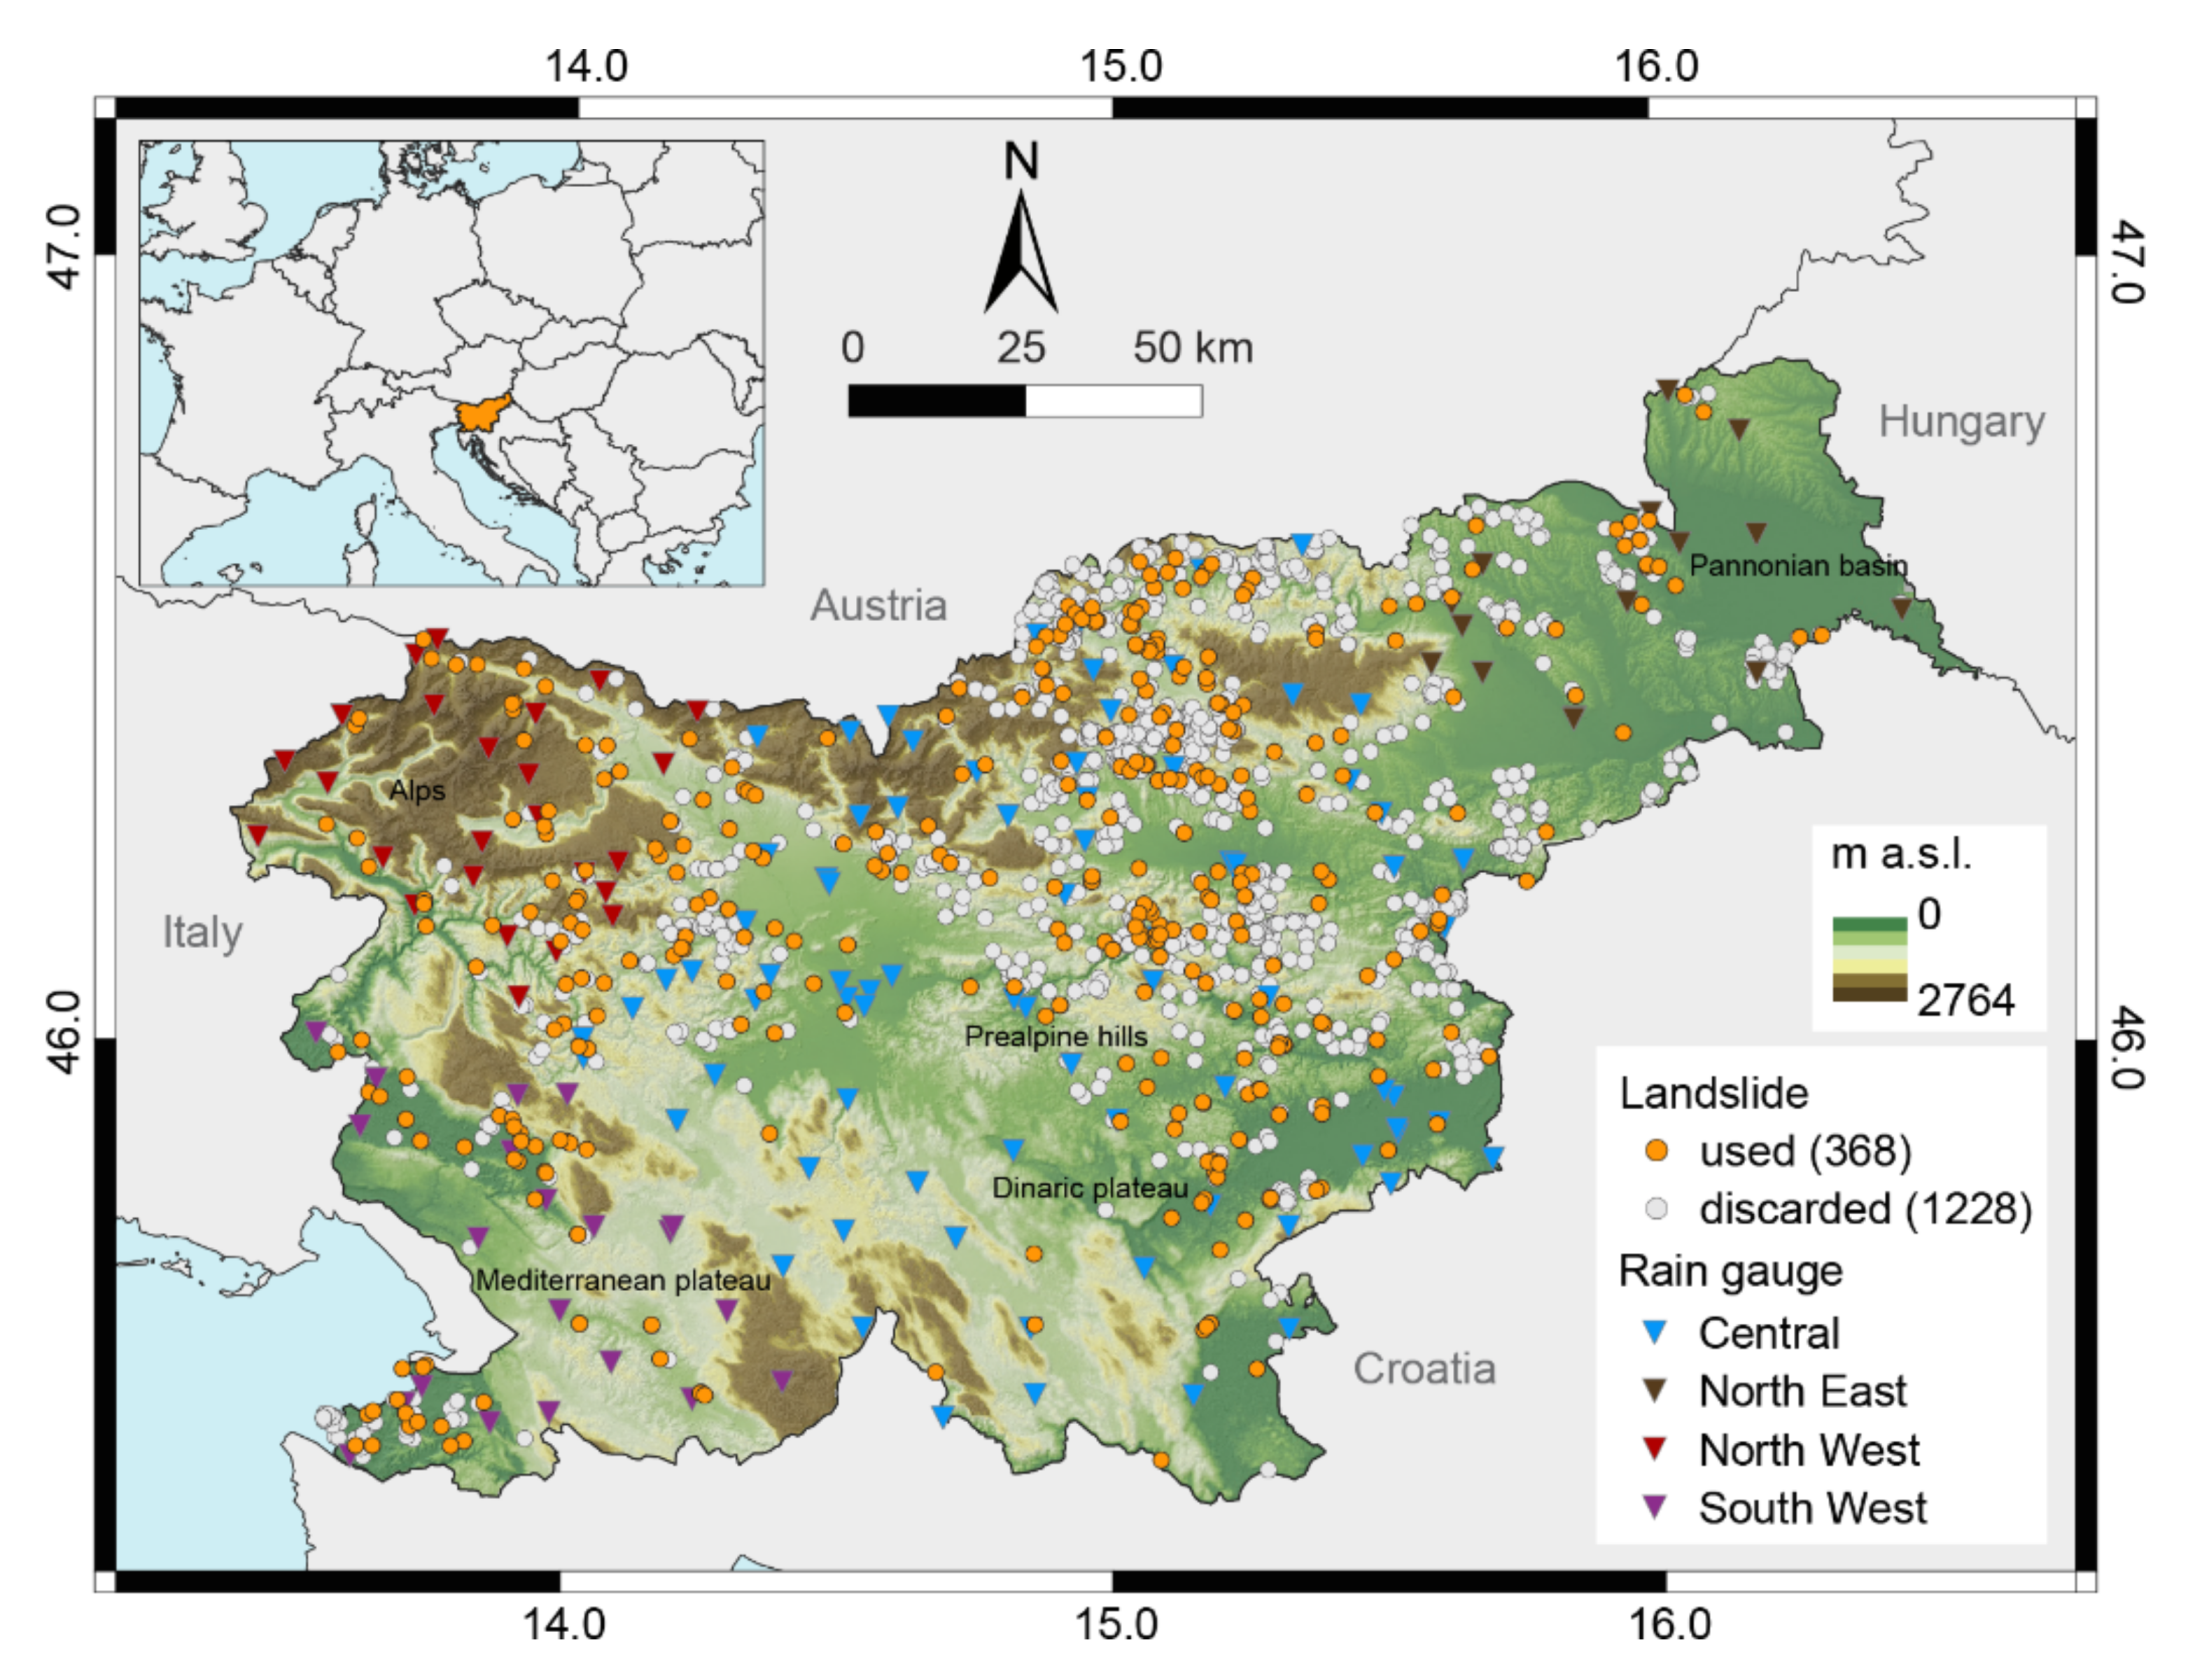
Figure 1. Location of Slovenia, with indication of the rain gauges used to reconstruct the rainfall events responsible for the failures, classified into four geographical areas related to rainfall characteristics, and of the landslides included in the analyzed catalogue. The landslides used for threshold calculations are indicated with orange dots.
Water 12 01449 g001
Figure 2. Calculated aridity index for individual regions: (a) South West; (b) North West; (c) North East; (d) Central region. Green and red areas indicate the cold/rainy and the warm/dry months, respectively.
Water 12 01449 g002
Figure 3. (a) Log-log plot with the cumulated event rainfall—duration ED, conditions that triggered landslides in Slovenia and the corresponding 5% ED threshold (T5,SVN). (b) T5,SVN threshold in the range 1 h ≤ D ≤ 120 h, in linear coordinates. The shaded areas represent the threshold uncertainty.
Water 12 01449 g003
Figure 4. Subdivision of Slovenia based on different mean annual rainfall (MAR) between 1981 and 2010 [42] into three classes, with indication of the landslides used in the analysis. The donut chart shows the number of landslides in each class.
Water 12 01449 g004
Figure 5. (a) Log-log plot with the ED (cumulated event rainfall—duration) conditions that triggered landslides in Slovenia classified according to three classes of mean annual rainfall (MAR) and corresponding 5% ED thresholds (T5,H, T5,M, T5,L). (b) Same thresholds and related uncertainties (shaded areas) in the range 1 h ≤ D ≤ 120 h, in linear coordinates. Legend: L, 800 mm ≤ MAR ≤ 1300 mm; M, 1300 mm < MAR ≤ 1600 mm; H, 1600 mm < MAR ≤ 4000 mm.
Water 12 01449 g005
Figure 6. Subdivision of Slovenia into four main lithological classes based on the engineering geological map by Ribičič et al. [49], with indication of the landslides used in the analysis. The donut chart shows the number of landslides in each class.
Water 12 01449 g006
Figure 7. (a) Log–log plot with the ED (cumulated event rainfall—duration) conditions that triggered landslides in Slovenia classified in four geological classes and corresponding 5% thresholds (T5,IG, T5,LD, T5,US, T5,BS). (b) Same thresholds and related uncertainties (shaded areas) in the range 1 h ≤ D ≤ 120 h in linear coordinates. The thresholds with not-acceptable uncertainties are indicated with dotted lines. Legend: IG, Igneous and metamorphic complex; LD, Limestone and dolomite; US, Unbound sediments or sedimentary rocks; BS, Bound sedimentary rocks.
Water 12 01449 g007
Figure 8. Classification of thresholds at different non-exceeding probabilities (black points) in the ROC space. The threshold closest to the best prediction point (green point) is the optimal threshold. Horizontal and vertical bars represent the range of variation of TPR and FPR for the 100 runs in which the MPRCs are randomly selected.
Water 12 01449 g008
Figure 9. Comparison between the 5% and 15% thresholds for Slovenia and other global (1 and 3), regional (2 and 6) and national (4 and 5) thresholds. Source, numbered chronologically: 1, global threshold by Caine [5]; 2, threshold for Central and Southern Europe by Guzzetti et al. [6]; 3, global threshold by Guzzetti et al. [7]; 4, national threshold for Slovenia by Rosi et al. [25]; 5, national threshold for Italy by Peruccacci et al. [39]; 6, threshold for Alps by Palladino et al. [40].
Water 12 01449 g009
Table 1. Main characteristics of rainfall thresholds defined in this study.
NameRegionArea (km2)Number of MPRC*Threshold EquationDuration Range (h)Δα/α
(%)
Δγ/γ
(%)
T5,SVNSlovenia20,273368E = (6.8 ± 0.7)∙D(0.40 ± 0.02)2–114910.35.0
T1,SVNSlovenia20,273368E = (4.7 ± 0.5)∙D(0.40 ± 0.02)2–114910.65.0
T10,SVNSlovenia20,273368E = (8.2 ± 0.8)∙D(0.40 ± 0.02)2–11499.85.0
T15,SVNSlovenia20,273368E = (8.9 ± 0.9)∙D(0.40 ± 0.02)2–114910.15.0
T20,SVNSlovenia20,273368E = (10.5 ± 1.0)∙D(0.40 ± 0.02)2–11499.55.0
T50,SVNSlovenia20,273368E = (16.5 ± 1.6)∙D(0.40 ± 0.02)2–11499.75.0
T5,L800 ≤ MAR ≤ 1300 mm6538137E = (8.3 ± 1.1)∙D(0.34 ± 0.04)2–28013.211.8
T5,M1300 ≤ MAR ≤ 1600 mm6018127E = (7.3 ± 1.1)∙D(0.38 ± 0.04)2–24315.010.5
T5,H1600 ≤ MAR ≤ 4000 mm7717104E = (7.2 ± 1.6)∙D(0.41 ± 0.05)5–114922.211.9
T5,IGIgneous-metamorphic complex144448E = (14.8 ± 3.3)∙D(0.25 ± 0.05)2–13922.320.0
T5,LDLimestone and dolomite880372E = (8.9 ± 2.2)∙D(0.36 ± 0.06)5–18024.716.7
T5,USUnbound sediments5601106E = (5.3 ± 0.9)∙D(0.47 ± 0.04)3–114917.08.5
T5,BSBound sedimentary rocks4425142E = (5.9 ± 0.9)∙D(0.42 ± 0.04)2–30315.29.5
* MPRC—Maximum Probability Rainfall Condition.
Table 2. Mean values of the performing indexes for calculated thresholds at different non-exceedance probability. The 15% threshold has the highest scoring indexes. NEP, non-exceeding probability; TP, true positive; FN, false negative; FP, false positive; TN, true negative; TPR, true positive rate; FPR, false positive rate; TSS, true skill statistics; δ, distance from perfect classification point. The optimal value for TPR and TSS is 1, while for FPR and δ is 0.
NEPTPFNFPTNTPRFPRTSSδ
11091547550090.990.520.470.52
51055376167230.960.360.600.36
109812281576690.890.270.630.29
159218223582490.840.210.630.27
208623184286420.790.180.610.28
357237106294230.660.100.940.36
50575259098940.520.060.460.48