Article

Expert Opinion Valuation Method to Quantify Digital Water Metering Benefits

1
School of Engineering and Built Environment, Griffith University, Gold Coast, QLD 4222, Australia
2
Cities Research Institute, Griffith University, Gold Coast, QLD 4222, Australia
3
Civil Engineeering Department, Monash University, Clayton, VIC 3800, Australia
4
R. J. Keller & Associates, Edithvale, VIC 3196, Australia
5
Arts, Education and Law Group/Researcher Education & Development/ Environmental Futures Research Institute, Griffith University, Mt Gravatt, QLD 4122, Australia
*
Author to whom correspondence should be addressed.
Water 2020, 12(5), 1436; https://doi.org/10.3390/w12051436
Submission received: 30 March 2020 / Revised: 9 May 2020 / Accepted: 13 May 2020 / Published: 18 May 2020

Abstract

:
Business cases promoting the introduction of digital water metering (DWM) have, to date, focused on a limited number of benefits, especially water savings, metering costs, occupational health and safety (OHS), and deferral of capital works. An earlier study by the authors catalogued 75 possible benefits and developed a taxonomy based on a literature review, interviews and water industry reports. The objective of the present study was to elicit the opinions of Australian water industry experts on the benefits, then use the opinions to form probability distributions which, in future work, could be used to model the value of DWM benefits. The study findings have implications for researchers and practitioners seeking to accurately and stochastically model the benefits of DWM transformation programmes. Thematic analyses on the open ended responses scaled likelihood and estimated value of benefits into comparable units. We found 82% support for the benefits of DWM with only 6% disagreement and 12% non-commital; the savings value of cost of water benefits were predominately expected to range between 5% and 10% and much higher in some individual situations, while charges/operational costs benefits were predominately expected to range between 45% and 100%; and, moreover, we indicated how a risk-based range of project benefit could potentially be calculated. Opportunities for further investigations were identified.

1. Introduction

Many benefits of digital water metering (DWM) have been reported since one of the first reports on the “new automated meter reading” (AMR) systems emanated from the US in 1994 [1]. Use of AMR was being promoted as both “strategic” and “best practice” just three years later [2], with further deployments being reported in US cities from 1997–1999 [3,4]. Deployments have continued in the US and other countries since, and documented in case studies and reviews [5,6,7,8,9,10,11,12].
Research into specific issues has been conducted, increasing both awareness and knowledge of the potential benefits. Australian researchers have canvassed new opportunities to exploit the “big data” from DWM for water end-use analytics, leak identification, infrastructure planning, and sustainability issues [11,13,14,15,16]. International researchers have reported the benefits to tourist and holiday precincts, vacant properties, and water conservation practices from trials and case studies of DWM implementations [5,6,7,8,9,10,11,12].
Uptake of DWM among Australian water utilities has been slow. A review in 2014 reported a number of Net Present Value (NPV) analyses of automated metering infrastructure (AMI) projects [12]. To date, a number of small-sized water utilities operated within Local Councils in regional areas have deployed DWM [17,18], two mid-size water utilities have started their upgrades [19,20], some metropolitan water utilities have limited deployments for specific situations usually involving access issues [21,22]. Other water utilities are running trials to evaluate technologies, better understand change issues and measure benefits [11,23,24]. In the state of Victoria, during the 2018 pricing submissions to the Essential Services Commission (ESC), most of the 16 water utilities advised that they are considering the opportunity to switch to digital meters. In a comment on each utilities’ proposal, the Consumer Action Law Centre (CALC) requested more information on digital water meters and that success criteria be provided, before stating their opposition to time-of-use tariffs [25]. In response to the submissions and public comments, the ESC required water utilities to proceed to deliver positive net present value from full roll-outs [26].
The negative impact of the rollout of electricity smart meters continues to impact the move to “smart-meters” for water [25,27]. Consumers in Victoria, Australia were required to pay for their electricity smart meters, but the benefits were seen to go almost exclusively to the electricity companies. The Energy and Water Ombudsman (Victoria) dealt with the complaints and reported them annually and in a special report [28,29]. A case study describes the Victorian electricity smart meter rollout as a failed business case [24,30].
While the electricity industry has had issues with customer acceptance of digital metering, where DWM is used, and used for direct customer benefit, the response by customers has been positive [5,24,31]. Insight into successful deployments are reported in published case studies, unpublished reports and local press reports [6,10,24,32,33,34,35,36,37,38,39], as well as general reviews of DWM trials and implementations [11,40]. The literature review that preceded this study identified 75 benefits, many of them previously unreported, and catalogued them in a taxonomy [41]. Well-known benefits included identification of concealed leaks within properties, improved water balance analysis, meter reading cost savings, reduced mis-reads and estimated readings, reduced occupational health and safety issues, and more detailed water consumption data for network planning. Some of the less well-known benefits were improved cash flow through monthly billing [42], reduced administrative overhead of the current monthly payment plans from monthly billing [43,44,45,46], easier resolution of billing disputes, and identification of fire service cross-connections. Other less well-known benefits involve sub-metered properties such as strata-titled residences [47,48], water appliance performance monitoring [49,50,51,52], improved home and business security [53] and unauthorized water use monitoring at vacant properties [10].
To improve the chance of succeeding with business case, managers need to recognize that “business cases are multi-faceted” and “focus obsessively on turning perceived intangibles into hard numbers” [30], be smart with their strategies, consider opportunities more broadly across the business [54,55], and include some risk modelling that would better inform executive management of the range of possible outcomes [56,57]. However, the likelihood of the lesser-known benefits DWM from the catalogue being achievable, and them contributing to a business case, remained unknown from the literature review [1]. Spreadsheets aimed at calculating the Net Present Value (NPV) of DWM projects lacked any risk modelling [58,59,60].
The objective of this study was to measure the likelihood and value of the benefits of DWM, and to consider using the results in a benefit value modelling tool. This paper reports the methods used (Section 2), the outcomes of structured interviews (Section 3.1 and Section 3.2), and the quantification of the responses to develop frequency distributions used in a stochastic model (Section 3.3). The paper concludes with the limitations of the study (Section 4), a discussion of the findings and opportunities for further research (Section 5) and a conclusion (Section 6). The costs of DWM projects are not included here as they are considered to be water utility-specific and based on many factors including infrastructure requirements, purchasing power, tendering requirements, project strategies and technological advances.

2. Research Method

The use of structured interviews, and qualitative and quantitative analysis, was designed to address the lack of empirical evidence covering all benefits from previous studies.

2.1. Structured Interview Development

Structured interviews were used to elicit the opinions of experts on a very high number of issues (71) across many business areas where they might or might not have expertise. Group sessions, such as workshops, offered the opportunity to explore issues and build consensus. However, logistical issues such as gaining the attendance of all the necessary participants at the same time, the duration required to cover the issues and maintain participant interest, made in-person workshops unworkable. One-on-one interviews were ruled out for similar reasons, as well as the impact on the interviewer’s time and travel requirements. The use of an online survey offered many advantages including providing participants with the option of suspending and resuming the survey at a later time to enable work commitments to be met. A disadvantage of online surveys is the lack of opportunity to clarify questions and avoid misunderstandings. To counter this issue, and achieve a common understanding and a consistency of input, the questions were supplemented with some background information [61].
The question for the benefit of potentially reducing the number of special readings, D12, illustrates the typical question structure used in the survey: “D12. From your experience/knowledge will water businesses benefit from a reduction in special meter reads and to what extent? BACKGROUND: When customers leave properties the water meter needs to be read to enable the leaving customer to be billed and the arriving customer to start from zero. By taking the electronic reading of the meter at a nominated date and time can eliminate meter readers having to visit the property.”
Qualitative analysis was used to encode the expert assessments of likelihood and benefit value which could then be examined via quantitative analysis. Firstly a qualitative approach was used to elicit which benefits were supported as being achievable, and to what degree. Open-ended questions were chosen to allow the experts to quantify their knowledge using the units most familiar to them and ensure elicitation could be more accurate [60]. Secondly, quantitative analysis enabled probability distributions to be developed from the expert assessments. No attempt was made to establish a consensus among the expert opinions, so that the various ‘raw’ views have been used to establish the range and frequency of possible outcomes [62]. Thirdly, modelling of the benefit value demonstrated that cost benefits could be presented as statistical distributions [63].
In addition to the collection of opinions on the benefits, the survey instrument collected profiling data for each participant to enable any differences between expert cohorts to be identified.

2.2. Structured Interviews

2.2.1. Interview Design

A long survey raises issues around participant fatigue and maintaining interest [64,65]. The DWM benefits were grouped into blocks based on the business expertise relevant to the benefit. This ‘blocking’ filtered questions so that experts could avoid questions they would not be able to answer and, instead, concentrate their attention in areas in which they had the knowledge and/or expertise. Experts were able to select which blocks they would answer with the exception of the block of questions on customer goodwill, which appeared as the last block. While the Goodwill question-block was not mandatory, the experts were asked to answer as a customer as well as an expert, if they had expertise in the area.
For each benefit, experts were asked their views on the likelihood of the benefit being achieved and the extent of the benefit on savings or improvements. They were asked to describe any experience or evidence of the benefit that they were aware of. Each question was supported by some neutrally worded background information to assist the participant in understanding the context of the benefit [61].
The online survey included all benefits that had been identified at the time. Four additional benefits were identified during the course of the structured interviews. The number of questions in the different sections of the structured interviews comprised:
  • 1 question on ‘Consent’ to participate;
  • 8 questions covering participant profiling (1 open-ended, 2 multi-choice and 5 rating);
  • 71 questions seeking participants’ opinions of the benefits (grouped for knowledge/expertise into 13 blocks, open-ended); and,
  • 1 question to ‘Close’ the interview (open-ended)

2.2.2. Interview Approval, Testing and Recruitment

Ethics approval for the survey was obtained from Griffith University Ethics Department (2018/271) before proceeding.
Validity checks were conducted on the interview questions using an academic in the field and piloted the survey using a water industry professional, which refined question flow and wording.
The target audience were staff within water utilities and supporting organisations who had an involvement in key business areas. These areas include digital metering, water metering, operational planning, non-revenue water, customers, complaint handling or business support functions. We also recruited independent experts who had industry experience. Invitations were sent to liaising staff at water businesses who identified subject matter experts within the business and passed the invitation to them. Invitations were sent directly by the researchers to the independent experts.

2.2.3. Data Cleansing and Analysis Procedure

The experts’ responses were downloaded from the survey system and imported into a SQL database [66] for analysis. Limited data cleansing was applied to provide clarity in a number of ways: spelling and other obvious typographical errors, answers of “as above” and similar derivatives were modified to include the previous answer being referred to, where identifiable, and names of water utilities were removed to ensure their anonymity.
A sample of the responses were manually reviewed to identify keywords describing the experts’ assessments of the likelihood that the benefit could be achieved, and the extent of that benefit. An automated thematic analysis system was then iteratively developed [67,68,69,70] using SQL-queries and online dictionaries to group keywords and phrases into common levels [71,72].

2.2.4. Quantitative Analysis

We indicate how expert opinions could eventually be utilized, in a benefit value model for DWM. A model could be built using the @Risk [73] add-on to MS Excel [74] to demonstrate the use of distributions developed from expert assessments, and the Monte Carlo simulation of benefit value for a DWM project. The aim would be to provide a probablistically-weighted range of outcomes that could be a plausible input to business cases [63]. A set of hypothetical annual operating costs was developed by the researchers from published reports of water utilities and regulators, then used to test such a model. Here we merely illustrate the type of outputs available from such a model.

3. Results

3.1. Descriptive Statistics of Participant Profiles

Experts participating in the survey (n = 52) came from a cross-section of water utility types in Australia (large metropolitan authorities, regional urban authorities, water authorities within Local Government bodies) and related organisations (regulators, advocates, service industries). Their range of expertise and experience represented by their years in the industry, business areas and previous work with DWM are recorded in the following tables. Twenty-nine (56%) came from experts in Metropolitan water utilities, sixteen (31%) from regional water utilities and seven (13%) were former employees of water utilities or who work for organisations servicing the industry. Table 1 shows a breakdown of the number of years of experience of the participants for each of the service organization types. Participants were asked to identify the business areas in which they had experience and/or expertise. Table 2 shows the break-down for major business groups characterized as customer, technical and support. The survey asked for their level of specific experience and knowledge of DWM. Table 3 summarises the participants’ level of experience within the organization types.

3.2. Agreement Levels for DWM Benefits

The first thematic analysis identified codes describing the experts’ assessments for the first question of “agreement level”, and six themes were formed: strongly agree, agree, somewhat agree, low-agreement, do not agree, do not know (see Table 4). Codes were categorized into themes [71,72] with a Likert style scoring.
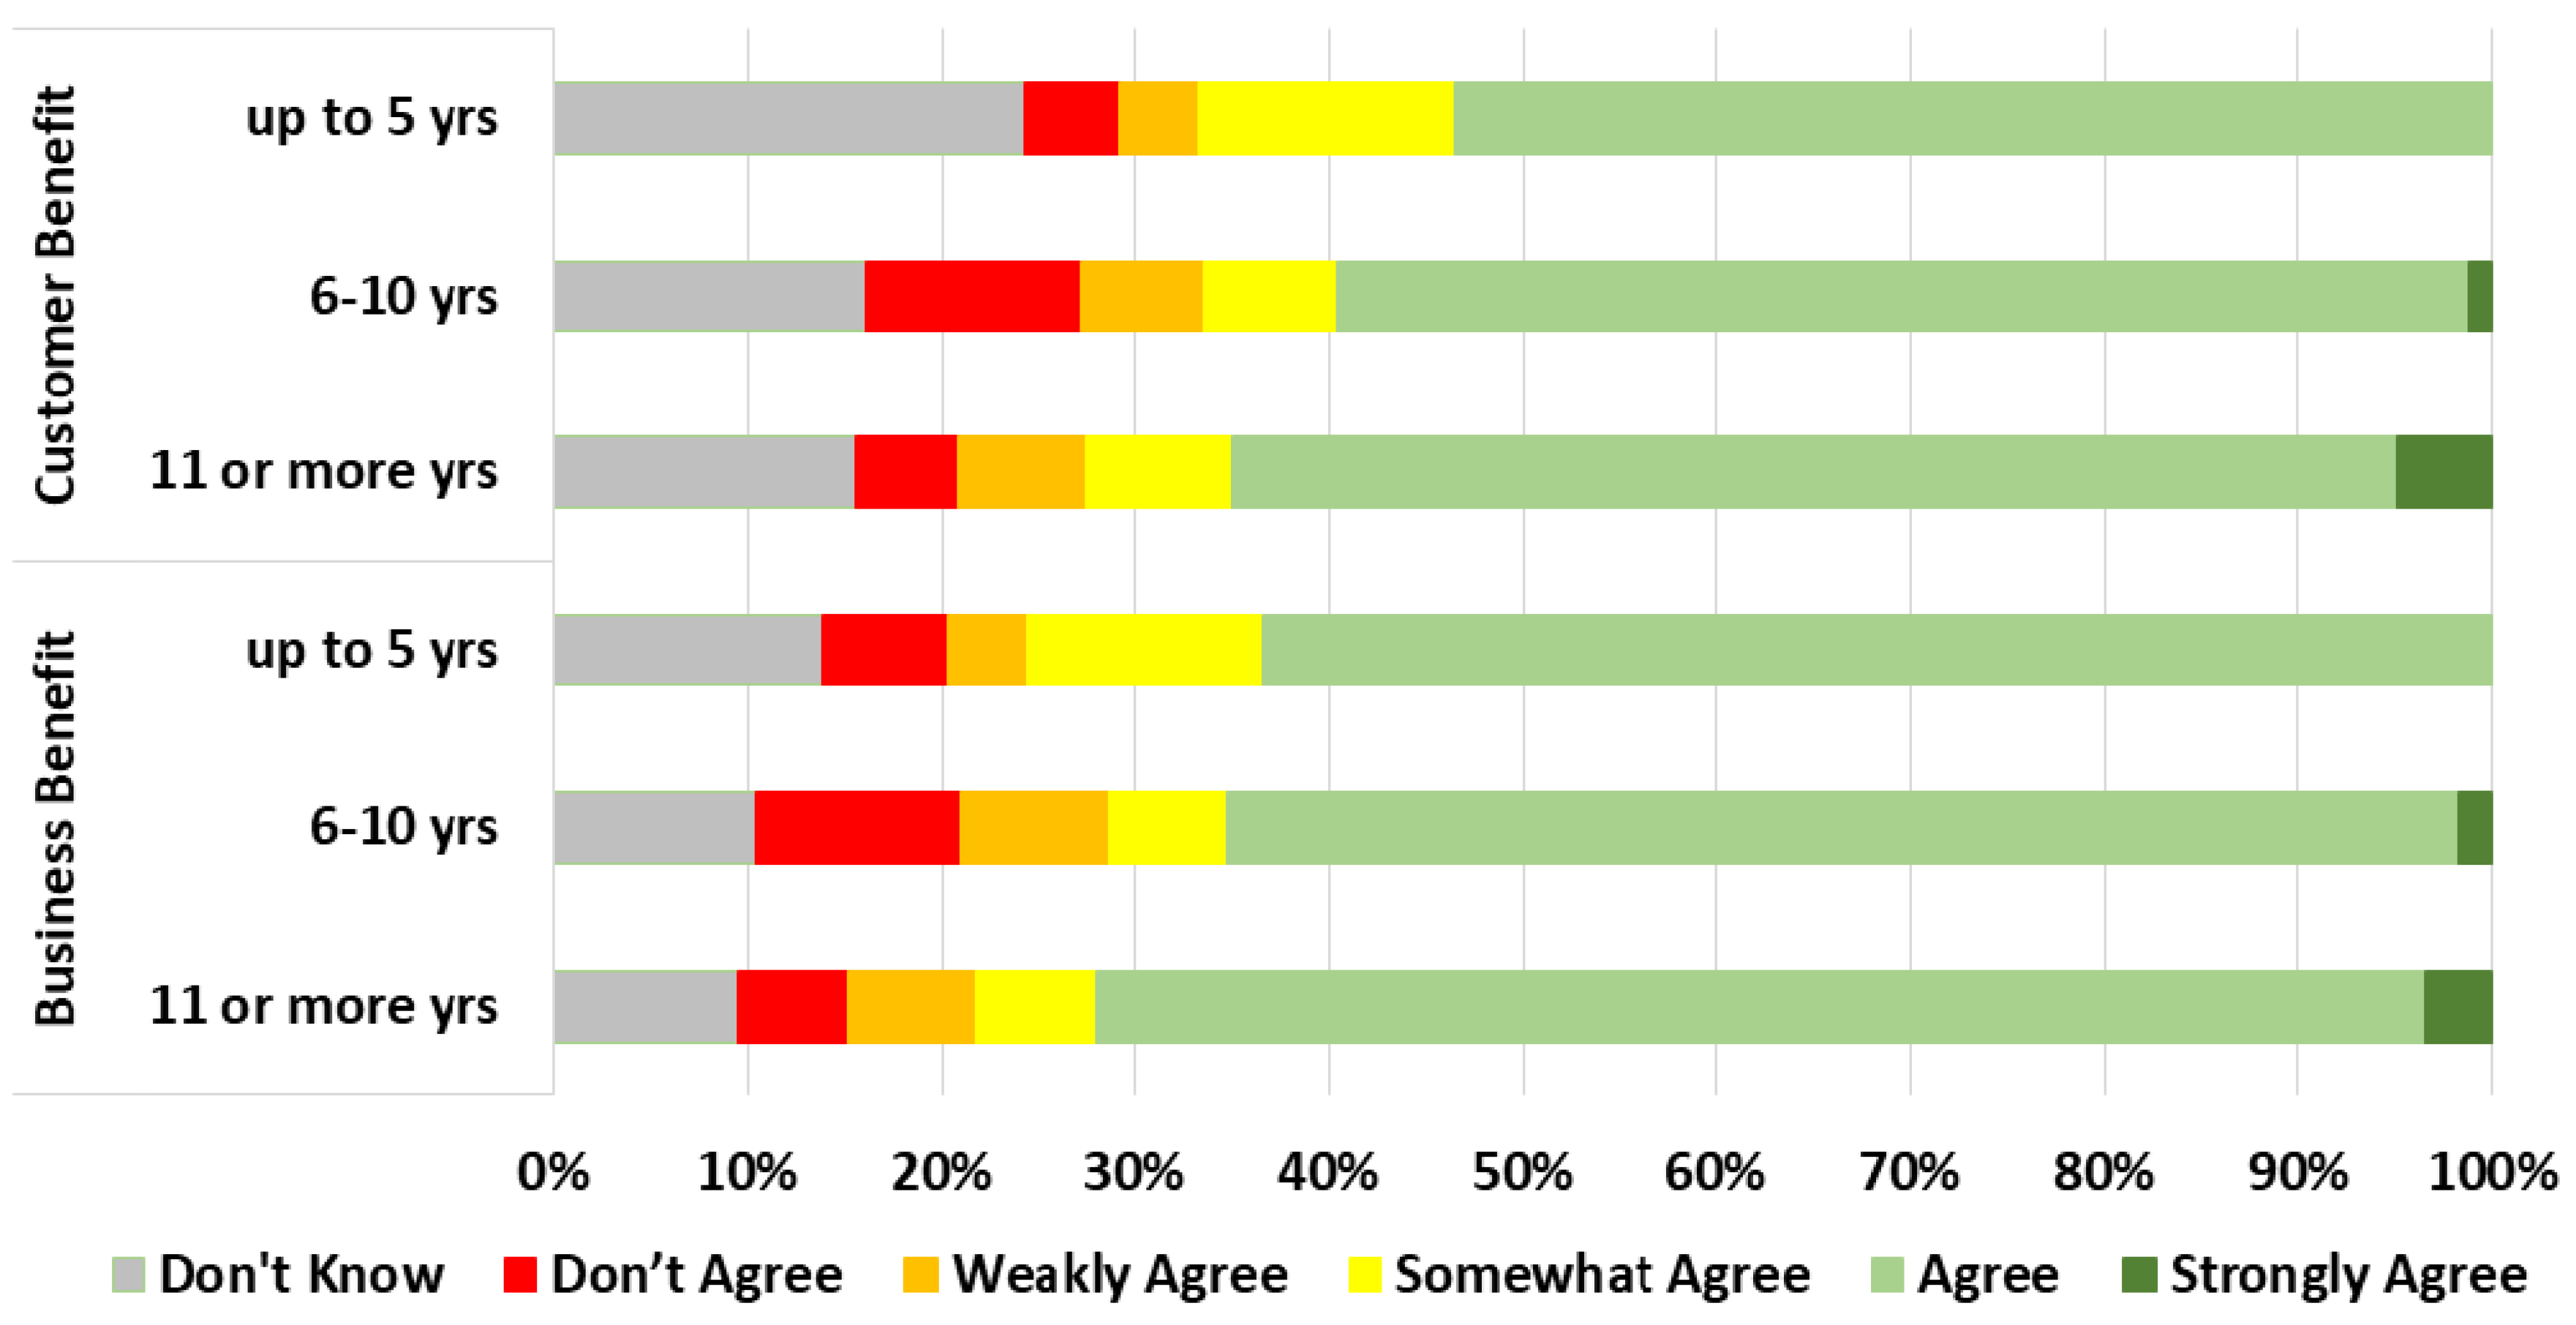
The thematic analysis and Likert style scoring allowed responses to be scored and frequency distributions built for the agreement level of each benefit. While the level of agreement varied between individual benefits, overall 82% agreed that digital water meters would deliver benefits with only 6% disagreeing and 12% not offering an opinion (‘do not know’). The benefits for water businesses scored higher levels of acceptance (83% agree, 7% disagree) than those benefits for customers (76% agree, 7% disagree) (see Figure 1). The level of ‘do not know’ responses jumped from 10% for the business benefits to 17% for the customer benefits. The number of ‘do not know’ responses was unexpected as questions had been blocked into 13 areas of expertise and participants were asked to select the block or blocks that they felt they could answer, but it may indicate that experts had not considered the benefit previously and were unwilling to make an assessment at the time.
The level of agreement scores by experience with digital metering again showed the discrepancy between business benefits and customer benefits, but also showed that inexperienced staff were more inclined to answer “do not know” (see Figure 2). After ignoring the ‘do not know’ responses the levels of agreement were consistent, ranging between 7.3% (experienced staff, business benefits) to 9.3% (experienced staff, customer benefits) with inexperienced staff in the middle (7.8%) for both beneficiary groups.
Experts with more years of experience were more likely to provide an opinion than inexperienced participants. Also, customer benefits attracted more ‘do not know’ responses across all years in the industry (see Figure 3).
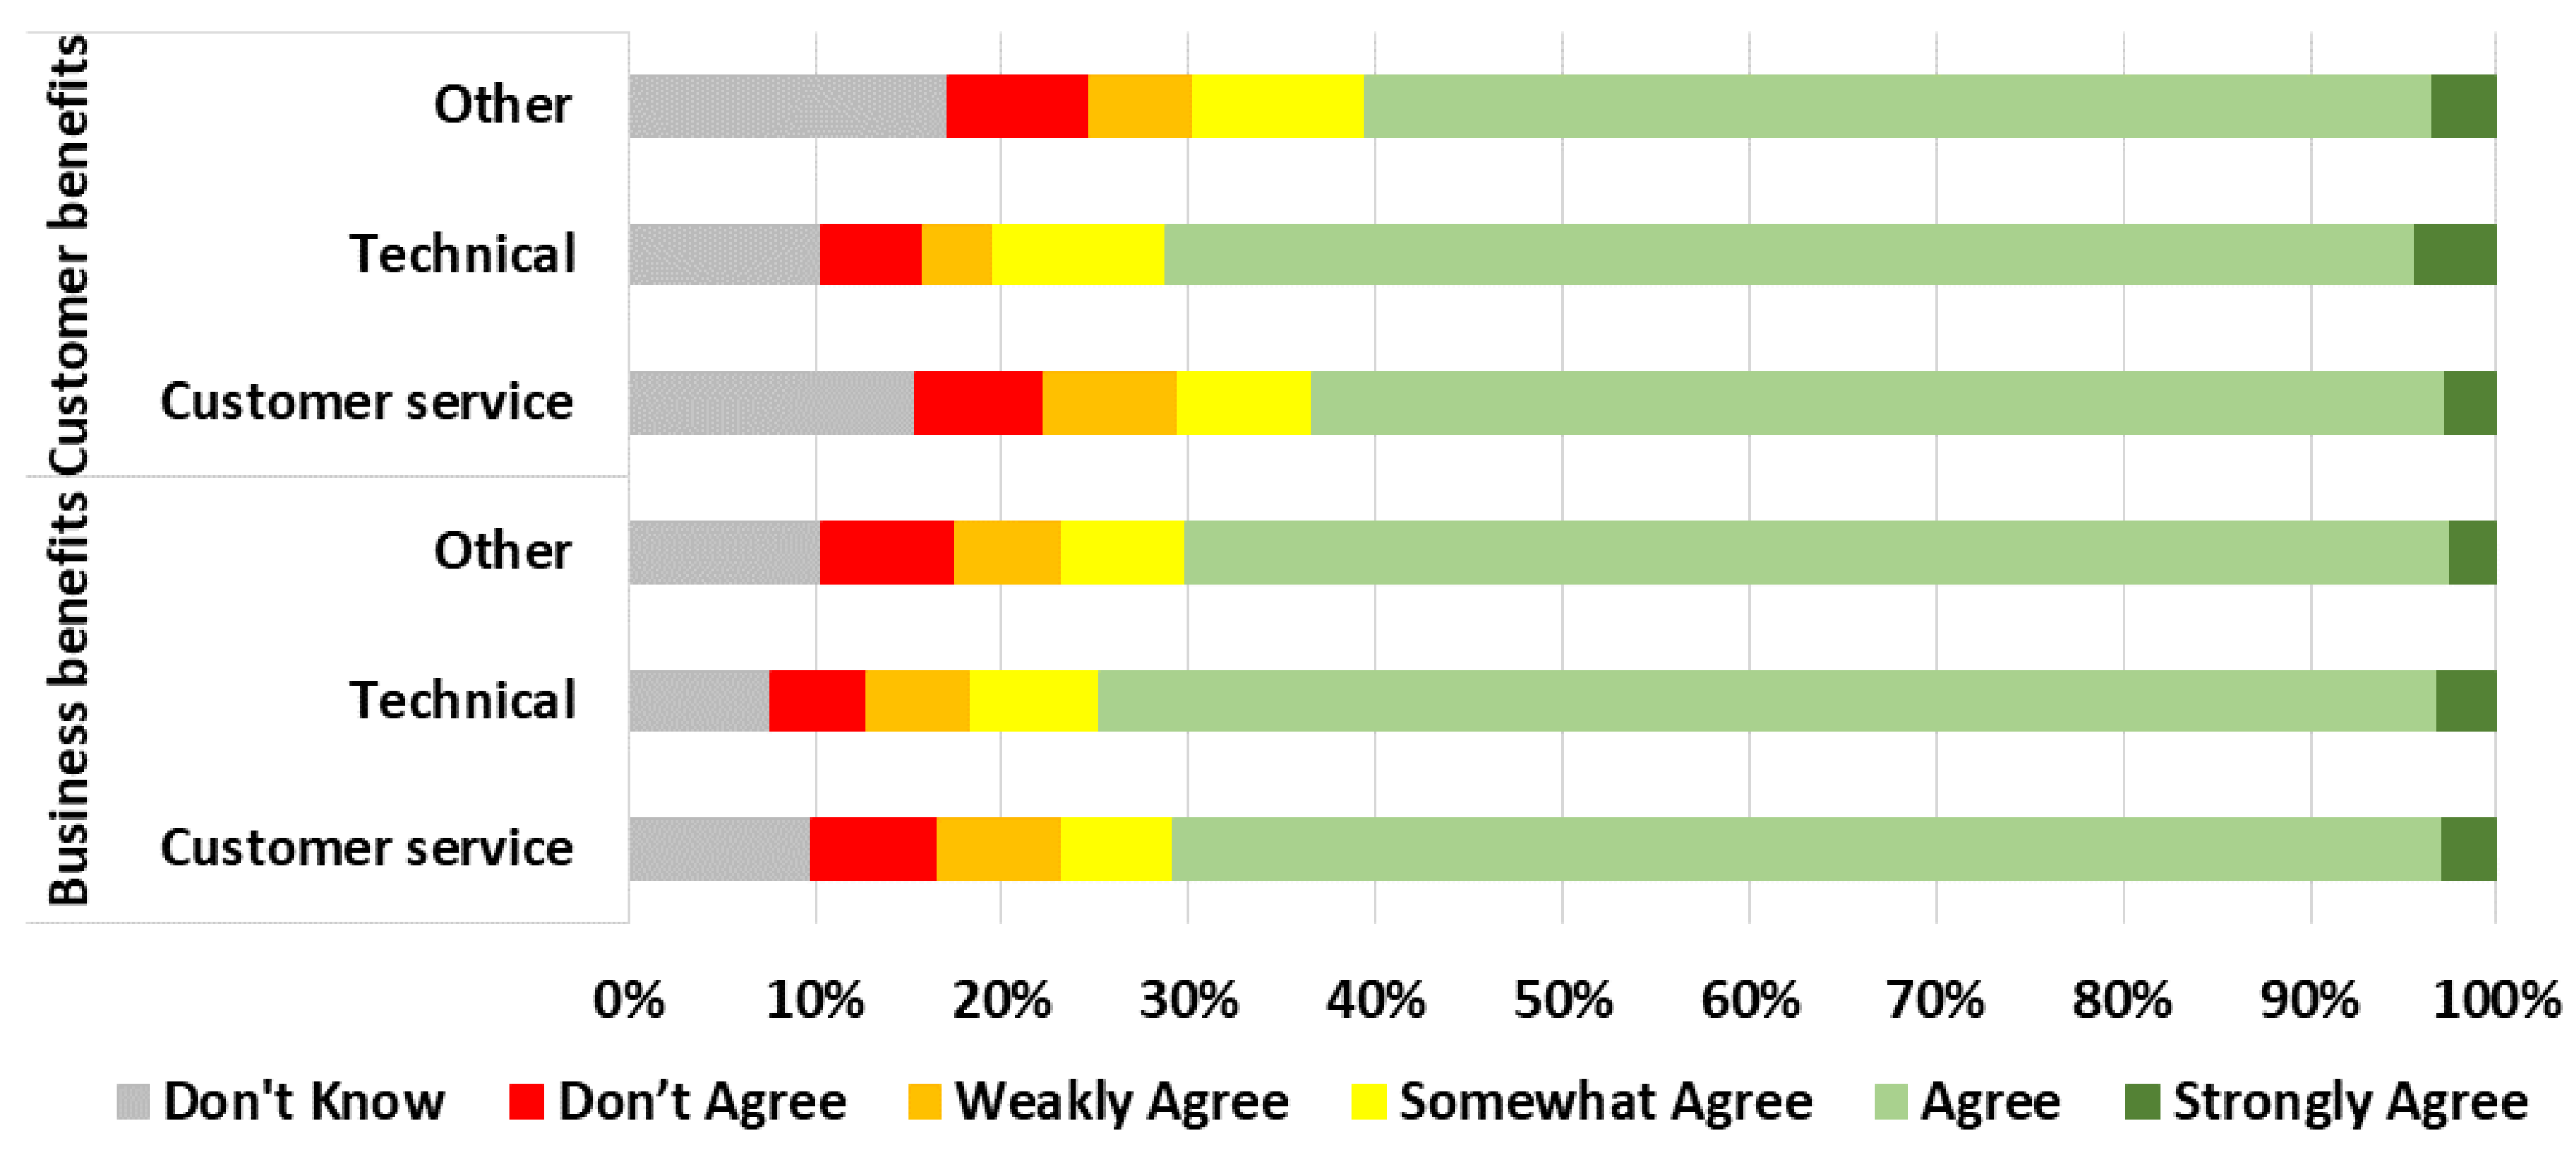
The level of agreement scores by the job role of staff is shown in Figure 4. Technical staff were more likely to provide opinions and, unexpectedly, 15% of the time, experts in customer service job roles did not provide an opinion for customer benefits. However, after excluding the ‘do not know’ responses, the levels of agreement were consistent across benefits regardless of the job role.
A general observation from the preceding graphs is that the level of agreement is increased with previous digital metering experience or years in the industry. The graph for job role shows that technical staff appear more aware of the benefits of DWM than customer service staff, whereas staff in other areas are least aware. It is notable that the business benefits consistently achieve a higher level of acceptance than customer benefits.
A summary of responses for each benefit, including reasons given for disagreeing with the benefits, and the frequency of scores for each of the benefits for the thematic analysis are listed in Sections 2 and 3 of Supplementary Material A respectively.

3.3. Benefit Quantification and Model Development

Having qualified the level of agreement among the experts, the study proceeded to quantify the extent of the value of each benefit to operationalise those qualitative findings into a quantitative model.

3.3.1. Initial Analysis

The second thematic analysis of responses looked to identify the extent of the benefit “value”. This analysis was limited to those responses with a positive level of agreement (ie. levels other than “do not know” or “disagree”). The extent of benefit was indicated by numbers, or by words and phrases such “substantial”, “significant”, “small”, “marginal”, and “negligible”. Forty-six (6%) of the 806 responses were quantified by a number, over half, 461 (57%), were quantified by the phrase, but 299 (37%) were neither quantified by number or phrase. Codes for the experts’ assessments of the extent of the benefit “value” grouped into five themes: substantial, significant, reduce (or improve), marginal and negligible. Table 5 lists a sample of codes categorized into themes [71,72] and a Likert style scoring that was applied to these themes.
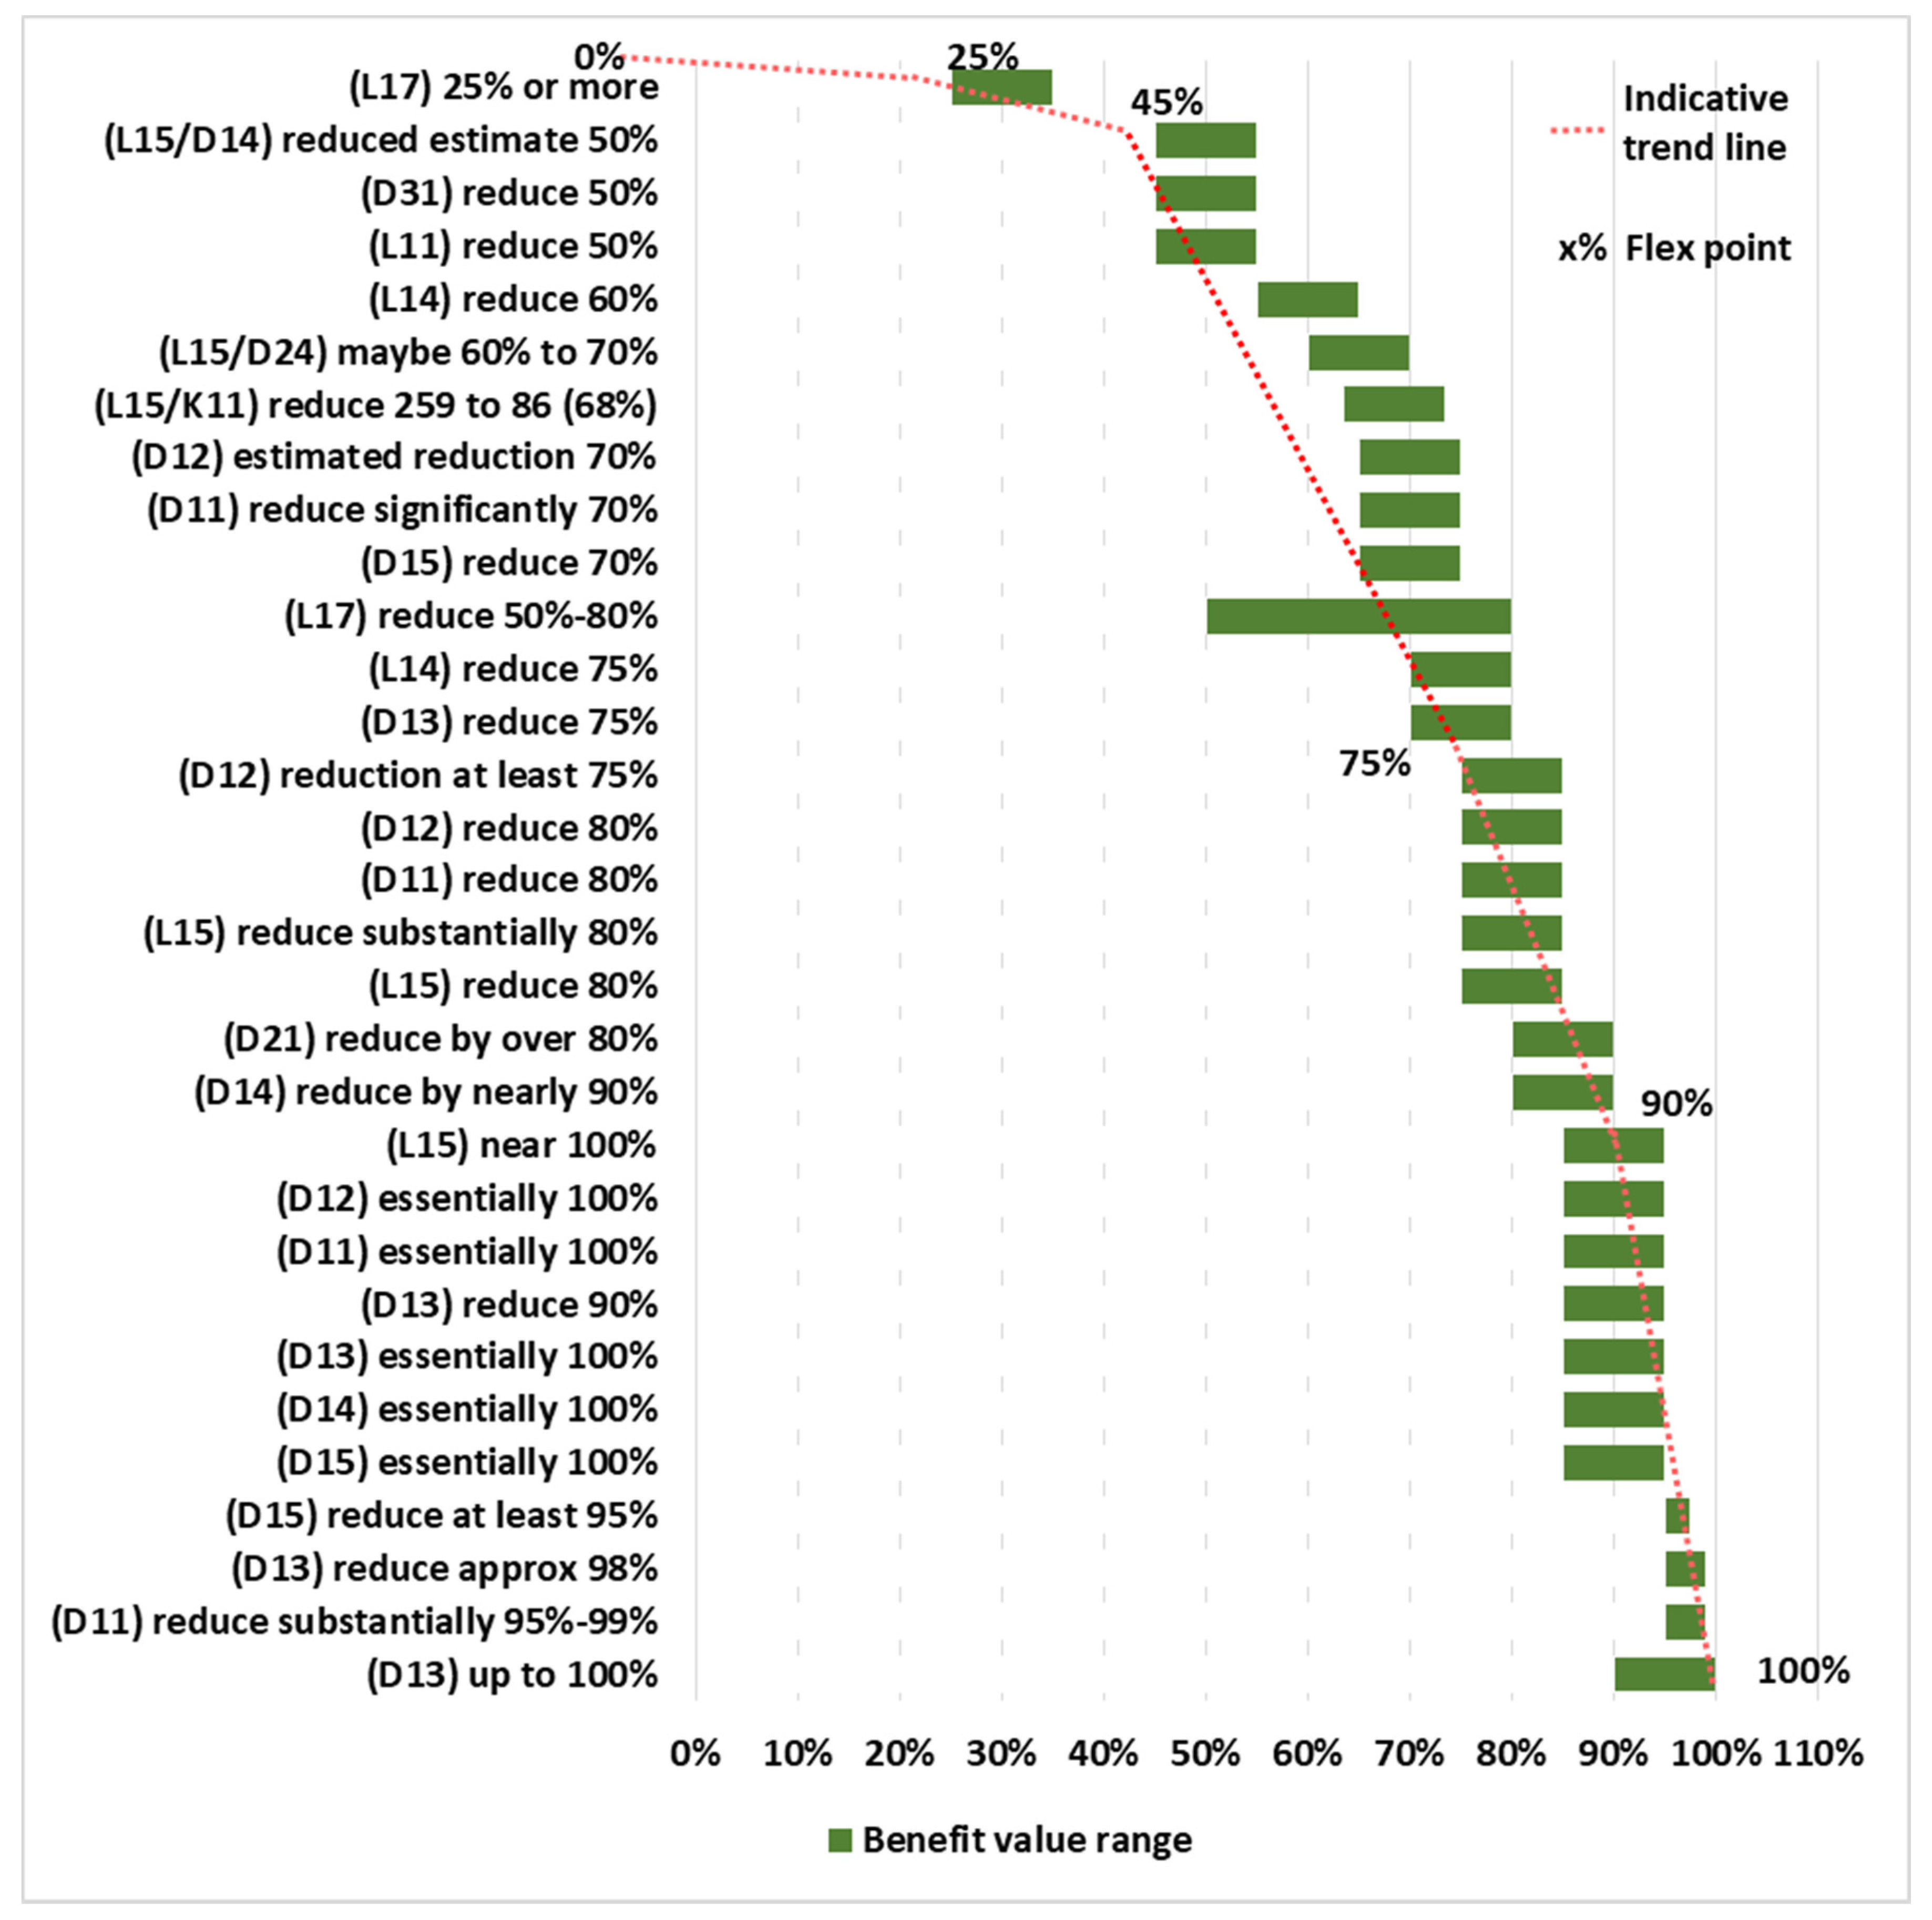
Where a descriptive word/phrase was not provided but a numeric benefit value was, the descriptive word was taken from the question (eg. reduce, improve) and this was then qualified by the benefit value, e.g., Q:“… reduce…?” A: “Yes—60%” Interpreted as “Reduce 60%”. Benefit values ranged from near 0% to near 100%. The wide range of values indicated in the expert assessments (see Figure 5 and Figure 6) lead to an examination of the business context of each benefit.

3.3.2. Examination of Benefit Value Assessments

The forty-six responses that included both descriptive word/phrase and value, provided the bridge between qualitative to quantitative analysis, and were the foundation for quantifying the ranges of benefit value. The encoded values of benefits appeared to have two distinctly different patterns—low rate (less than 5% and up to 25%) and a high rate (between 25% and 100%) (see Figure 5 and Figure 6). The benefits in each pattern were identified as being for two distinct contexts. The “low” rate was common for the 15 benefits related to the cost of water to the business or customer. The “high” rate was common for the 31 benefits related to charges and operational costs. Three high water saving estimates among the 46 expert assessments were noted. These were value estimates provided by experts of a regional water utility with low direct experience of digital metering. Such estimates are well above reported ranges of 3–8% (percentile 10–90%) [40]. High expectations may be valid for particular situations (e.g., an existing high non-revenue water (NRW) rate due to ageing and leaky network infrastructure and/or water theft). Furthermore, if used in modelling, this information would need to be tailored to local conditions.
In Figure 5 and Figure 6, trend lines shown on the graph are illustrative only. The x-axis labels show the extent of benefit value nominated in the experts’ assessment to benefit questions. The y-axis labels show the benefit value phrase used in the experts’ assessment to the assessed question (indicated by the question code in brackets from the survey questions in Section 3 of Supplementary Material A). Many experts quantified their assessments of benefits as ranges, so all quantified values were interpreted as both indicative, rather than absolute, and as ranges, rather than single values. The rules for this interpretation were:
  • A single number was converted to a range by adding and subtracting 5% from the nominated value (less was added or subtracted when the number was near the extremes—100% and 0%). (e.g., (L15) reduce 80% interpreted to 75% to 85%)
  • Where a range was indicated by phrase, but not specifically provided, 10% was added or taken from the limit value provided. For example, “25% or more” was interpreted as 25–35%, “up to 100%” was interpreted as 90–100%. When the nominated number was 10% or under, or 90% or over half the value to the limit was added or subtracted (e.g., (D15) reduce at least 95% interpreted as 95% to 97.5%)
The frequency of scores for each of the benefits for the second thematic analysis is listed in Section 3 of Supplementary Material A.

3.3.3. Quantification of Benefit Value

Ranges of benefit value for percentage savings were assigned to the five themes using the flex points on the trend lines in Figure 5 and Figure 6 as the bounds of each range (see Table 6). While this was done for both contexts it should be noted that there was scant data for the low ends of both contexts, so assumptions have been made by the researchers for the ranges of Negligible and Marginal benefits.
A sixth benefit value theme, disagree, has been added to cover the possibility of no benefit, i.e., a benefit of 0% saving. Together, the six themes can be considered to be the benefit-modelling themes. The sixth theme comes directly from the disagree theme for likelihood. As such, binary pair ‘disagree’ and ‘not disagree’, where ‘not disagree’ covers the positive likelihood themes listed in Table 4, creates a probability condition that can be used when modelling the benefit value.

3.3.4. Probability Distributions of Benefit Value

Frequency distributions for each of the six benefit modelling themes were created and used to build the stochastic model of benefit value [75] for each of the two contexts. Those expert assessments with a quantified benefit value or phrase were assigned to themes directly.
The other 299 expert assessments had a positive agreement level but no benefit value, for example, the simple response “yes”. These were considered as being ‘missing at random’ and three methods for imputing their value [70,76,77,78] were considered—use of the mode, proportionate, and surrogate. The surrogate method was adopted as use of mode biased the frequencies due to the number of responses involved, and the proportionate method had no impact on the relative frequencies. The use of the Agreement Level score was considered a suitable surrogate as it included a level of enthusiasm as part of the agreement. That is, weak agreement (1) could be equated to negligible benefit value (1), etc. Assessments with the fourth agreement level group, strong agreement, were distributed to benefit levels 4 and 5 proportionately based on the overall levels of benefit levels 4 and 5. The confusion matrix (see Table 7) shows the number of responses by agreement level for each of the benefit value levels with benefit levels 4 and 5 grouped to enable comparison to the highest agreement level, 4.
Empirical distributions of the scores were transformed into relative frequency probability distributions [79,80] for the benefit modelling themes and combined with the benefit value ranges for use in stochastic modelling. Table 8 provides a transformation of the frequency distributions to the benefit value ranges, for each theme, for the benefits of the cost of water context. The ranges are based on the flex points on the trend lines. Column 4 provides the raw sfrequencies for the themes. Column 5 includes both raw and imputed values for each theme. Column 6 is the cumulative frequencies and column 7 is the relative cumutaive frequncy (%). Table 9 provides the transformation, for each theme, for the benefits of the charges/operational costs context. The column definitions in Table 9 match the columns definitions in Table 8.
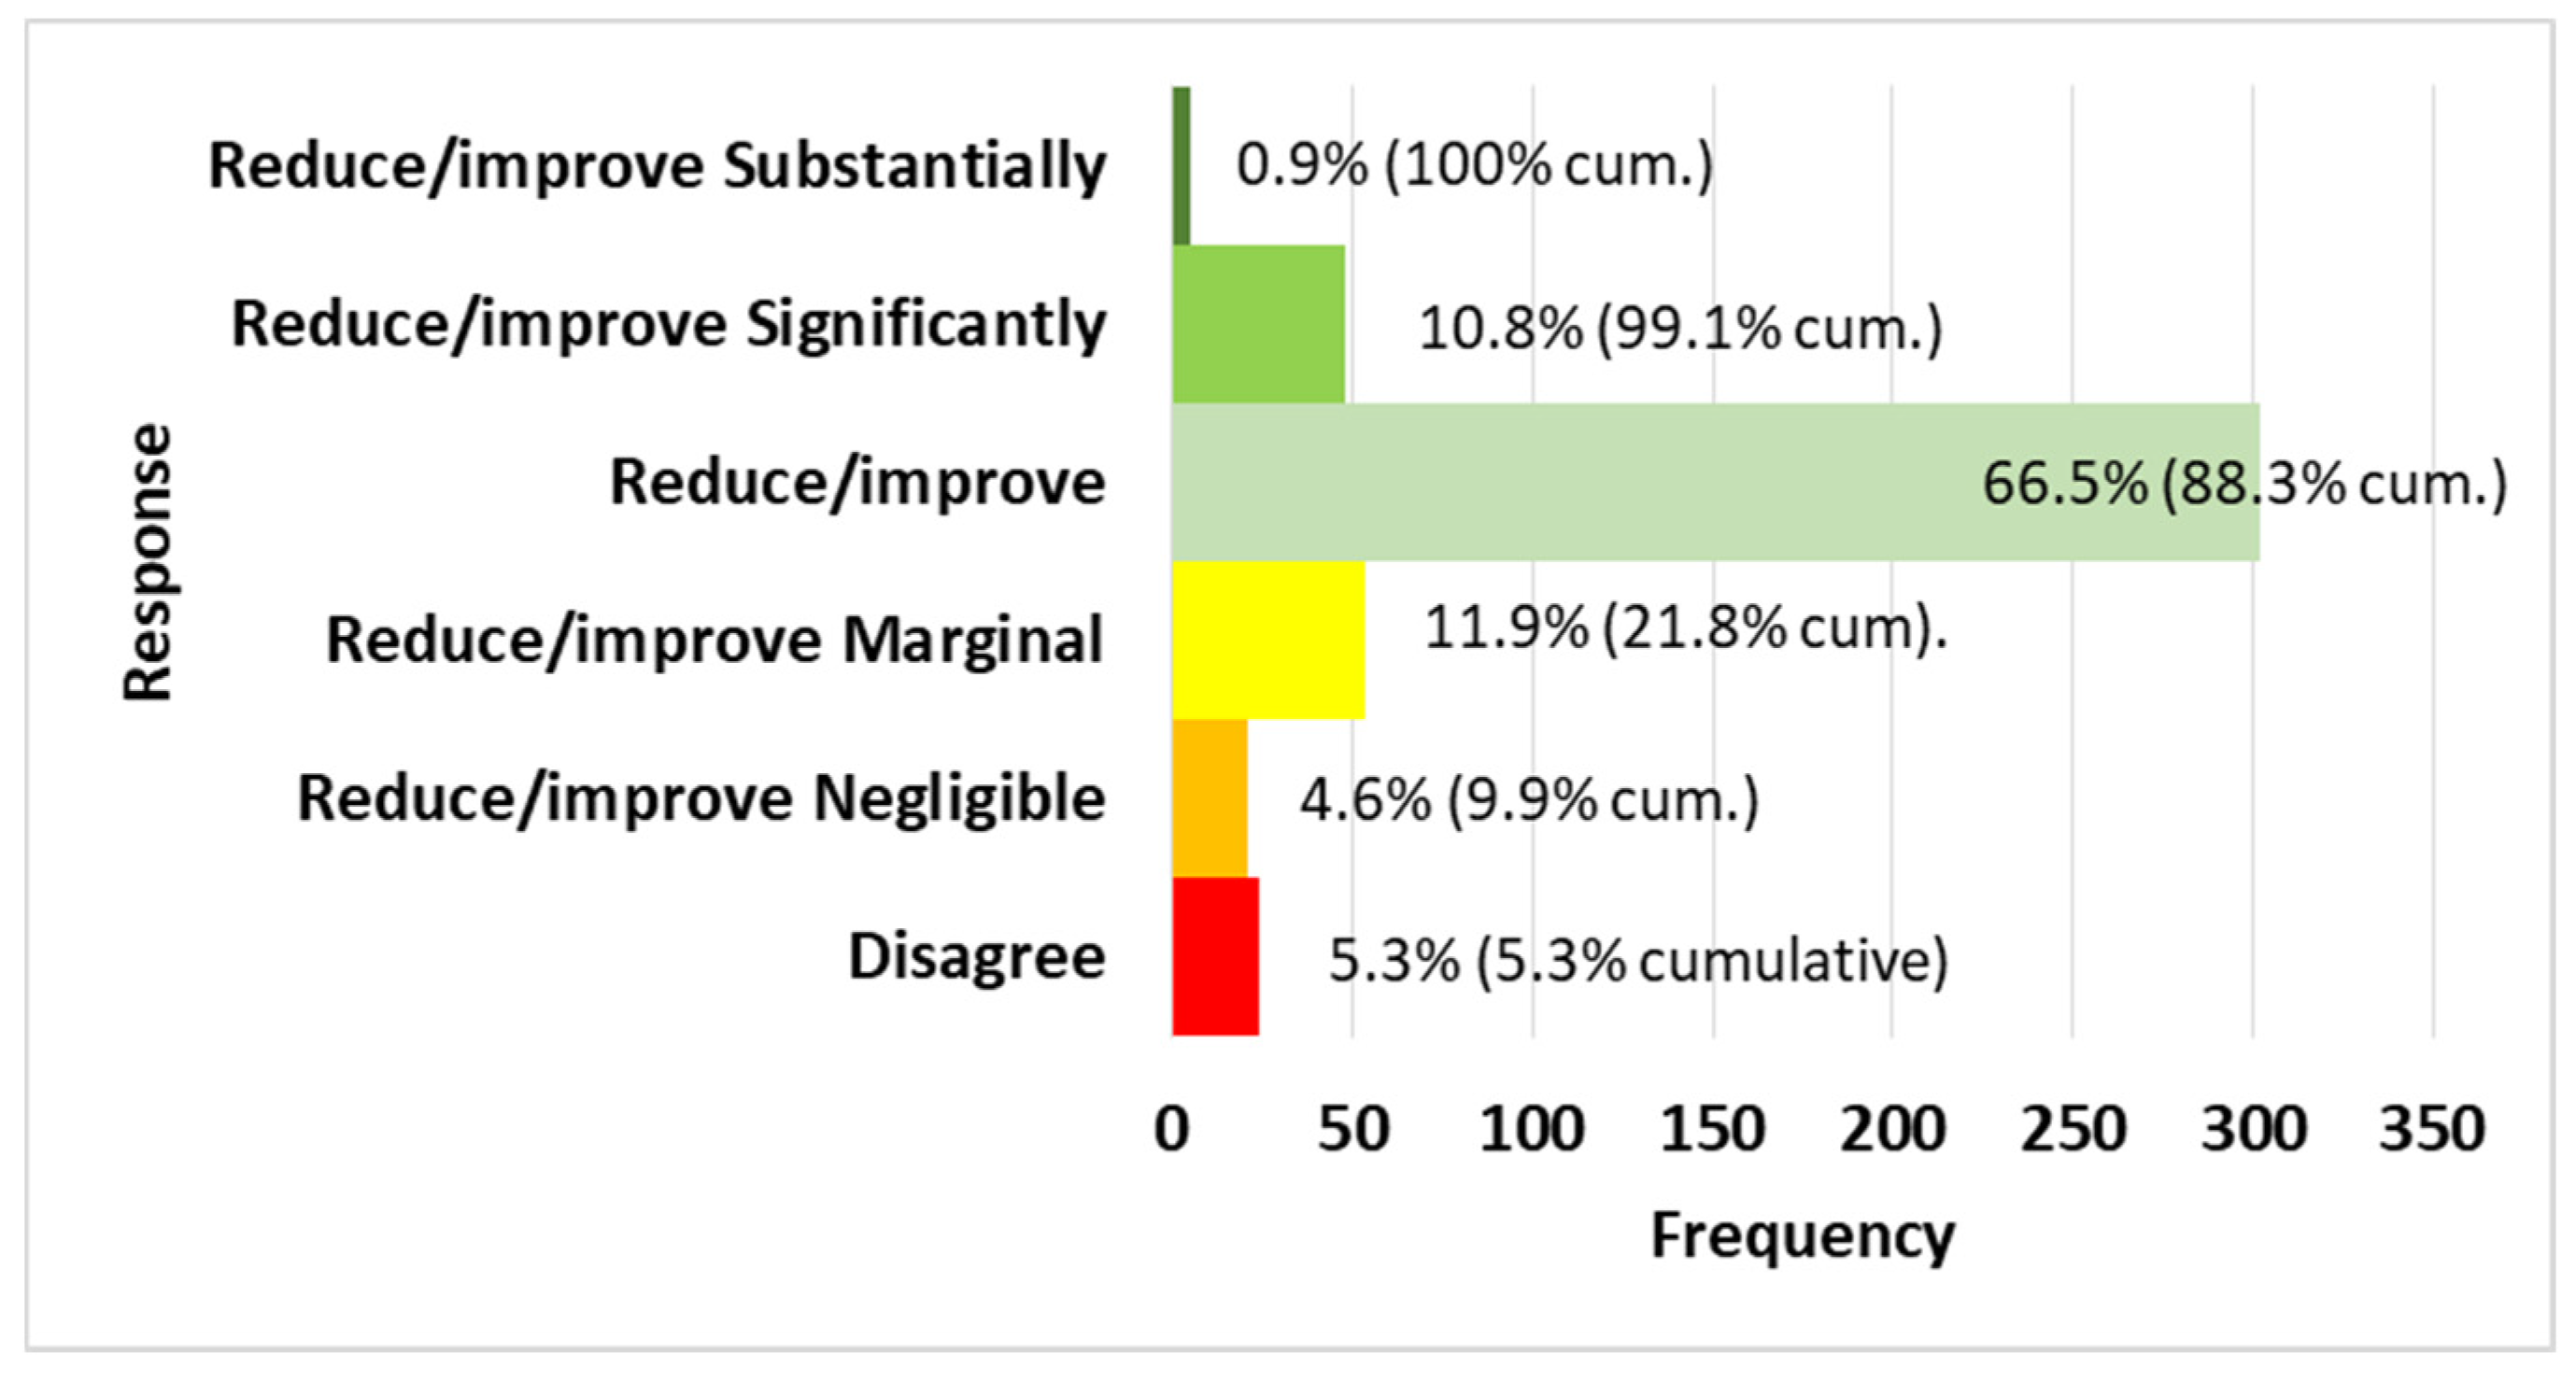
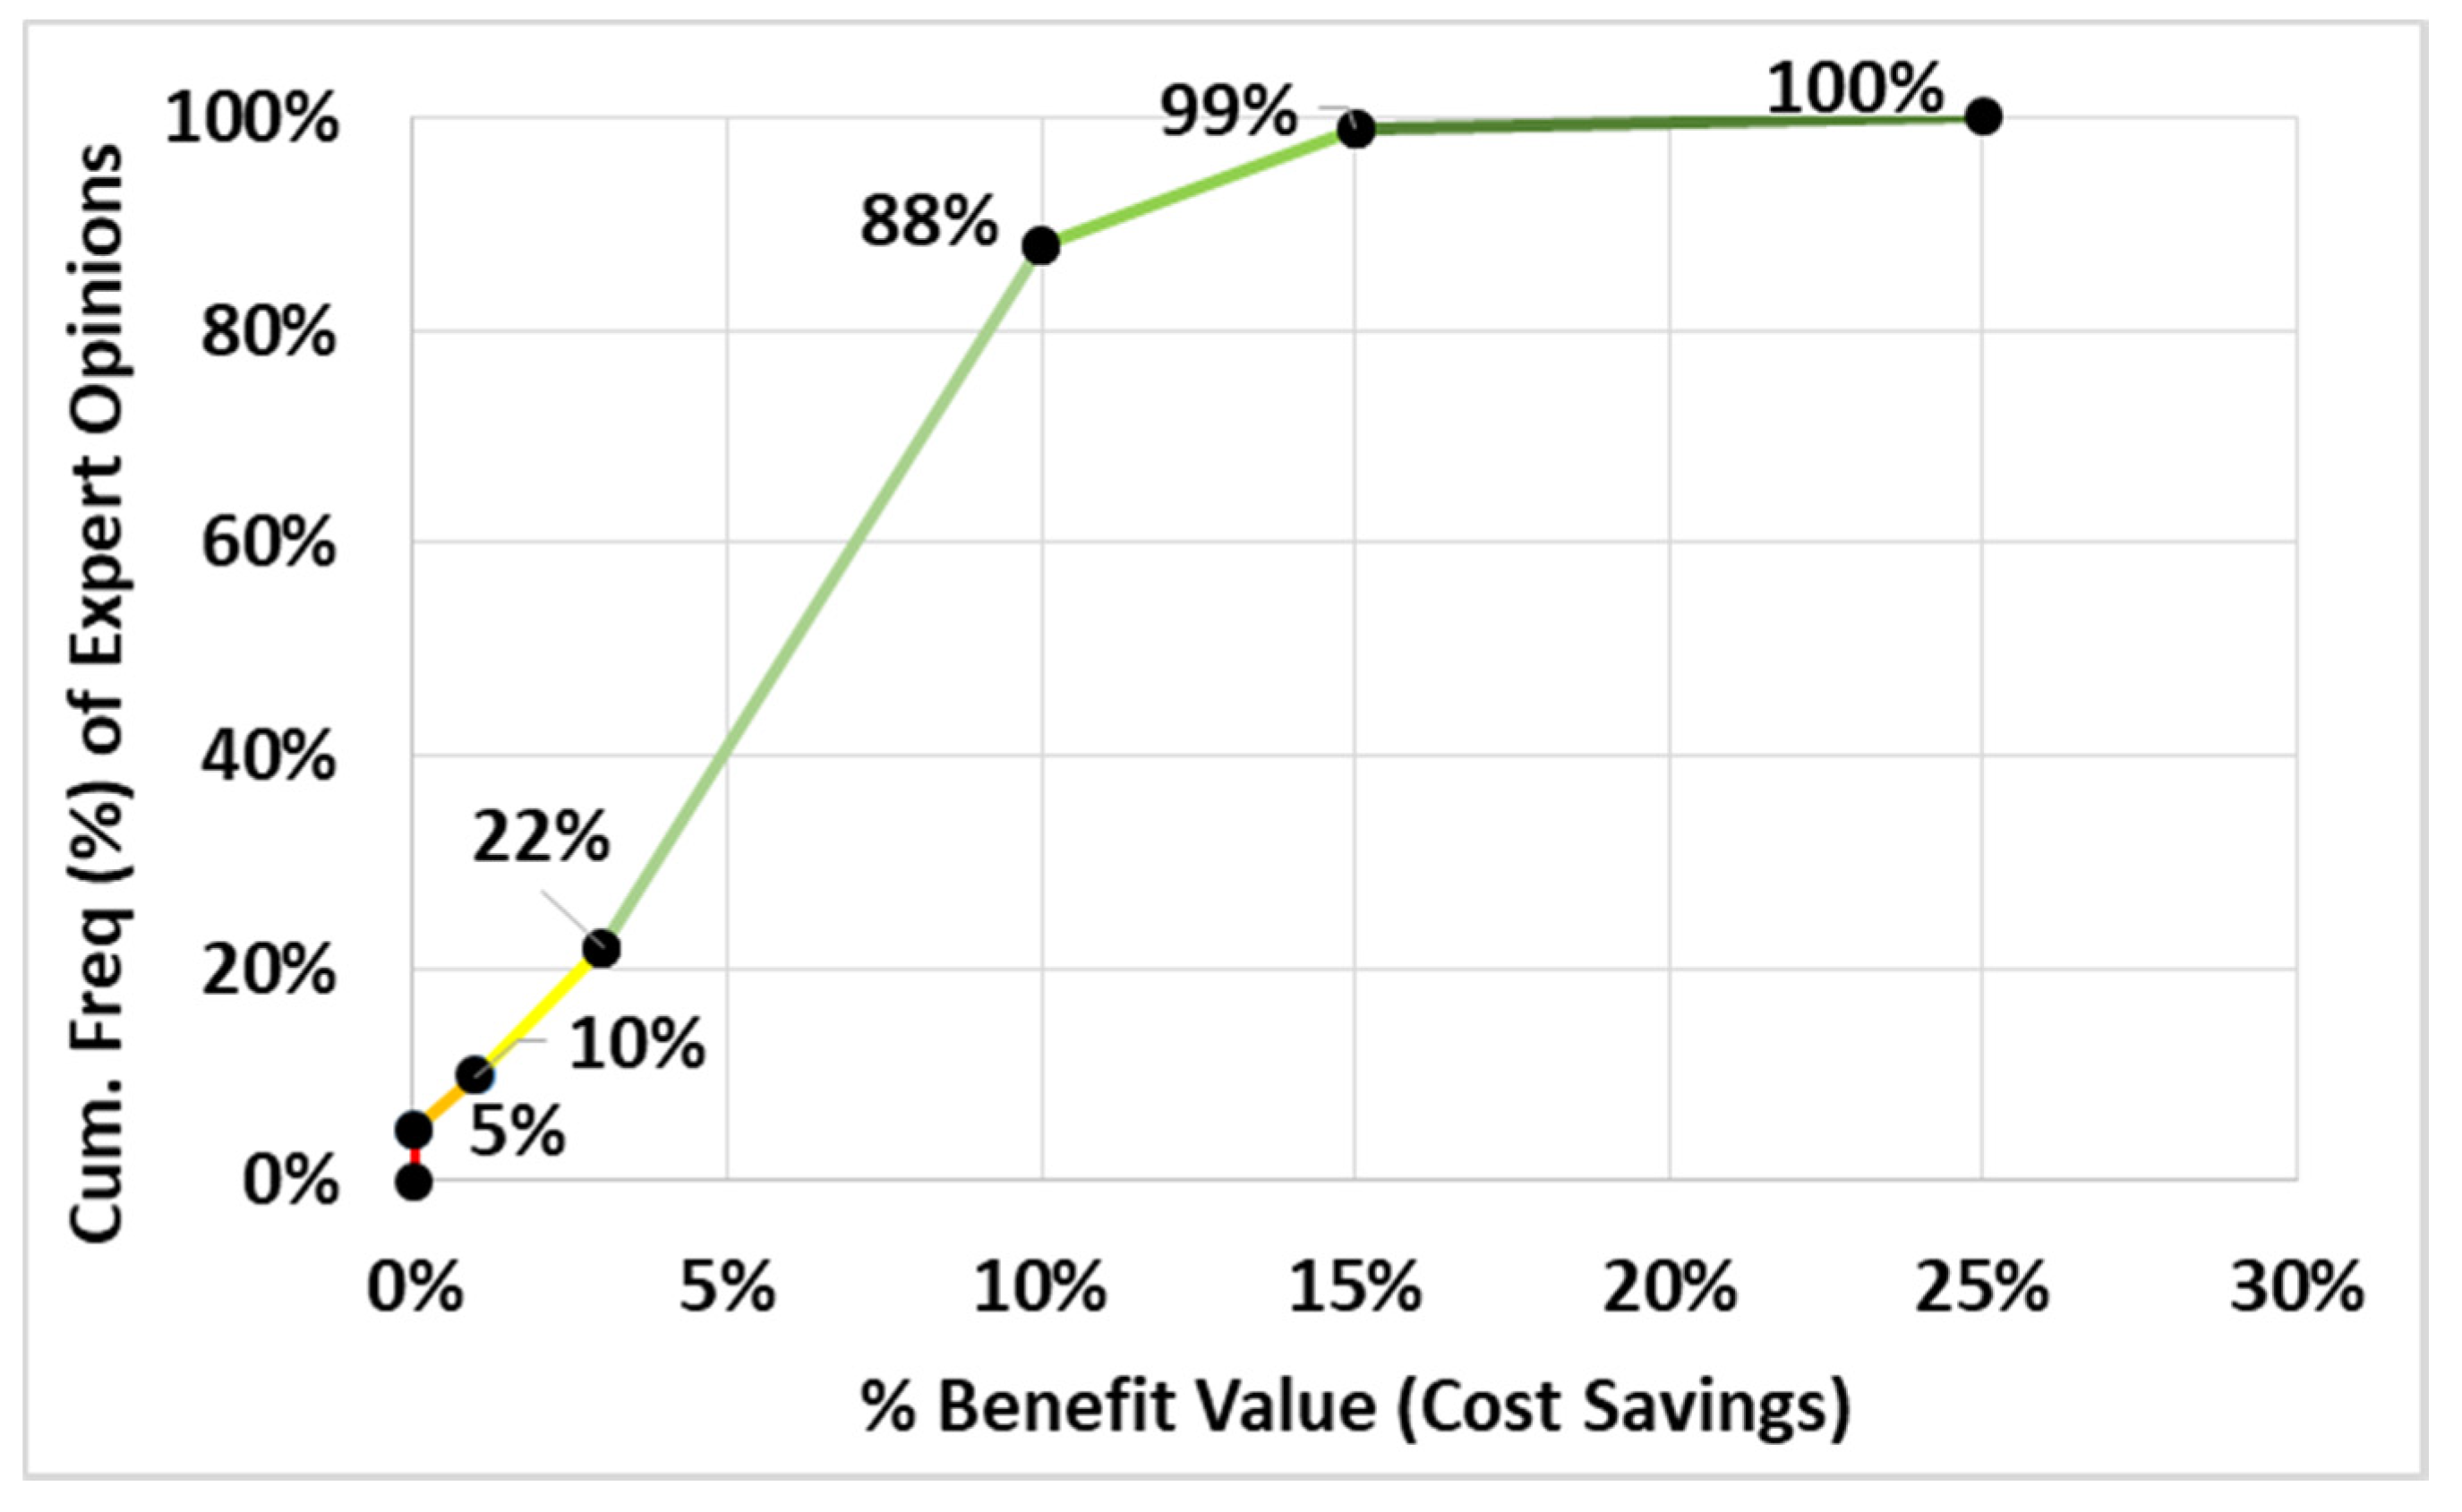
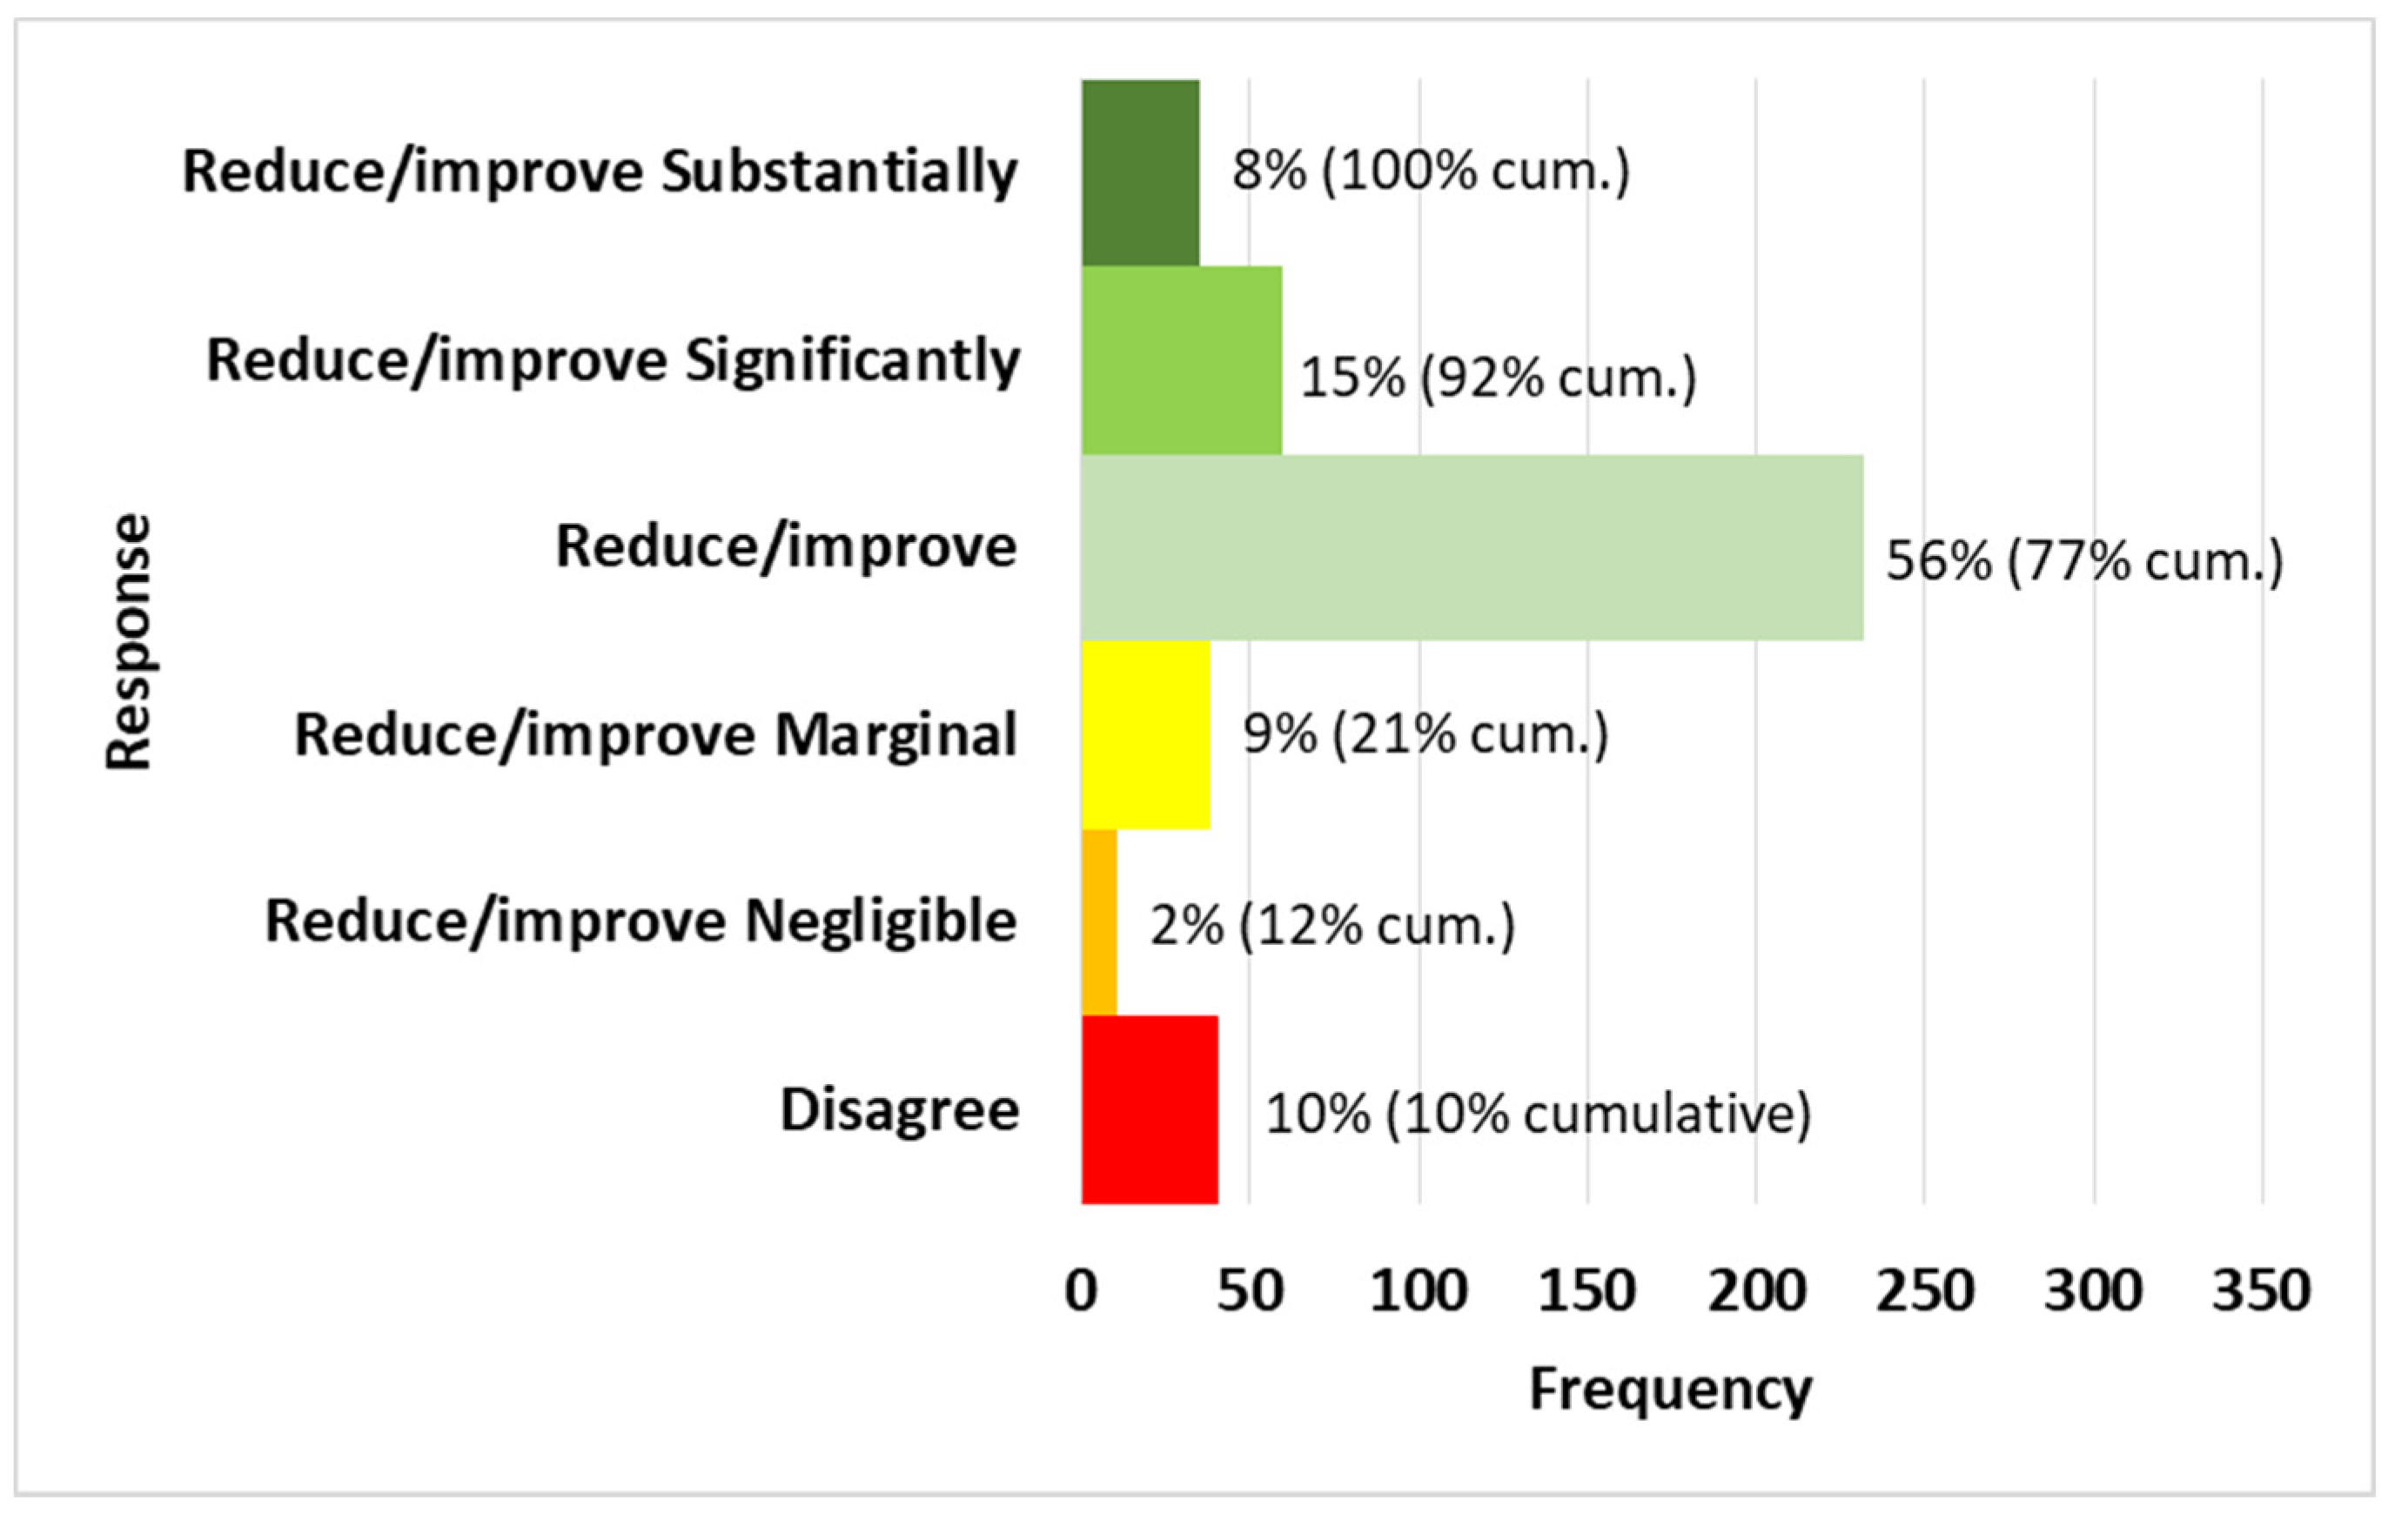
Based on the quantification table (see Table 8) a transformation from the cumulative frequency (for all responses) to the expected %-benefit value for the cost of water context has been developed (see Figure 7). The cumulative frequency chart is shown (see Figure 8). Based on the cumulative frequency, 5% of experts would score a benefit of 0%, another 5% (>5, <=10%) of experts would score a negligible benefit of between 0% and < 1%, etc.
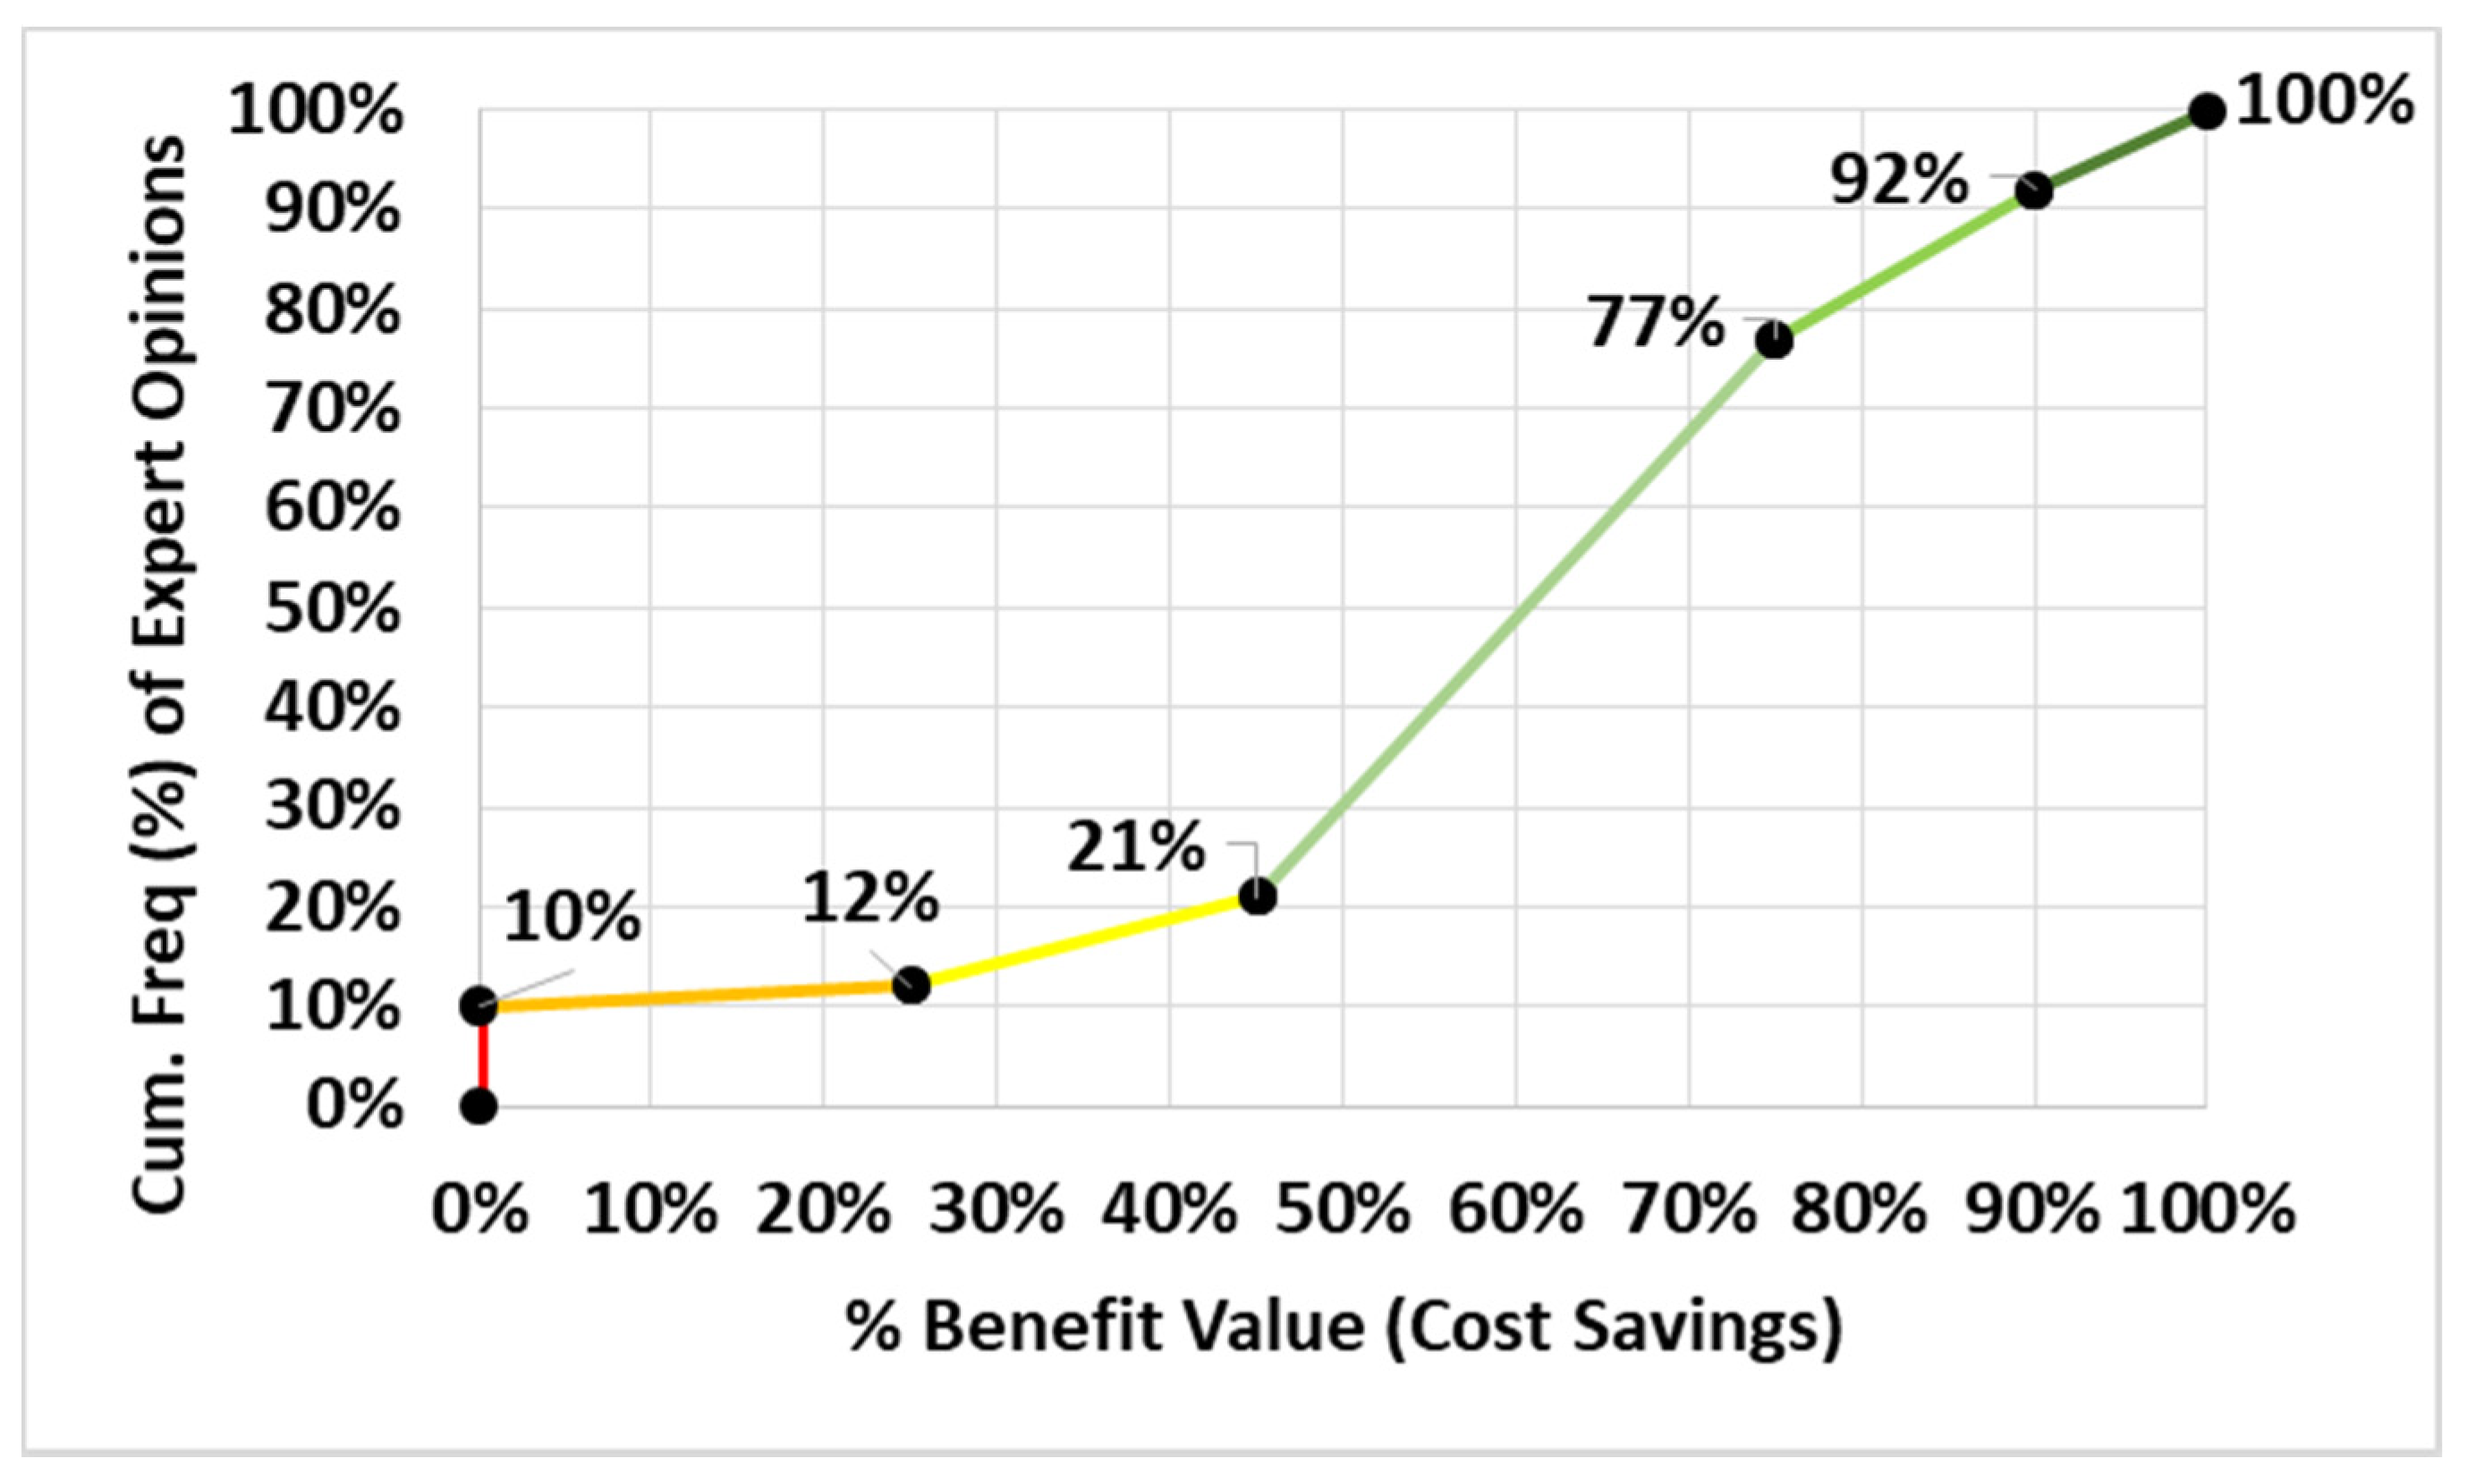
Based on the quantification table (see Table 9), a transformation from the cumulative frequency of expected %-benefit value for the charges/operational costs context has been developed (see Figure 9). The cumulative frequency chart is shown (see Figure 10). Based on the cumulative frequency, 10% of experts would score a benefit of 0%, another 2% (>10, <=12%) of experts would score a negligible benefit of between 0% and < 25%, etc.

3.3.5. Benefit Value Modelling

A benefit value model could be developed using the frequency distributions for each benefit obtained here from the expert opinion survey. Outcomes of such models could be used in business cases to qualify the advice to management. Switches in the model could be used to exclude benefits or turn off business changes for scenario analysis to further inform business decisions. A straightforward methodology would estimate annual benefits via a Monte Carlo simulation. Frequency distributions could be used as a basis for simulating plausible benefits.
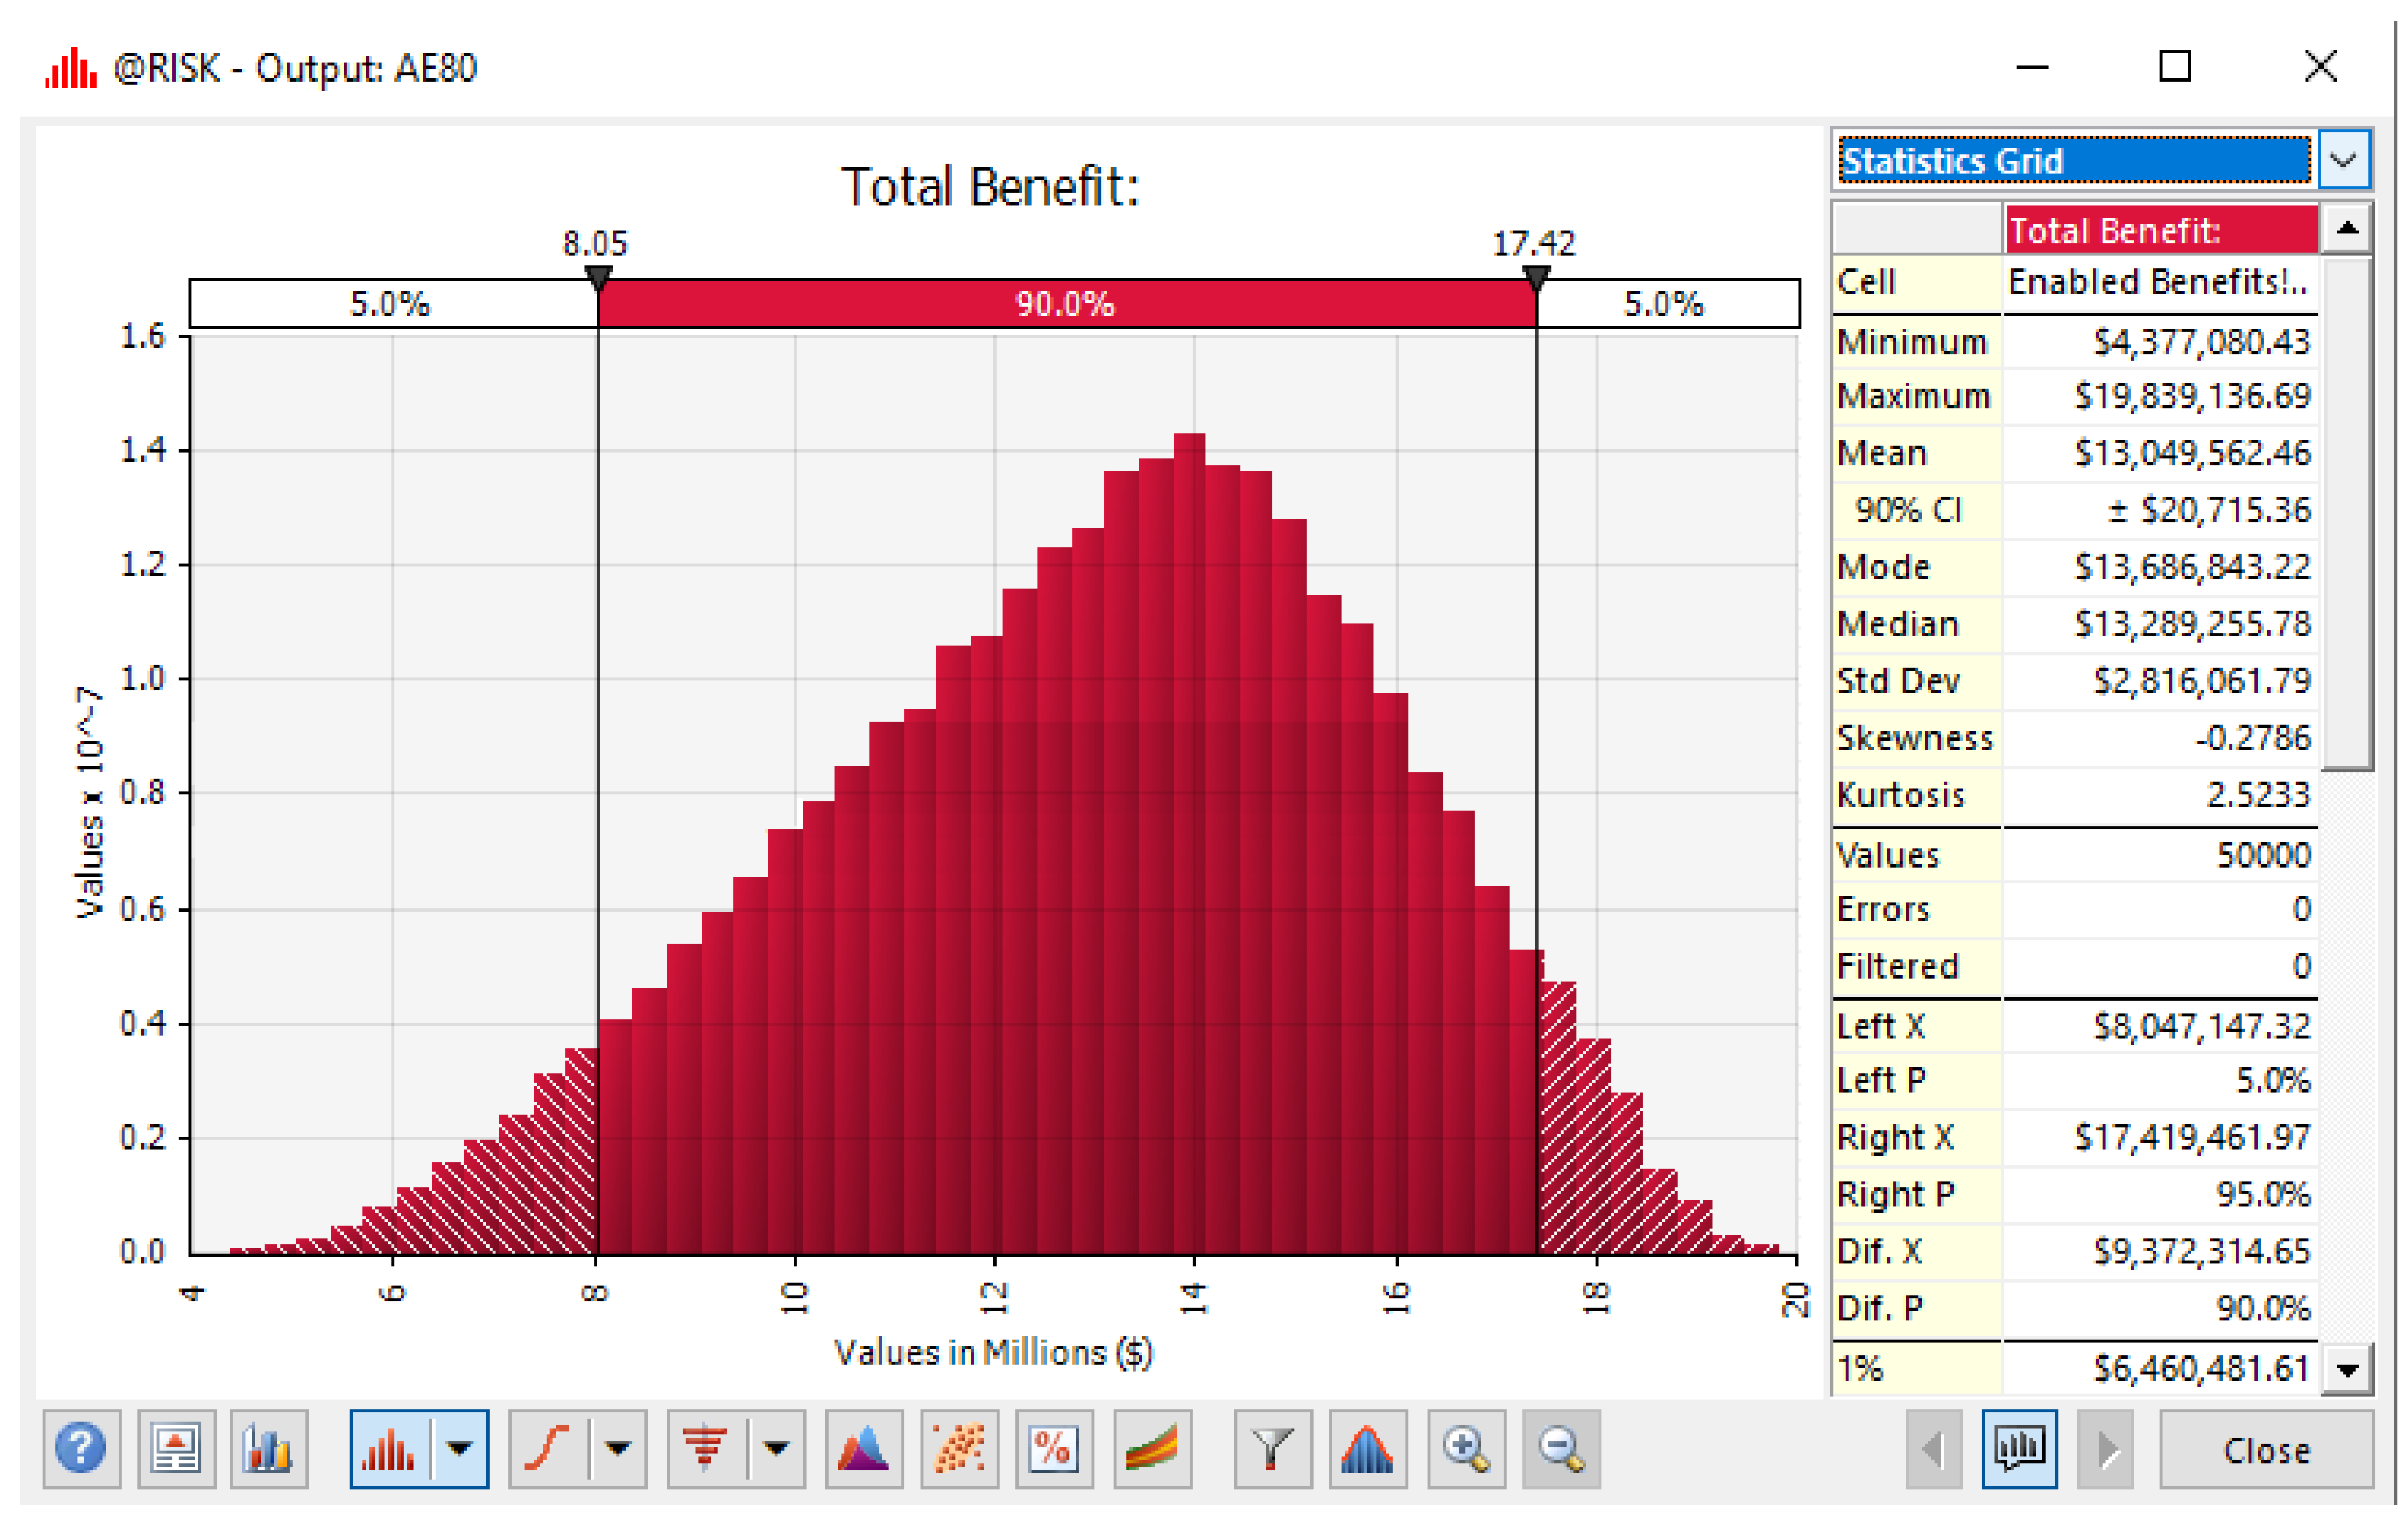
Transformations of expert opinions to benefit values (see Figure 8 and Figure 10) could provide the benefit value for each simulation. To demonstrate the approach, the @Risk [73] add-on to MS Excel [74], was used on a set of hypothetical costs for a mid-sized water utility (500,000 customers) created by the researchers from published reports of water utilities, regulators and advocates. The type of output from such a model, in the form of a range of possible total benefit values that could be estimated for a single year for 50,000 simulations, is illustrated in Figure 11. Excel formulas could be used to aggregate the individual outcomes of each benefit to determine the total cost savings.
Using such an approach (e.g., Figure 11), a model running against a set of hypothetical annual operating costs returned a near bell-like distribution of possible outcomes with a median (50% quantile) value of $13.3 M savings per annum. There could be a 95% probability of achieving at least $8.1 M pa and a 5% probability of achieving in excess of $17.4 M pa. Further development of such a model will be detailed in a future paper which will specify all the inputs to the model and include: annual costs for every kind of benefit, use of the distributions and the calculation formulas.

4. Limitations

While the experts’ structured interviews had a relatively low number of participants (N = 52) they were drawn from water utilities that covered city, urban and regional areas of Australia plus other industry experts, and were representative of business functions of water businesses.
Recruitment of experts within water authorities was undertaken by the liaison officers within the water authority. While this appears to have been generally successful, it is not known if other expert staff might also have been available to complete the survey.
The use of an online survey to collect the opinions meant that participants needed a common level of understanding of what they were being asked to pass an opinion, since there was no interaction with the interviewer. The ‘background’ notes that accompanied each benefit question were intended to provide sufficient detail to establish a common understanding. This may not have always been achieved as five answers to the question of reduced claims by customers for water damage from concealed leaks and theft from behind the meter (question number 62 (L18)) referred to claims against the water utility (question number 11 (E19)).
As the benefit questions invited open commentary through free text responses, the answers required interpretation to synthesise into consistent outcomes. Where answers included terms like “as above”, care has been taken to identify the answer being referred to. Additionally, the answers reflect each individual’s use of language and expressiveness.
Forty of the benefits were identified as impacting customers (some shared with the water business). There has not been any attempt in the structured interviews to collect customer opinions on the benefits and the value of these benefits to them. At this stage, the only value of these benefits is the view of the expert participants. The demonstration benefit modelling tool has not attempted to model any of the customer only benefits. Results shown are based on the hypothetical set of annual operating costs for a water utility’s business and shared benefits only.

5. Discussion

The benefits of DWM put forward in the structured interviews were predominantly agreed with or strongly agreed with by the participants. Overall, 67.5% agreed or strongly agreed with the benefits proposed, another 14.5% offered muted agreement while only 6% disagreed and 12% offered no opinion. The authors’ previous literature review [41] identified sources of benefits of DWM, including the outcomes of academic research and reviews, which collectively reflect this strong level of support. Water savings and operational savings expressed by the experts were consistent with findings by researchers and practitioners in Australia [5,40] and overseas [6].
The benefits to water utilities were better understood than benefits to customers. This suggests that water utilities should put more focus on the customer and how they might benefit, that is, become more customer-centric [81]. This might be achieved by inviting greater involvement of customer-facing and back-office staff in discussions and workshops on the impact of digital water meters. Similarly, and while the participants were considered experts, the number of “don’t know” and “don’t agree” comments suggests that more work needs to be done internally to bring all staff into discussions and workshops to canvass the opportunities and to reach consensus. Academics and vendors of DWM solutions have a role to play in this by promoting their studies and success stories [82] to water utilities while also documenting any issues encountered, less favourable outcomes and mitigating actions.
In a business environment, at least in Australia, where the negative sentiment towards electricity smart meters dominates customer perceptions, the ability to promote the innovation would be enhanced if the customer benefits were well understood and articulated. Victoria’s water Ombudsman is of the opinion that water companies need to take the initiative to collect and promote the many success stories coming out of DWM trials [29].
Three benefits stood out for the mixed or qualified responses that they received.
  • Call Centre impact—rather than an expected decrease in calls as suggested by the benefit questions, many participants expected calls to actually increase, due to increased information and questions raised in the minds of customers as to what the information meant.
  • Meter reading costs—many participants were skeptical that the meter reading cost-savings could be achieved and mention the new costs of data communication, collection and storage.
  • Failing meter detection—the operating life of batteries was often noted as a limiting factor when considering the extended life of meters and meter failure detection.
The issues raised for these three benefits might be the subject of short studies to determine the actual situation or, for battery life, mitigating strategies.
The model developed in this study has been based around the digital metering taxonomy. The taxonomy provides generalised categories of benefits and is sufficiently flexible in design to allow for benefit items to be included or removed depending on the business operations of the water utility and their corporate goals. Such a modelling tool has the potential to be applied to metering within other industries such as energy [83].

6. Conclusions

This study has focused on the benefit likelihood and value of DWM. It has not considered the cost of implementing changes to achieve the benefits as these are considered subject to advances in AMI technologies, implementation strategies, contract negotiations and purchasing rules within individual water utilities.
Expert opinions have been collected to verify and quantify the benefits identified in the preceding literature review of DWM. In doing so the study identified two distinct probability distributions covering the expected value of benefits in two contexts: cost of water, charges/operational costs. Empirical distributions formed through thematic analysis and quantification of expert opinions have been transformed into probability distributions. A benefit value modeling tool could be developed in order to make use of these distributions. Here we provide an indication of the kind of results that could be obtained. If such a tool were used to run models, using a hypothetical set of annual operating costs. to simulate DWM benefits and it could provide stochastic outcomes for possible use in business cases.
Further studies seeking empirical evidence of benefits considered intangible is warranted to add further to business cases. Forty of the benefits (over half) relate to customer satisfaction and, while the experts generally agreed with the benefits, the opinions of customers themselves should be considered. Future work by the researchers will present the results of a study of the possible impact on customer satisfaction resulting from the change to DWM [84].
Further development of a modelling tool such as is described here, and used to illustrate how cost savings analysis can be conducted from expert opinion, will be presented in a future paper.

Supplementary Materials

Supplementary Material A provides a detailed summary of the range of opinions provided by the experts for each of the 75 benefits, the quantified views of both likelihood and benefit value, and an extended profiling of each respondent. Supplementary Material B provides a copy of the survey instrument. The following are available online at https://www.mdpi.com/2073-4441/12/5/1436/s1, Water-773749 Supplementary Material A.docx: Detailed Summary of Opinions, Frequency Distributions and Expert Profiles; Water 773749 Supplementary Material B.docx: Experts Survey Instrument.

Author Contributions

Conceptualization, I.M., R.A.S., O.S. and R.K.; methodology, I.M., R.A.S., O.S., R.K. and S.L.C.; software, I.M.; validation, I.M.; formal analysis, I.M. and S.L.C.; investigation, I.M.; data curation, I.M.; writing—original draft preparation, I.M.; writing—review and editing, I.M., R.A.S., O.S., R.K. and S.L.C.; visualization, I.M., and S.L.C.; supervision, R.A.S., O.S. and R.K. All authors have read and agreed to the published version of the manuscript.

Funding

This research received no external funding.

Acknowledgments

The authors wish to thank the many organisations and participants who gave their time freely to respond to the rather lengthy structured interviews and for sharing their experiences, concerns and opinions. Special thanks to those water company staff who assisted with the development and fine-tuning of the interview questions and structure and to the study liaison officers who recruited staff within their organisations.

Conflicts of Interest

The authors declare no conflict of interest.

References

  1. Anonymous. Technology flows into water meter reading. Water Eng. Manag. 1994, 141, 2. [Google Scholar]
  2. Schlenger, D. Meter management: Best practices for water utilities. Water Eng. Manag. 1997, 144, 3. [Google Scholar]
  3. Hastreiter, J. City cuts costs, improves accuracy with radio frequency meter reading. Water Eng. Manag. 1997, 144, 33–35. [Google Scholar]
  4. Hastreiter, J. AMR expands across the country. Water Eng. Manag. 1999, 148, 5. [Google Scholar]
  5. Taggle Systems P/L. Mackay Regional Council Helping Residents Save on Water Bills. 2016. Available online: https://taggle.com/mrc/ (accessed on 6 July 2018).
  6. Thiemann, R.; Haas, J.; Schlenger, D. Reaping the benefits of AMI: A kansas city case study. Am. Water Work. Assoc. J. 2011, 103, 38–41. [Google Scholar] [CrossRef]
  7. City of Lincoln Nebraska. Automated Water Meter Reading Improves Efficiency, Accuracy, Safety. 4 March 2008. Available online: http://lincoln.ne.gov/city/mayor/media/2008/030408a.htm (accessed on 15 July 2018).
  8. Consultant‘s Corner Journal AWWA. Detroit selects Itron‘s water fixed network solution. J. Am. Water Work. Assoc. 2007, 99, 53. [CrossRef]
  9. IBM. District of Columbia Water & Sewer Authority to Automate Water and Sewer System and Create Business Intelligence Systems, with Help from IBM 2009; IBM: Armonk, NY, USA, 2009; Available online: https://www-03.ibm.com/press/us/en/pressrelease/28859.wss (accessed on 3 October 2018).
  10. March, H.; Morote, Á.-F.; Rico, A.-M.; Saurí, D. Household smartwater metering in Spain: Insights from the experience of remote meter reading in alicante. Sustainability 2017, 9, 582. [Google Scholar] [CrossRef] [Green Version]
  11. Boyle, T.; Giurco, D.; Mukheibir, P.; Liu, A.; Moy, C.; White, S.; Stewart, R. Intelligent metering for urban water: A review. Water 2013, 5, 1052–1081. [Google Scholar] [CrossRef] [Green Version]
  12. Beal, C.; Flynn, J. The 2014 review of smart metering and intelligent water networks in Australia & New Zealand. In 2014, Report Prepared for WSAA by the Smart Water Research Centre; Griffith University: Gravatt, Australia, 2014. [Google Scholar]
  13. Nguyen, K.A.; Stewart, R.A.; Zhang, H.; Sahina, O.; Siriwardene, N. Re-engineering traditional urban water management practices with smart metering and informatics. Environ. Model. Softw. 2018, 101, 256–267. [Google Scholar] [CrossRef] [Green Version]
  14. Britton, T.C.; Stewart, R.A.; O’Halloran, K.R. Smart metering enabler for rapid and effective post meter leakage identification and water loss management. J. Clean. Prod. 2013, 54, 166–176. [Google Scholar] [CrossRef] [Green Version]
  15. Gurung, T.R.; Stewart, R.A.; Sharma, A.K.; Beal, C.D. Smart meters for enhanced water supply network modelling and infrastructure planning. Resour. Conserv. Recycl. 2014, 90, 34–50. [Google Scholar] [CrossRef] [Green Version]
  16. Warren, C.; Becken, S.; Nguyen, K.; Stewart, R.A. Transitioning to smart sustainable tourist accommodation: Service innovation results. J. Clean. Prod. 2018, 201, 599–608. [Google Scholar] [CrossRef]
  17. NBN News. Narrabri Gets Tech Savvy with Water Meter Systems. 12 April 2018. Available online: http://www.nbnnews.com.au/2018/04/12/narrabri-gets-tech-savvy-with-water-meter-systems/ (accessed on 21 June 2019).
  18. Taggle Systems P/L. Taggle Blog. 2019. Available online: https://taggle.com.au/blog/ (accessed on 21 June 2019).
  19. TasWater. Water Meter Renewal Program. 2018. Available online: https://www.taswater.com.au/News/TasWater-News/Water-meter-renewal-program (accessed on 17 January 2019).
  20. Coliban Water. Frequently Asked Questions Digital Meters Program Stage 1—February 2018; Coliban Water: Bendigo, VIC, Australia, 2018; Available online: https://coliban.com.au/site/root/projects/documents/ColibanWaterDigitalMetersFAQ.pdf (accessed on 3 March 2018).
  21. Sydney Water. Water Meters Policy. 2018. Available online: https://www.sydneywater.com.au/web/groups/publicwebcontent/documents/document/zgrf/mdq3/~edisp/dd_047498.pdf (accessed on 26 December 2018).
  22. City West Water. 2018 Water Price Review City West Water Price Submission 2017-09-28. 2017. Available online: https://www.citywestwater.com.au/about_us/reports_publications/2018_pricing_submission (accessed on 29 June 2018).
  23. Digital Metering Trial. Internal Report (Author and Company details withheld). Unpublished. 2016.
  24. Digital Metering Progress; Interviewed by author (I.M.): Melbourne, VIC, Australia, 22 June 2018.
  25. Consumer Action Law Centre. Consumer Action Law Centre (1) Barwon Water; Consumer Action Law Centre: Melbourne, Australia, 2017. Available online: https://www.esc.vic.gov.au/water/water-prices-tariffs-and-special-drainage/water-price-reviews/water-price-review-2018#tabs-container2 (accessed on 22 June 2018).
  26. Essential Services Commission. Water Price Reviews 2018. (Home page to 2018 Price Submissions and Determinations for all 16 water authorities in Victoria, Australia). Available online: https://www.esc.vic.gov.au/water/water-prices-tariffs-and-special-drainage/water-price-reviews/water-price-review-2018 (accessed on 22 June 2018).
  27. Johnston, M. Victorian electricity meters would need to be changed under new rules. In Sunday Herald Sun. April 7, 2018; News Limited: Sydney, Australia, 2018. [Google Scholar]
  28. Energy and Water Ombudsman (Victoria) Ltd. Final Solar and Smart Meter Report. 2016. Available online: https://www.ewov.com.au/files/solar-and-smart-meter-report-july-2016.pdf (accessed on 18 July 2018).
  29. Gebert, C. Energy & Water Ombudsman (Victoria), Impact of Billing Disputes; Interviewed by Author (I.M.): Melbourne, Australia, 2018. [Google Scholar]
  30. Messner, W. Making the Compelling Business Case: Decision-Making Techniques for Successful Business Growth, 1st ed.; Palgrave MacMillan: London, UK, 2013. [Google Scholar]
  31. Liu, A.; Giurco, D.; Mukheibir, P.; Mohr, S.; Watkins, G.; White, S. Online water-use feedback: Household user interest, savings and implications. Urban Water J. 2017, 14, 900–907. [Google Scholar] [CrossRef]
  32. Kansas City Water Services. Customer Satisfaction Chart. 2016. Available online: https://kcstat.kcmo.org/w/jijd-nxdk/_variation_?cur=muEORSS0C8q&from=root (accessed on 16 July 2018).
  33. Horsley, L. Kansas City Water Department Turns Tide Toward Improving Service. Kansas City Star. 9 November 2015. Available online: http://www.kansascity.com/news/politics-government/article43862283.html (accessed on 7 February 2019).
  34. Kansas City Water Services. Kansas City’s Focus on Customers and Data Getting Results. 13 January 2016. Available online: http://thevalueofwater.org/content/kansas-city%E2%80%99s-focus-customers-and-data-getting-results (accessed on 6 July 2018).
  35. Boerema, A.; Robinson, T.; Burykina, O. Early detection of concealed leaks helps prevent bill shock. In Ozwater 17; Australian Water Association: Sydney, Australia, 2017. [Google Scholar]
  36. Utility#13. Bill Shock; Unpublished work; 2017. [Google Scholar]
  37. Garcia, J. Pipe leak leads to bill shock. In Beaudesert Times, March 1 2017; Beaudesert, QLD, Australia, 2017; Available online: https://www.beaudeserttimes.com.au/story/4500604/pipe-leak-leads-to-bill-shock/ (accessed on 4 January 2019).
  38. Fernando, S.; Roberts, L. Mackay regional council—Cost to service and customer expectations. In Ozwater18; Australian Water Association: Brisbane, Australia, 2018; Available online: https://awa.sharefile.com/share/view/s0ab98458171496ab (accessed on 6 July 2018).
  39. Davies, K.; Doolan, C.; Robin, H.; Shi, R. Water-saving impacts of Smart Meter technology: An empirical 5 year, whole-of-community study in Sydney, Australia. Water Resour. Res. 2014, 50, 7348–7358. [Google Scholar] [CrossRef]
  40. Liu, A.; Mukheibir, P. Digital metering and change in water consumption. In Report Prepared for the Digital Metering Joint Program by the Institute for Sustainable Futures; University of Technology Sydney: Ottimo, Australia, 2017. [Google Scholar]
  41. Monks, I.; Stewart, R.A.; Sahin, O.; Keller, R. Revealing unreported benefits of digital water metering: Literature review and expert opinions. Water 2019, 11, 838. [Google Scholar] [CrossRef] [Green Version]
  42. Origin Energy Ltd. Annual Report. 2016. Available online: http://www.annualreports.com/HostedData/AnnualReportArchive/O/ASX_ORG_2016.pdf (accessed on 8 October 2018).
  43. Barwon Water. Concessions and Payment Assistance—Bill Smoothing. 2019. Available online: https://www.barwonwater.vic.gov.au/billing-and-accounts/concessions-and-payment-assistance (accessed on 12 February 2019).
  44. Energy & Water Ombudsman NSW (EWON). NSW Water Bill Payment Assistance Scheme. 2018. Available online: https://www.ewon.com.au/page/customer-resources/help-paying-bills/pas-vouchers (accessed on 12 January 2020).
  45. Sydney Water. Payment Assistance Policy. 2018. Available online: https://www.sydneywater.com.au/SW/accounts-billing/paying-your-bill/help-with-your-bill/index.htm (accessed on 26 December 2018).
  46. Yarra Valley Water. SmoothPay. 2010. Available online: https://www.yvw.com.au/about-us/terms-conditions/smoothpay-terms-conditions (accessed on 12 February 2019).
  47. Interviewee#9 (Owners Corporation Management). Impact of Billing Errors; Interviewed by Author (I.M.): Melbourne, Australia, 2018. [Google Scholar]
  48. Strata Community Association. What is Strata? 2018. Available online: https://www.strata.community/understandingstrata/what-is-strata (accessed on 3 January 2019).
  49. AIRAH and Smart Water Fund. Domestic Evaporative Cooler Water Use Efficiency Assessment Study; Australian Institute of Refrigeration, Air conditioning and Heating (AIRAH): Melbourne, Australia, 2010. [Google Scholar]
  50. Karpiscak, M.M.; Babcock, T.M.; France, G.W.; Zauderer, J.; Hopf, S.B.; Foster, K.E. Evaporative cooler water use in Phoenix. J. Am. Water Work. Assoc. 1998, 90, 121–130. [Google Scholar] [CrossRef]
  51. Rogdakis, E.D.; Koronaki, I.P.; Tertipis, D.N. Experimental and computational evaluation of a Maisotsenko evaporative cooler at Greek climate. Energy Build. 2014, 70, 487–506. [Google Scholar] [CrossRef]
  52. AIRAH Training. Retrocommissioning Evaporative Air Coolers for Water Efficiency; AIRAH: Melbourne Australia, 2011. [Google Scholar]
  53. Rouf, I.; Mustafa, H.; Xu, M.; Xu, W.; Miller, R.; Gruteser, M. Neighborhood watch: Security and privacy analysis of automatic meter reading systems. In Proceedings of the 2012 ACM Conference on Computer and Communications Security, Raleigh, NC, USA, 16–18 October 2012. [Google Scholar]
  54. Butler, L. Making the Business Case for Automatic Meter Reading. Utility Magazine 2018. Available online: https://utilitymagazine.com.au/making-the-business-case-for-automatic-meter-reading/ (accessed on 31 October 2018).
  55. Utility Journalist. Sydney Takes Smart Approach to Water Metering Data. Utility Magazine. 2016. Available online: https://utilitymagazine.com.au/sydney-takes-smart-approach-to-water-metering-data/ (accessed on 30 August 2016).
  56. Rossi, P. How to link the qualitative and the quantitative risk assessment. In Proceeding of the PMI Global Congress-EMEA, Budapest, Hungary, 15 May 2007. [Google Scholar]
  57. National Research Council. The Owner’s Role in Project Risk Management; The National Academies Press: Washington, DC, USA, 2005. [Google Scholar]
  58. Water Services Association of Australia. WSAA-Smart Water Meters CBA Public.xlsx; Water Services Association of Australia: Melbourne, Australia, 2012. [Google Scholar]
  59. Marchment Hill Consulting Pty Ltd. Smart Water Metering Cost Benefit Study Final Report—Available for Information; Department of Sustainability and Environment: Victoria, Australia, 2010. [Google Scholar]
  60. Spetzler, C.S.; Carl-Axel, S.S.V.H. Probability encoding in decision analysis. Manag. Sci. 1975, 22, 340–358. [Google Scholar] [CrossRef] [Green Version]
  61. Berg, C.; Rogers, S.; Mineau, M. Building scenarios for ecosystem services tools: Developing a methodology for efficient engagement with expert stakeholders. Futures 2016, 81, 68–80. [Google Scholar] [CrossRef] [Green Version]
  62. Page, T.; Heathwaite, A.L.; Thompson, L.J.; Pope, L.; Willows, R. Eliciting fuzzy distributions from experts for ranking conceptual risk model components. Environ. Model. Softw. 2012, 36, 19–34. [Google Scholar] [CrossRef]
  63. James, A.; Low Choy, S.; Mengersen, K. Elicitator: An expert elicitation tool for regression in ecology. Environ. Model. Softw. 2010, 25, 129–145. [Google Scholar] [CrossRef] [Green Version]
  64. Thomas, S.J.; Susan, J. Thomas, Designing Surveys that Work!—A Step-by-Step Guide; Corwin Press Inc.: Shozende Oaks, CA, USA; Thousand Oaks, CA, USA, 1999. [Google Scholar]
  65. de Vaus, D.A. Surveys in Social Research, 5th ed.; Allen & Unwin: Crow’s Nest, Australia, 2002. [Google Scholar]
  66. Microsoft Corporation. SQL Server 2014; Management Studio, v12.0.2269.0; SQL Express for SQL Server 14.0.1000; Microsoft Corporation: Redmond, WA, USA, 2014; Available online: https://www.microsoft.com/en-au/ (accessed on 21 October 2018).
  67. Saldana, J.; Leavy, P.; Beretvas, N. Fundamentals of Qualitative Research; Oxford University Press: Cary, NC, USA, 2011. [Google Scholar]
  68. Coffey, A.; Atkinson, P. Making Sense of Qualitative Data—Complementary Reserch Strategies; Sage Publications, Inc.: Thousand Oaks, CA, USA, 1996. [Google Scholar]
  69. Boyatzis, R. Transforming Qualitative Information: Thematic Analysis and Code Development; Sage Publications Inc.: Thousand Oaks, CA, USA, 1998. [Google Scholar]
  70. Dey, I. Qualitative Data Analysis, A User Friendly Guide for Social Scientists; Routledge: London, UK; New York, NY, USA, 1993. [Google Scholar]
  71. Oxford Dictionary. 2018. Available online: https://en.oxforddictionaries.com/thesaurus (accessed on 21 December 2018).
  72. PhraseMix. 2018. Available online: https://www.phrasemix.com (accessed on 20 December 2018).
  73. Palisade Corporation. @Risk; Risk Analysis for MS Excel; v7.6.0 Industrial Edition; Palisade: iIthaca, NY, USA, 2018; Available online: https://www.palisade.com/ (accessed on 22 March 2019).
  74. Microsoft Corporation. Excel 32-bit; Part of Microsoft Office Professional 2013; Microsoft Corporation: Redmond, WA, USA, 2013. [Google Scholar]
  75. Monks, I.; Stewart, R.A.; Sahin, O.; Keller, R. Building the benefit side of business cases for digital water metering. 2020, in press. [Google Scholar]
  76. R‘assler, S.; Rubin, D.B.; Zell, E.R. Imputation. Wires Comput. Stat. 2013, 5, 20–29. [Google Scholar]
  77. Mattei, A.; Mealli, F.; Rubin, D.B. Missing Data and Imputation Methods; Kenett, R.S., Salini, S., Eds.; John Wiley & Sons, Inc.: Hoboken, NJ, USA, 2011. [Google Scholar]
  78. Gelman, A.; Hill, J. Missing-data imputation. In Data Analysis Using Regression and Multilevel/Hierarchical Models; Cambridge University Press: Cambridge, UK, 2006; pp. 529–543. [Google Scholar]
  79. Wild, C. The concept of distribution. Stat. Educ. Res. J. 2006, 5, 10–26. [Google Scholar]
  80. O’Hagan, A. Probabilistic uncertainty specification: Overview, elaboration techniques and their application to a mechanistic model of carbon flux. Environ. Model. Softw. 2012, 36, 35–48. [Google Scholar] [CrossRef]
  81. Prevos, P. Customer Experience Management for Water Utilities: Marketing Urban Water Supply; International Water Association: London, UK, 2017. [Google Scholar]
  82. Taggle Systems P/L. Taggle Case Studies (Deployments of Taggle Smart Water Metering systems). 2019. Available online: https://taggle.com.au/case-studies/ (accessed on 2 December 2019).
  83. Stewart, R.A.; Nguyen, K.; Beal, C.; Zhang, H.; Sahin, O.; Bertone, E. Integrated intelligent water-energy metering systems and informatics: Visioning a digital multi-utility service provider. Environ. Model. Softw. 2018, 105, 94–117. [Google Scholar] [CrossRef]
  84. Monks, I.; Stewart, R.A.; Sahin, O.; Keller, R.; Prevos, P. Customer Satisfaction, the Ultimate Benefit of Digital Water Metering. 2020, in press. [Google Scholar]
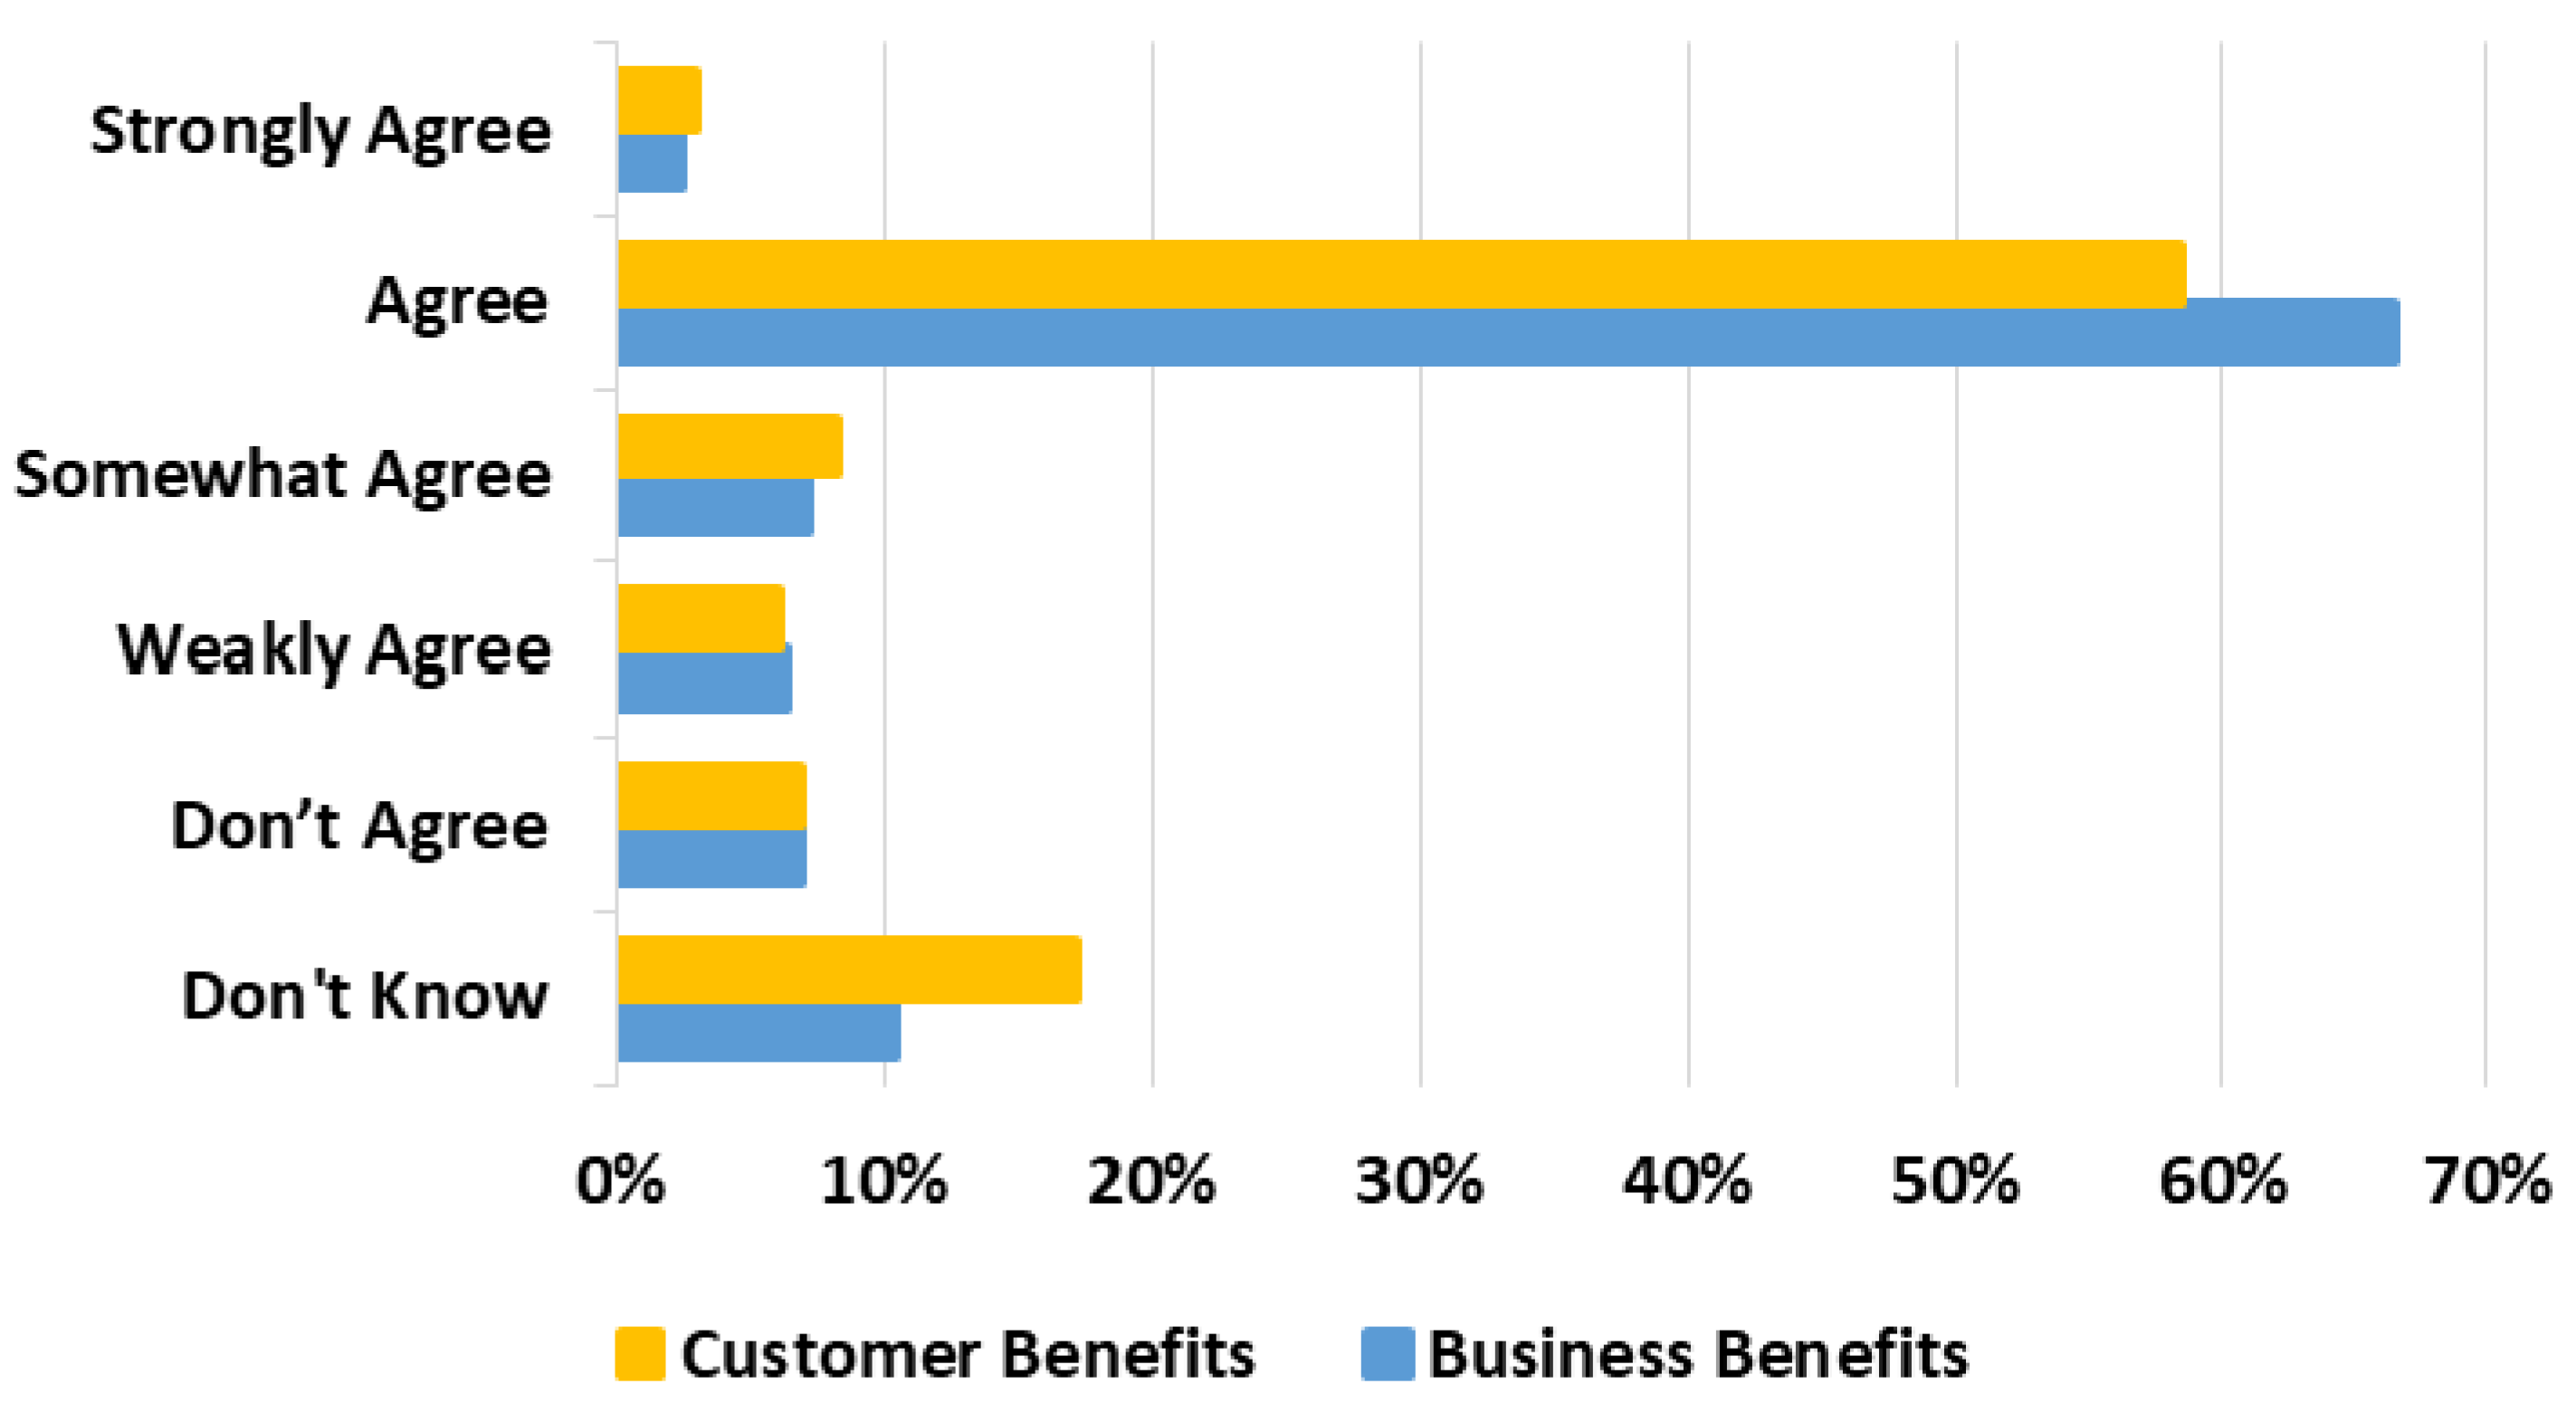
Figure 1. Within each beneficiary group (colour), the Percentage response (x-axis) for each agreement level (y-axis) aggregated across all benefits.
Water 12 01436 g001
Figure 2. Within each beneficiary group (y-axis), depending on the level of the expert’s experience in digital metering (inner y-axis): the relative percentage response (x-axis) for each agreement level (coloured).
Water 12 01436 g002
Figure 3. Within each beneficiary group (y-axis), depending on the level of the experts’ years of industry experience (inner y-axis): the relative percentage response (x-axis) for each agreement level (coloured).
Water 12 01436 g003
Figure 4. Within each beneficiary group (y-axis), depending on the type of the experts’ job roles (inner y-axis): the relative percentage response (x-axis) for each agreement level (colour).
Water 12 01436 g004
Figure 5. Cost of water benefits, phrase used to describe %-benefit value (y-axis) in expert assessments, shown as high-low ranges (rectangles), against the expected %-benefit value, i.e., savings (x-axis). These are arranged in ascending order of value (top to bottom), annotated with the relevant benefit question (brackets, y-axis), as well as indicative trend lines (red dotted line) with flex points added to aid description.
Water 12 01436 g005
Figure 6. Charges and operational costs benefits: the phrase used to describe %-benefit value (y-axis) in expert assessments, shown as high–low ranges (rectangles), against the expected %-benefit value i.e., savings (x-axis). Same annotations as in Figure 5.
Water 12 01436 g006
Figure 7. For each level of cost of water benefit (y-axis), the frequency of responses (x-axis), aggregated across all cost of water benefits.
Water 12 01436 g007
Figure 8. Cost of water benefits: Cumulative frequency (y-axis, annotation) of benefit values (x-axis), scaled per every 100 responses by experts. The line is colour coded in the same way as Figure 7 to enable easy comparison.
Water 12 01436 g008
Figure 9. For each level of charges and operational cost–benefit (y-axis), the frequency of responses (x-axis), aggregated across all charges and operational cost benefits.
Water 12 01436 g009
Figure 10. Operational costs and charge benefits: cumulative frequency (y-axis, annotated) of benefit values (x-axis), scaled per every 100 experts. The line is colour-coded in the same way as Figure 9 to enable easy comparison.
Water 12 01436 g010
Figure 11. Indication of how benefit values can be used, as input to Monte Carlo simulations (histogram, red bars) to show relative frequency (y-axis) of total benefit value (AUD$ millions, x-axis) based on hypothetical annual operating costs and @Risk v7.6, 50,000 iterations. (Results are illustrative only and included to show potential outputs).
Water 12 01436 g011
Table 1. Years of experience in the water industry by water business service organisation type.
Years in the Water IndustryMetroRegionalIndependent
0–2 years210
3–5 years530
6–10 years660
11–20 years1035
more than 20 years632
Total29167
Table 2. Respondents’ areas of experience/expertise by organisation type (multiple selected questions).
GroupExpertise/ExperienceMetroRegionalIndependentTotal
CustomerCustomer Service1613635
Communications and digital 10011
ADR, complaints 10011
Water efficiency 11214
TechnicalEngineering Planning113216
Engineering Operations72110
Metering108321
Planning and Maintenance 10101
Integrated Water Management 11001
Contract Management, Stakeholder Engagement 10011
SupportSenior Management55212
Finance4105
Legal/Regulation/Corporate Services4105
Human Resources0101
Information Technology1113
Data science 10101
R&D 10101
Academic 10112
1 Answer from the free text option “Other”.
Table 3. Level of experience with DWM by organisation type.
LevelLevel of ExperienceMetroRegionalIndependentTotal
HighFull rollout of DWM-4-4
In progress rollout of DWM12-3
Completed or in-progress trial(s) of DWM82212
MinimalPlanning a trial(s) of DWM64212
Peripheral role in metering and/or digital metering area101314
Public information and presentations on DWM only12-3
ZeroNo current knowledge or experience/water industry general knowledge only31-4
Table 4. Coding keywords for agreement level scoring from expert assessments.
Agreement Level ScoreTheme
(Meaning)
Sample of Codes
4Strong Agreement
(interpreted as a higher enthusiasm level than YES or PROBABLY, etc)
Absolutely, Definitely
3Agree
(interpreted as better than 50% chance)
Yes, Probably, Should, Agree
2Somewhat agree
(interpreted as up to 50% chance)
Possibly, Potentially, Potential, Somewhat,
To some extent, It will not be a significant benefit, Minimal impact, To be confirmed
1Weak agreement
(interpreted as more than no chance, but less than possibly)
Maybe, Perhaps, Could, Doubtful, Unsure,
Difficult to say, Not necessarily
0Disagree
(interpreted as no chance)
No, Highly doubtful, Customers expect this,
Would not expect so, Not applicable,
Not particularly, Not to my knowledge,
A dis-benefit
−1NULL answerDo not know, No opinion, Not Sure,
Have not heard of, I do not understand,
Not my area, Unable to answer,
Have not considered, ‘-‘
Table 5. Coding keywords of benefit value scoring from expert assessments.
Benefit Value ScoreTheme
(Meaning)
Sample of Codes
5Reduce/improve SubstantiallySubstantial, Reduce substantially, Reduce dramatically, Up to 100%, Up to 3 mths of leak, Should disappear, No readers no incidents, Eliminate
4Reduce/improve SignificantlySignificant reduction, Vastly improve, Reduce by nearly 90%, Reduce significantly 70%, Rapid engagement, Rich data, Faster identify, Easier identification, Early resolution, Far less, Highly satisfied, Contribute largely
3Reduce/improveReduce, Improve, Less, Gain, Useful, Tailored, Reduce unrecorded, Much easier, Not major, Not drastic, Not large, More accurate, Measurable, Better, Assist responsiveness, Delay a few years, Help
2Reduce/improve MarginalMarginal, Reduce slightly, Small, Very low, Reduce some, Not big, Add little,
1Reduce/improve NegligibleNegligible
Table 6. Percentage benefit value ranges for themes by context.
Context:Cost of WaterCharges/Operational Costs
Theme (Score)Start Pct (%)End Pct (%)Start Pct (%)End Pct (%)
Disagree (no benefit, 0)0000
Reduce/improve Negligible (1)0<10<25 2
Reduce/improve Marginal (2)1<325<45 2
Reduce/improve (3)3<1045<75
Reduce/improve Significantly (4)10<1575<90
Reduce/improve Substantially (5)1525 190100
1 25% is the nominal maximum benefit of cost of water savings. Higher benefit may be possible in particularly leaky networks or wasteful situations. 2 Nominal ranges for marginal and negligible percentage changes to charges and operational costs have been included from just four quantified values provided in the experts’ assessments of the benefits for these phrases.
Table 7. Number of benefit value scores by agreement level scores for quantified answers.
Agreement Level Score
Context: Cost of Water1234
Benefit Value Score4/5 101433
312141264
2114181
11100
Context: Charges/Operational Costs
Benefit Value Score4/5 105862
312141157
206190
10200
1 Benefit Value levels 4 and 5 have been grouped together for this analysis so as to equate to Agreement Level 4.
Table 8. Qualitative-to-quantitative transformation of benefit value—cost of water.
Context: Cost of WaterNumber Answers Scoring This Benefit ValueNumber Including Imputed Score 2Cumulative FrequencyRelative. Cumulative Frequency
Benefit Value ThemeStart of Range %End of Range %
Disagree (no benefit) 3002424245
Negligible0<121214510
Marginal1<354549922
Reduce/improve3<1015830240188
Significant10<15494844999
Substantial1525 145454100
1 25% is the nominal maximum benefit of the cost of water savings. Higher-benefit may be possible in particularly leaky networks or wasteful situations. 2 The 299 answers that were not quantified by number or phrase have been given a default Benefit Value score of 3 based on the discussion above. 3. The number of participants that disagreed with benefits within the Context is included as they represent views of achieving no benefit (i.e., 0%).
Table 9. Qualitative-to-quantitative transformation of benefit value—charges/operational costs.
Context: Charges/Operational CostsNumber Answers Scoring This Benefit ValueNumber Including Imputed Score 2Cumulative FrequencyRelative. Cumulative Frequency
Benefit Value ThemeStart of Range %End of Range %
Disagree (no benefit) 30040404010
Negligible0<25 12115112
Marginal25<45 125388921
Reduce/improve45<7514823232177
Significant75<90596038192
Substantial901003435416100
1 Nominal ranges for marginal and negligible %-changes to charges and operational costs are included without any quantified values being provided in the answers of the benefits for these phrases. 2 The 299 answers that were not quantified by number or phrase have been given a default Benefit Value score equivalent to the Agreement level score (see discussion above). 3. The number of participants that disagreed with benefits within the Context is included as they represent views of achieving no benefit (i.e., 0%).