Summer Changes in Water Mass Characteristics and Vertical Thermohaline Structure in the Eastern Chukchi Sea, 1974–2017


Abstract
1. Introduction
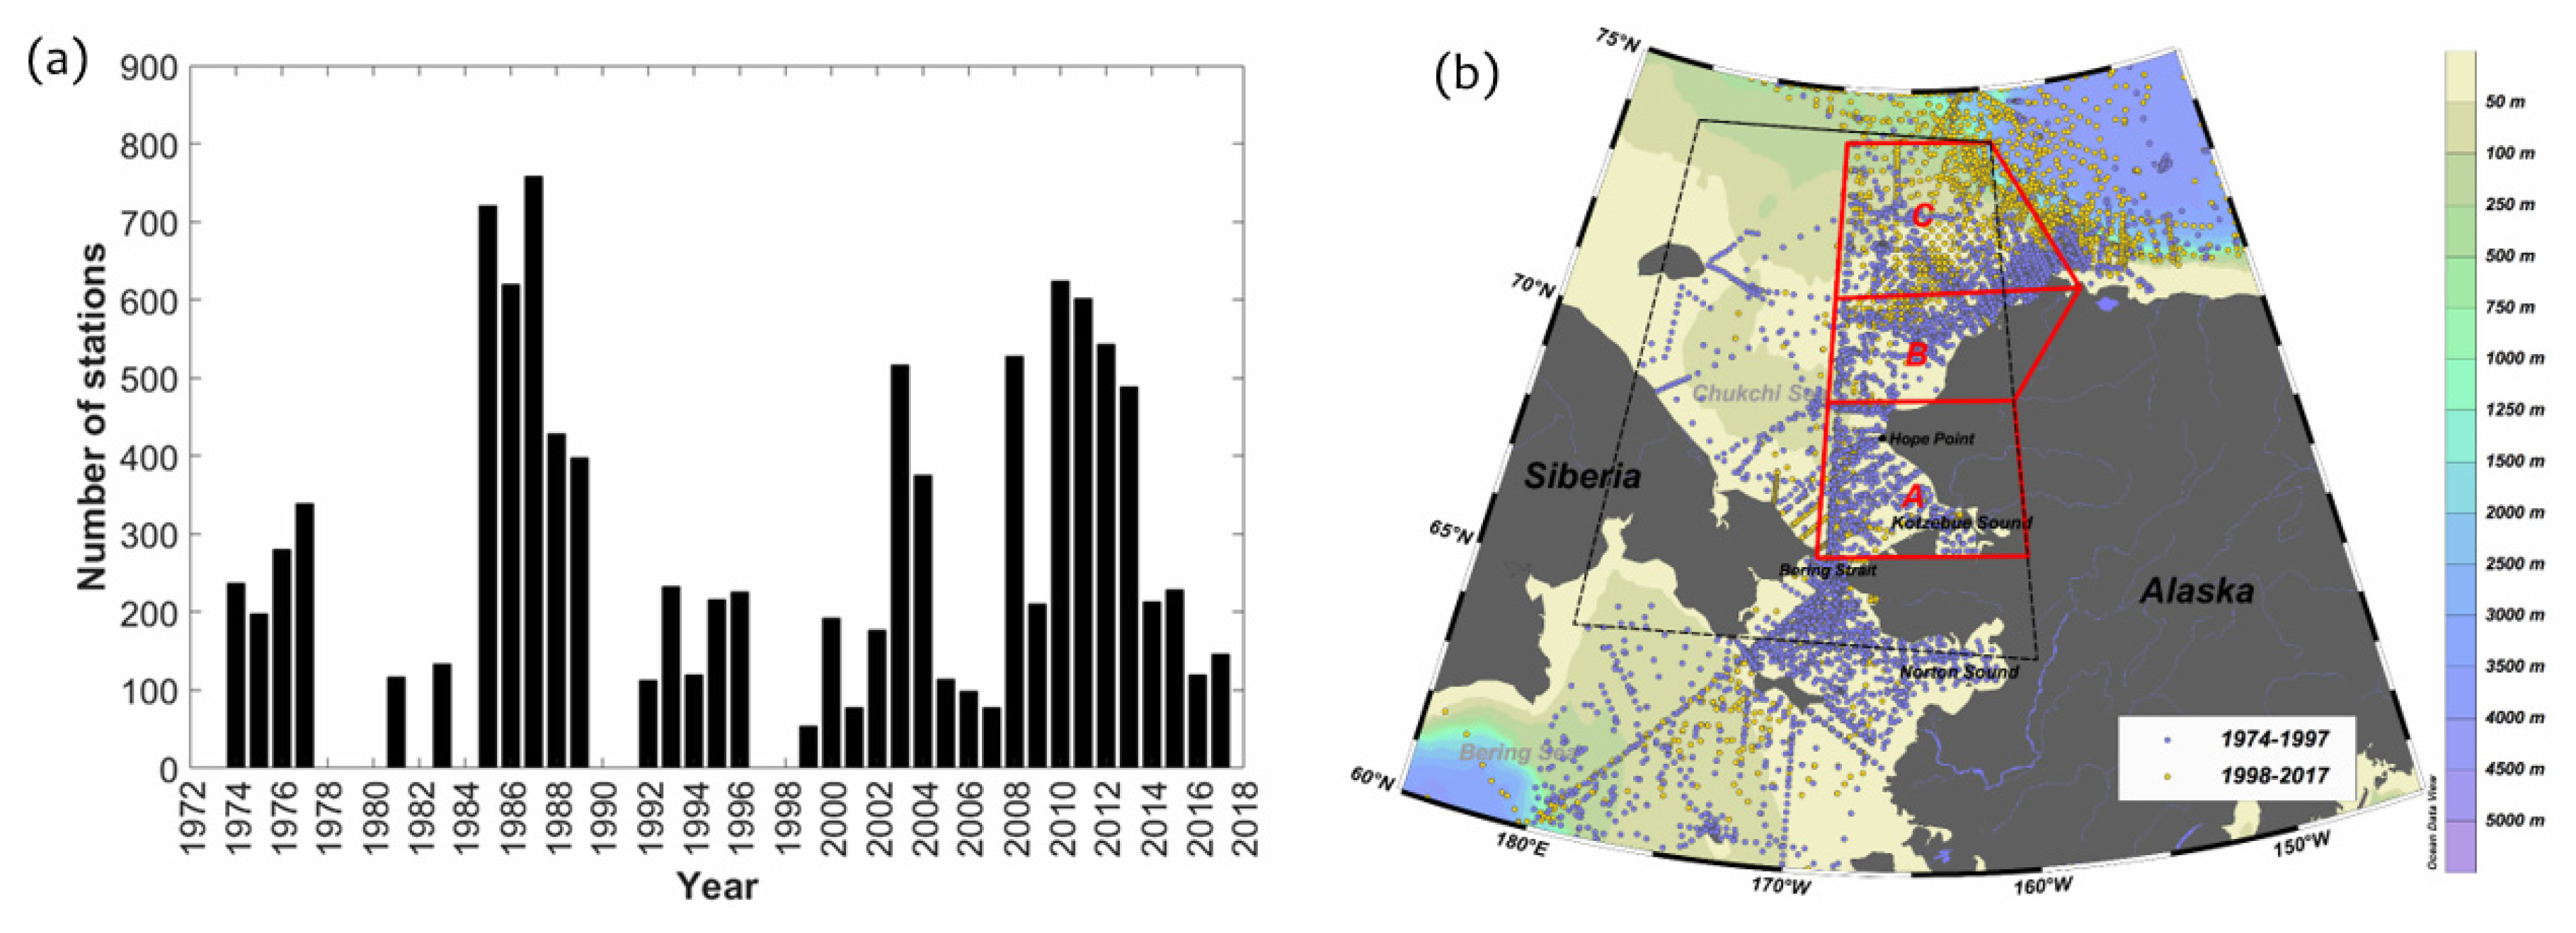
2. Data and Methods
3. Results
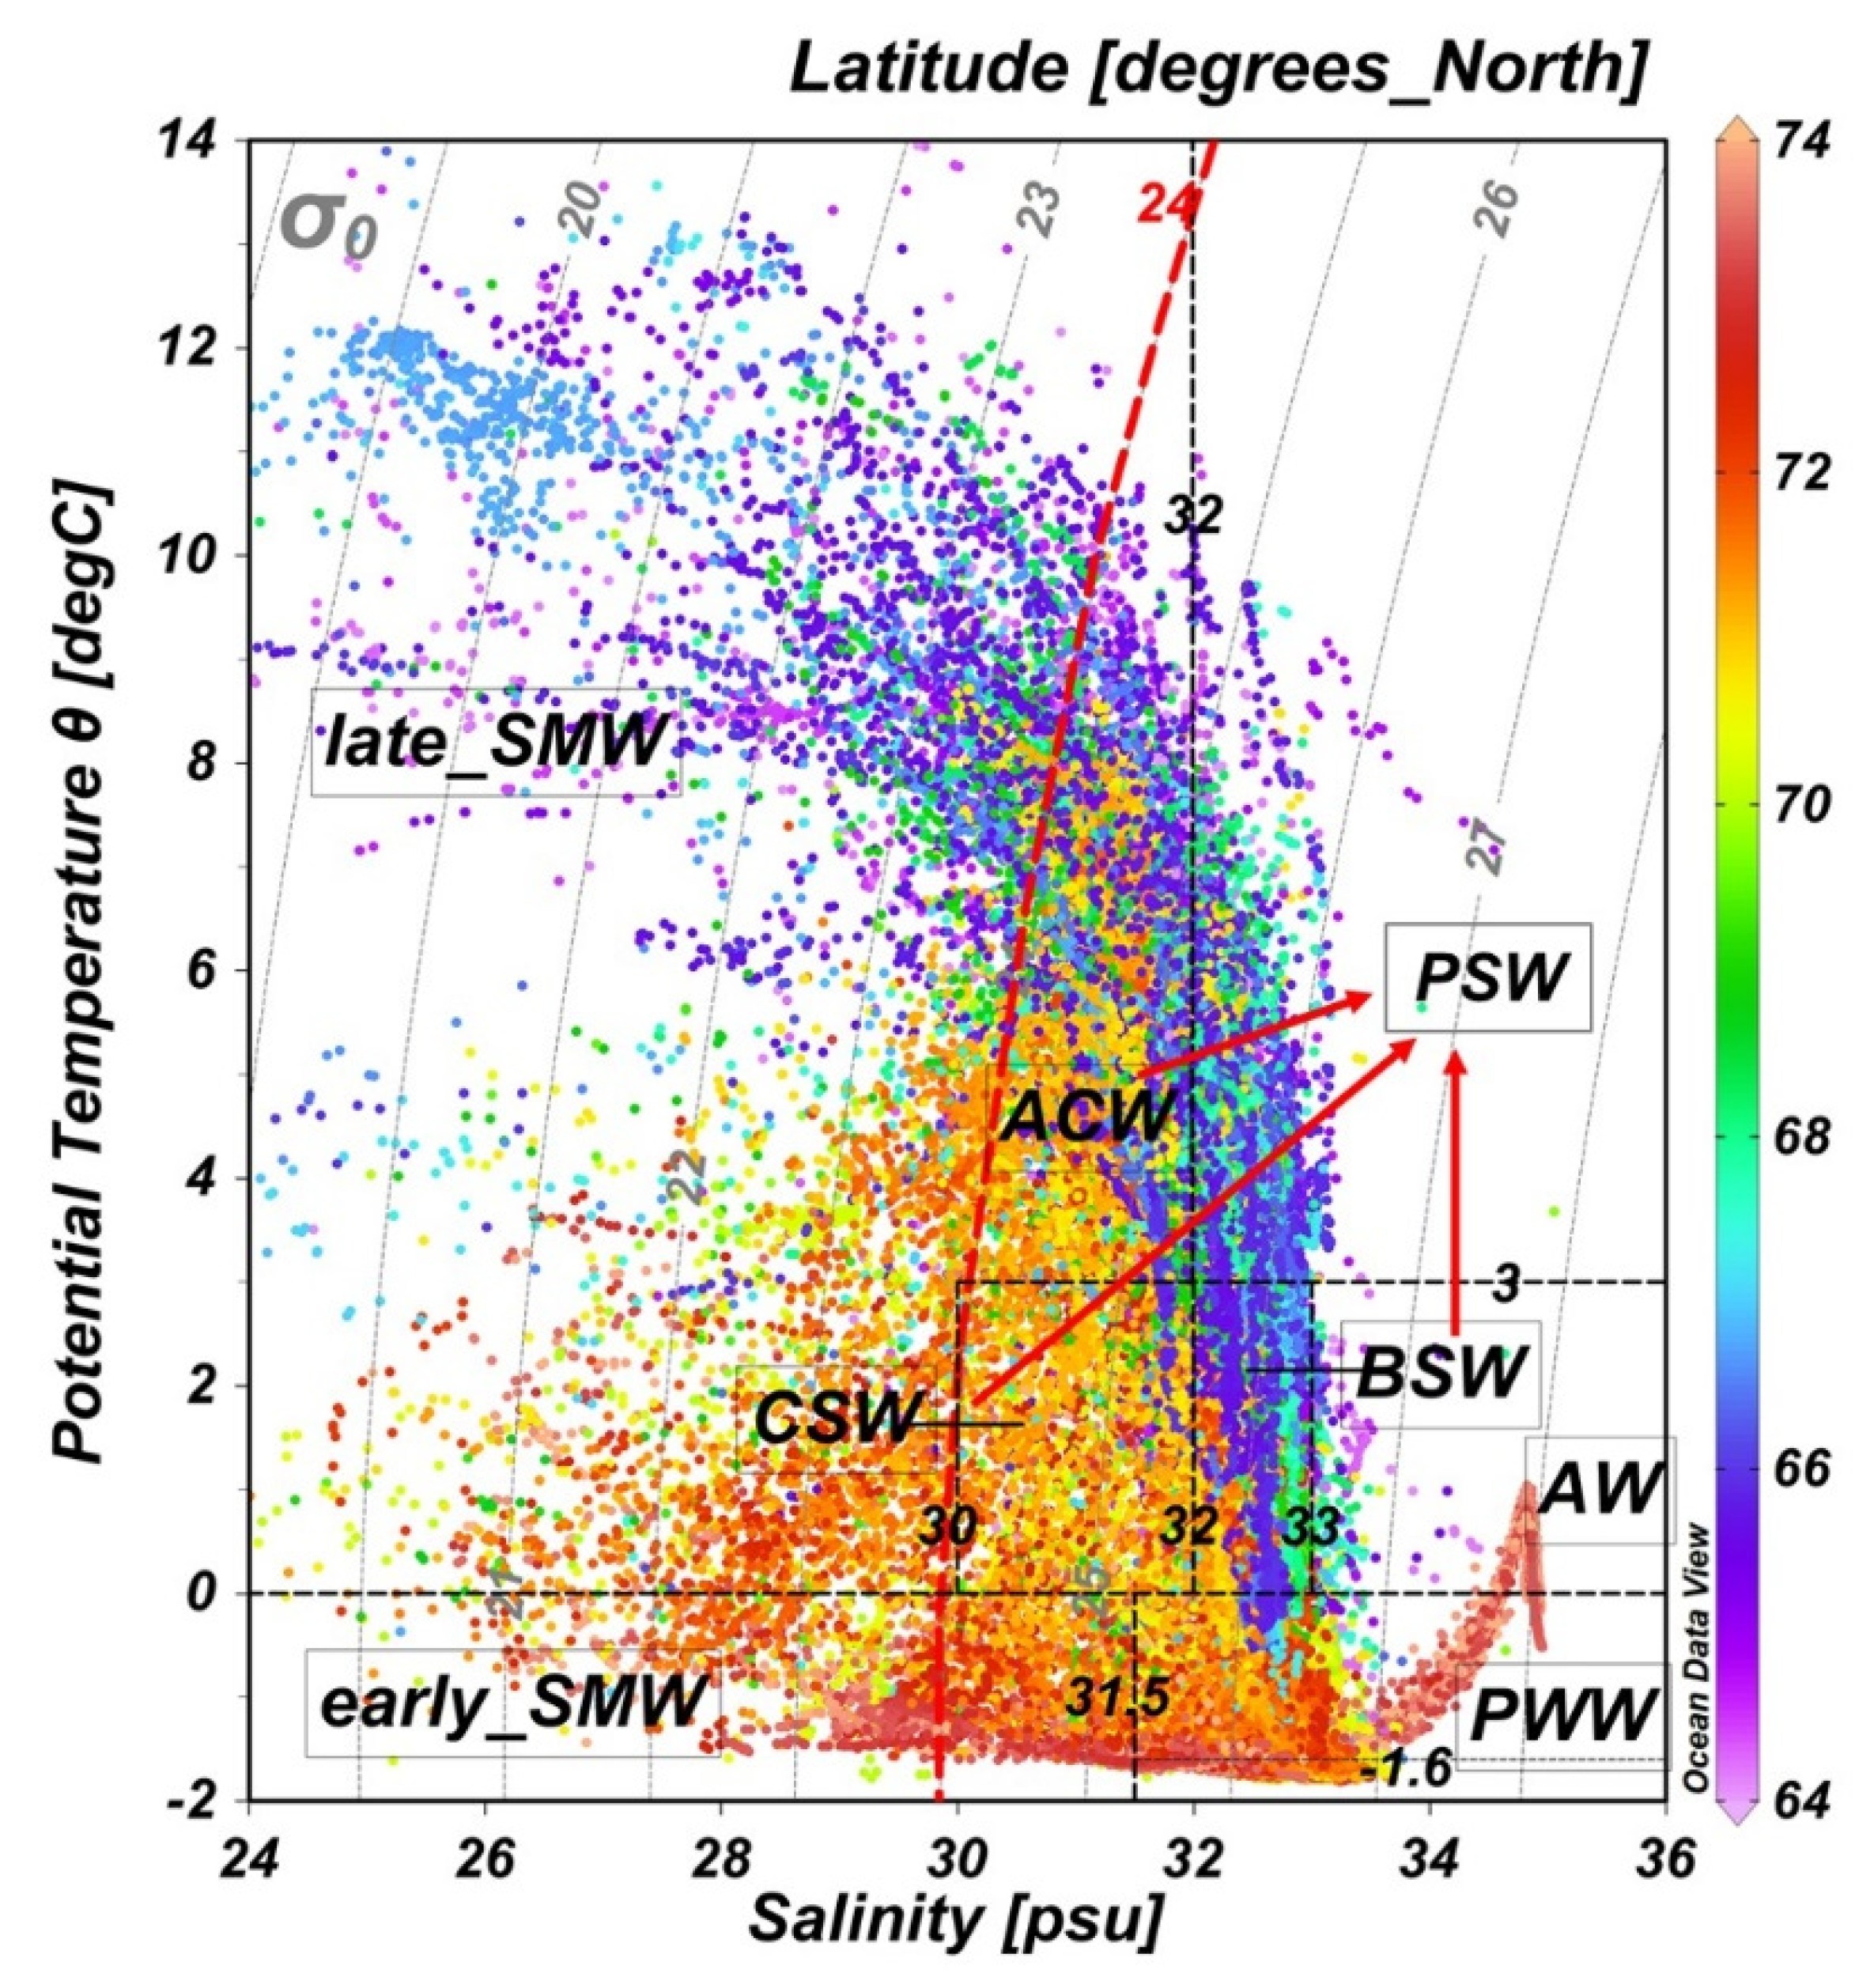
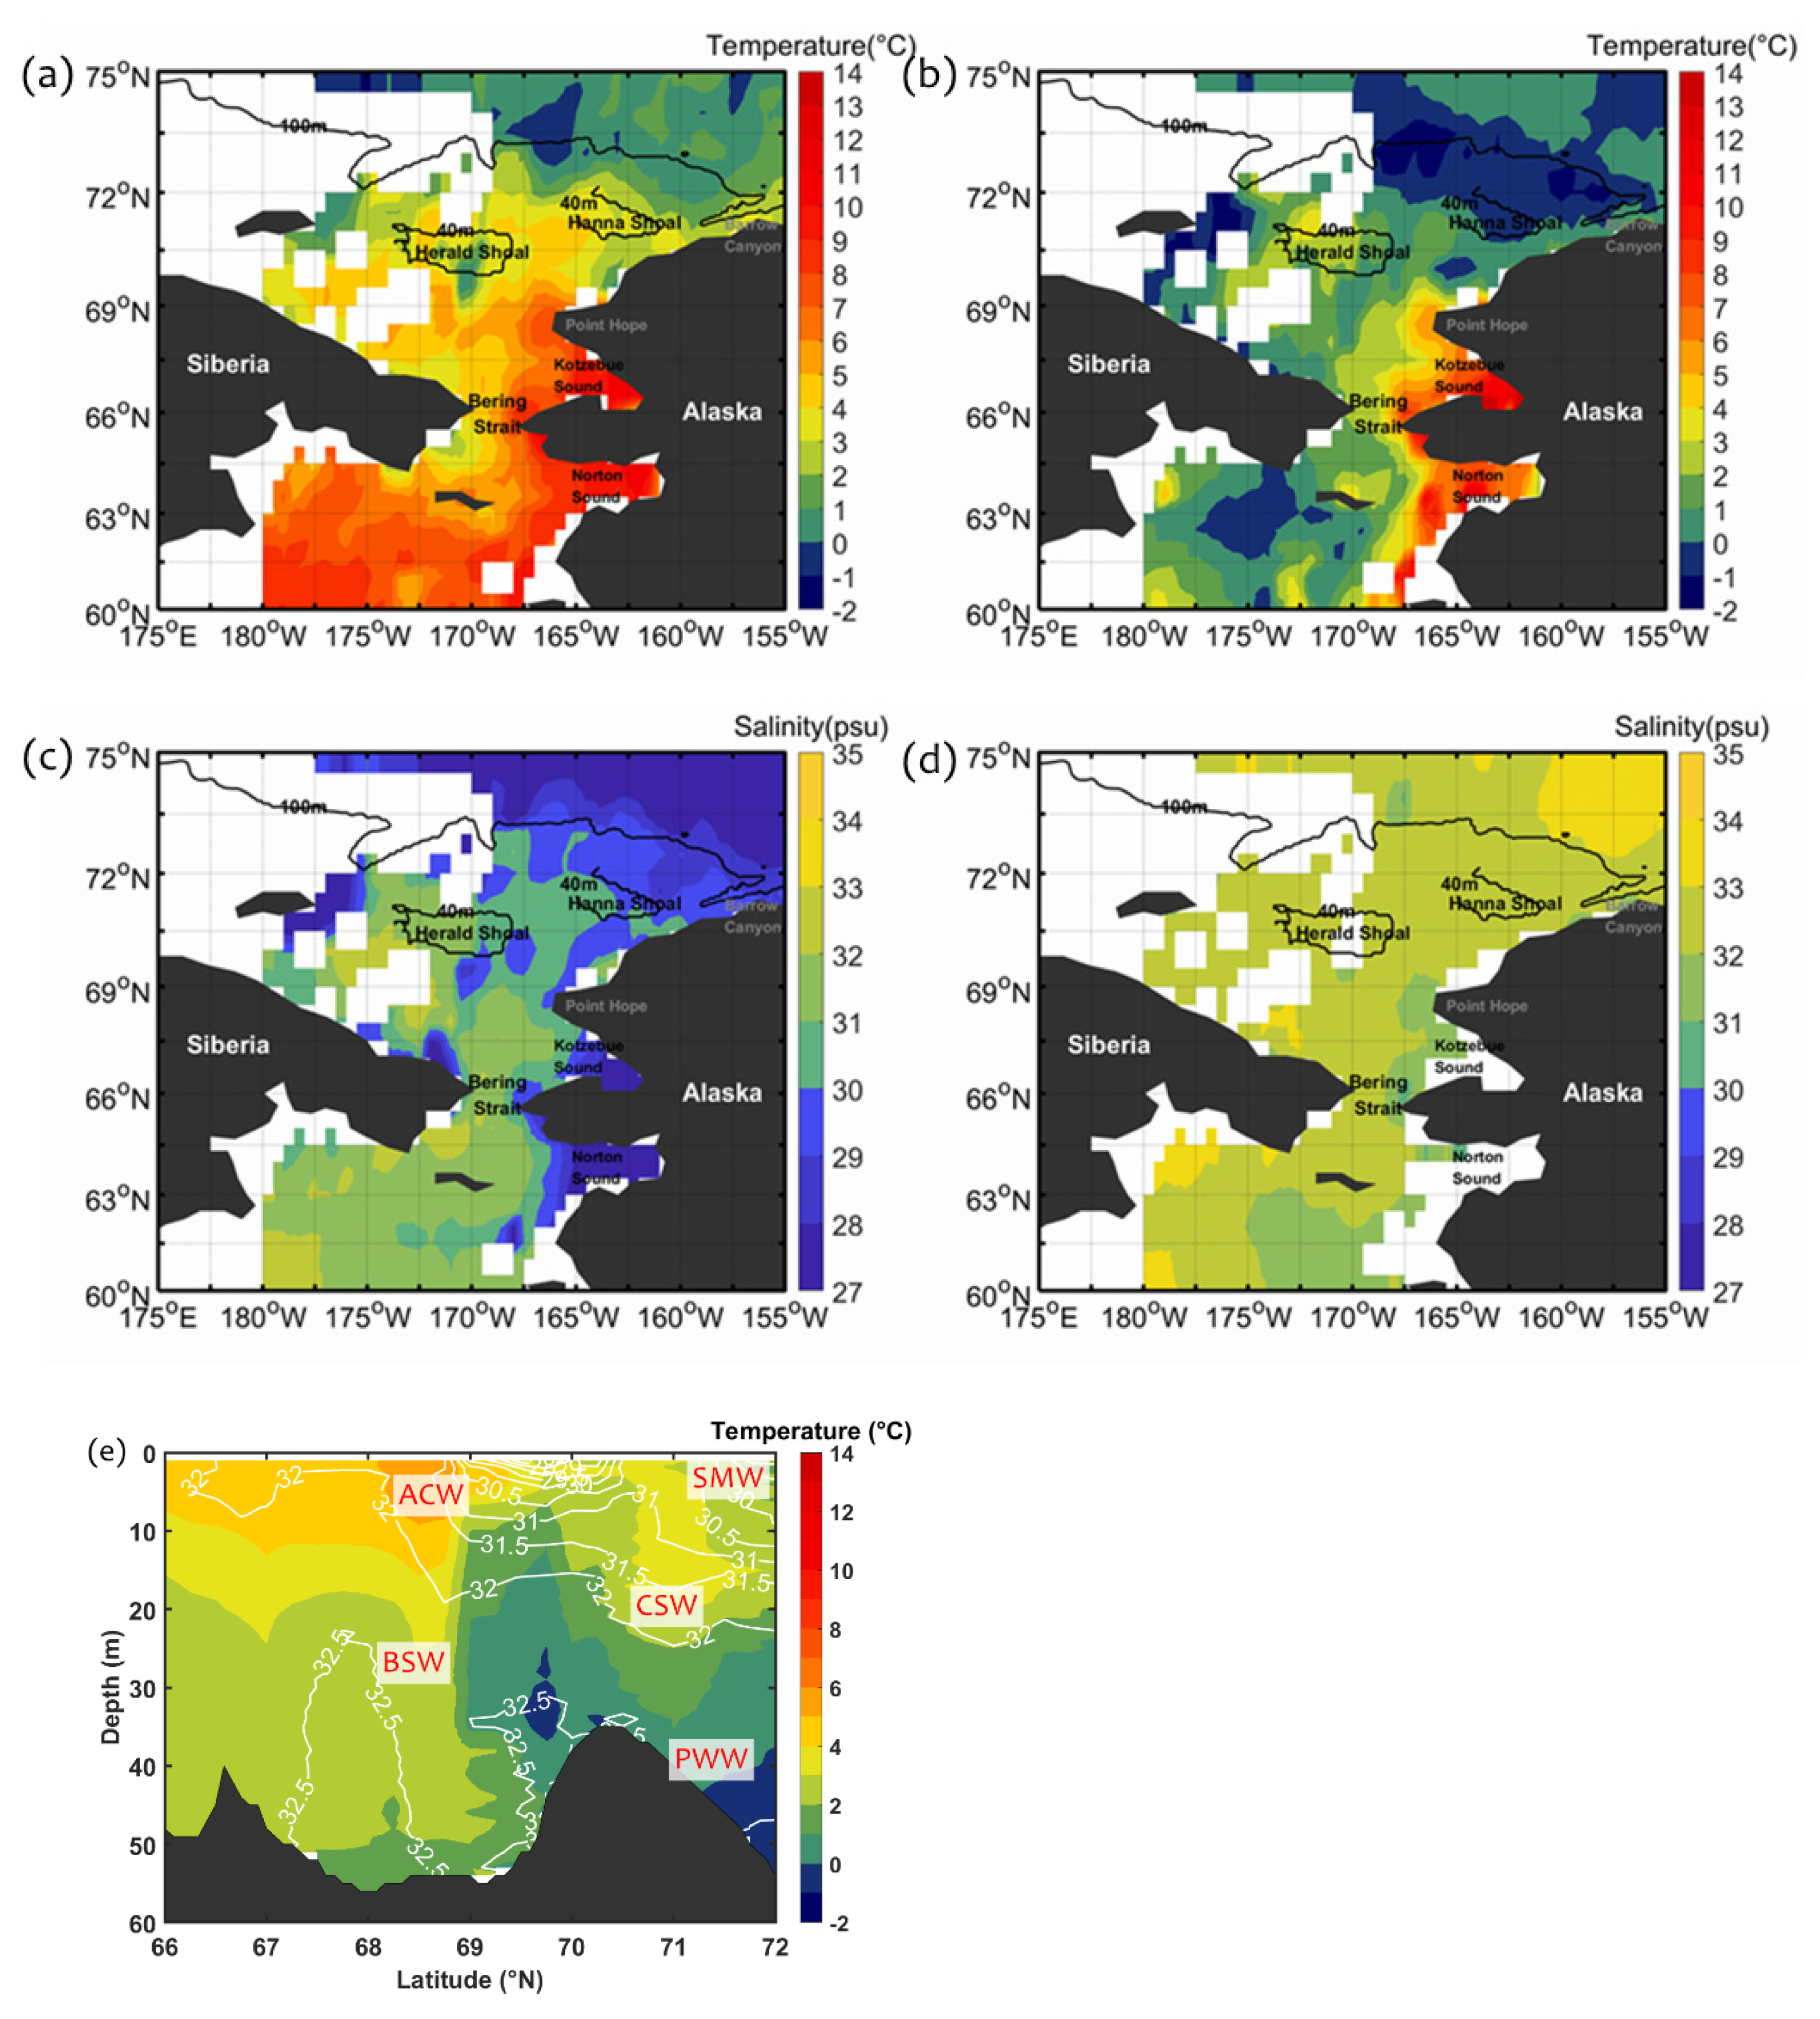
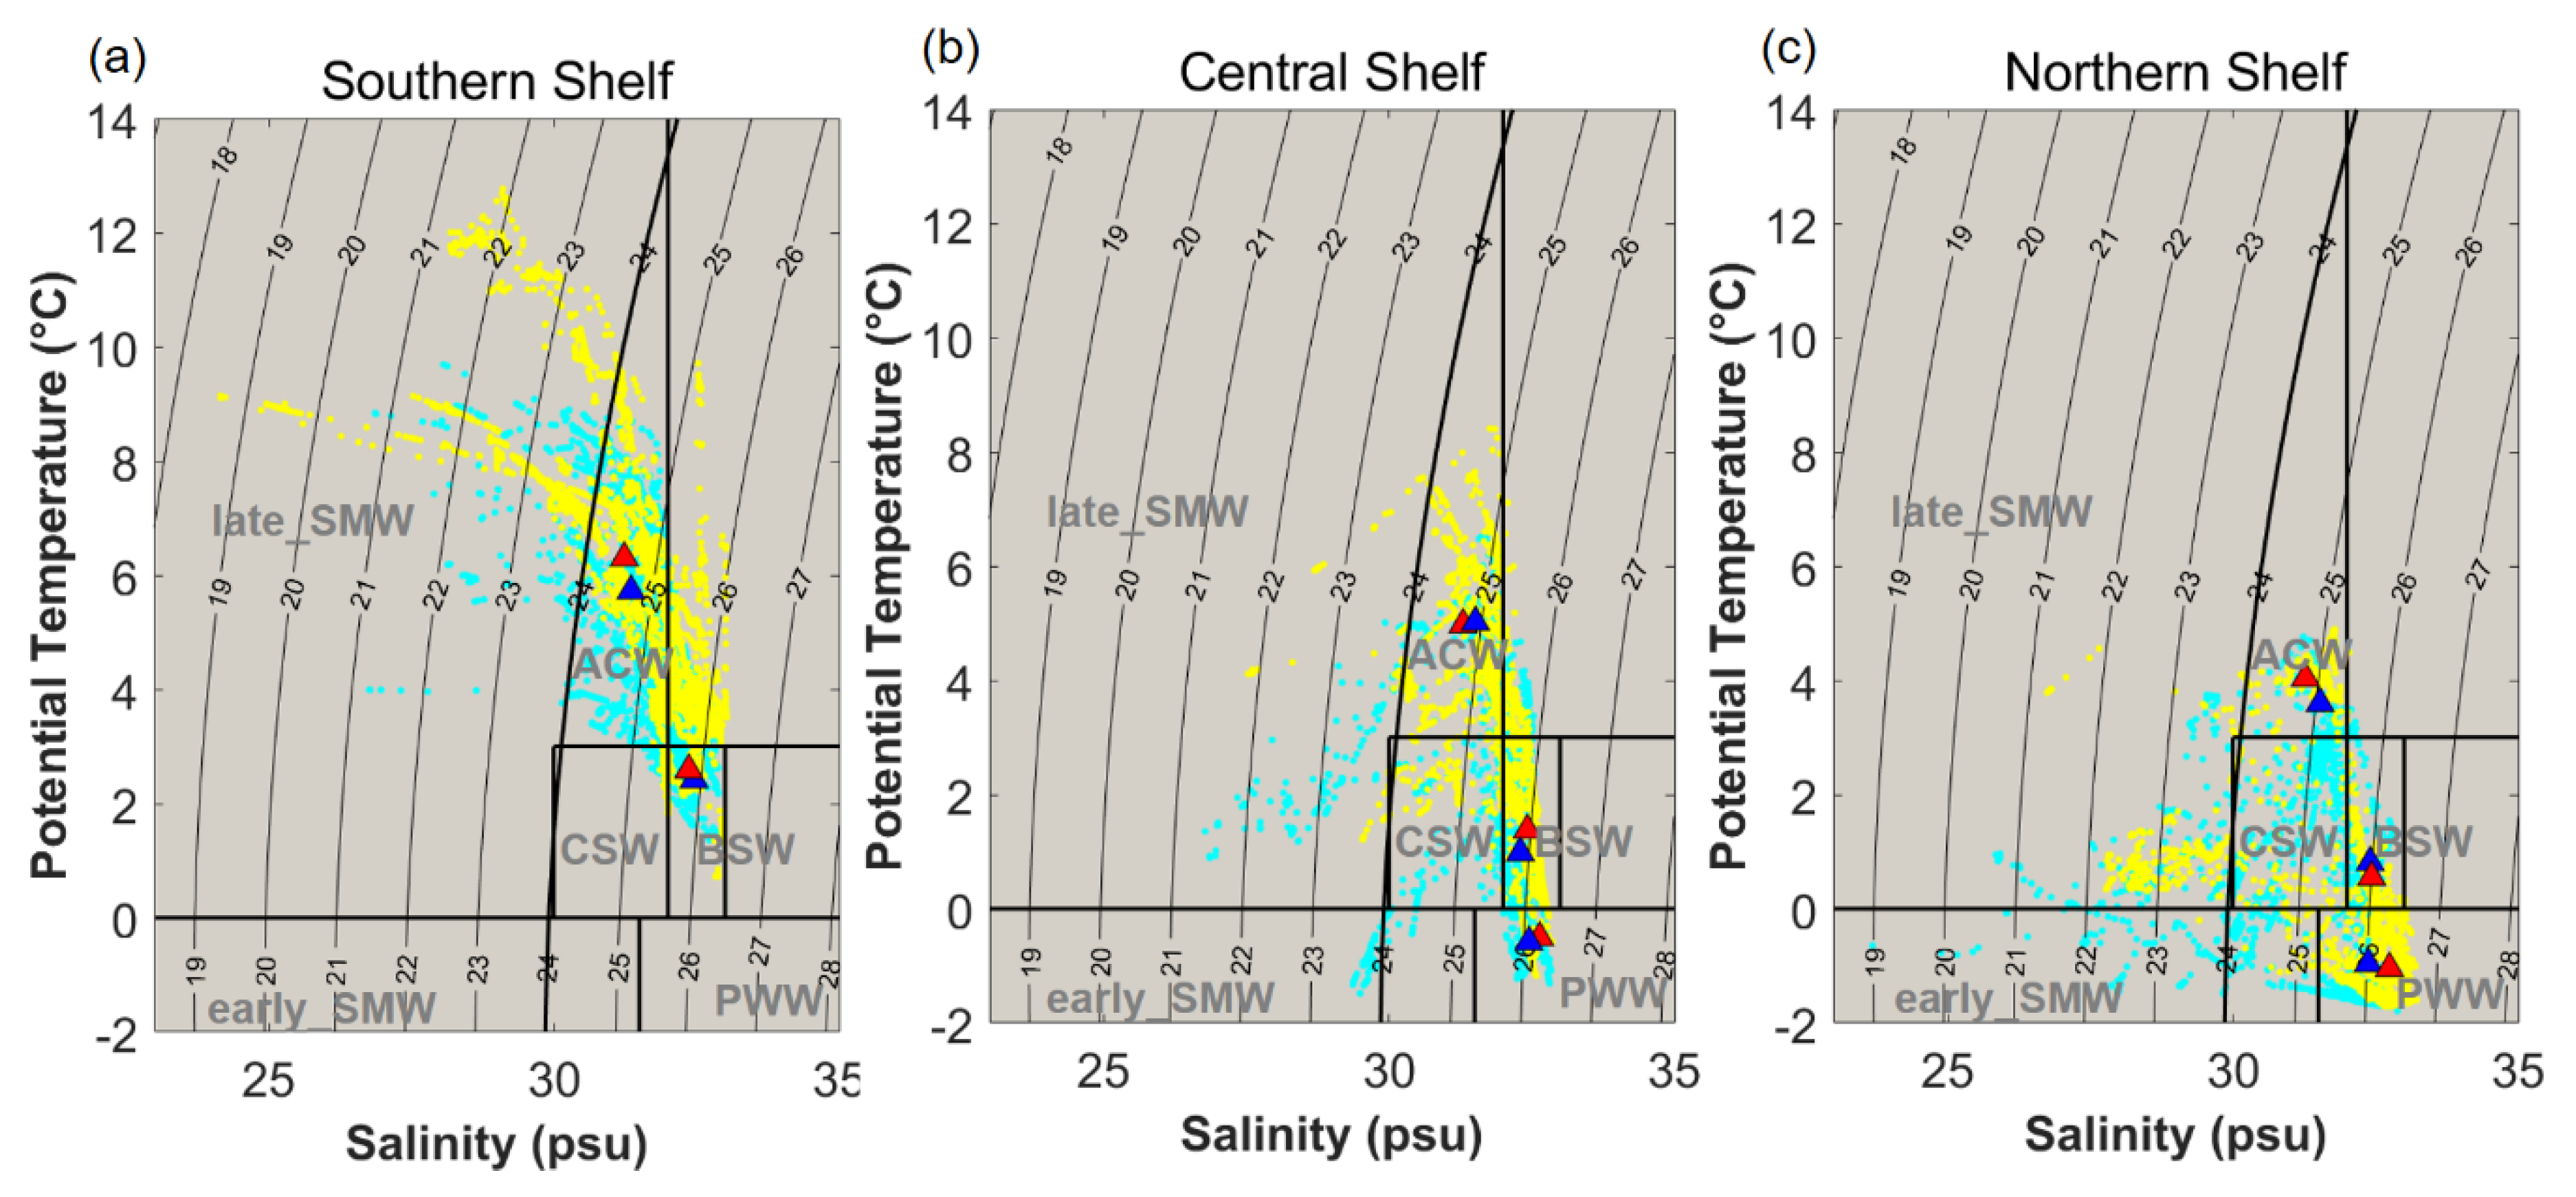
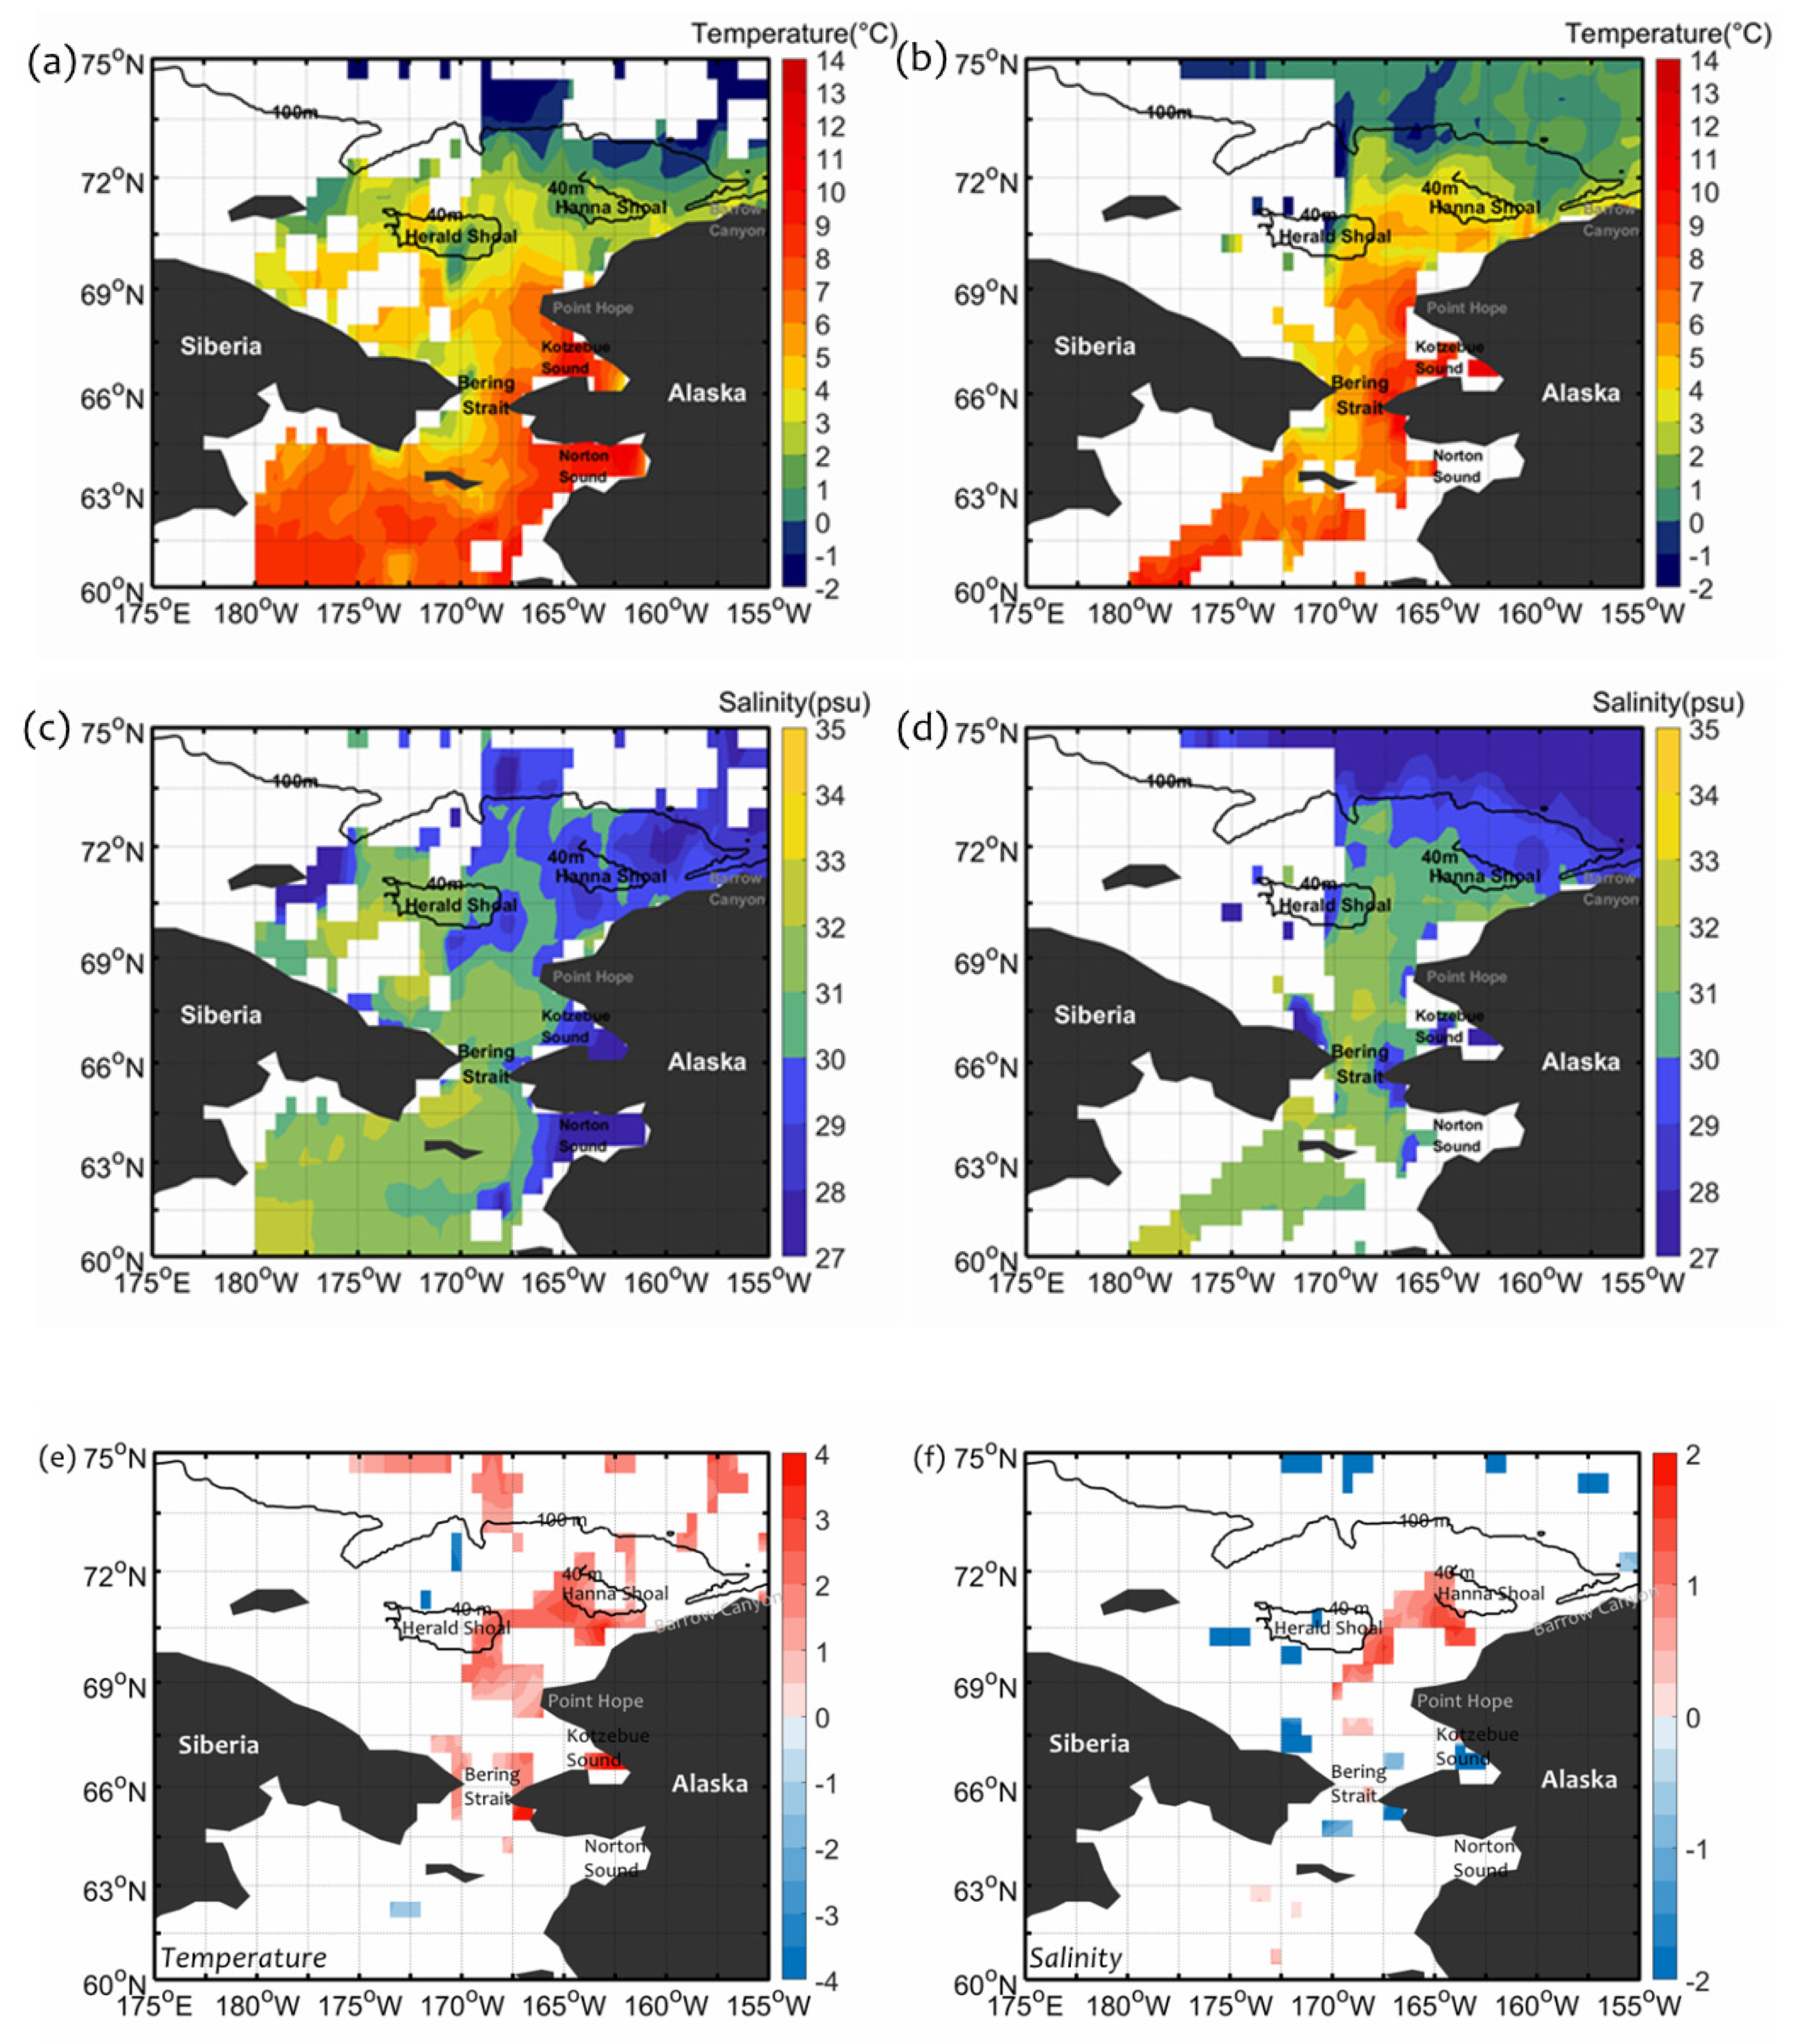
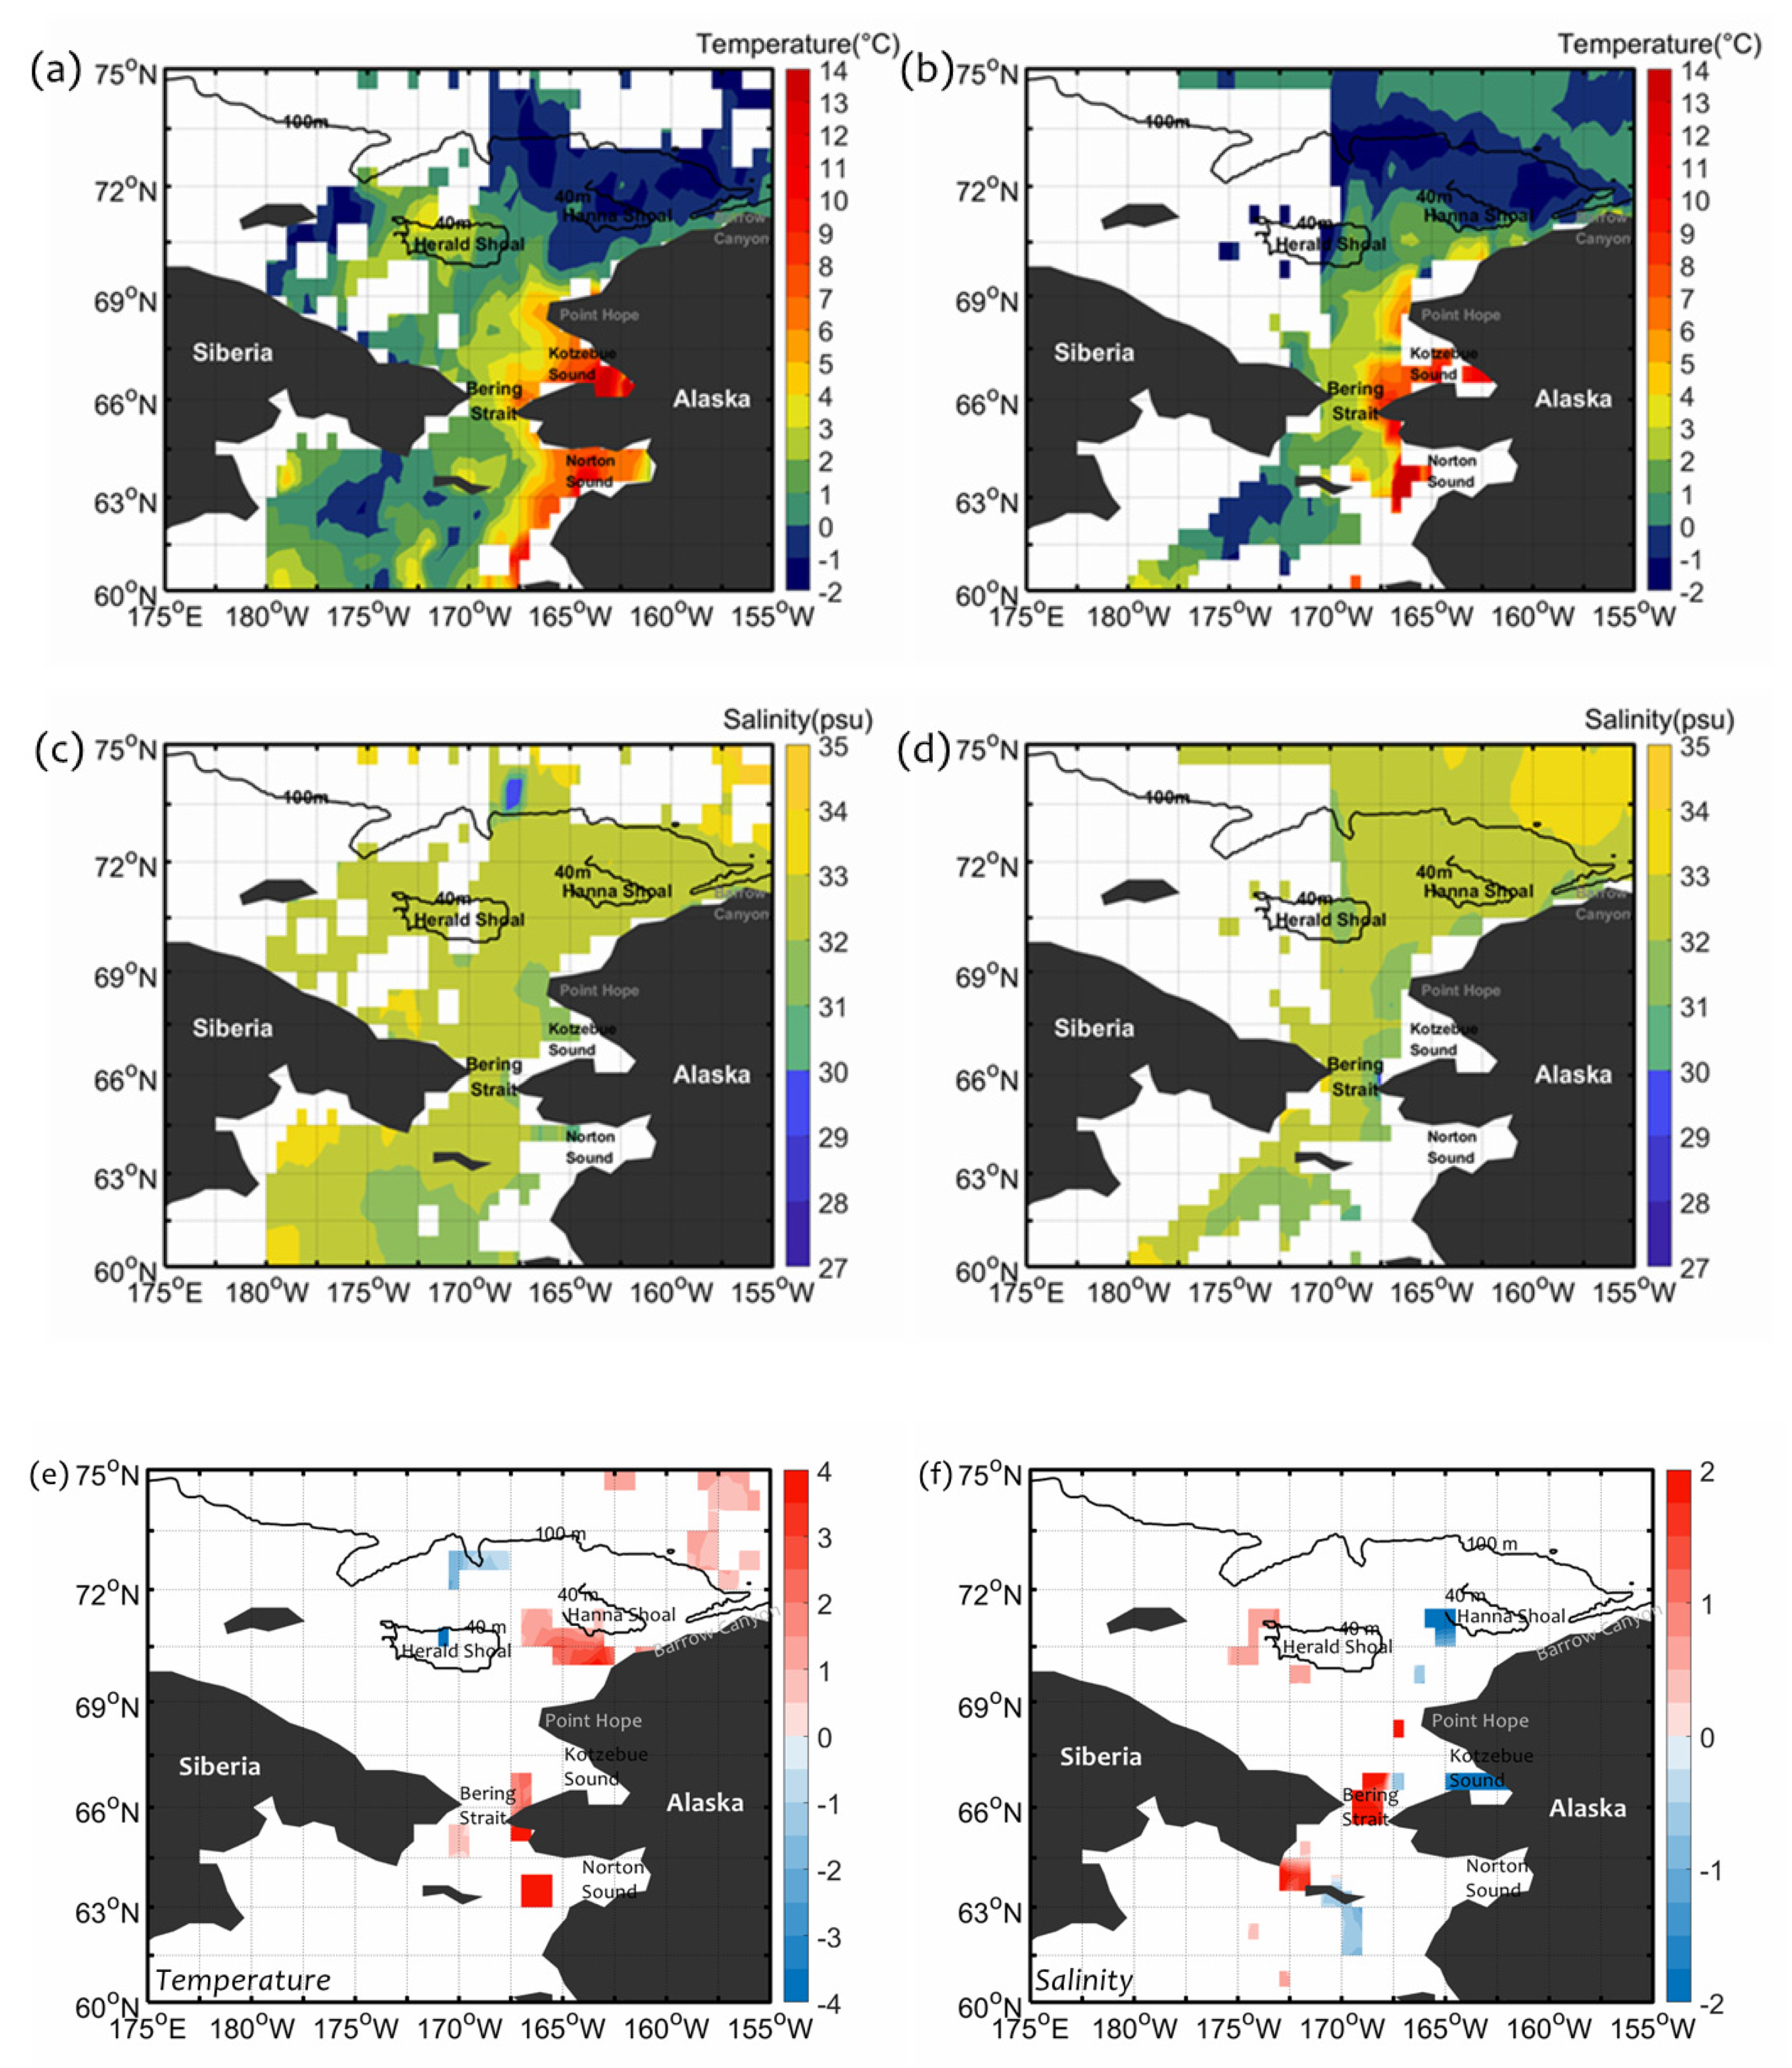
3.1. Hydrography during Summer: Spatial Distribution of Water Masses
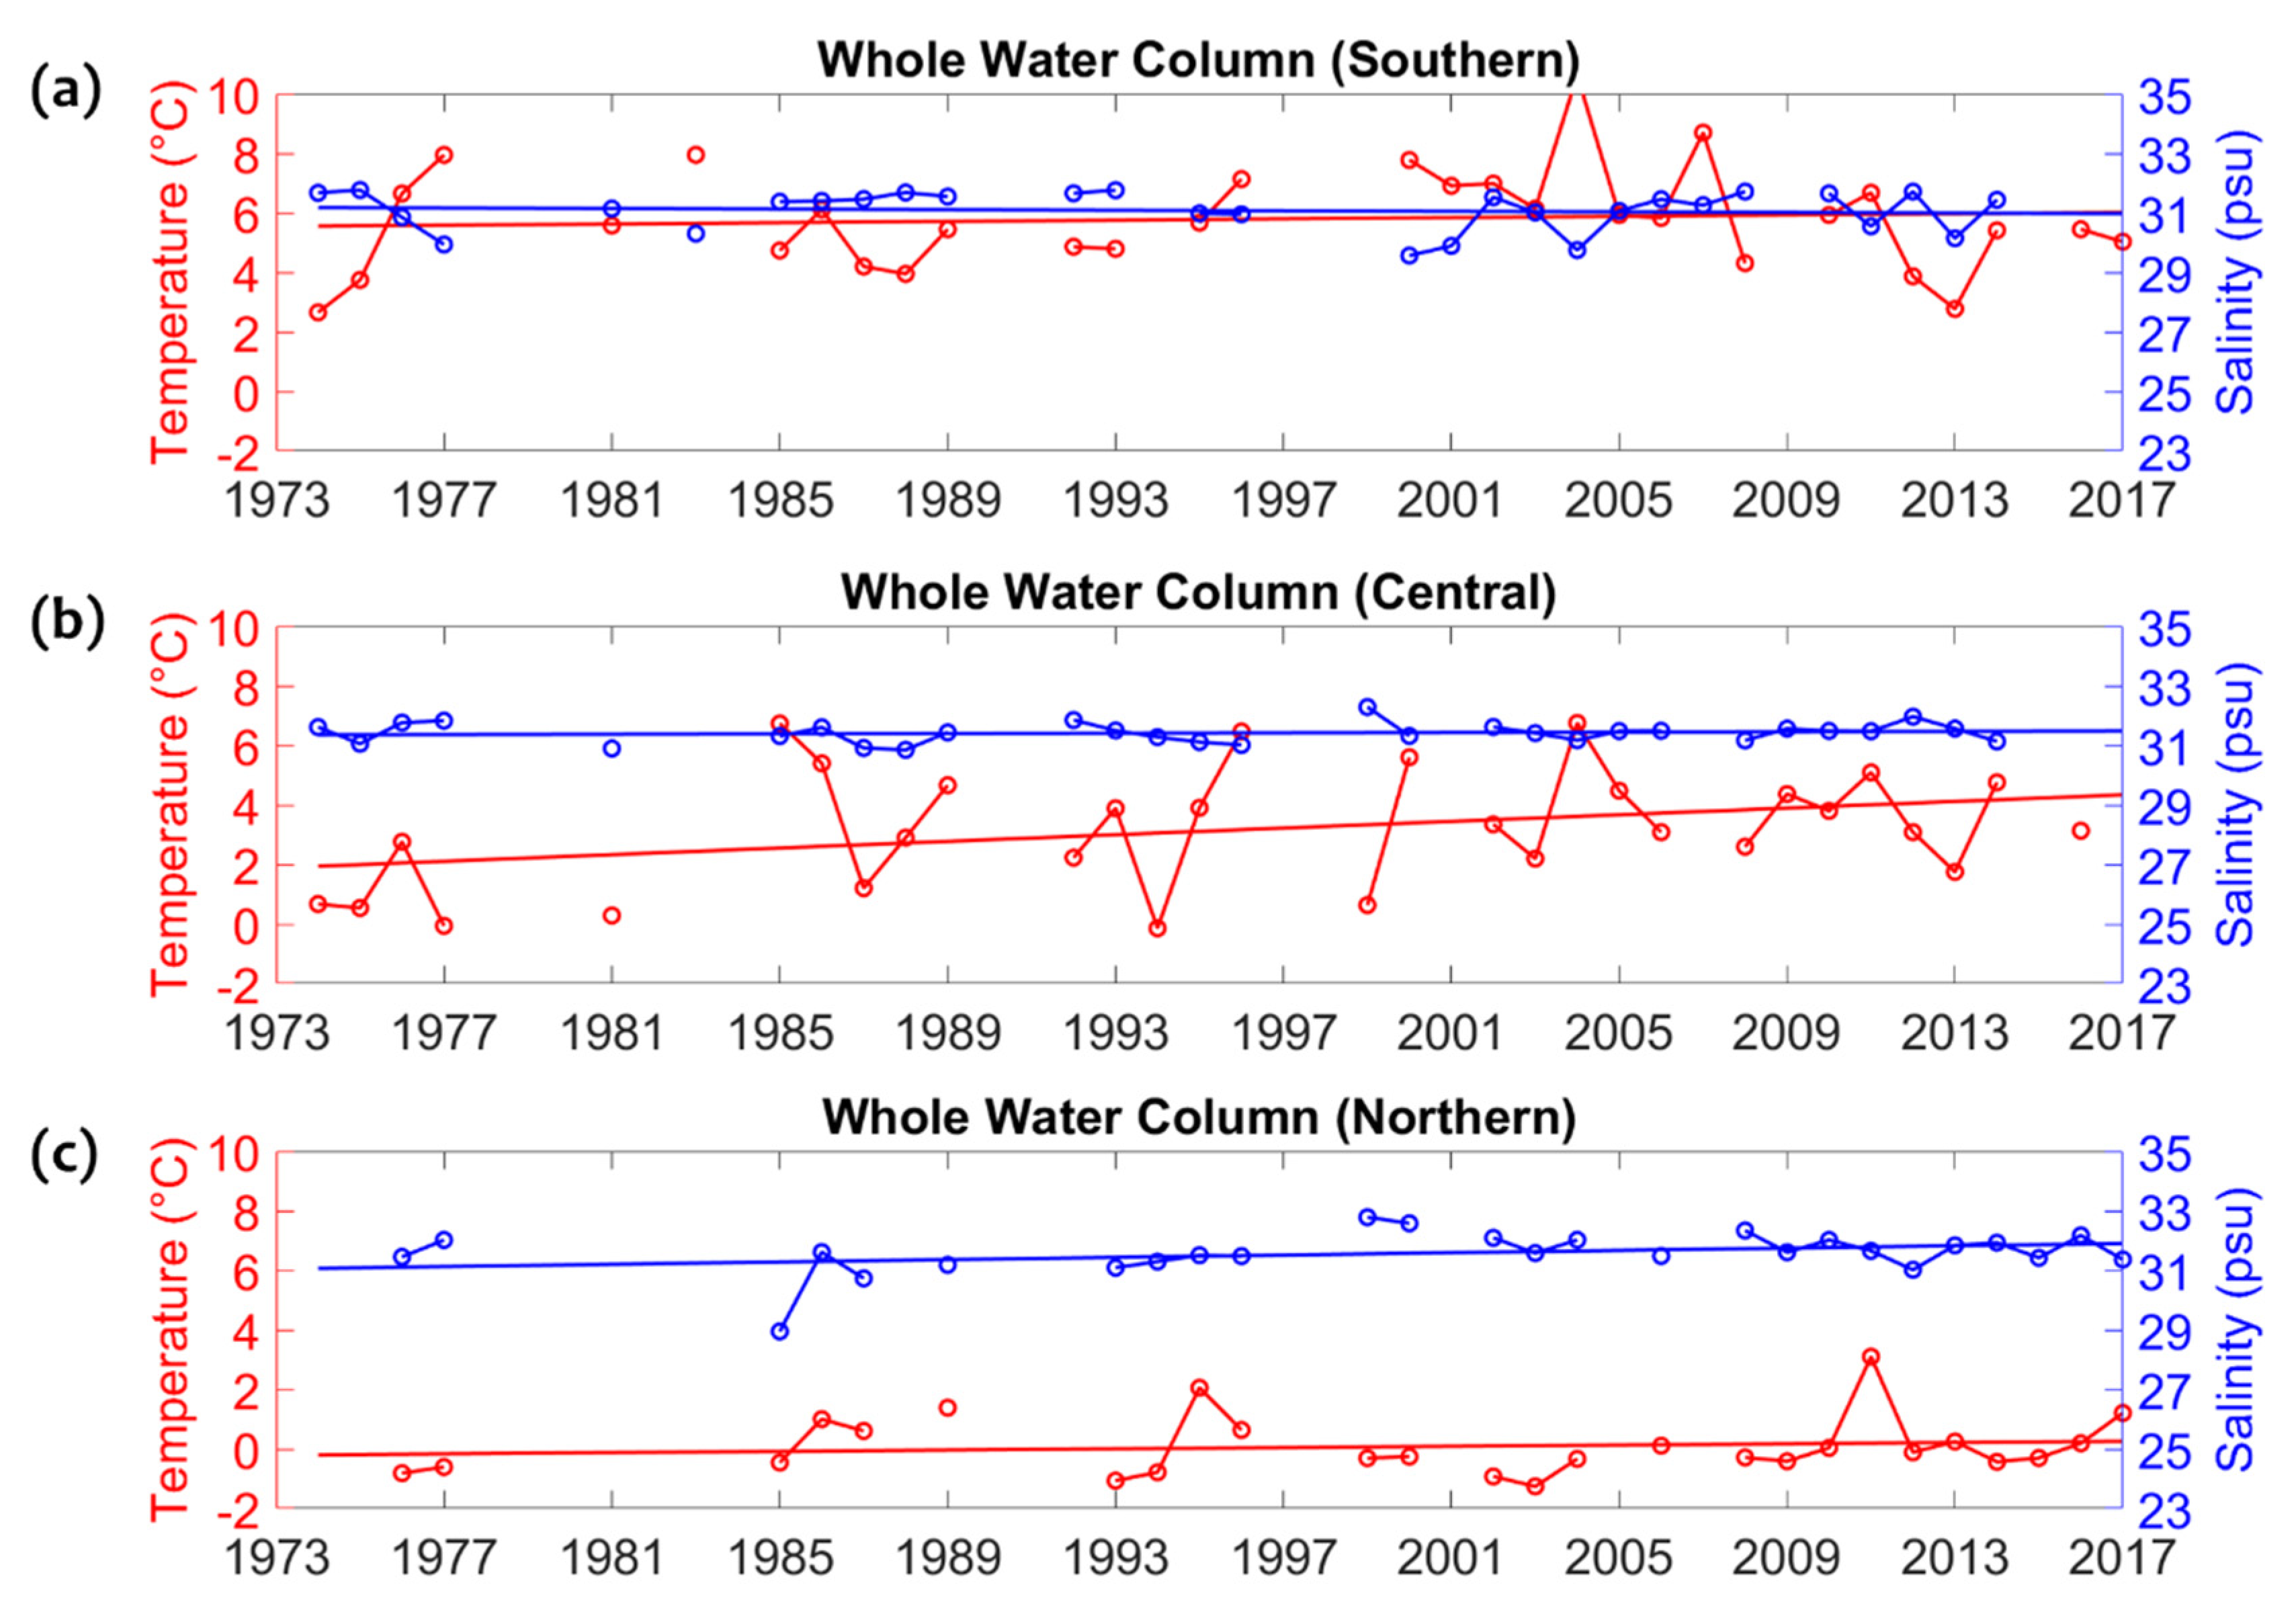
3.2. Temporal Changes in Temperature and Salinity
3.3. Oceanic Regime Shifts around 1997
3.3.1. Changes in Water Mass Characteristics
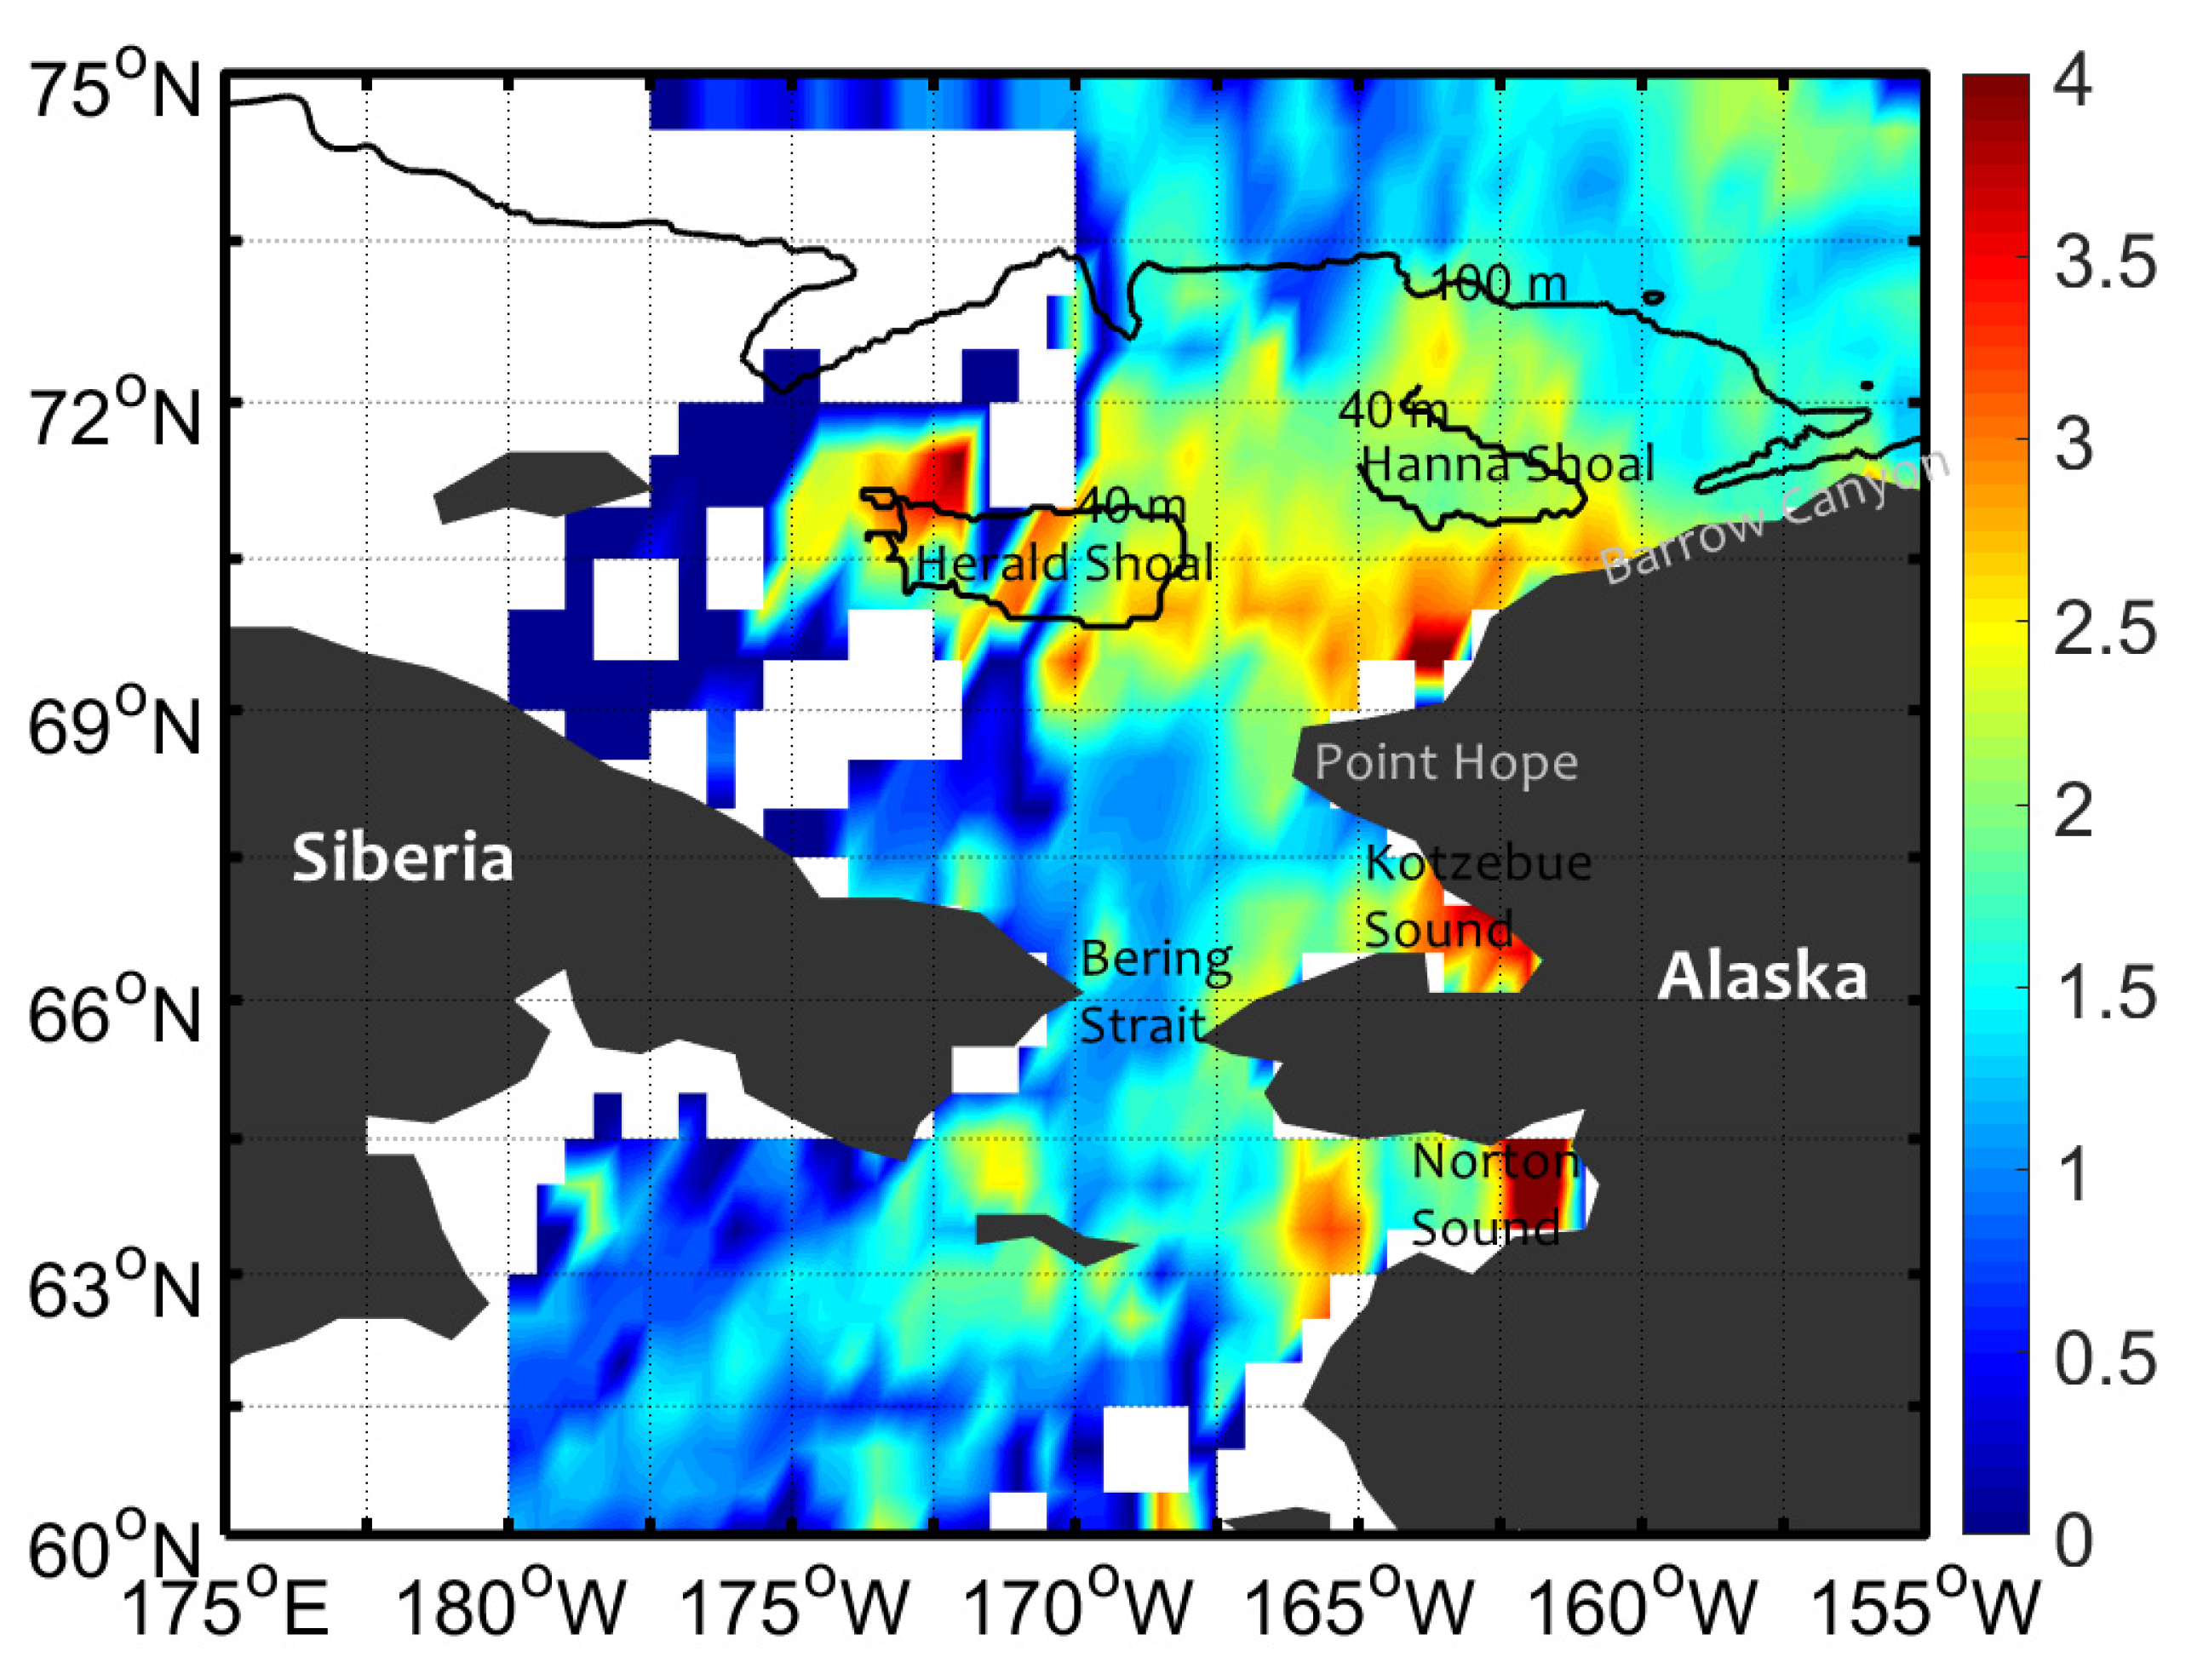
3.3.2. Changes in Summer Hydrography
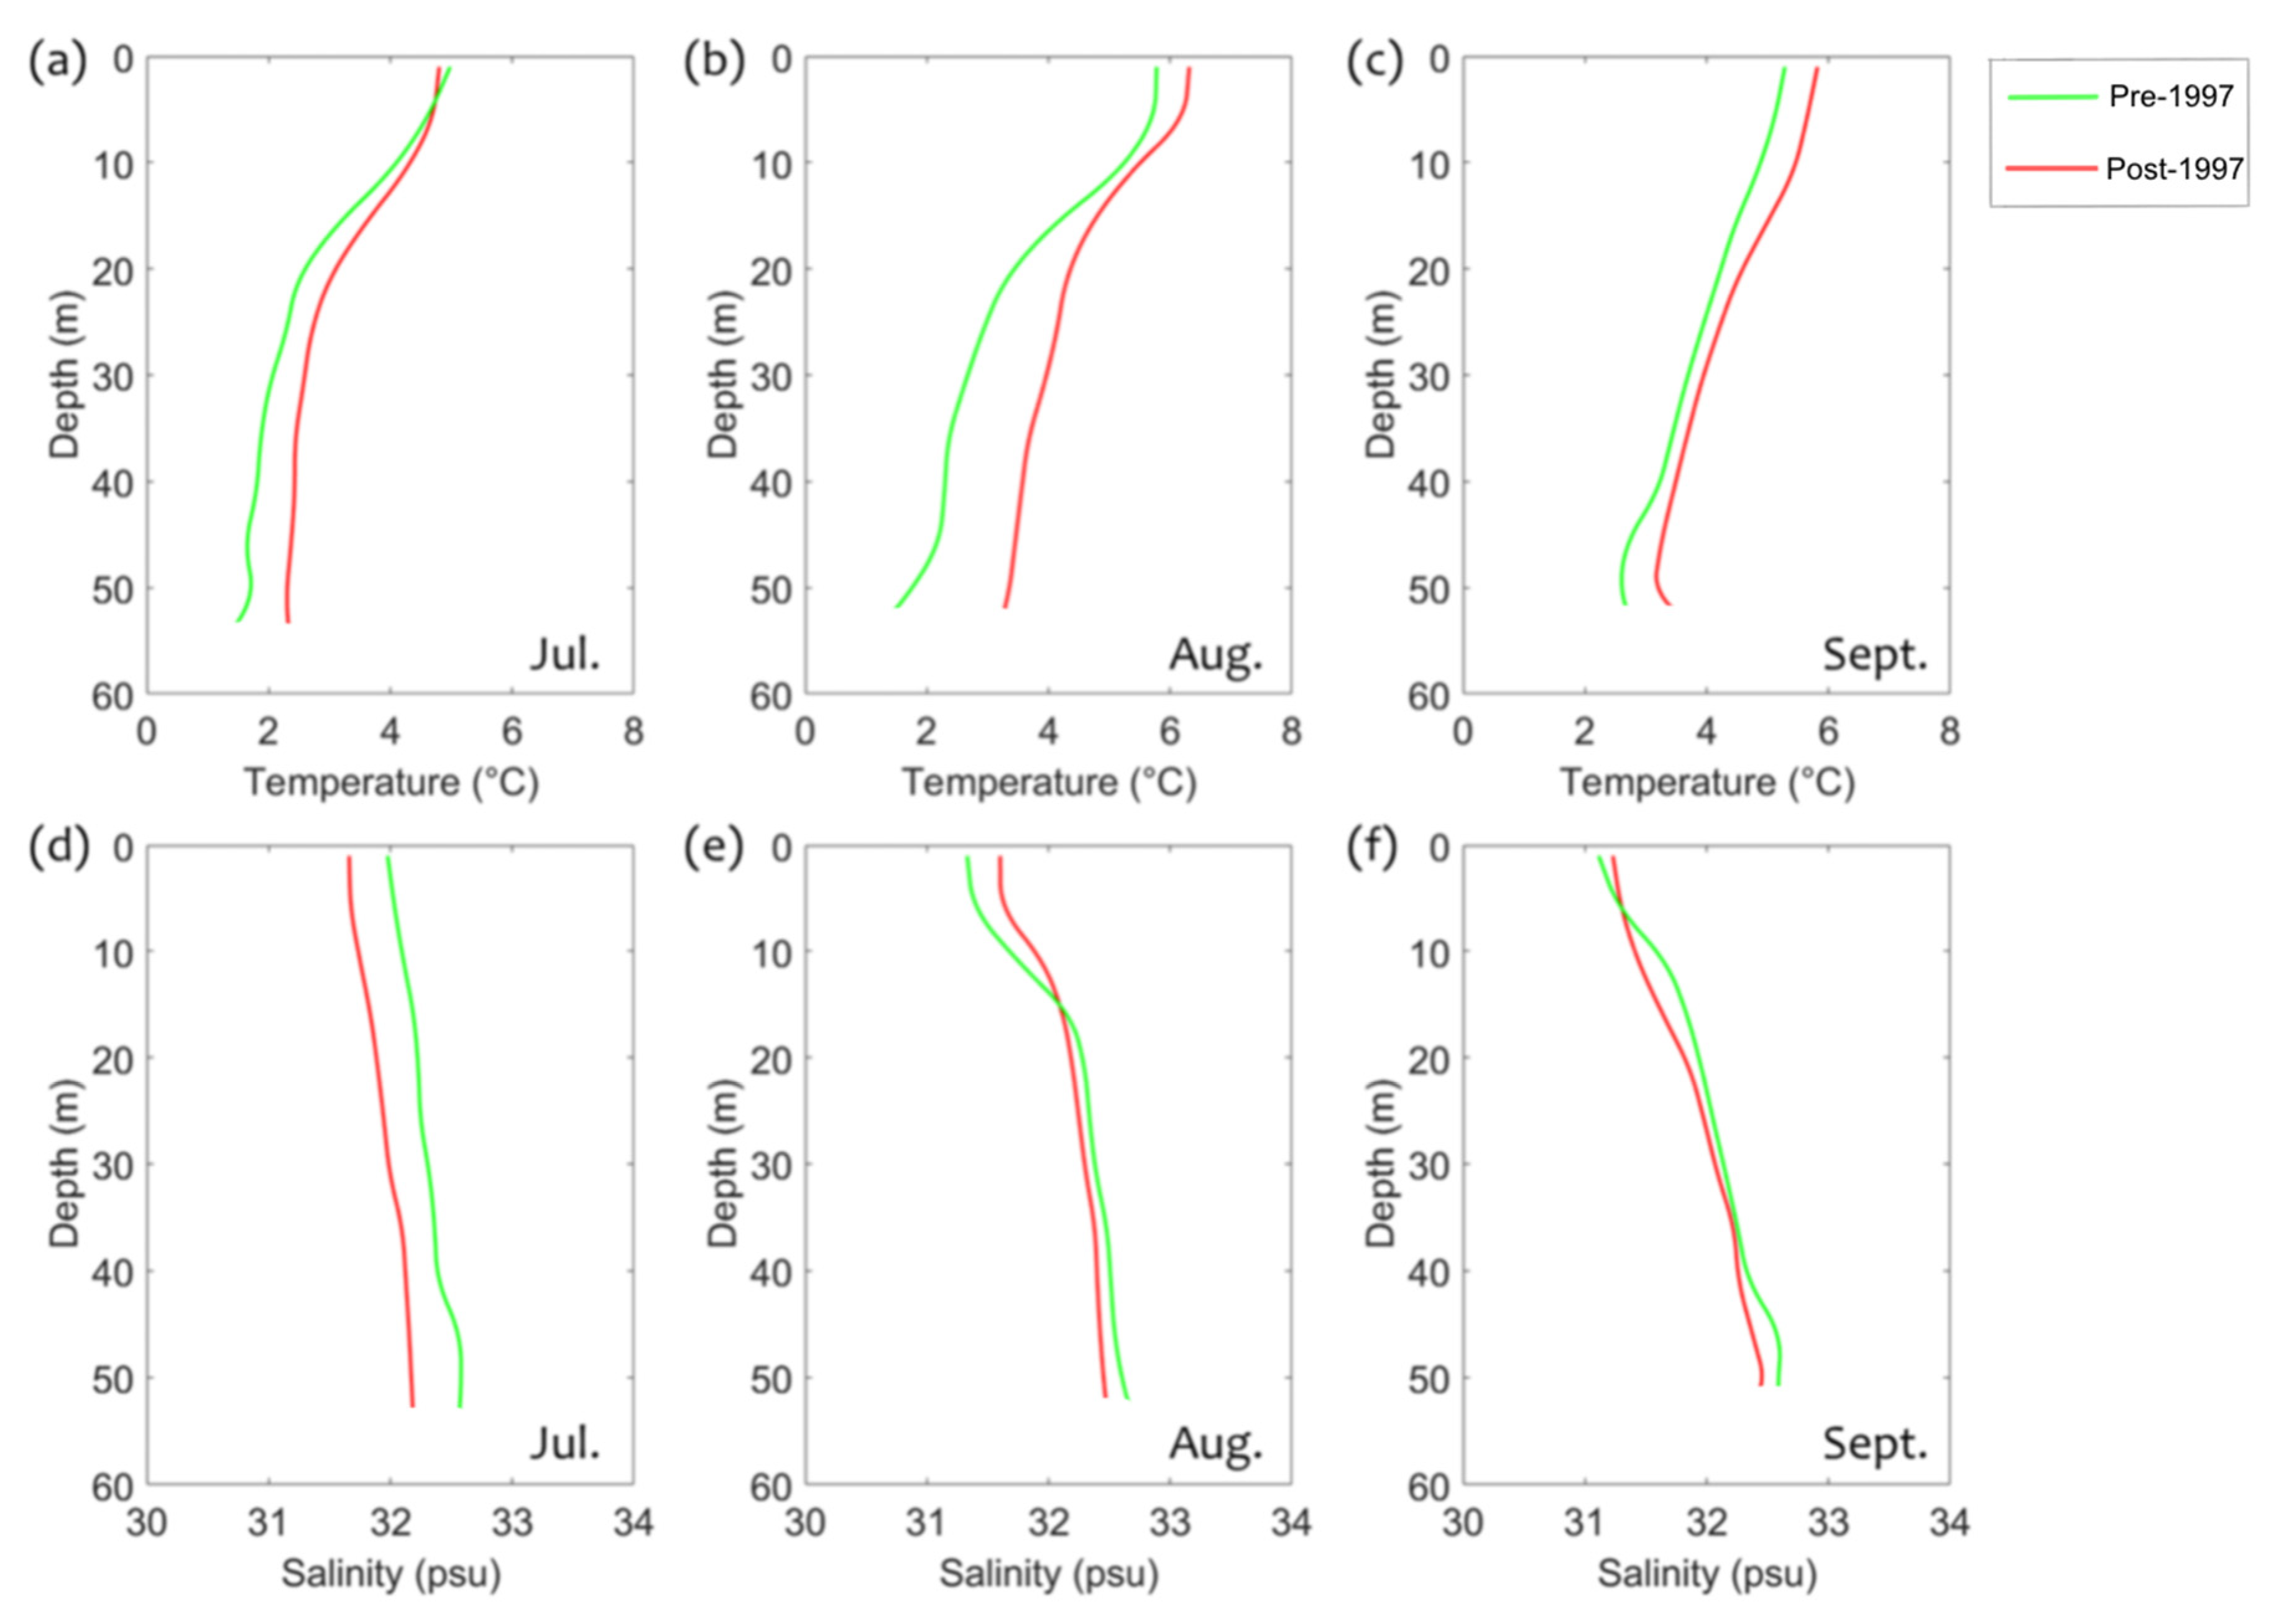
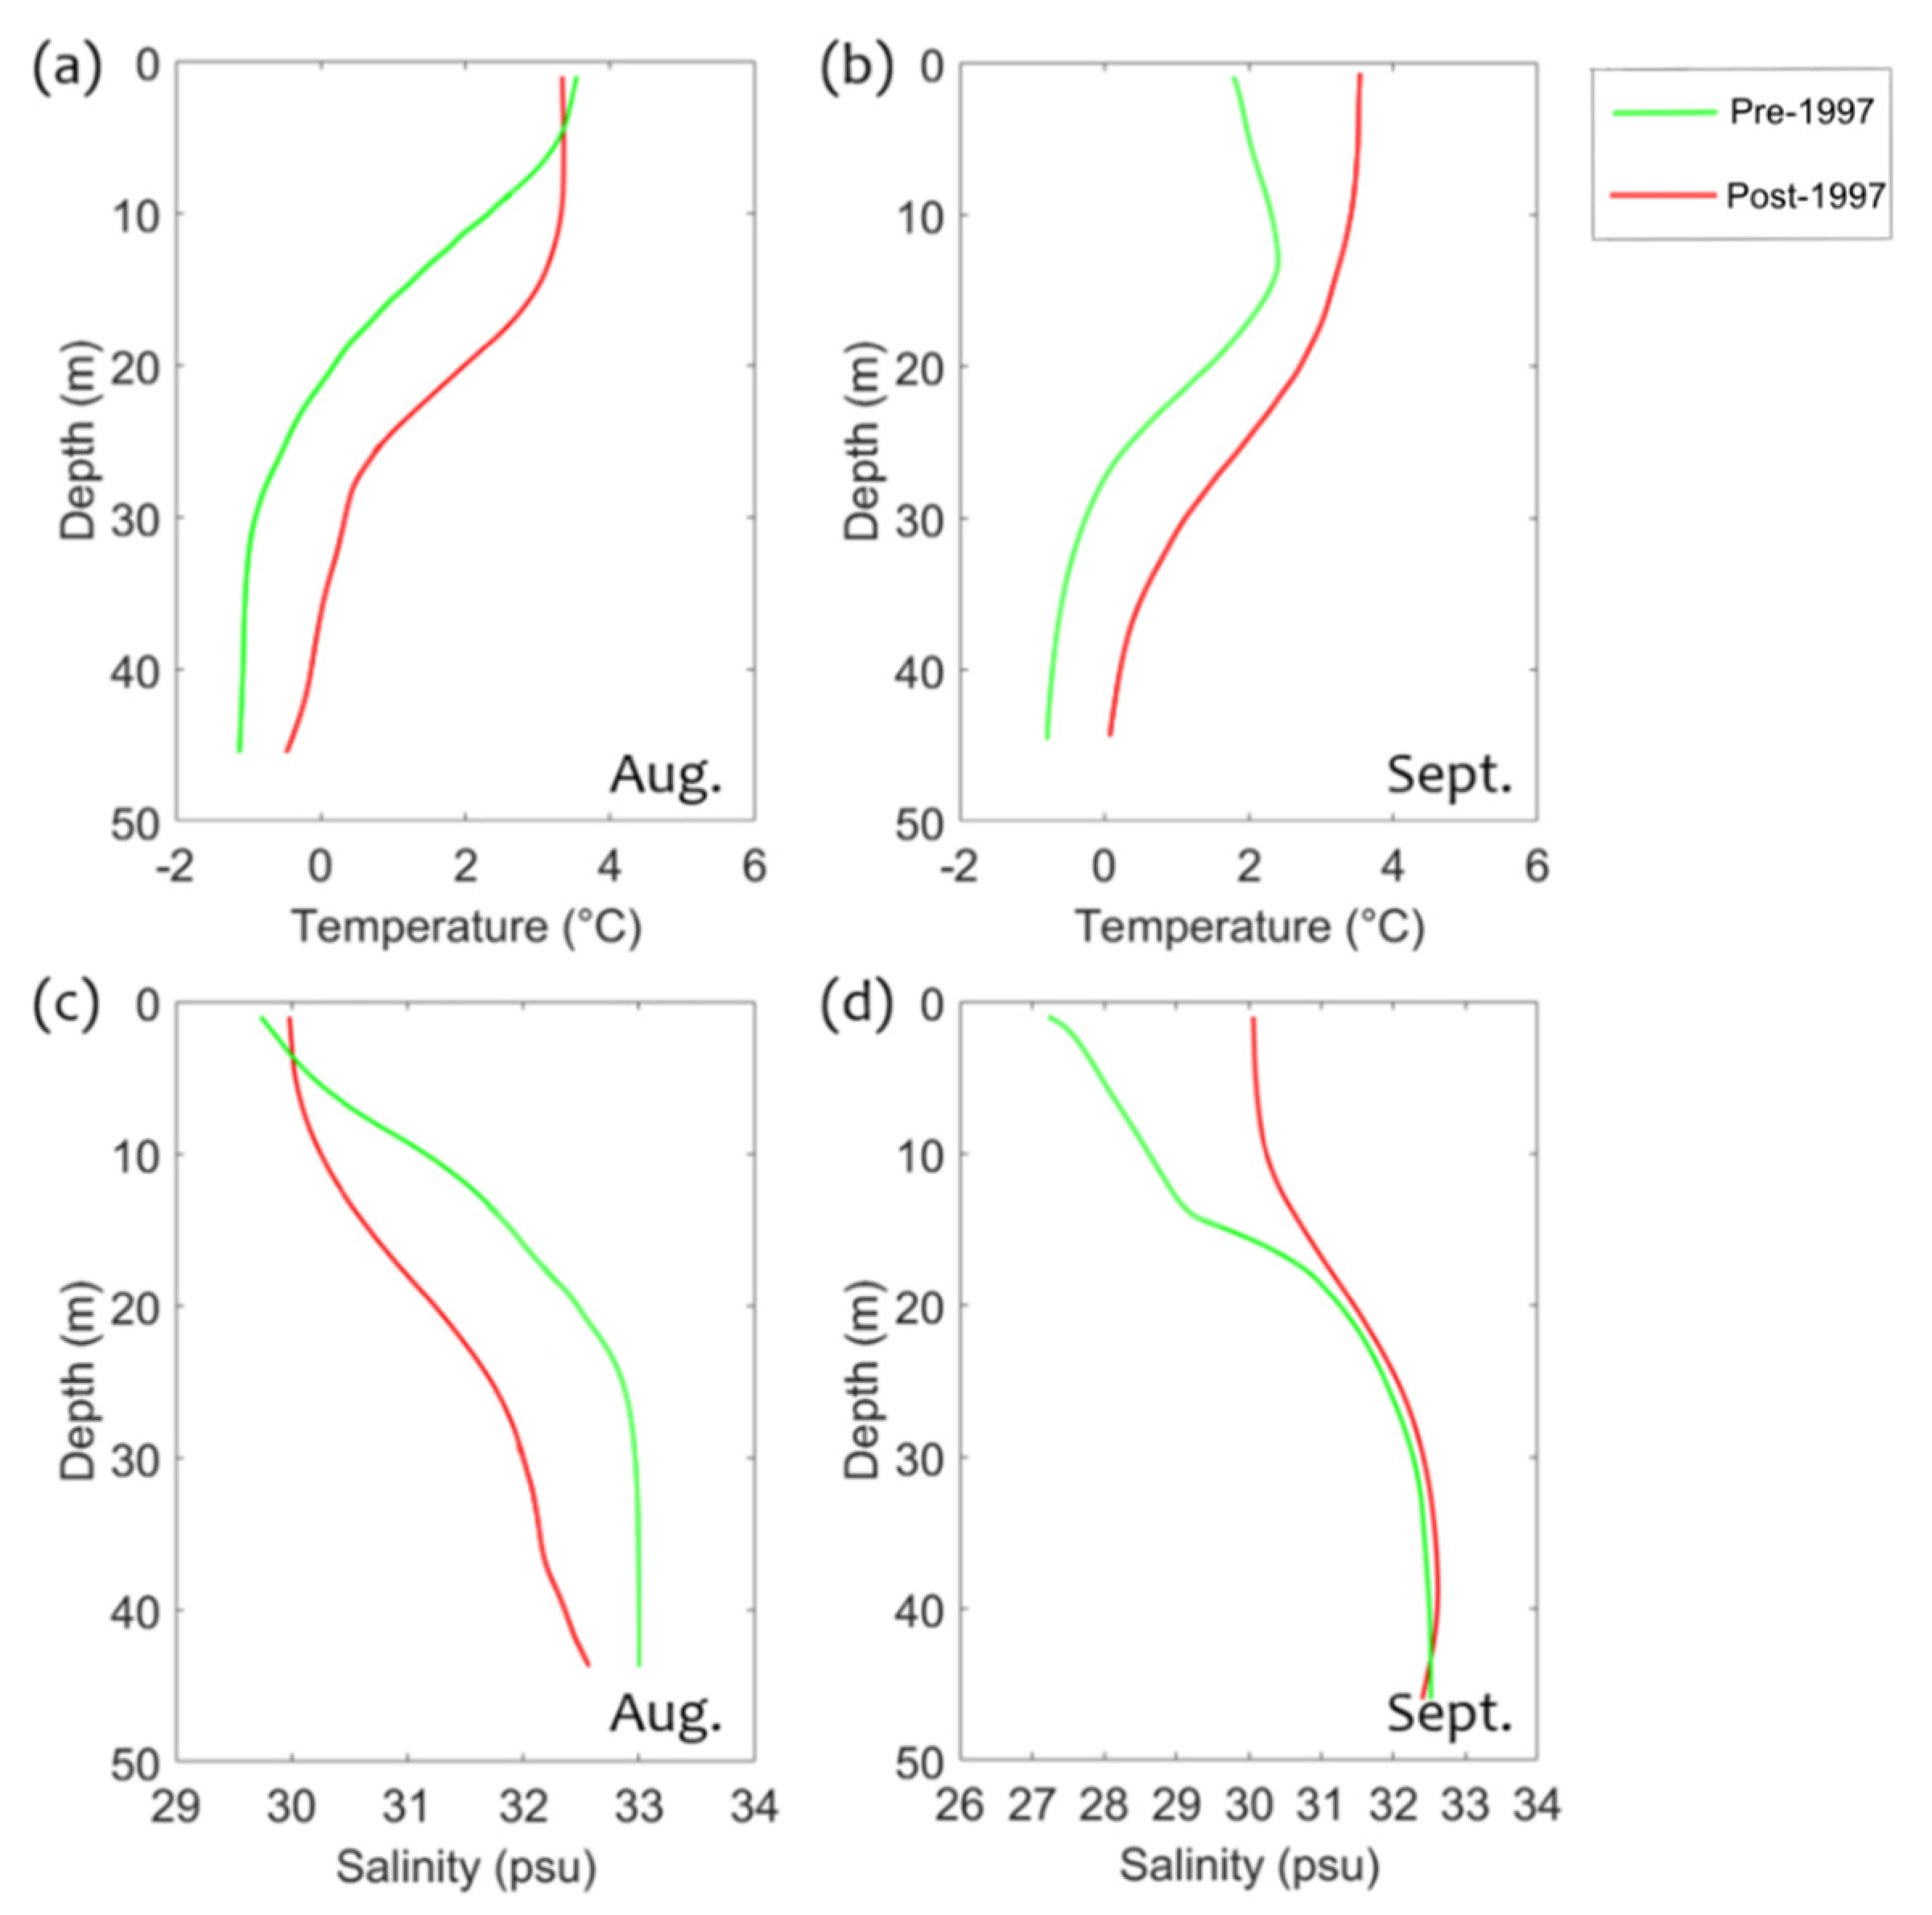
3.3.3. Changes in Vertical Thermohaline Structure
(1) Southern CS
(2) Central CS
(3) Northern CS
4. Discussion and Conclusions
Author Contributions
Funding
Acknowledgments
Conflicts of Interest
References
- Woodgate, R.A.; Aagaard, K.; Weingartner, T.J. Monthly temperature, salinity, and transport variability of the Bering Strait through inflow. Geophys. Res. Lett. 2005, 32, L04601. [Google Scholar] [CrossRef]
- Steele, M.; Morison, J.; Ermold, W.; Rigor, I.; Ortmeyer, M.; Shimada, K. Circulation of summer Pacific halocline water in the Arctic Ocean. J. Geophys. Res. 2004, 109, C02027. [Google Scholar] [CrossRef]
- Shimada, K.; Kamoshida, T.; Itoh, M.; Nishino, S.; Carmack, E.; McLaughlin, F.; Zimmermann, S.; Proshutinsky, A. Pacific Ocean inflow: Influence on catastrophic reduction of sea-ice cover in the Arctic Ocean. Geophys. Res. Lett. 2006, 33, 153–172. [Google Scholar] [CrossRef]
- Woodgate, R.A.; Weingartner, T.; Lindsay, R. The 2007 Bering Strait oceanic heat flux and anomalous Arctic sea-ice retreat. Geophys. Res. Lett. 2010, 37, L01602. [Google Scholar] [CrossRef]
- Spall, M.A.; Pickart, R.S.; Li, M.; Itoh, M.; Lin, P.; Kikuchi, T.; Qi, Y. Transport of Pacific water into the Canada Basin and the formation of the Chukchi Slope Current. J. Geophys. Res. Ocean. 2018, 123, 7453–7471. [Google Scholar] [CrossRef]
- Wang, J.; Zhang, J.; Watanabe, E.; Ikeda, M.; Mizobata, K.; Walsh, J.E.; Bai, X.; Wu, B. Is the Dipole Anomaly a major driver to record lows in Arctic summer sea ice extent? Geophys. Res. Lett. 2009, 36, 277–291. [Google Scholar] [CrossRef]
- Stroeve, J.C.; Maslanik, J.; Serreze, M.C.; Rigor, I.; Meier, W.; Fowler, C. Sea ice response to an extreme negative phase of the Arctic Oscillation during winter 2009/2010. Geophys. Res. Lett. 2011, 38, 79–89. [Google Scholar] [CrossRef]
- Springer, A.M.; McRoy, C.P. The paradox of pelagic food webs in the northern Bering Sea-III. Patterns of primary productivity. Cont. Shelf Res. 1993, 13, 575–599. [Google Scholar] [CrossRef]
- Hunt, G.L., Jr.; Blanchard, A.L.; Boveng, P.; Dalpadado, P.; Drinkwater, K.F.; Eisner, L.; Hopcroft, R.R.; Kovacs, K.M.; Norcross, B.L.; Renaud, P.; et al. The Barents and Chukchi Seas: Comparison of two Arctic shelf ecosystems. J. Mar. Syst. 2013, 109, 43–68. [Google Scholar] [CrossRef]
- Coachman, D.J.; Lawrence, K. Bering Strait: The Regional Physical Oceanography; University of Washington Press: Seattle, WA, USA, 1975. [Google Scholar]
- Shimada, K.; Carmack, E.C.; Hatakeyama, K.; Takizawa, T. Varieties of shallow temperature maximum waters in the western Canadian Basin of the Arctic Ocean. Geophys. Res. Lett. 2001, 28, 3441–3444. [Google Scholar] [CrossRef]
- Gong, D.; Pickart, R.S. Summertime circulation in the eastern Chukchi Sea. Deep. Sea Res. Part II Top. Stud. Oceanogr. 2015, 118, 18–31. [Google Scholar] [CrossRef]
- Pisareva, M. An overview of the recent research on the Chukchi Sea water masses and their circulation. Russ. J. Earth Sci. 2018, 18, 1–13. [Google Scholar] [CrossRef]
- Linders, J.; Pickart, R.; Björk, G.; Moore, G. On the nature and origin of water masses in Herald Canyon, Chukchi Sea: Synoptic surveys in summer 2004, 2008, and 2009. Prog. Oceanogr. 2017, 159, 99–114. [Google Scholar] [CrossRef]
- Aagaard, K.; Swift, J.; Carmack, E.C. Thermohaline circulation in the Arctic Mediterranean Seas. J. Geophys. Res. Space Phys. 1985, 90, 4833. [Google Scholar] [CrossRef]
- Newton, J.L.; Sotirin, B.J. Boundary undercurrent and water mass changes in the Lincoln Sea. J. Geophys. Res. Space Phys. 1997, 102, 3393–3403. [Google Scholar] [CrossRef]
- Perovich, D.K.; Light, B.; Eicken, H.; Jones, K.F.; Runciman, K.; Nghiem, S. Increasing solar heating of the Arctic Ocean and adjacent seas, 1979–2005: Attribution and role in the ice-albedo feedback. Geophys. Res. Lett. 2007, 34, L19505. [Google Scholar] [CrossRef]
- Comiso, J.C.; Parkinson, C.L.; Gersten, R.; Stock, L. Accelerated decline in the Arctic sea ice cover. Geophys. Res. Lett. 2008, 35. [Google Scholar] [CrossRef]
- Stroeve, J.C.; Serreze, M.C.; Holland, M.M.; Kay, J.E.; Malanik, J.; Barrett, A.P. The Arctic’s rapidly shrinking sea ice cover: A research synthesis. Clim. Chang. 2012, 110, 1005–1027. [Google Scholar] [CrossRef]
- Woodgate, R.; Aagaard, K.; Weingartner, T.J. Interannual changes in the Bering Strait fluxes of volume, heat and freshwater between 1991 and 2004. Geophys. Res. Lett. 2006, 33, L15609. [Google Scholar] [CrossRef]
- Timmermans, M.-L. The impact of stored solar heat on Arctic sea ice growth. Geophys. Res. Lett. 2015, 42, 6399–6406. [Google Scholar] [CrossRef]
- Steele, M.; Zhang, J.; Ermold, W. Mechanisms of summertime upper Arctic Ocean warming and the effect on sea ice melt. J. Geophys. Res. Space Phys. 2010, 115, C11004. [Google Scholar] [CrossRef]
- Screen, J.; Simmonds, I. The central role of diminishing sea ice in recent Arctic temperature amplification. Nature 2010, 464, 1334–1337. [Google Scholar] [CrossRef] [PubMed]
- Cohen, J.; Screen, J.A.; Furtado, J.C.; Barlow, M.; Whittleston, D.; Coumou, D.; Francis, J.; Dethloff, K.; Entekhabi, D.; Overland, J.; et al. Recent Arctic amplification and extreme mid-latitude weather. Nat. Geosci. 2014, 7, 627–637. [Google Scholar] [CrossRef]
- Steele, M.; Ermold, W.; Zhang, J. L Arctic Ocean surface warming trends over the past 100 years. Geophys. Res. Lett. 2008, 35, L02614. [Google Scholar] [CrossRef]
- Bai, X.; Hu, H.; Wang, J.; Yu, Y.; Cassano, E.; Maslanik, J. Responses of surface heat flux, sea ice, and ocean dynamics in the Chukchi-Beaufort Sea o storm passages during winter 2006/2007: A numerical study. Deep Sea Res. I 2015, 102, 101–117. [Google Scholar] [CrossRef]
- Boyer, T.P.; Antonov, J.I.; Baranova, O.K.; Coleman, C.; Garcia, H.E.; Grodsky, A.; Johnson, D.R.; Locarnini, R.A.; Mishonov, A.V.; O’Brien, T.D.; et al. World Ocean Database 2013; Levitus, S., Mishonov, A., Eds.; NOAA Atlas NESDIS: Silver Spring, MD, USA, 2013; Volume 209, pp. 29–30.
- Von Appen, W.; Pickart, R.S. Two Configurations of the Western Arctic Shelfbreak Current in Summer. J. Phys. Oceanogr. 2012, 42, 329–351. [Google Scholar] [CrossRef]
- Martin, S.; Drucker, R. The effect of possible Taylor columns on the summer ice retreat in the Chukchi Sea. J. Geophys. Res. Space Phys. 1997, 102, 10473–10482. [Google Scholar] [CrossRef]
- Ahlnäs, K.; Garrison, G.R. Satellite and oceanographic observations of the warm coastal current in the Chukchi Sea. Arctic 1984, 37, 244–254. [Google Scholar] [CrossRef][Green Version]
- Overland, J.E.; Roach, A.T. Northward flow in the Bering and Chukchi seas. J. Geophys. Res. Space Phys. 1987, 92, 7097. [Google Scholar] [CrossRef]
- Corlett, W.B.; Pickart, R.S. The Chukchi slope current. Prog. Oceanogr. 2017, 153, 50–65. [Google Scholar] [CrossRef]
- Itoh, M.; Shimada, K.; Kamoshida, T.; McLaughlin, F.; Carmack, E.; Nishino, S. Interannual variability of Pacific Winter Water inflow through Barrow Canyon from 2000 to 2006. J. Oceanogr. 2012, 68, 575–592. [Google Scholar] [CrossRef]
- Chu, P.C.; Wang, Q.; Bourke, R.H. A Geometric Model for the Beaufort/Chukchi Sea Thermohaline Structure. J. Atmos. Ocean. Technol. 1999, 16, 613–632. [Google Scholar] [CrossRef]
- Liang, M.; Shi, J. Variations in coastal polynyas in the Alaskan Chukchi Sea and major influencing factors. Chin. J. Polar Res. 2015, 27, 379–391. [Google Scholar] [CrossRef]
- Spear, A.; Duffy-Anderson, J.; Kimmel, D.; Napp, J.; Randall, J.; Stabeno, P. Physical and biological drivers of zooplankton communities in the Chukchi Sea. Polar Biol. 2019, 42, 1107–1124. [Google Scholar] [CrossRef]
- Woodgate, R.A. Increases in the Pacific inflow to the Arctic from 1990 to 2015, and insights into seasonal trends and driving mechanisms from year-round Bering Strait mooring data. Prog. Oceanogr 2018, 160, 124–154. [Google Scholar] [CrossRef]
- Wang, Y.; Luo, X.; Zhang, Y.; Qin, Y.; Zhao, W.; Zheng, Z.; Nie, H.; Wei, H. Heat budget analysis during the ice-melting season in the Chukchi Sea based on a model simulation. Chin. Sci. Bull. 2019, 64, 3485–3497. [Google Scholar]


| Southern | Central | Northern | |
|---|---|---|---|
| Whole Water Column | |||
| T | 0.0107 (0.6609) | 0.0558 (0.0476) | 0.0106 (0.5354) |
| S | −0.0047 (0.6533) | 0.0030 (0.5751) | 0.0194 (0.1053) |
| Surface | |||
| T | 0.0135 (0.5253) | 0.0668 (0.0254) | 0.0340 (0.1319) |
| S | 0.0049 (0.6268) | 0.0229 (0.0140) | 0.0355 (0.1549) |
| Bottom | |||
| T | 0.0313 (0.1935) | 0.0356 (0.2324) | 0.0152 (0.1590) |
| S | −0.0204 (0.0483) | −0.0156 (0.0129) | −0.0045 (0.5036) |
© 2020 by the authors. Licensee MDPI, Basel, Switzerland. This article is an open access article distributed under the terms and conditions of the Creative Commons Attribution (CC BY) license (http://creativecommons.org/licenses/by/4.0/).
Share and Cite
Yang, Y.; Bai, X. Summer Changes in Water Mass Characteristics and Vertical Thermohaline Structure in the Eastern Chukchi Sea, 1974–2017. Water 2020, 12, 1434. https://doi.org/10.3390/w12051434
Yang Y, Bai X. Summer Changes in Water Mass Characteristics and Vertical Thermohaline Structure in the Eastern Chukchi Sea, 1974–2017. Water. 2020; 12(5):1434. https://doi.org/10.3390/w12051434
Chicago/Turabian StyleYang, Yayu, and Xuezhi Bai. 2020. "Summer Changes in Water Mass Characteristics and Vertical Thermohaline Structure in the Eastern Chukchi Sea, 1974–2017" Water 12, no. 5: 1434. https://doi.org/10.3390/w12051434
APA StyleYang, Y., & Bai, X. (2020). Summer Changes in Water Mass Characteristics and Vertical Thermohaline Structure in the Eastern Chukchi Sea, 1974–2017. Water, 12(5), 1434. https://doi.org/10.3390/w12051434