Article

Health Evaluation and Risk Factor Identification of Urban Lakes—A Case Study of Lianshi Lake

1
Department of Water Ecological Environment, China Institute of Water Resources and Hydropower Research, Beijing 100038, China
2
College of Bohai, Hebei Agricultural University, Huanghua 061100, China
3
State Key Laboratory of Simulation and Regulation of River Basin Water Cycle, China Institute of Water Resources and Hydropower Research, Beijing 100038, China
4
Appraisal Center for Environment and Engineering, Ministry of Environmental Protection, Beijing 100012, China
*
Author to whom correspondence should be addressed.
Water 2020, 12(5), 1428; https://doi.org/10.3390/w12051428
Submission received: 25 April 2020 / Revised: 13 May 2020 / Accepted: 15 May 2020 / Published: 17 May 2020

Abstract

:
Health assessment and risk factor identification represent the premise and foundation of scientific management and ecological restoration of urban lakes. Based on in-depth understanding of the nature–society duality of urban lakes, a framework for evaluating urban lake health was constructed, including four modules, namely, establishing an index system; determining the index weight; identifying risk factors; and a comprehensive lake health evaluation. Employing this framework, we evaluated Lianshi Lake, Beijing, classifying the lake condition as “sub-healthy”. Based on the evaluation data, we identified the health risk factors of the lake. We applied standard difference rate (SDR) and risk degree (Rd) (safe degree (Sd)) concepts, and classified the indices of risk areas employing the Pareto analysis method. Finally, we identified the lake residence period, landscape connectivity, and eutrophication as the major risk factors in Lianshi Lake. Three factors constitute the basis of ecosystem health and are key targets of ecological restoration: the lake residence period represents the hydrological and hydrodynamic characteristics of the lake; landscape connectivity is described from an ecological perspective, and represents the integrity of the lake ecosystem; and the eutrophication states describe the water quality characteristics and represent the availability of lake water. The results contribute to decision-making for comprehensive urban lake management.

1. Introduction

Lake ecosystems have various service functions, including natural resources and living environments for people [1,2]. However, unprecedented increases in the urban population worldwide have accelerated and intensified the degradation of urban lake water ecosystems [3]. Accordingly, the ecological health of lakes has attracted the attention of local [4,5,6] and international experts because of the important implications for both natural and social systems [7,8].
Lake health assessment can advance our understanding of the health status of lakes and contribute to strengthening the protection and management of lakes. The key to evaluating the health status of lakes is to select the most appropriate evaluation method [9,10,11]. Initially, ecosystem health was assessed using specific species as indicators; however, these single indicators were found to be very limited in terms of ecosystem integrity [12]. Since the 1980s, a series of indicators and methods for the comprehensive health assessment of lake ecosystems has been proposed in order to improve our understanding of the health status of lakes.
A number of holistic indicators have been proposed and discussed in the literature, including the gross ecosystem product (GEP) proposed by Hannon [13]; the index of biotic integrity (IBI) proposed by Karr et al. [14]; ecosystem risk indicators proposed by Rapport et al. [15]; the index of network ascendancy proposed by Ulanowicz et al. [16]; overall system health index proposed by Costanza et al. [17]; and eco-exergy, structural eco-exergy, and buffer capacity proposed by Jørgensen et al. [18,19]. However, a single indicator can only represent a certain aspect of the health status. For the health evaluation of the whole lake, it is necessary to couple multiple indices for a simultaneous comprehensive evaluation.
Several comprehensive evaluation methods and models have been proposed in recent years. Xu et al. [20,21] proposed a series of comprehensive ecological evaluation indices, and two methods—the ecological modelling method (EMM) and direct measurement method (DMM)—were applied for the evaluation of Chaohu Lake, southeast China. The ecosystem health index methodology (EHIM) proposed by Xu et al. [22] was applied to the evaluation of 30 Italian lakes. Zeng et al. [23] established an energy-based comprehensive evaluation index system and conducted a spatial–temporal health evaluation of Baiyangdian Lake, north China. Xu et al. [24] suggested that eco-energy and structural eco-energy are robust indicators for evaluating the ecosystem health of vegetation-dominated lakes, and carried out a health evaluation of Baiyangdian Lake. Petesse et al. [25] conducted a study on the selection of reference lakes and investigated the adaptability of the multi-metric index of fish biological integrity in six lakes of the Amazon floodplains.
Nevertheless, these evaluation systems have been mainly applied to natural lakes, resulting in a lack of research on evaluation indices and systems applicable to urban lakes. The selection of evaluation parameters and indicators for natural lakes often ignores social factors. Therefore, in the case of urban lakes, with their attendant nature–society duality, the suitability of such parameters and indicators is poor [26].
To comprehensively evaluate the health level of urban lakes from both natural and social perspectives, it is necessary to develop evaluation models and methods that conform to both social needs and ecosystem integrity [27]. Such models and methods can be used to evaluate the health of urban lakes and, as the risk factors affecting lake health are identified locally, a basis can be constructed for the establishment of urban lake development and management strategies.
In view of the above, our study proposes an evaluation framework that meets the health concept of urban lakes and reflects both the integrity of the ecosystem and the social needs of people. This concept of duality (nature and society) is reflected in the entire evaluation process which has the following characteristics: (1) Overall optimization of system indices, which include natural and social indices, with the index group optimized according to the category of the urban lake; (2) the weight of the index’s influence, with index weights employed to quantify the importance of factors in the entire ecosystem; and (3) the precision of risk factor identification, i.e., accurate determination of the risk factors that influence the health of a lake, based on the lake ecosystem health assessment.
The purpose of this study was to develop a framework model for lake health evaluation, taking into account the nature–society duality of urban lakes and establish evaluation criteria for different types of urban lakes.

2. Materials and Methods
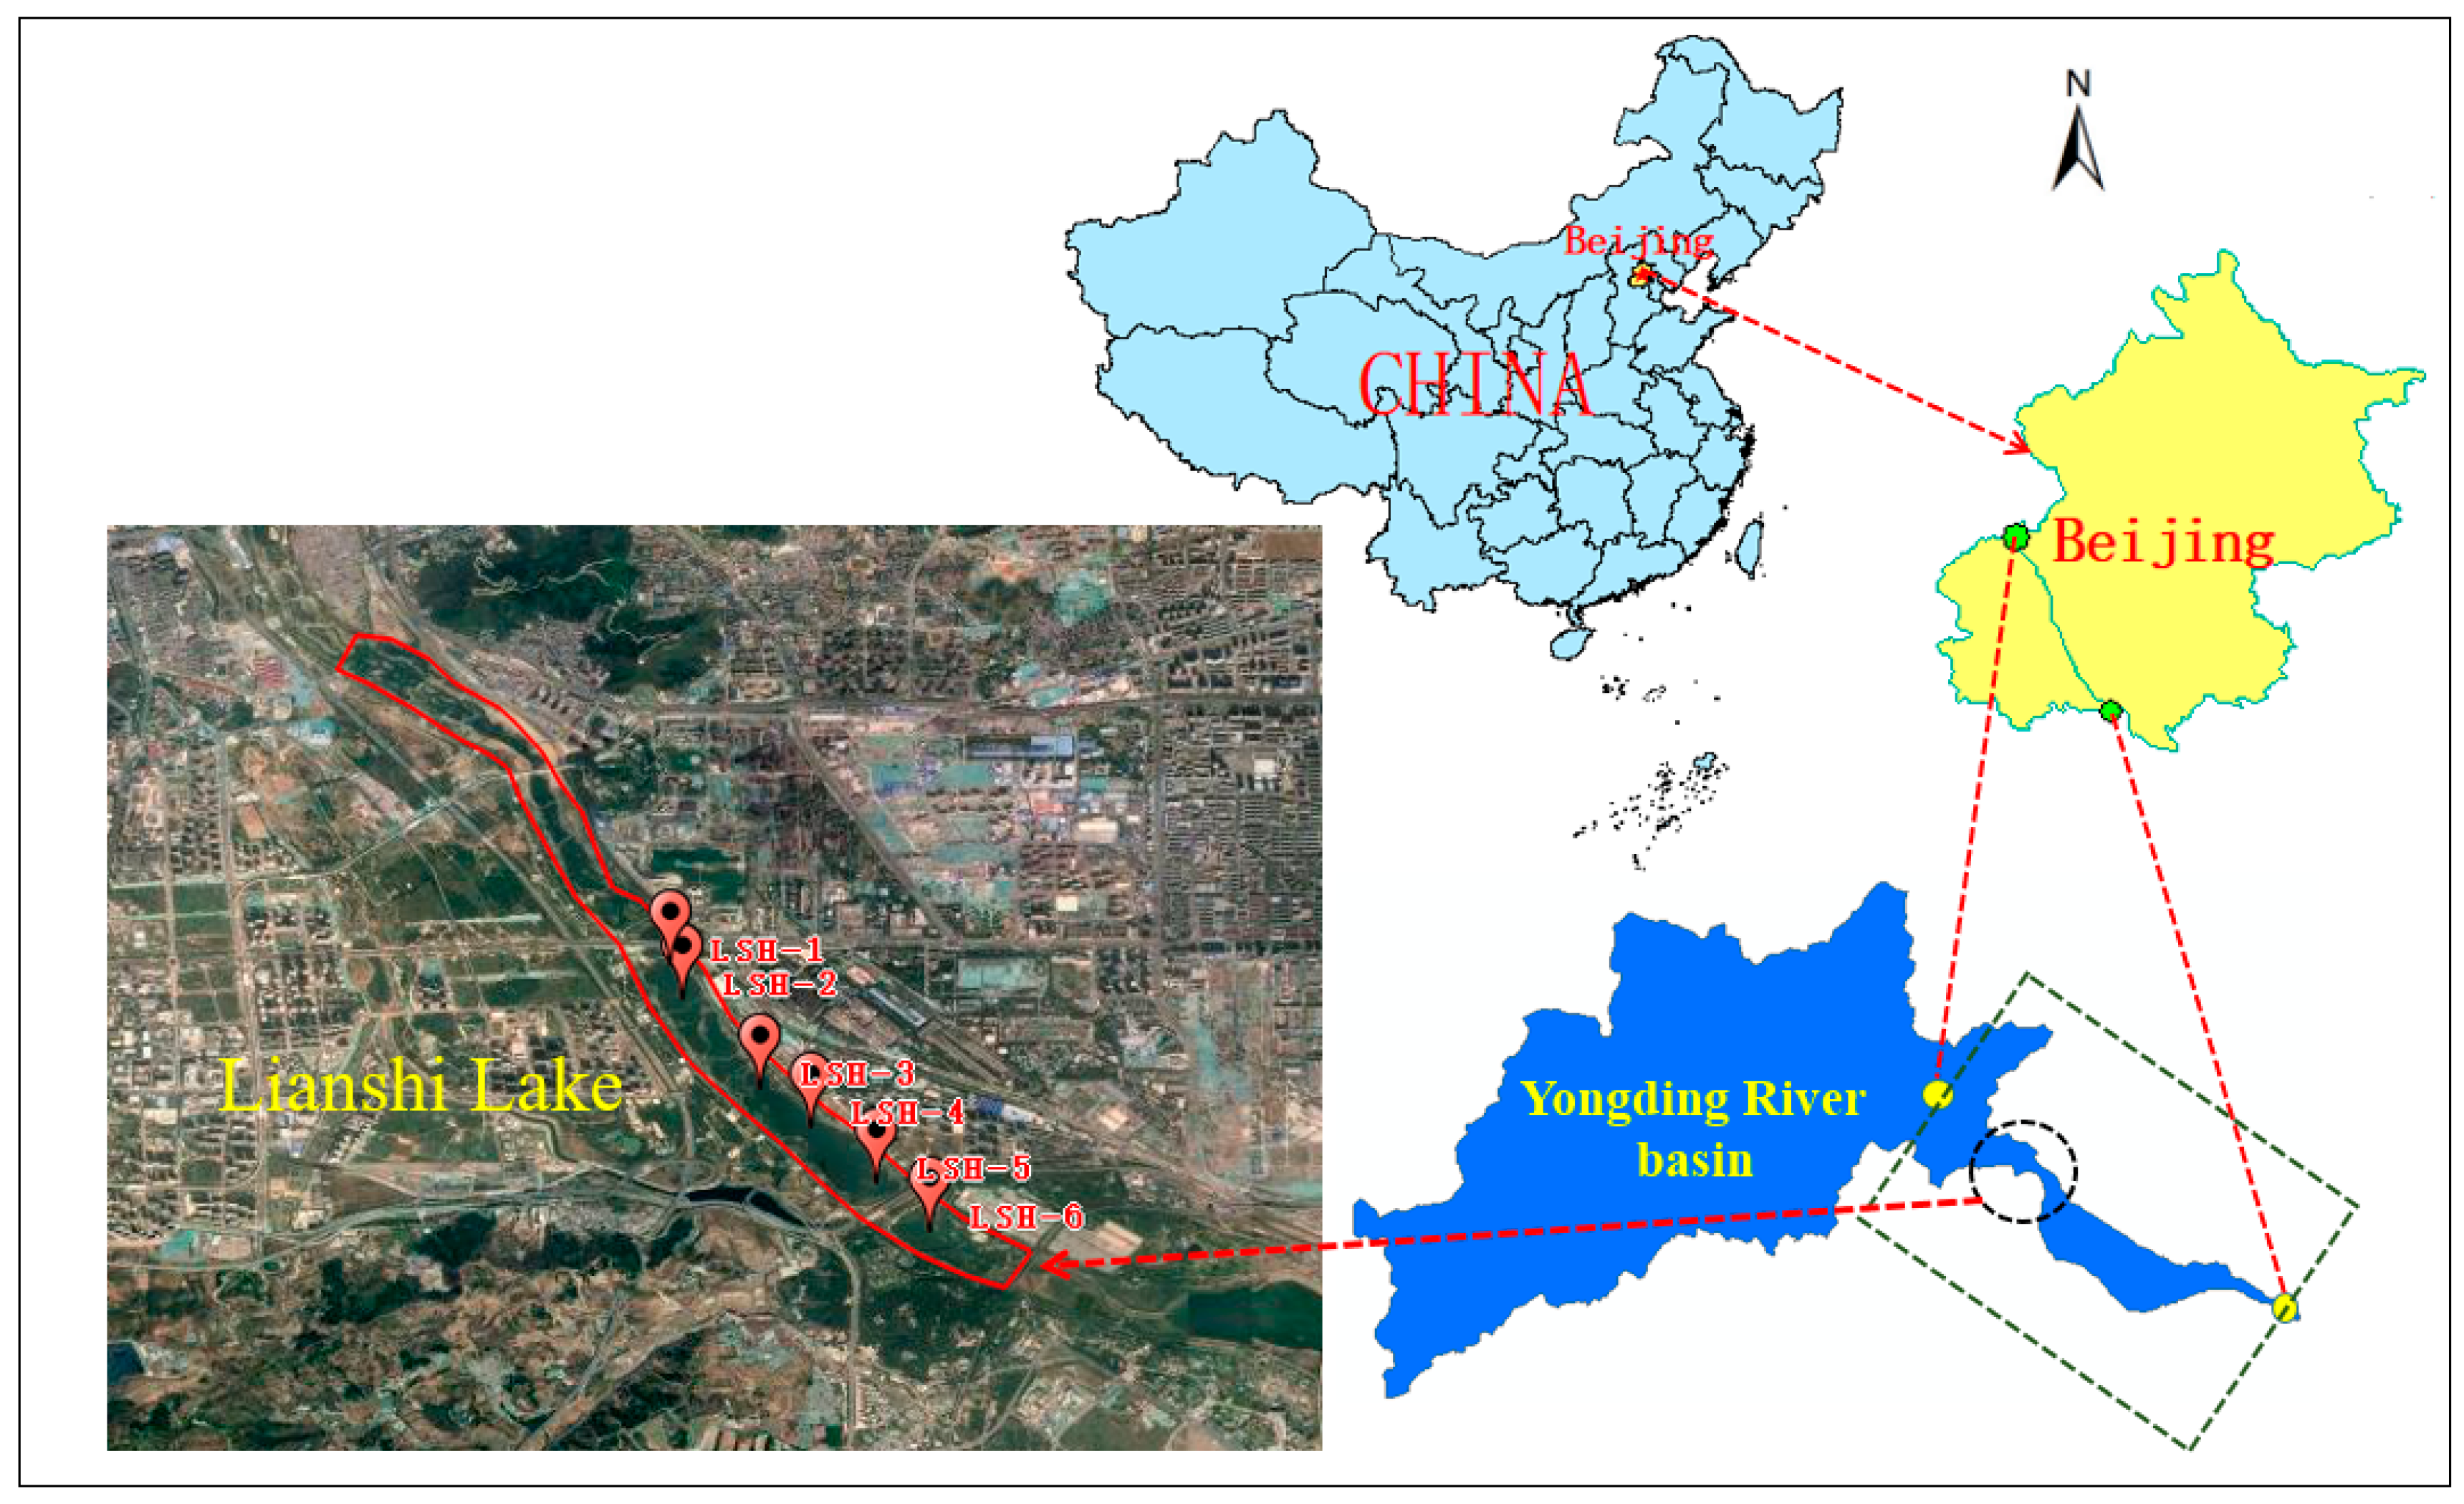
2.1. Study Region

The Yongding River is one of the four major flood control rivers in China. It is the largest river in the Haihe River system, occupying a total area of 47,000 km2 (Figure 1). The river basin in Beijing covers an area of approximately 3200 km2, and the Beijing section of the river is 170 km long. This river has been mainly used as a flood channel in Beijing, and the ecological conservation and urban landscape of the river have been neglected to some extent [28]. Consequently, the ecological environment along this river and its banks has been deteriorating, detrimentally affecting its image as the “mother river” of Beijing [29]. The Yongding River is an ecological link to the southwest region and an important ecological corridor in Beijing. Therefore, urgent measures are required to enhance the management of the river and improve the quality of the urban ecological environment, with a view to accelerate the transformation of the city of Beijing as an international, liveable city.
Lianshi Lake is an important artificial lake, located at the junction of the Shijingshan, Mentougou, and Fengtai districts in Beijing. The lake, built on the former Yongding River bank, is 3.4 km long, an average of 300 m wide and 1.5 m deep, and covers an area of 106 ha. Lianshi Lake is a key link between the Mencheng Lake in the upriver and the Yuanbo Lake downstream in the urban section of the Yongding River.
We obtained the ecological data used in this study mainly from the water ecological experiment of Lianshi Lake, and hydrology and water quality data pertaining to the Yongding River. The economic and social data were mainly obtained from the Statistical Yearbook of Beijing 2018 as well as field investigations.

2.2. Water Ecological Experiment

We designed a water ecological experiment in Lianshi Lake to evaluate its health status and the influence of its upstream inflow. In the preparation stage, six sampling sites were established in the representative area of the main lake area, referred to as LSH-1, LSH-2, LSH-3, LSH-4, LSH-5, and LSH-6 (Figure 1). Physical, chemical, biological, and habitat data were monitored at these sampling sites.
The monitoring tests were designed to determine various aspects of the health of the lake, such as 1) the degree of eutrophication at different locations; 2) the correlations between the physical and chemical indices at different sampling points; and 3) the growth patterns of plankton and aquatic plants. As the degree of eutrophication at different locations in lakes can differ because of a sluggish water body, we compared the plankton index values of the different sampling points and processed the data required for the health evaluation based on the comparative analysis results. In this study, six study sites were located at water depths between 2.11 m and 4.72 m (Figure 1). Sampling dates (May–November 2018) were selected depending on biological community development. Samples were collected in early May 2018 (beginning of the growing season), early August 2018 (maximum peak vegetation), late August 2018 (maximum phytoplankton and zooplankton peaks), and late October 2018 (minimum vegetation and plankton). Lianshi Lake belongs to the landscape’s water body, and the water level remains at approximately 71 m. There is considerable hydrologic variation in the flood season and no obvious stratification. Water quality data were derived from the continuous monitoring of Lianshi Lake, which is conducted once a month (May–November 2018), and from encrypted monitoring in August and September (once every five days).
The water quality parameters (pH, temperature), oxygenation parameters (dissolved oxygen, chemical oxygen demand), nutrient parameters (ammonium-N, nitrate-N, total nitrogen, total phosphorus), and photosynthetic pigment contents (chlorophyll a) were investigated in this study, conducted to monitor the water quality of the Lianshi Lake.
Samples were taken from the subsurface (−50 cm) for analysis. Water temperature (WT), pH, and dissolved oxygen (DO) were measured on-site at the sampling locations by using portable electronic instruments (Hach HQ40d™ multi-parameter pH/oximeter, Hach Company; YSI 550A, YSI Inc., USA). Water samples for ammonia nitrogen (N-NH4+), nitrate nitrogen (N-NO3), total nitrogen (TN), and total phosphorus (TP) were measured by an EN123 752 spectrophotometer. Chemical oxygen demand (COD) was analyzed according to the dichromate method [30]. Chlorophyll a concentration was determined spectrophotometrically with the spectrophotometric method [31]. All samples were analyzed within 24 h of collection in the laboratory for the water environment, China Institute of Water Resources and Hydropower Research. According to government regulations, the water quality of Lianshi Lake should not be worse than a type IV water quality [32].
Over the period of May–November 2018, we detected 89 species of phytoplankton belonging to 9 phyla, namely Cyanophyta, Chlorophyta, Diatomophyta, Dinoflagellates, Cryptomophyta, Euglenophyta, Jinophyta, Xanthophyta, and Haptophyceae. We detected 39 species of zooplankton, belonging to 4 phyla, namely Protozoa, Rotifer, Cladocera, and Copepoda. Forty-nine species of zoobenthos belonging to three phyla were detected, namely Arthropoda, Annelida, and Mollusca. Three plant species were found, namely Phragmites australis, Typha orientalis, and Acorus calamus.

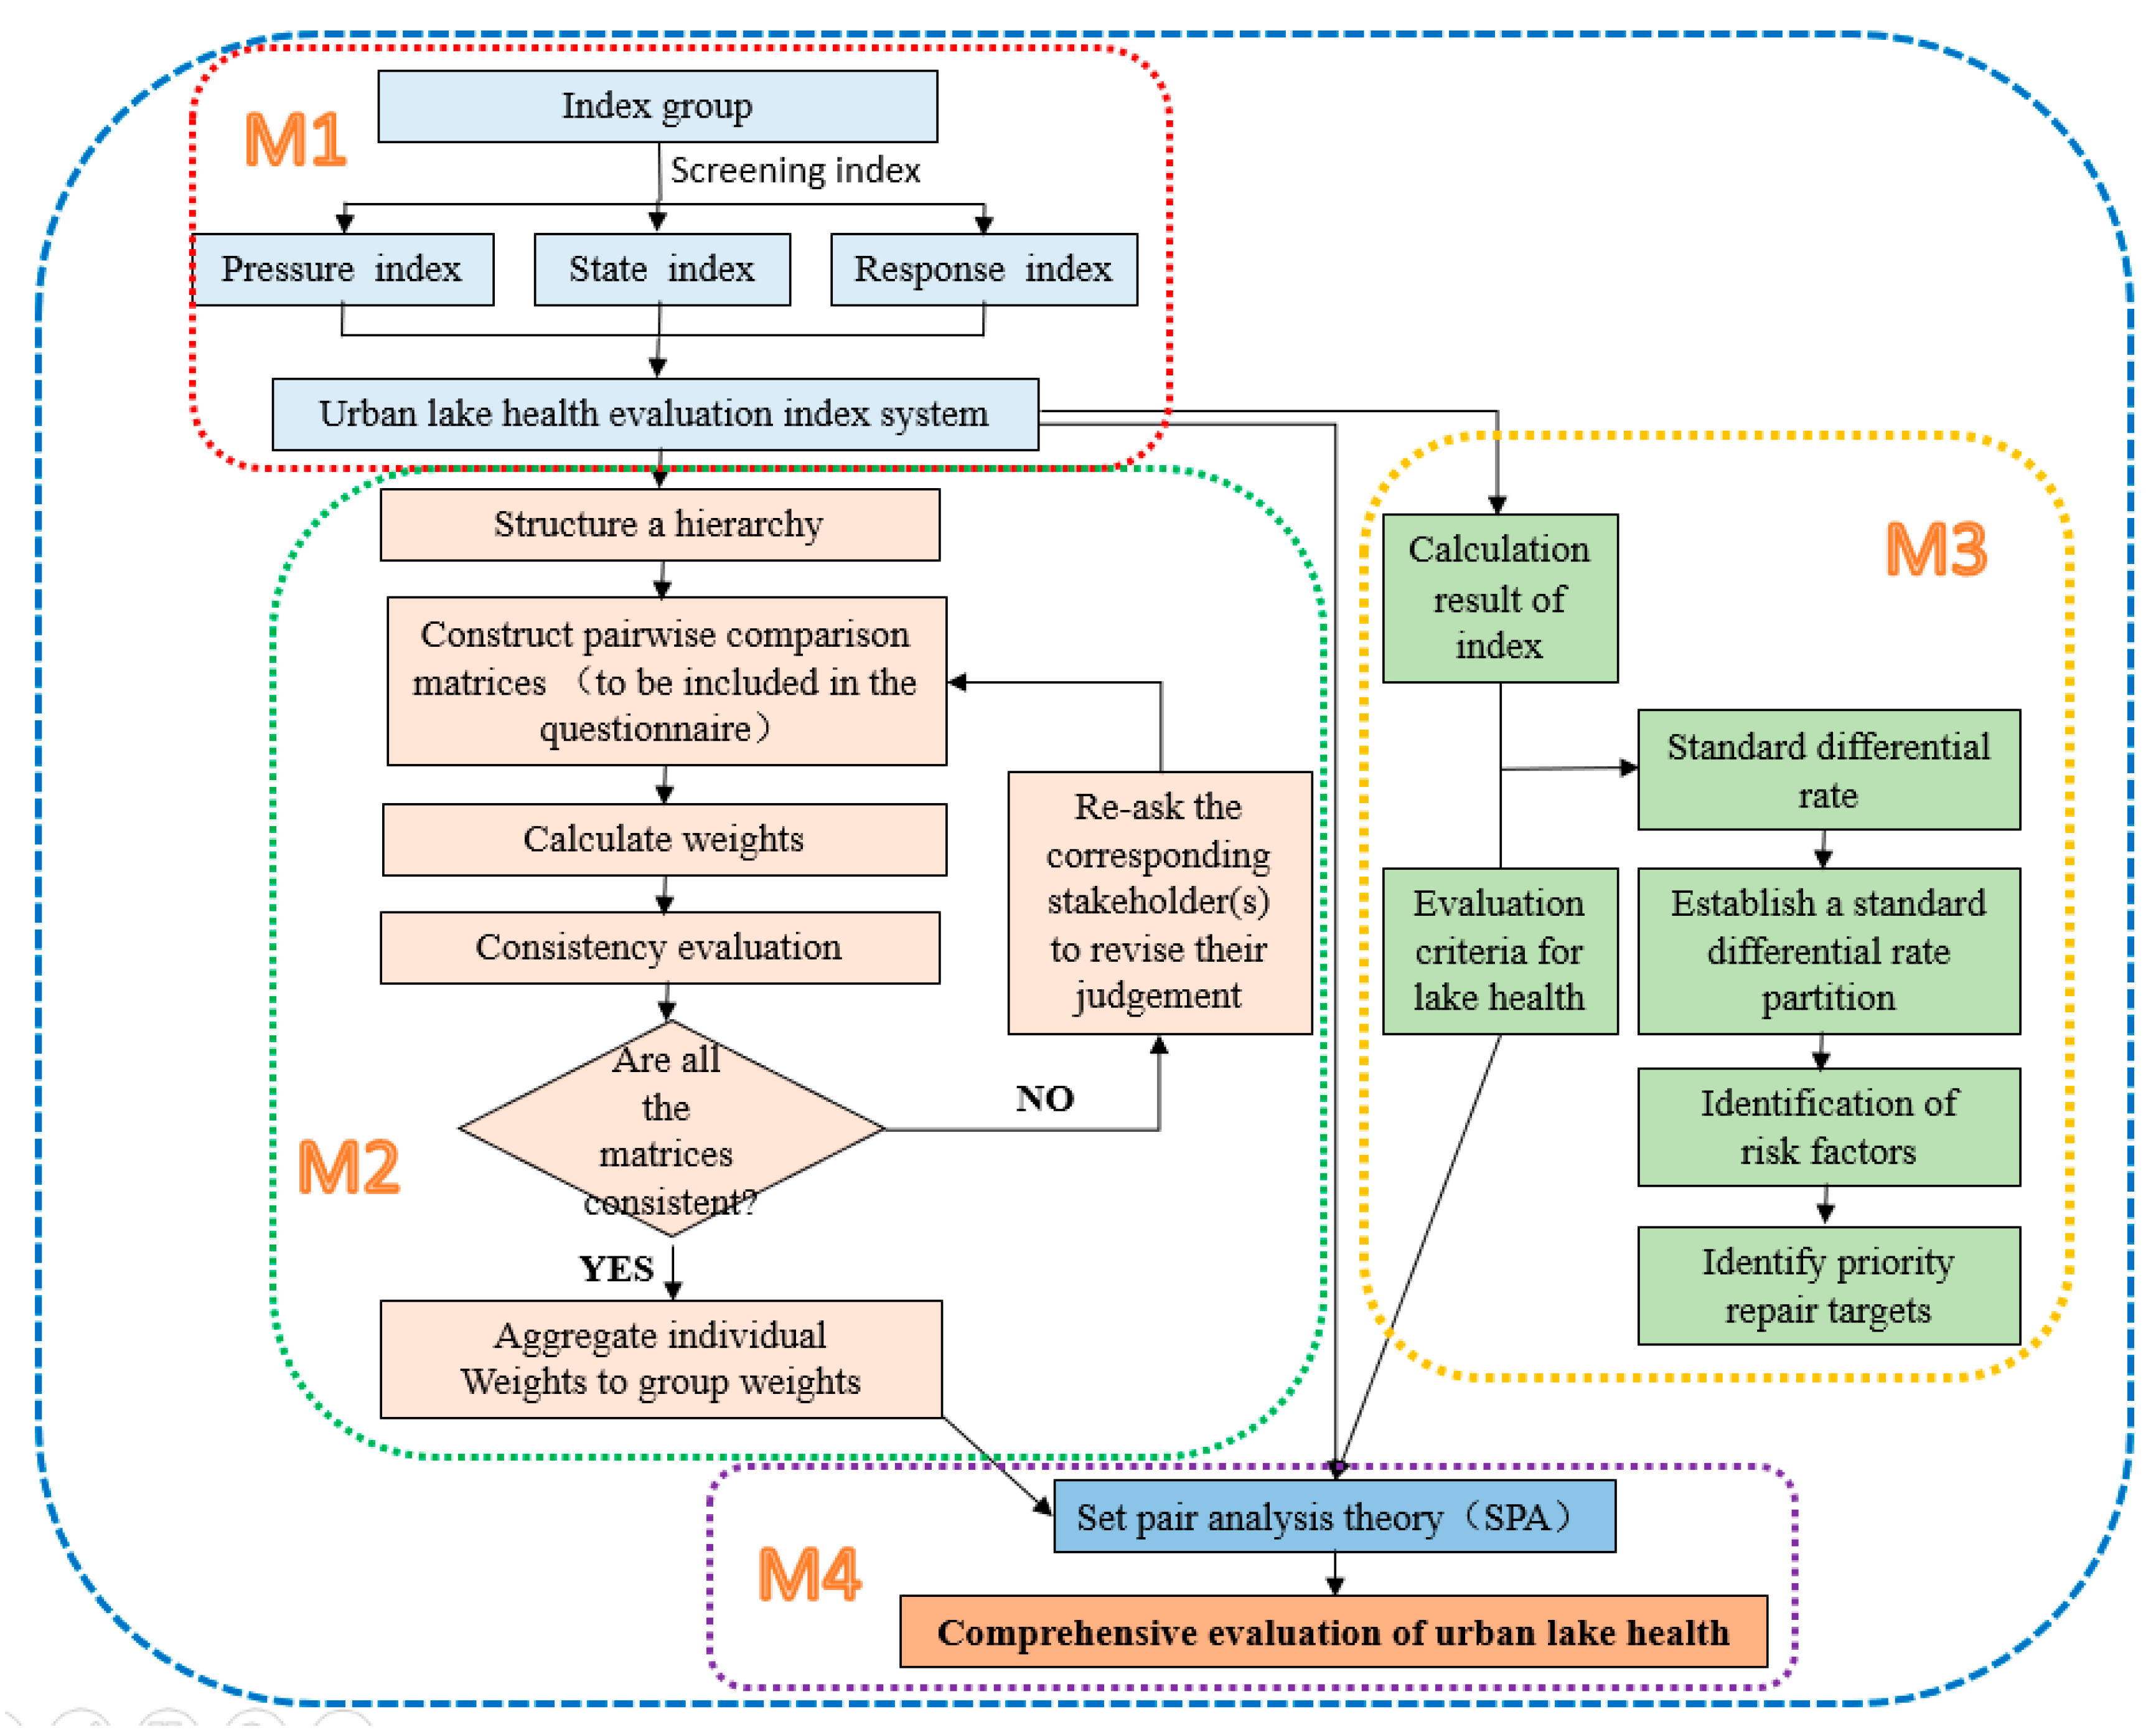
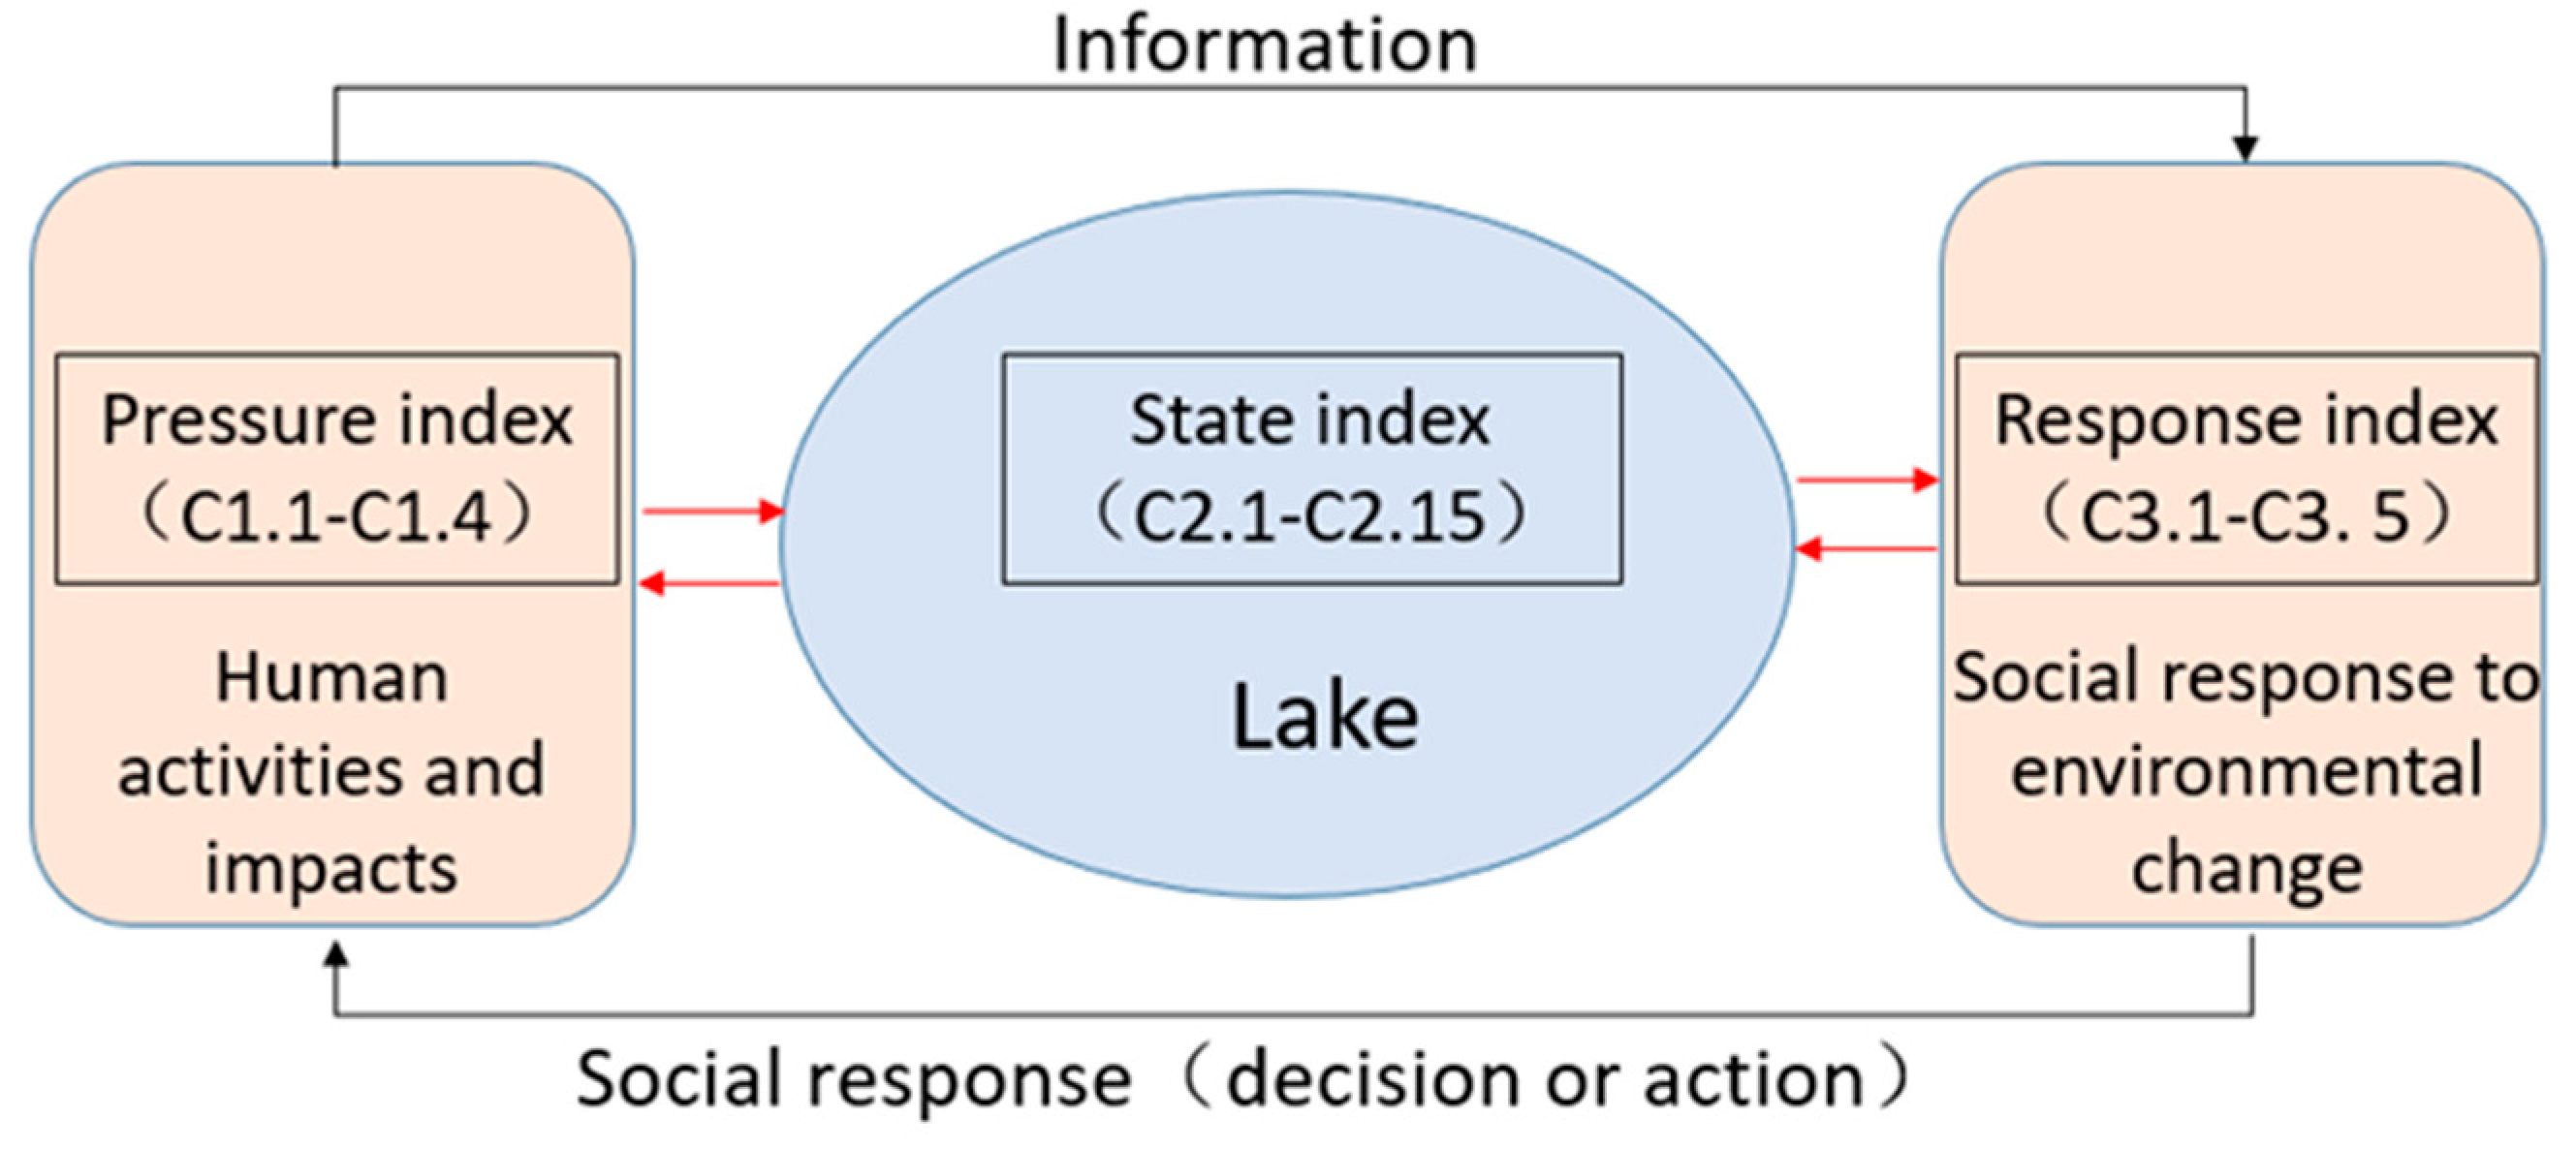
2.3. Urban Lake Health Evaluation Framework

There are four functional modules in the entire urban lake evaluation framework (Figure 2): the health evaluation index screening module (M1); the evaluation index weight determination module (M2); the risk factor identification module (M3); and the health comprehensive evaluation module (M4).
The sustainability, stability, and ecological integrity of the lake ecosystem are reflected in the health evaluation index screening module (M1). However, such an evaluation must also consider societal needs; therefore, these two main aspects were combined to establish the index group of urban lake health evaluation.
The selected evaluation indices were classified according to pressure index, status index, and response index, to establish the pressure–state–response (PSR) health evaluation index system. According to the concept and connotation of ecosystem health, the valuation indices should be selected to be quantifiable, actionable, and widely popularized, so as to reflect the characteristics of the ecological environment of the evaluated objects [33,34,35]. In the index screening module (M1), the pressure index includes four indicators (C1.1–C1.4), the state index includes fifteen indicators (C2.1–C2.15), and the response indicators include five indicators (C3.1–C3.5). The specific index meanings are shown in Table 1.
In the weight determination module (M2) (Figure 2) of the evaluation index, the weight of each index in the index system should be determined to maximize the value of the lake ecosystem and satisfy the needs of sustainable development of human society and the economy. In the process of determining the weight, both the natural attributes of the indicators (objective law of lake ecosystem development) and the social attributes of the indicators (demands of stakeholders) must be reflected. The analytic hierarchy process (AHP) system engineering theory is the preferred method to determine the weight of the indicators [36,37,38]. This process is an organized, multi-objective, multi-criteria decision-making method that combines quantitative and qualitative analysis, divides the factors in complex problems in an orderly way, and renders them interrelated. In the weight determination module (M2), the peer weight and global weight of all indicators are calculated (Table 1)
In the risk factor identification module (M3), to accurately detect the risk factors that affect the health of lakes, it was necessary to identify the risk factors based on the health evaluation criteria and the calculated values of the actual indicators of the evaluated lakes. The main purpose of an urban lake health assessment is to bring the health status of the lake to the attention of the relevant lake management. When the health of a lake is affected and requires restoration, workers must be able to accurately identify the restoration target and determine the order of restoration according to the risk level indicated by the index under the guidance of the system restoration concept. In the process of risk factor identification, the calculation of the standard difference rate requires an index calculation value (Table 1), corresponding index calculation method is shown in Table 2, and a health standard value (i.e., the critical value of health and sub-health, see Table 3).
The health comprehensive evaluation module (M4) mainly integrates the results of modules M1, M2, and M3 to comprehensively evaluate lake health. The comprehensive health evaluation mainly used the set pair analysis method (SPA), a detailed introduction of which is presented in Section 2.6.
This framework facilitates systematic thinking for the evaluation of urban lakes. An evaluation based on the framework not only provides an in-depth understanding of the health status of a lake to decision-makers and restoration workers but also identifies the risk factors influencing lake health to facilitate suitable restoration.

2.4. Index System

We used the PSR framework to establish the urban lake health evaluation system (Table 1), including the 24 selected indicators. This evaluation system included an objective layer, three criteria layers, and several indicator layers. Determining the ecological health of the lake is the goal of such evaluation systems, including the criteria of pressure, state, and response. The pressure module was designed to represent the state of the pressure caused by human activities on the urban lake. Four indicators (C1.1–C1.4) were determined according to the screening results, representing population pressure, water resource utilization pressure, pesticide pollution pressure, and fertilizer pollution pressure, respectively. The state module reflected the changes in the internal organization of the lake, nature, lake function, and disturbance caused by human activities. A total of 15 indicators (C2.1–C2.15) were screened out in this module. Among these, C2.1–C2.3 represented the health status of the lakeside zone, C2.4–C2.6 represented urban lake morphology, C2.7 and C2.8 represented hydrologic and hydrodynamic conditions, C2.9–C2.11 were indicators of water quality status, and C2.12–C2.15 were indicators of lake water ecology. The response module reflected the environmental, economic, and management strategies to prevent, respond to, mitigate, and prevent changes that were deemed detrimental to human survival and social development. Five indicators (C3.1–C3.5) were screened out, representing public satisfaction, improvement in laws and regulations, management measures, environmental investment, and regional population quality. The calculation methods and data sources of each indicator of the evaluation system are listed in Table 2.

2.5. Assessment Criteria

Each index level was divided into four levels based on the evaluation indices of and methods employed for similar lakes, investigation of the status quo of the ecological environment, and functional positioning [44]. Table 3 provides the health level and value range of each evaluation index, which can be the query basis for the health level of each index.
Table 4 shows the quantitative standard ecosystem health status. The criteria rank and rate the health of the lakes, and the characteristics of the ecological systems are described according to the aspects of reasonable ecological structure, system vitality, external pressure, abnormal ecological effect, and system sustainability.

2.6. Assessment Method

In evaluating the health level of Lianshi Lake, the degrees of the relationships between each index of the evaluation system and the evaluation standard were determined by the set pair analysis method.
There are many uncertain factors in the evaluation of lake ecological health, such as the complexity and dynamics of the lake ecosystem itself, relative fuzziness of the evaluation grade standard limit, and the nonlinear problem of the evaluation results. According to the set pair theory, the method can directly reflect the relation between the evaluation sample index and the standard bounds of all levels of indicators, effectively solving the fuzzy problem of the standard boundary of the evaluation level and improving the objectivity and credibility of the evaluation results.
The core idea of a set pair is to join two sets that have some type of connection into a set pair. In the context of the problem, the same and different inverse analyses were carried out for the characteristics of set pairs. By measuring and characterizing, we obtained the expression of the same, different, and inverse connection degrees of the set pairs. We conducted the research on the prediction, evaluation, and decision of the health evaluation system by employing the connection degree and its operation [45,46].
In the multi-index evaluation of lake health, let set A and relative set B construct a set pair H = (A, B), where A is the set of indicators for evaluating the health of the lake ecosystem, and B is the set of index evaluation grades for evaluating the health of the lake ecosystem:
A = { X l } B = { S l k } m × n ,
where m terms in A(l = 1,2,…,m), i.e., a1, a2, …, am, are used to show the characteristics of set A. Similarly, n terms in B(k = 1,2,…,n), that is, b1, b2, …, bn, are used to show the characteristics of set B. The evaluation system will be divided into n levels. According to the principle of set pair analysis, the connection degree of H = ( X l , S l k ) is defined as μ ( X l , S l k ) :
μ ( X l , S l k ) = a + b 1 i 1 + b 2 i 2 + c j ,
where a is called the identity degree, b the discrepancy degree, and c the contradictory degree. a, b, c∈(0,1) and a + b + c = 1. i is the uncertainty coefficient of discrepancy, which has different values (−1,1) in different conditions, or sometimes can be considered a marker of only discrepancy; j is the uncertainty coefficient of contradiction, which has a value of −1 or sometimes can be considered a marker of only contradiction.

3. Results and Discussion

3.1. Health Assessment

The values of each index of the assessment of Lianshi Lake were calculated according to the calculation methods of the related indices (Table 2). The global weight of each index (Table 1) was calculated by the analytic hierarchy process (AHP) method.
The set pair analysis theory (Section 2.6) was used to calculate the number of connections and analyze and evaluate the health status of the lake. The equipartition principle is a commonly employed method with a clear concept, simple calculation, and straightforward operation.
We adopted the equipartition principle to calculate the correlation component coefficient i. Following this principle, we equally divided the (−1, 1) interval into four intervals, with the connection degrees of the four levels of lake health in the range (−1 to −0.5), (−0.5 to 0), (0, 0.5), and (0.5, 1). The four intervals represent morbid, unhealthy, sub-healthy, and healthy states, respectively. The value i should be located at the third equinox of the interval (−1, 1), and should give i1 = 1/3, i2 = −1/3, and j = −1. As shown in Table 1, the weights of pressure, state, and response are 0.1634, 0.5396, and 0.2970, respectively. We obtained i1 = 1/3, i2 = −1/3, and j = −1 into μ ( X l , S l k ) = a + b 1 i 1 + b 2 i 2 + c j , with the result being μ(A, B) = 0.1467 (Table 5).
As shown in Figure 3, the connection degree of Lianshi Lake was 0.1467 (i.e., between 0 and 0.5), and the status of the health of the lake was sub-healthy. While evaluating the overall health status of Lianshi Lake, three sub-modules (pressure, state, and response) of the M1 module (Figure 2) were evaluated [35]. The results obtained showed that the pressure sub-module was in a healthy state, the state sub-module is in an unhealthy state, and the response sub-module is in a sub-healthy state.
As shown in Figure 4, we compared the gap between the index values and the health criteria to identify the key indicators that had the greatest impact on the three sub-modules of M1.
In the pressure sub-module, utilization of water resources (C1.2) and population density (C1.1) were far from the standard and the other two indicators met the health standard, which is closely related to the control of various pollution sources by the government and lake management departments. These results reflect the fact that the use of pesticides and fertilizers in cities has been greatly reduced. Although the issues of water utilization and population size are more complex to address, the overall development is in a better direction, which is consistent with the evaluation results of the pressure subsystem.
In the state sub-module, recovery of the lakeside zone, water quality, and water ecology takes time; there is a significant delay in time before the actual health state of the lake can be recorded, e.g., the pressure sub-module might be in good health while the state sub-module is unhealthy. At the same time, the shape of the lake and the hydrologic and hydrodynamic conditions are seriously affected by the objective law, making it difficult to improve.
The response sub-module reflects the social aspects of the evaluation, which mainly include public satisfaction, degree of perfection of management functions, degree of perfection of relevant laws and regulations, and the investment in environmental protection and regional population quality, all of which correspond to the status of the lake. At the time of this study, the response sub-module was in a sub-healthy state, and requires sufficient time and continuous improvement to reach the healthy state.

3.2. Risk Factor Identification

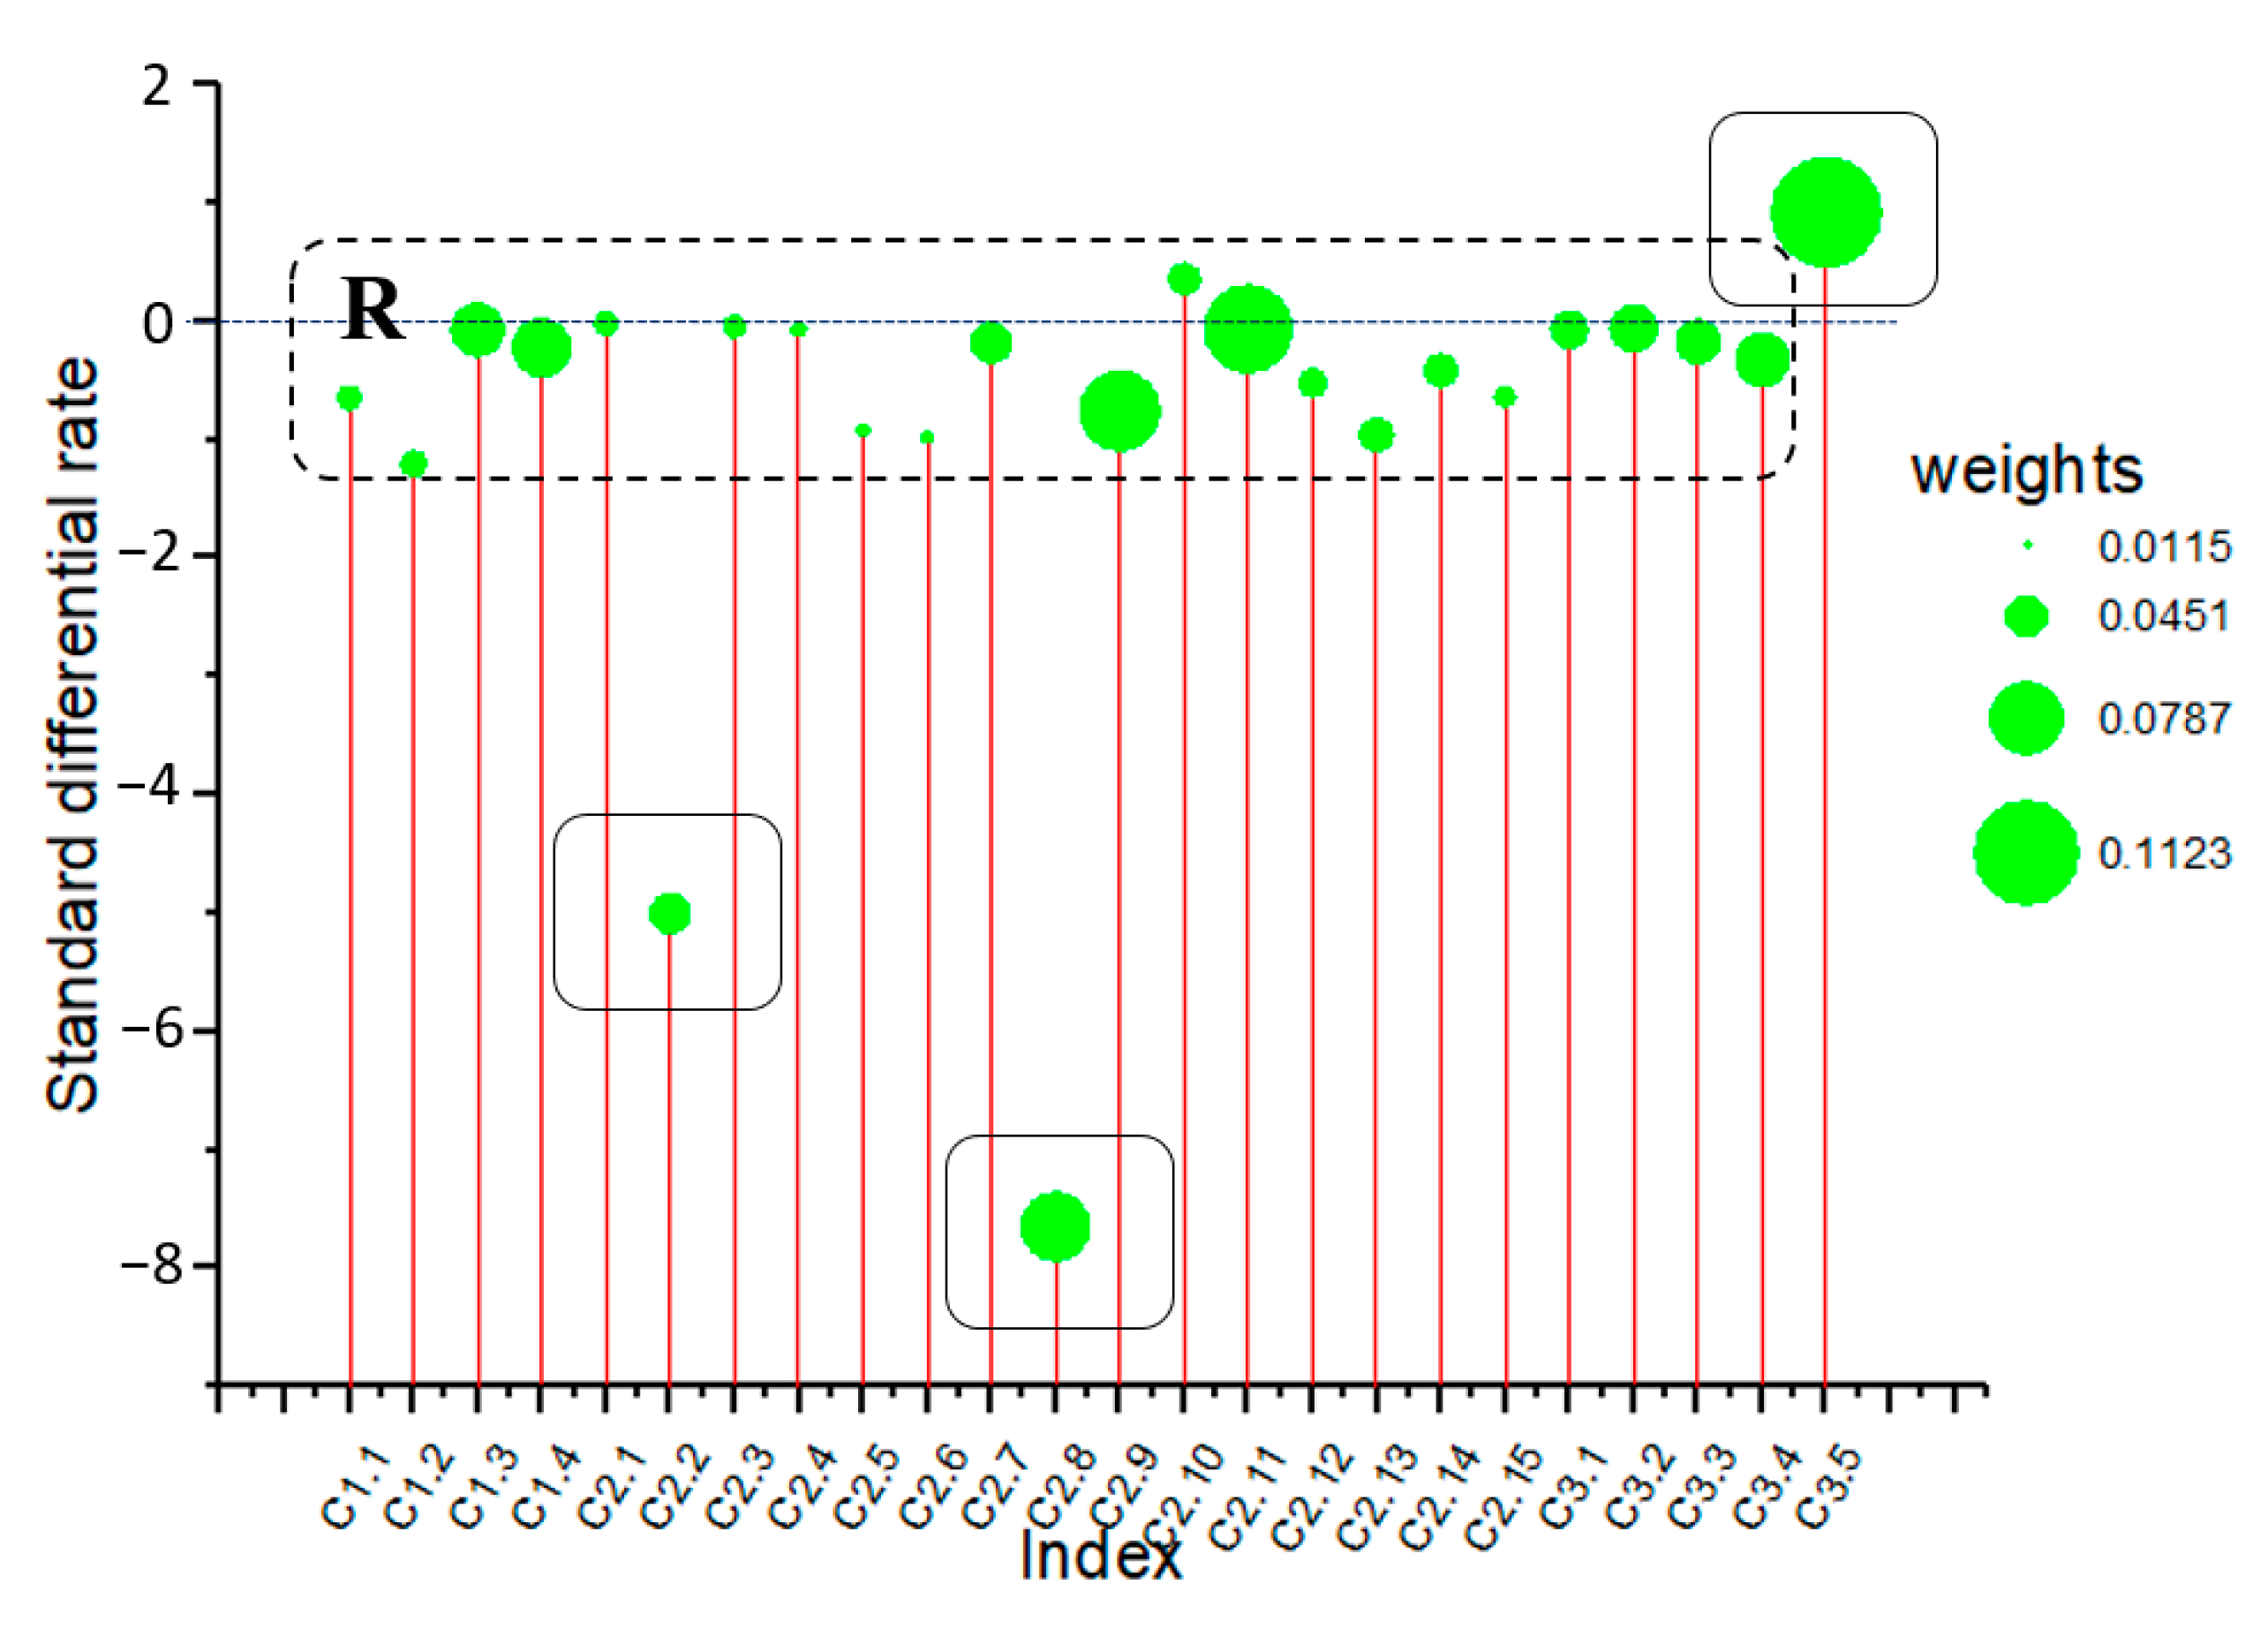
3.2.1. Calculation of Standard Differential Rate

In the evaluation process, in addition to the overall evaluation of lake health, it is also important to determine the key indicators (risk factors) that are detrimental to lake health, so that accurate restoration measures can be applied.
To accurately represent the gap between each indicator and the health standard, the actual value of the indicator was compared with the health standard value (the critical point of health and sub-health). The concept of standard differential rate (SDR) was introduced, which is defined as follows:
SDR = ± ( P v S v S v )
where SDR represents the standard difference rate, Pv represents the present value, and Sv represents the standard value. When the index is positive it takes the positive sign (+) and when negative it takes the negative sign (−). The positive index reflects that the evaluation grade of the health of the lake increases with an increase in the index value. The negative index reflects that the evaluation grade of the health of the lake decreases with an increase in the index value.
Figure 4 shows the SDR (vertical coordinate) of each indicator, and the bubble size represents the global weight of the corresponding indicator. The figure clearly shows that the distance between the landscape connectivity (C2.2) and lake residence period (C2.8) is relatively large, with the values of the standard difference rate being −5 and −7.65, respectively. The regional population quality (C3.5) is shown to have exceeded the health standard, and it has a large weight in the entire system, with the value of the standard difference rate being 0.933. The area surrounded by the dotted line is a more accurate indicator of health, and the values of the standard difference rate are between −1.2 and 0.5. However, SDR alone cannot detect the influencing risk factor, because the weight of each indicator is different.

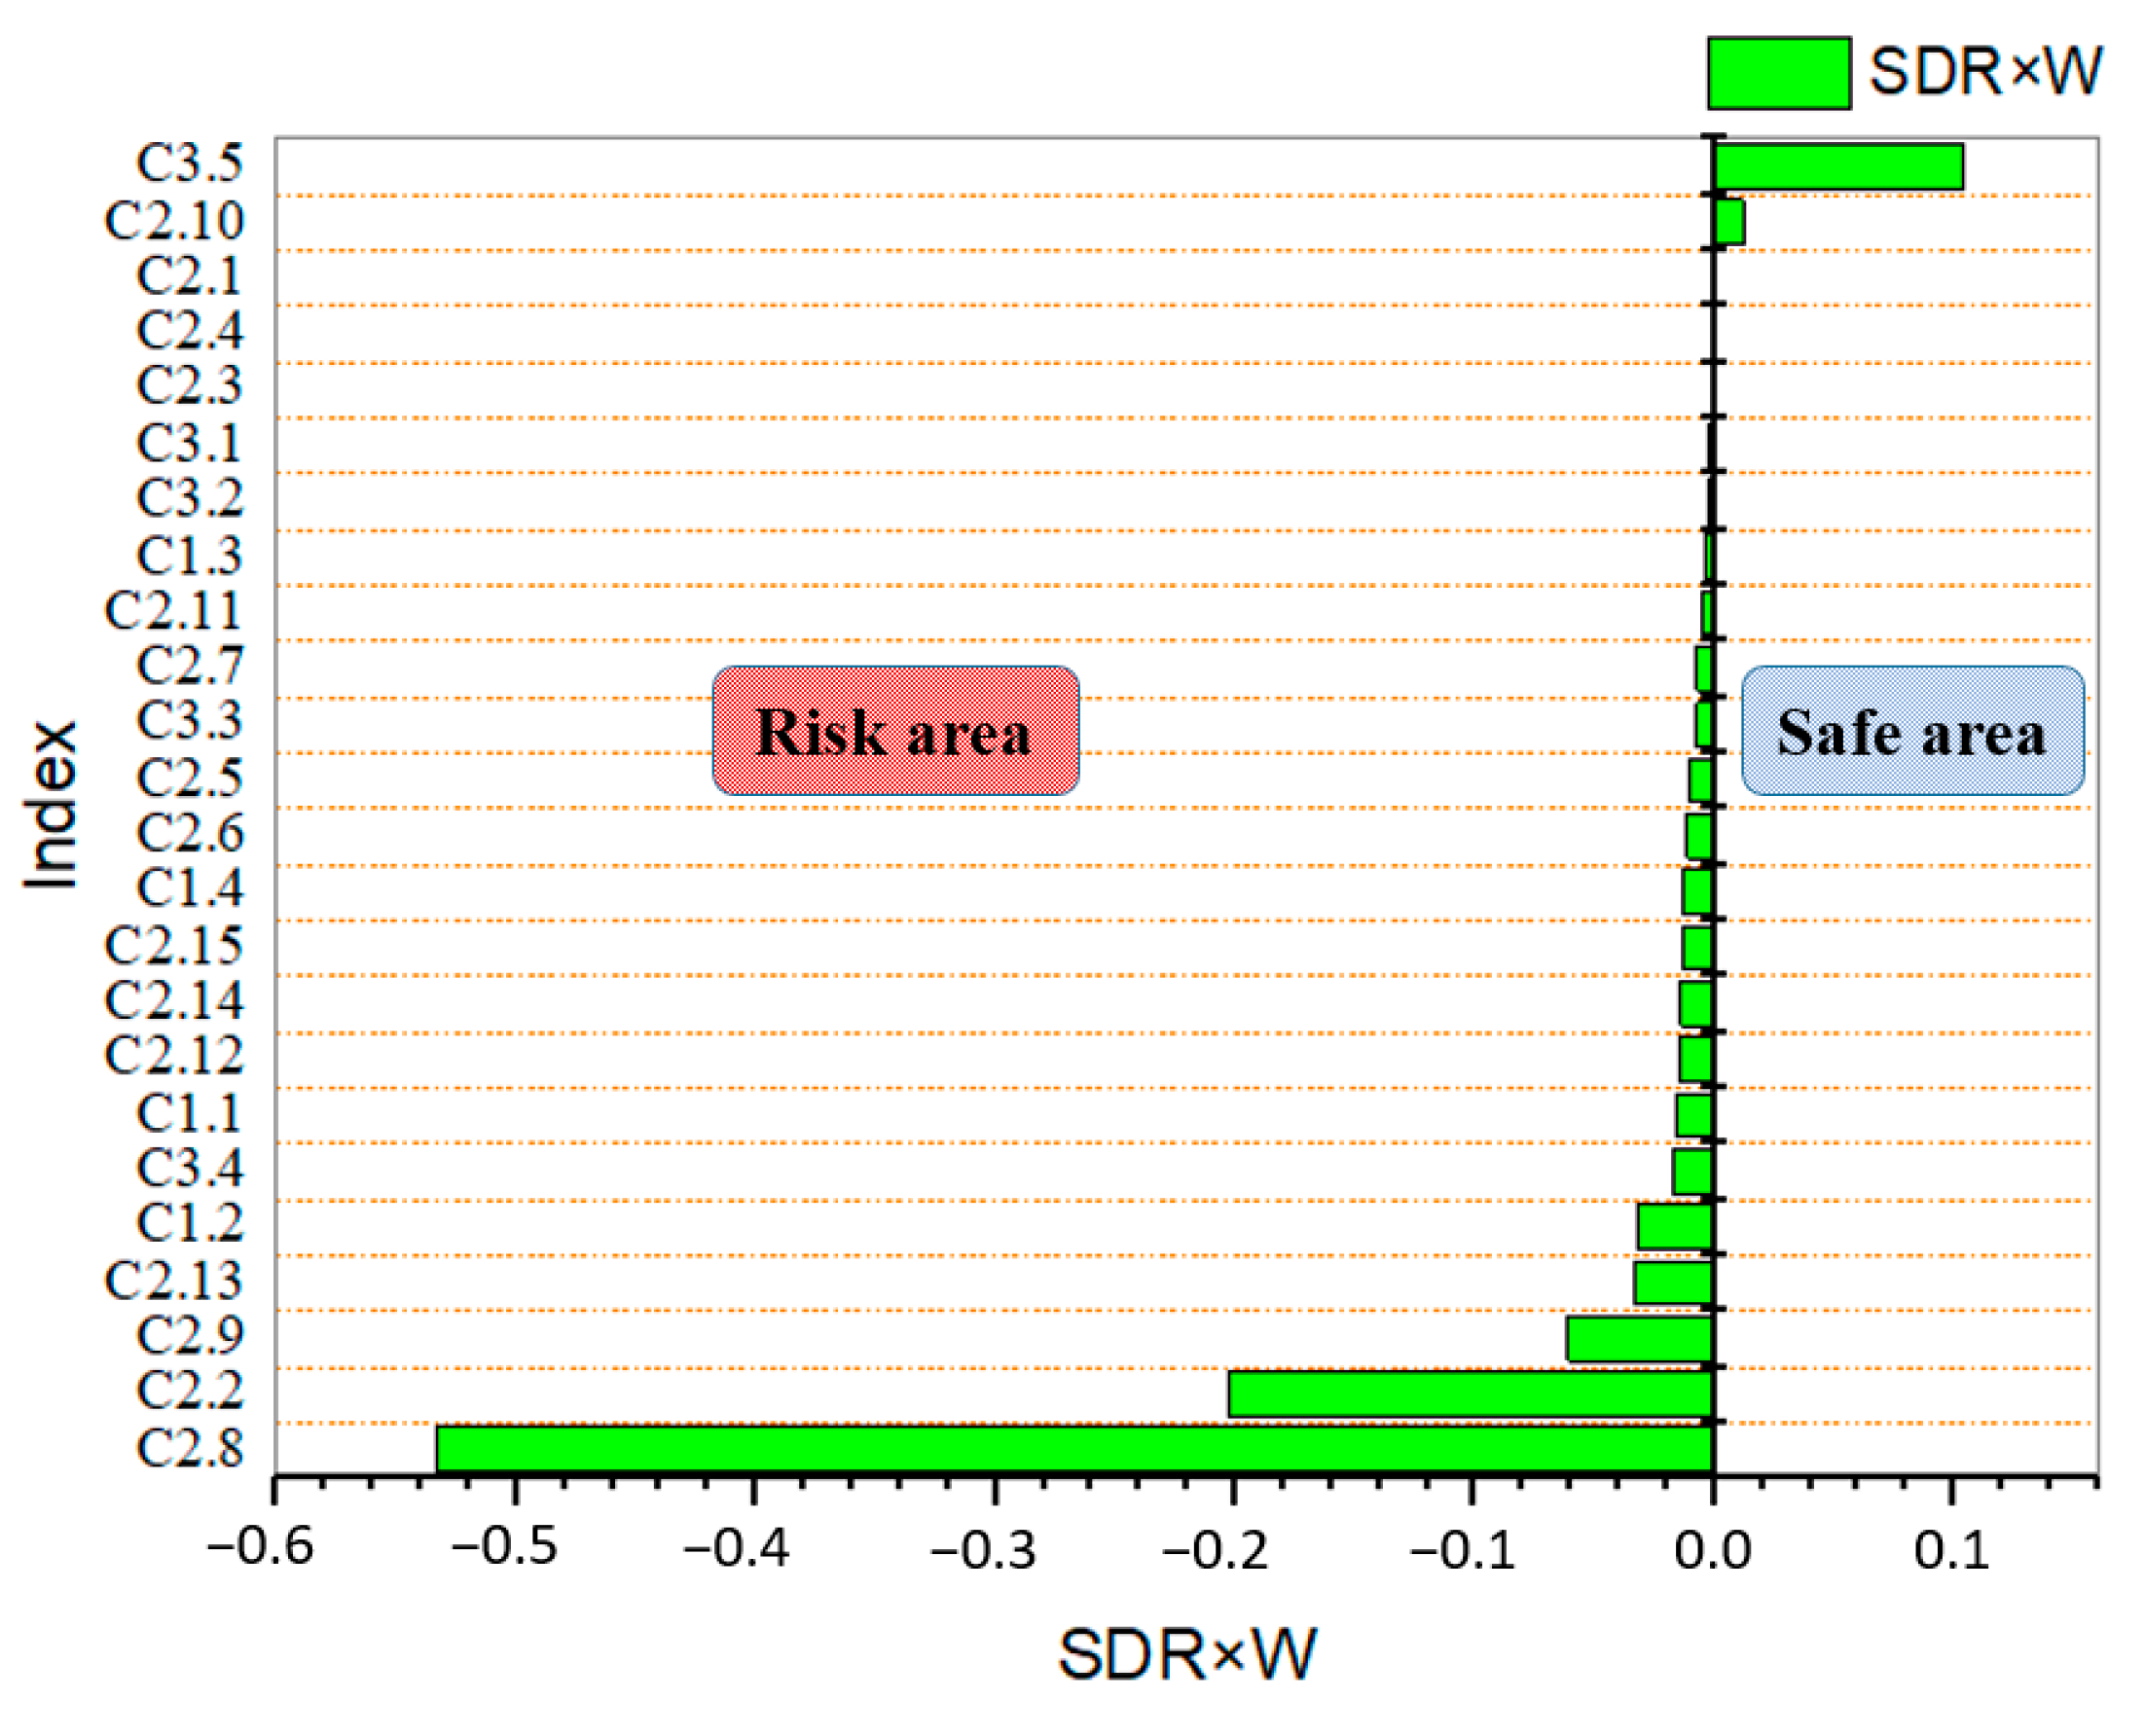
3.2.2. Identifying Lake Health Risk Areas

When identifying risk factors, consideration must not only be given to the gap between the current state and the healthy state of the lakes but also to the importance of the evaluation indices in the total evaluation system. Therefore, the concept of risk degree (Rd) (security degree (Sd)) was introduced to comprehensively represent the position of the indicators in the risk identification zone. The definition is as follows:
Rd ( Sd ) = ( SDR ) × W ,
where Rd represents the risk degree, Sd represents the security degree, and Wi represents the global weight of each indicator. When SDR×W is positive, it is in the safe zone and the value is called the security degree, Sd, which represents the ultra-healthy level of the index. When SDR×W is negative, it is in the risk area, and the value is called risk degree Rd, which represents the unhealthy level of the indicator.
The risk areas were divided according to the value of SDR×W. Figure 5 shows that two indices, heavy metal pollution in the sediment (C2.10) and regional population quality (C3.5), are in the safe area, while the other indices are in the risk area.
The purpose of distinguishing safety indicators from risk indicators is to delineate the range of risks, which is similar to the various indicators tested by doctors before patients see a doctor. Safety indicators are no longer considered during the repair process, such as C2.10 and C3.5. The risk index is comprehensively measured by the gap between the monitoring value and the health standard value and its weight; i.e., the more important the index is, the greater the gap is, and the greater the risk is. The SDR×W of the index in the risk zone is negative, and the greater the value, the greater the risk. Among the numerous risk indicators, those with the greatest risk are state indicators (describing the environmental quality of existing lakes), such as C2.8, C2.2, C2.9, and C2.13. These indicators are all existing indicators that directly affect the health of lakes, and many scholars have conducted relevant studies [47,48,49,50,51]. From the perspective of scholars and managers, the risks of these indicators are recognized and allocated a high weight (Table 1). Analysis of less risky indicators, such as C1.1, C1.2, and C3.4, are pressure indicators and response indicators, respectively. Among them, the stress index describes the impact of human activities on the environment, and the response index describes the social response and concern degree to environmental changes. The influence of these indicators on lake health is delayed and the effect is not obvious in a short time (as shown in Figure 6); therefore, the risk is considered to be relatively small.

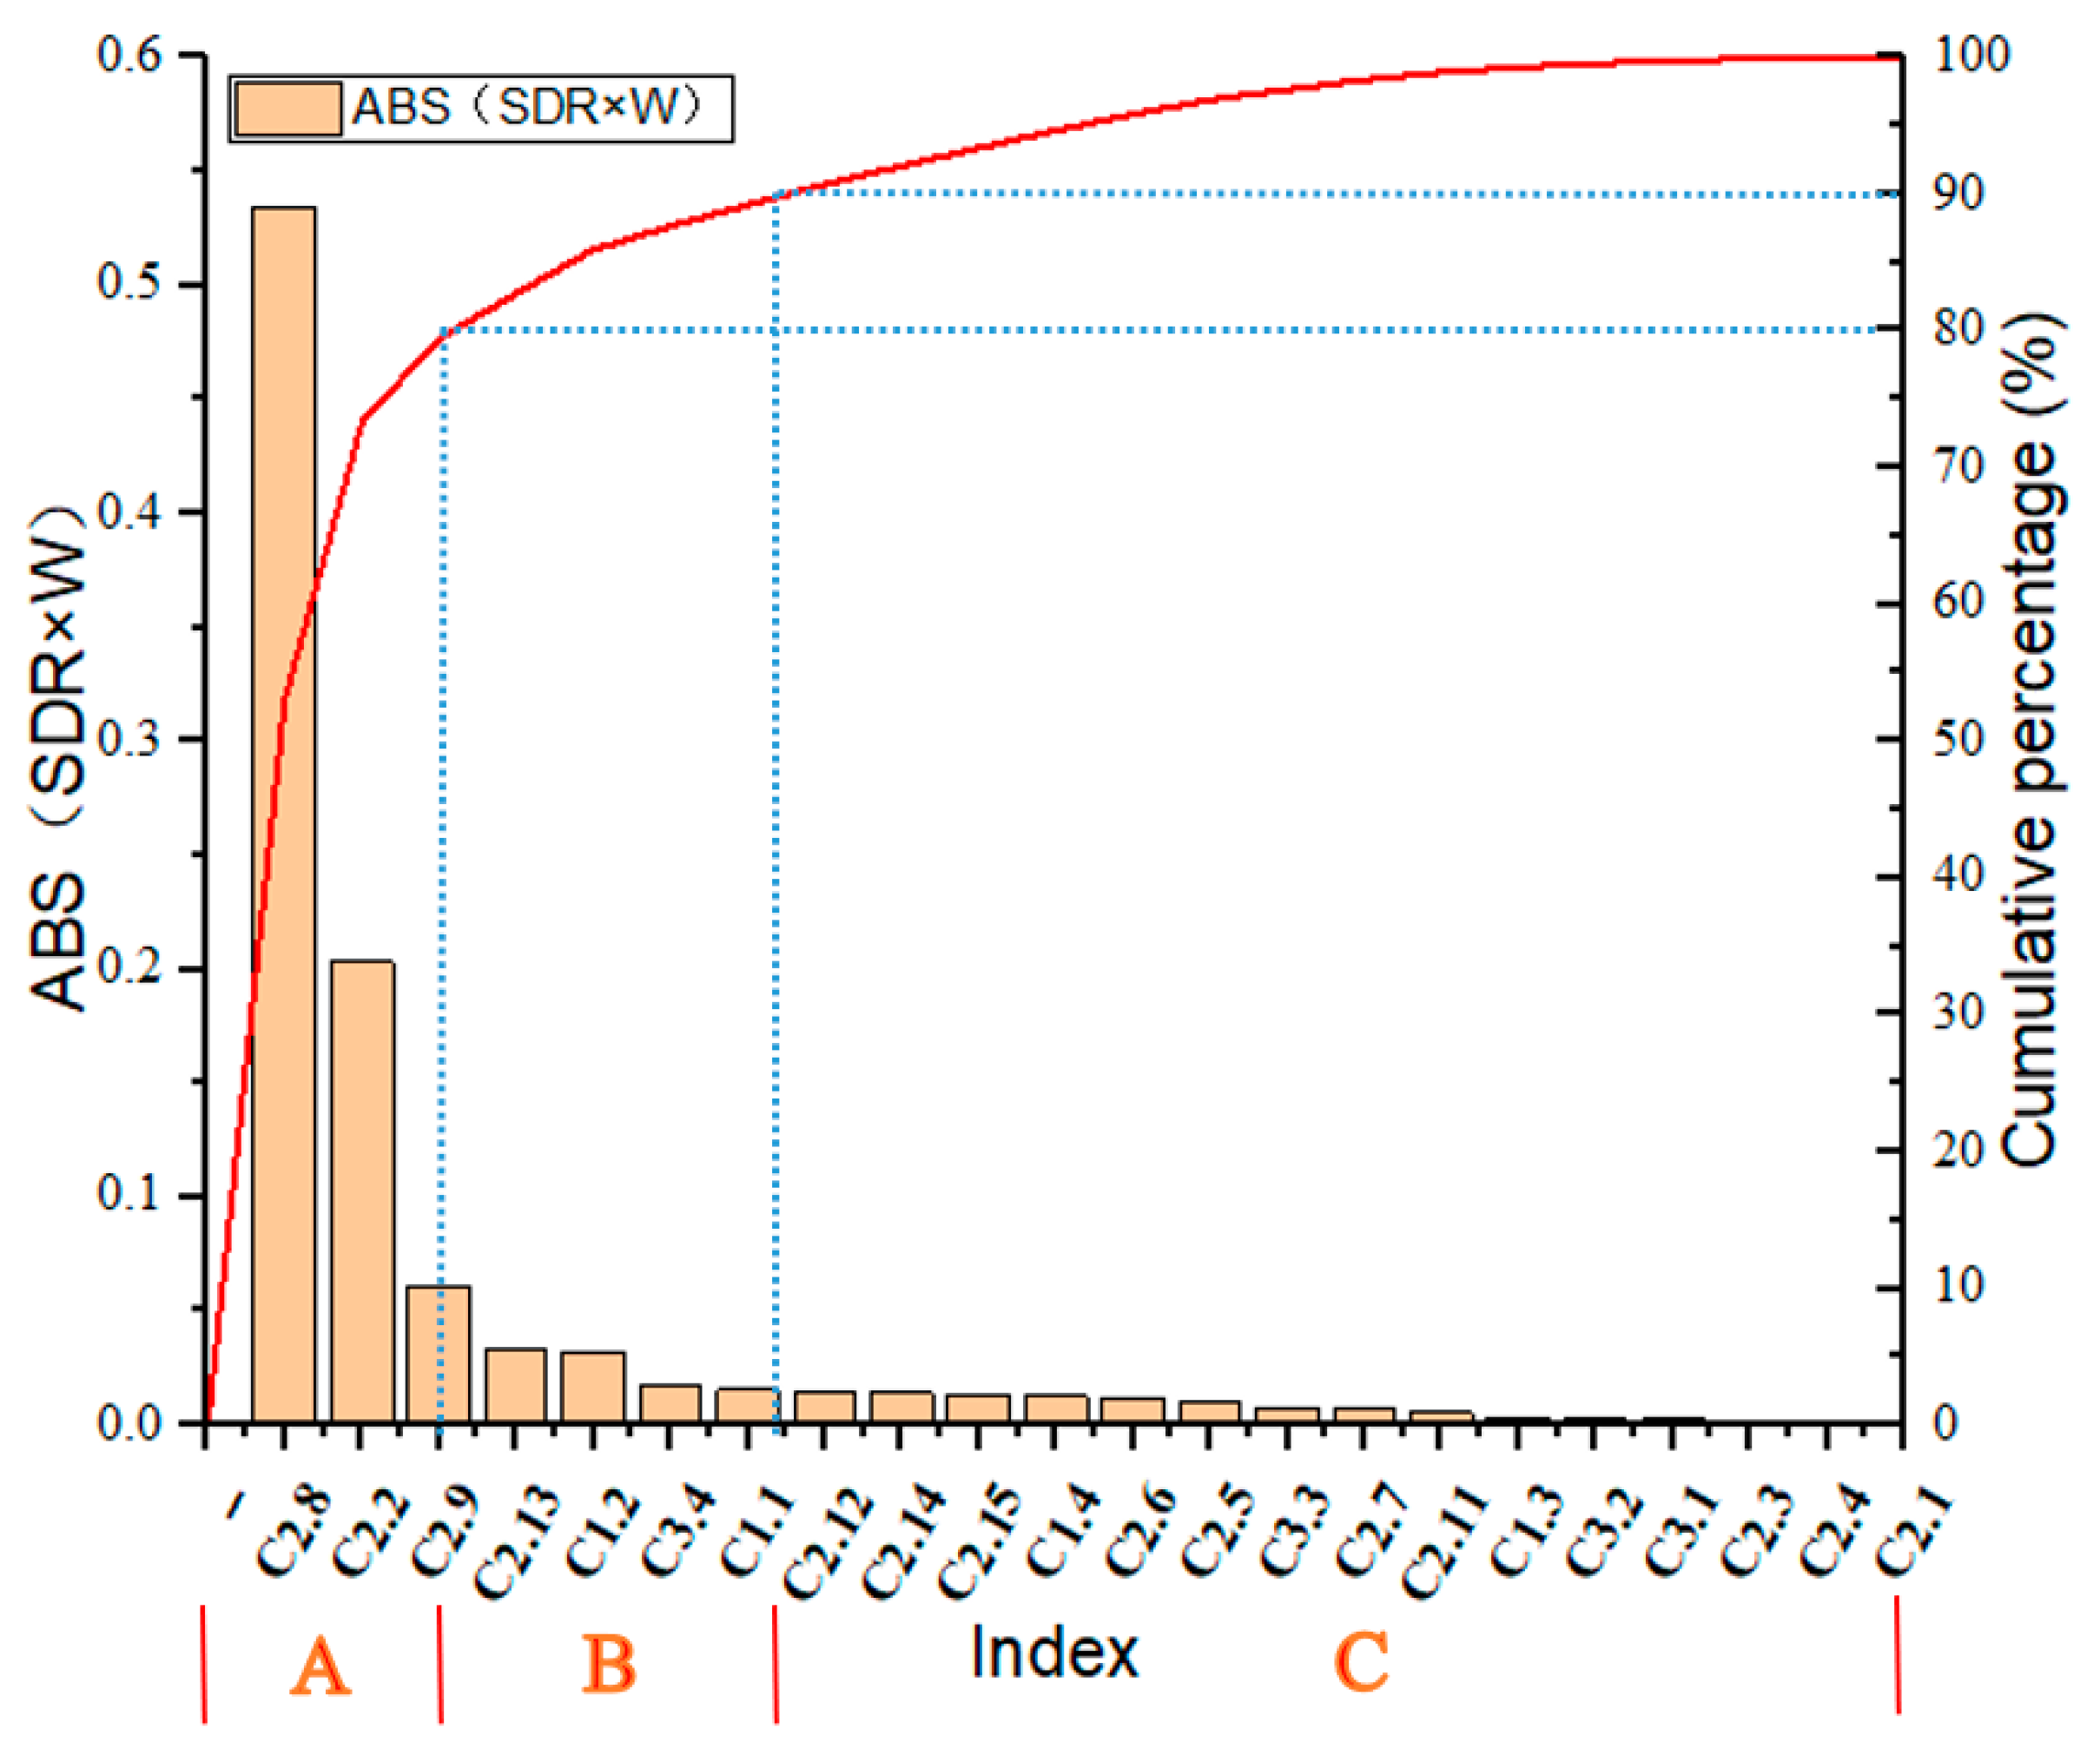
3.2.3. Identification of Major Risk Factors

In the process of identifying the major risk factors, the indicators in the risk area were classified and the major risk indicators were identified as the risk factors indicating the health of the urban lakes. In the classification method, an activity-based classification (ABC; Pareto analysis method) is able to classify and place the indicators in order of the risk degree and distinguish between the focus risk indicator and the general risk indicator, so as to scientifically identify the risk factors.
First, in the risk indicators, the ABS (SDR×W) numerical value was sorted, and the percentage of the risk degree of each indicator in the total risk degree was calculated, after which the percentage cumulative curve was drawn. Subsequently, level grouping was carried out on the curve: Category A, with a cumulative frequency of 0–80%, is a major risk index; Category B, with cumulative frequency of 80–90%, is a secondary risk index; and Category C, with cumulative frequency of 90–100%, is a micro risk index.
The risk indicators affecting lake health were identified by grouping (as shown in Figure 7). Among all the risk indicators, lake residence period (C2.8), landscape connectivity (C2.2), and eutrophication status (C2.9) were the major risk factors. These risk factors have to be considered carefully in the management and repair process of urban lakes. The biomass of large aquatic plants (C2.13), utilization of water resources (C1.2), environmental investment index (C3.4), and population density (C1.1) were the secondary risk index, and the remaining factors were micro risk indicators.
Lake residence period is used to characterize the temporal characteristics of the water body’s exchange with the outside world. It refers to the time required for all water exchanges to be renewed once and is also an important index to determine the hydrodynamic condition of lakes. Different countries have different definitions, such as water retention time in Brazil [52] and water exchange activity period in the former Soviet Union [53]. In this study, the lake residence period of the lake represents the hydrological and hydrodynamic characteristics of the lake.
Lianshi Lake is an artificial lake. Due to water shortages in northern China, the water in the lake is a typical sluggish water body, containing water, sand, and pollutants from different sources. Under the action of the complex hydrodynamic environment of lake water, the lake residence period and transmission time have seriously affected the migration and transformation of pollutants in the lake area, which has brought significant impacts on the spatial and temporal changes of lake water quality, resulting in serious damage to the health of the lake. By adjusting the cycle of changing water and increasing the frequency of water exchanges, the quality of the lakes will be greatly improved. Hu et al. [49] studied the ecological restoration of Taihu Lake and found that the diversion of water from the Yangtze River improved the lake residence period of Taihu Lake and restored its ecology. Lindstrom et al. [48] found that the distribution of a freshwater bacteria group was also related to the lake residence period of lakes. Li et al. [54] studied the lake residence period and transmission time of Poyang Lake and the Yangtze River, and then studied the water quality change of Poyang Lake. Catalán et al. [51] found that the decomposition rate of organic carbon was controlled by the water retention time of inland waters. It can be concluded that it is an important link for lake ecosystem restoration to consider the lake residence period as a key risk indicator for lake ecosystem restoration.
Landscape connectivity is described from an ecological perspective and represents the integrity of the lake ecosystem. The urbanization process keeps advancing, which leads to the change of landscape spatial form and the increasingly serious fragmentation, thus changing landscape connectivity. The connectivity of natural habitats plays a crucial role in ecological processes that maintain biodiversity and the healthy integrity of ecosystems. An important aspect of lake ecosystem health is the maintenance of biodiversity and ecosystem integrity, and the stability and sustainable development of the ecosystem. Brudvig et al. [55] pointed out that landscape connectivity promoted the overflow of plant diversity to non-target habitats. Kramer-Schadt et al. pointed out that fragmented landscape and patch connectivity had a significant impact on the spread of Eurasian lynx. Therefore, it is reasonable to focus on landscape connectivity as an important risk indicator of Lianshi Lake, which is conducive to the restoration of fragmented landscape and the restoration of biodiversity and ecosystem integrity.
Eutrophication states describe the characteristics of water quality and represent the availability of lake water. Eutrophication refers to the massive increase of nitrogen, phosphorus, and other vital elements necessary for plant growth in water bodies, which increase the productivity of aquatic ecosystems and leads to not only blooms of cyanobacteria but also the extinction of submerged plants. Lake eutrophication has an important effect on the diversity of lake ecosystems [56]. According to the ecological law, it will inevitably damage the stability of the ecosystem and affect the health of the lakes. From the perspective of the stability of the lake ecosystem, lake eutrophication, as a key risk factor, is the primary consideration in restoration, which is conducive to the restoration of the biodiversity of the lake and its restoration to a healthy state. Related studies have shown that following eutrophication of lakes, although water quality indicators and plant and animal community structure may be restored with eutrophication treatment, careful comparison of some zooplankton gene fragments shows that their evolutionary trajectory has changed and they cannot simply return to the original state and level [57].
These three factors constitute the basis of ecosystem health and are the key targets of ecological restoration. In restoration design planning, a priority order of restoration needs to be determined according to the identification results to facilitate focused planning and ensure the success of the restoration project.

3.3. Understanding of Integrated Lake Management

In evaluating the health of urban lakes, selecting the evaluation index by considering only the aspect of nature is inadequate and unsuitable. The evaluation index should be selected comprehensively, taking into account the aspect of nature–society duality. From the perspective of sustainable development, lake restoration must start from the problem source, accurately determine the risk factors affecting lake health, and adopt a strategy of high-risk treatment, medium-risk control, and low-risk prevention to control lake health comprehensively.
Because of differences in geographical location, climate, and levels of urban development, the state of different lakes will differ substantially. Therefore, a programme of "one lake, one policy" has to be implemented [58]. Lake restoration can be carried out in a sequence of steps, namely assessing health status, identifying risk factors, overall system planning, formulating specific plans, implementing restoration measures, monitoring restoration effects, and the post-restoration evaluating of projects. Accordingly, the risk classification of lake health indicators should provide a roadmap to treat high-risk indicators, control medium-risk indicators, and prevent low-risk indicators.
In conclusion, in the process of restoration, attention must not only be focused on the lake itself but also on factors such as the environment around the lake and the water ecosystem. Lake restoration requires comprehensive planning and accurate identification of the risk factors, with the aim being to achieve sustainable development. To achieve sustainable lake management, society (the city) and nature (the lake) need to be considered in a unified manner.

4. Conclusions

In this study, an evaluation framework was established with the aim of improving the health status of urban lakes. The entire framework consisted of four modules: the screening module (M1), weight determination module (M2), risk factor identification module (M3), and the comprehensive health evaluation module (M4). We used the evaluation framework to assess the health of Lianshi Lake in Beijing, China. Our results indicated the state of this lake to be sub-healthy.
We employed the concepts of standard differential rate and risk degree (insurance degree). We used the ABC method to classify the indicators of all the risk areas, and these indicators were divided into major, secondary, and micro risk indicators. We found that the lake residence period, landscape connectivity, and eutrophication were major risk indicators.
In the selection of evaluation indicators, although many factors were considered, various deficiencies remained relevant to the integrity and representativeness of the selected indicators. The amount of data required was limited by the relatively short period during which research has been conducted on the health of lakes.
The lack of monitoring data from the relatively short historical period of lakes being affected significantly by human activities made it difficult to obtain reference background values, which led directly to an inability to determine a more realistic evaluation standard threshold. Therefore, the establishment of a long-term monitoring system for lake health, formation of an extensive series of data, and the establishment of a lake health database are urgent needs for the health assessment and sustainable development of the urban lake ecosystem in China.

Author Contributions

W.S., J.W. and B.Z. designed the research; W.S., K.C. and W.P. performed the experiments and analyzed the data; W.S. and B.H. collected measured data; all authors contributed to manuscript writing; W.S., J.W. and K.C. revised the manuscript. All authors have read and agreed to the published version of the manuscript.

Funding

This research was supported by the Major Science and Technology Program for Water Pollution Control and Treatment (No.2018ZX07101005).

Acknowledgments

We thank Min Zhang and Shunxin Feng for providing hydrobiological data and hydrological data; Huihuang Luo for assistance with fieldwork. We would like to thank Editage (www.editage.cn) for English language editing.

Conflicts of Interest

The authors declare no conflict of interest.

References

  1. Vitousek, P.M.; Mooney, H.A.; Lubchenco, J.; Melillo, J.M. Human domination of Earth′s ecosystems. Science 1997, 277, 494–499. [Google Scholar] [CrossRef] [Green Version]
  2. Daily, G. Developing a scientific basis for managing Earth’s life support systems. Conserv. Ecol. 1999, 3, 14. [Google Scholar] [CrossRef] [Green Version]
  3. Daily, G.C.; Söderqvist, T.; Aniyar, S. The value of nature and the nature of value. Science 2000, 289, 395–396. [Google Scholar] [CrossRef] [Green Version]
  4. Schaeffer, D.J.; Herricks, E.E.; Kerster, H.W. Ecosystem health: I. Measuring ecosystem health. Environ. Manag. 1988, 12, 445–455. [Google Scholar] [CrossRef]
  5. Ryder, R.A. Ecosystem health, a human perception: Definition, detection, and the dichotomous key. J. Great Lakes Res. 1990, 16, 619–624. [Google Scholar] [CrossRef]
  6. Robert, C.; Michael, M. What is a healthy ecosystem? Aquatic Ecol. 1999, 33, 105–115. [Google Scholar] [CrossRef]
  7. Vörösmarty, C.J.; Mcintyre, P.B.; Gessner, M.O.; Dudgeon, D.; Prusevich, A.; Green, P.; Glidden, S.; Bunn, S.E.; Sullivan, C.A.; Liermann, C.R. Global threats to human water security and river biodiversity. Nature 2010, 467, 555–561. [Google Scholar] [CrossRef]
  8. Su, M.R.; Zhang, Y.; Liu, G.Y.; Xu, L.Y.; Zhang, L.X.; Yang, Z.F. Urban Ecosystem Health Assessment: Perspectives and Chinese Practice. Int. J. Environ. Res. Public Health 2013, 10, 5874–5885. [Google Scholar] [CrossRef] [Green Version]
  9. Rapport, D. Ecosystem Health: Exploring the Territory. Ecosyst. Health 1995, 1, 5–13. [Google Scholar]
  10. Loreau, M. Biodiversity and Ecosystem Functioning: Current Knowledge and Future Challenges. Science 2001, 294, 804–808. [Google Scholar] [CrossRef] [Green Version]
  11. Diaz, R.J.; Solan, M.; Valente, R.M. A review of approaches for classifying benthic habitats and evaluating habitat quality. J. Environ. Manag. 2004, 73, 165–181. [Google Scholar] [CrossRef] [PubMed]
  12. Zhang, L.L.; Liu, J.L.; Yang, Z.F.; Li, Y.; Yang, Y. Integrated ecosystem health assessment of a macrophyte-dominated lake. Ecol. Modell. 2013, 252, 141–152. [Google Scholar] [CrossRef]
  13. Hannon, B. Ecosystem flow analysis. Can. Bull. Fish. Aquat. Sci. 1985, 213, 97–118. [Google Scholar] [CrossRef]
  14. Karr, J.R.; Fausch, K.D.; Angermeier, P.L.; Yant, P.R.; Schlosser, I.J. Assessing biological integrity in running water: A method and its rationale. INHS 1986, 5, 1–27. [Google Scholar]
  15. Rapport, D.J.; Regier, H.A.; Hutchinson, T.C. Ecosystem behavior under stress. Am. Nat. 1985, 125, 617–640. [Google Scholar] [CrossRef]
  16. Ulanowicz, R.E. Growth and development: Ecosystems phenomenology. Q. Rev. Biol. 1988, 156–162. [Google Scholar] [CrossRef]
  17. Costanza, R. The Value of the world′s ecosystem services and natural capital. Nature 1998, 387, 253–260. [Google Scholar] [CrossRef]
  18. Jørgensen, S.E. The application of ecological indicators to assess the ecological condition of a lake. Lakes Reserv. Res. Manag. 1995, 1, 177–182. [Google Scholar] [CrossRef]
  19. Jørgensen, S.E. Exergy and ecological buffer capacities as measures of ecosystem health. Ecosyst. Health 1995, 1, 150–160. [Google Scholar]
  20. Xu, F.L.; Jørgensen, S.E.; Tao, S. Ecological indicators for assessing freshwater ecosystem health. Ecol. Modell. 1999, 116, 77–106. [Google Scholar] [CrossRef]
  21. Xu, F.L.; Tao, S.; Dawson, R.W.; Li, P.G.; Cao, J. Lake ecosystem health assessment: Indicators and methods. Water Res. 2001, 35, 3157–3167. [Google Scholar] [CrossRef]
  22. Xu, F.L.; Zhao, Z.Y.; Zhan, W.; Zhao, S.S.; Dawson, R.W.; Tao, S. An ecosystem health index methodology (EHIM) for lake ecosystem health assessment. Ecol. Modell. 2005, 188, 327–339. [Google Scholar] [CrossRef]
  23. Zeng, R.; Zhao, Y.W.; Yang, Z.F. Emergy-based health assessment of baiyangdian watershed ecosystem in temporal and spatial scales. Procedia Environ. Sci. 2010, 2, 359–371. [Google Scholar] [CrossRef] [Green Version]
  24. Xu, F.; Yang, Z.F.; Chen, B.; Zhao, Y.W. Ecosystem health assessment of the plant-dominated Baiyangdian Lake based on eco-exergy. Ecol. Modell. 2011, 222, 201–209. [Google Scholar] [CrossRef]
  25. Petesse, M.L.; Siqueira-Souza, F.K.; de Carvalho Freitas, C.E.; Petrere, M. Selection of reference lakes and adaptation of a fish multimetric index of biotic integrity to six Amazon floodplain lakes. Ecol. Eng. 2016, 97, 535–544. [Google Scholar] [CrossRef]
  26. Du, G.S.; Wang, J.T.; Zhang, W.H. The Analysis of trophic state of urban rivers and lakes in Beijing. J. Lake Sci. 2002, 6, 25–28. (In Chinese) [Google Scholar]
  27. Zhang, F.L.; Liu, J.L.; Yang, Z.F.; Li, Y.L. Ecosystem health assessment of urban rivers and lakes. Front. Environ. Sci. Eng. 2008, 2, 209–217. [Google Scholar] [CrossRef]
  28. Wang, W.; Tang, X.Q.; Huang, S.L.; Zhang, S.H.; Lin, C.; Liu, D.W.; Che, H.J.; Yang, Q.; Scholz, M. Ecological restoration of polluted plain rivers within the haihe river basin in China. Water Air Soil Pollut. 2010, 211, 341–357. [Google Scholar] [CrossRef]
  29. Wang, X.; Li, J.Q.; Li, Y.X.; Shen, Z.Y.; Wang, X.; Yang, Z.F. Is urban development an urban river killer? A case study of Yongding diversion channel in Beijing, China. J. Environ. Sci. 2014, 1232–1237. [Google Scholar] [CrossRef]
  30. Ministry of Environmental Protection. Water Quality—Determination Of The Chemical Oxygen Demand—Dichromate Method; Ministry of Environmental Protection: Beijing, China, 2017; Volume HJ 828-2017, Available online: https://www.eiacloud.com/hpy/lawstandardApp/shareDetailsView?id=489b4d74883c437b8b26f33a6a46e017&phoneId=23EBB12F-0479-40AC-96C1-04B14D561DBF (accessed on 30 March 2017).
  31. Ministry of Environmental Protection. Water Quality—Determination of Chlorophyll A—Spectrophotometric Method; Ministry of Environmental Protection: Beijing, China, 2017; Volume HJ 897-2017, Available online: https://www.eiacloud.com/hpy/lawstandardApp/shareDetailsView?id=fb4acb540a1a4df19755a301dc87ab3c&phoneId=23EBB12F-0479-40AC-96C1-04B14D561DBF (accessed on 21 December 2017).
  32. Ministry of Environmental Protection. Environmental Quality Standards for Surface Water; Ministry of Environmental Protection: Beijing, China, 2002; Volume GB 3838-2002, Available online: https://www.eiacloud.com/hpy/lawstandardApp/shareDetailsView?id=298&phoneId=23EBB12F-0479-40AC-96C1-04B14D561DBF (accessed on 26 April 2002).
  33. Xu, W.J.; Cao, S.L. Health Assessment of Urban Lake Ecosystem Based on PSR-Entropy Weight Comprehensive Health Index Method. J. China Hydrol. 2010, 30, 64–68. [Google Scholar] [CrossRef]
  34. Neri, A.C.; Dupin, P.; Sánchez, L.E. A pressure–state–response approach to cumulative impact assessment. J. Clean. Prod. 2016, 126, 288–298. [Google Scholar] [CrossRef]
  35. Zhao, Y.W.; Zhou, L.Q.; Dong, B.Q.; Dai, C. Health assessment for urban rivers based on the pressure, state and response framework—A case study of the Shiwuli River. Ecol. Indic. 2019, 99, 324–331. [Google Scholar] [CrossRef]
  36. Pan, N.F. Fuzzy AHP approach for selecting the suitable bridge construction method. Automat. Constr. 2008, 17, 958–965. [Google Scholar] [CrossRef]
  37. Saaty, T.L.; Shang, J.S. An innovative orders-of-magnitude approach to AHP-based mutli-criteria decision making: Prioritizing divergent intangible humane acts. Eur. J. Oper. Res. 2011, 214, 703–715. [Google Scholar] [CrossRef]
  38. Sutadian, A.D.; Muttil, N.; Yilmaz, A.G.; Perera, B.J.C. Using the analytic hierarchy process to identify parameter weights for developing a water quality index. Ecol. Indic. 2017, 75, 220–233. [Google Scholar] [CrossRef]
  39. Peng, T.; Wang, Z.; Zhao, Q.; Guo, Q. Ecosystem health assessment for Huangbai River based on PSR model. Water Resour. Prot. 2016, 32, 141–153. (In Chinese) [Google Scholar]
  40. Jin, H.Y. Application of comprehensive nutritional state index method in evaluation of nutritional status of water quality in large and medium-sized Reservoir in Kaixian. J. Anhui Agric. Sci. 2014, 42, 1808–1809. (In Chinese) [Google Scholar]
  41. Zuo, H.; Ma, X.L.; Chen, Y.Z.; Liu, Y. Studied on distribution and heavy metal pollution index of heavy metals in water from upper reaches of the Yellow River, China. Spectrosc. Spect. Anal. 2016, 36, 3047–3052. [Google Scholar] [CrossRef]
  42. Mahmood, R.; Jia, S.F. Assessment of hydro-climatic trends and causes of dramatically declining stream flow to Lake Chad, Africa, using a hydrological approach. Sci. Total Environ. 2019, 675, 122–140. [Google Scholar] [CrossRef]
  43. Cui, B.S.; Zhao, X.; Yang, Z.F. Eco-hydrology-based calculat ion of the minimum ecological water requirement for lakes. Acta Ecol. Sin. 2005, 25, 1788–1795. (In Chinese) [Google Scholar]
  44. Liu, J.L.; Ma, M.Y.; Zhang, F.L.; Yang, Z.F.; Domagalski, J. The ecohealth assessment and ecological restoration division of urban water system in Beijing. Ecotoxicology 2009, 18, 759–767. [Google Scholar] [CrossRef] [PubMed]
  45. Su, M.R.; Yang, Z.F.; Chen, B. Set pair analysis for urban ecosystem health assessment. Commun. Nonlinear Sci. Numer. Simul. 2009, 14, 1773–1780. [Google Scholar] [CrossRef]
  46. Wang, W.S.; Jin, J.L.; Ding, J.; Li, Y.Q. A new approach to water resources system assessment—Set pair analysis method. Sci. China Ser. E 2009, 52, 3017–3023. [Google Scholar] [CrossRef]
  47. Kramer-Schadt, S.; Revilla, E.; Wiegand, T.; Breitenmoser, U. Fragmented landscapes, road mortality and patch connectivity: Modelling influences on the dispersal of Eurasian lynx. J. Appl. Ecol. 2004, 41, 711–723. [Google Scholar] [CrossRef] [Green Version]
  48. Lindstrom, E.S.; Kamst-Van Agterveld, M.P.; Zwart, G. Distribution of typical freshwater bacterial groups is associated with pH, temperature, and lake water retention time. Appl. Environ. Microbiol. 2006, 71, 8201–8206. [Google Scholar] [CrossRef] [PubMed] [Green Version]
  49. Hu, W.P.; Zhai, S.J.; Zhu, Z.C.; Han, H.J. Impacts of the Yangtze River water transfer on the restoration of Lake Taihu. Ecol. Eng. 2008, 34, 30–49. [Google Scholar] [CrossRef]
  50. Li, Y.L.; Jing, Y. Estimation of transport trajectory and residence time in large river-lake systems: Application to Poyang Lake (China) using a combined model approach. Water 2015, 5203–5223. [Google Scholar] [CrossRef] [Green Version]
  51. Catalán, N.; Marcé, R.; Kothawala, D.N.; Tranvik, L.J. Organic carbon decomposition rates controlled by water retention time across inland waters. Nat. Geosci. 2016, 9, 502–504. [Google Scholar] [CrossRef]
  52. Soares, M.C.S.; Marinho, M.M.; Huszar, V.L.M.; Branco, C.W.C.; Azevedo, S.M.F.O. The effects of water retention time and watershed features on the limnology of two tropical reservoirs in Brazil. Lakes Reserv. Res. Manag. 2008, 13, 257–269. [Google Scholar] [CrossRef]
  53. Deason, J.P.; Daane, J.D. Water meterinq dolicies in the former Soviet Union: Lessons from Lviv, Ukraine. Environ. Eng. Pol. 1998, 1, 75–80. [Google Scholar] [CrossRef]
  54. Li, Y.L.; Zhang, Q.; Yao, J. Investigation of residence and travel times in a large floodplain lake with complex lake–river interactions: Poyang Lake (China). Water 2015, 7, 1991–2012. [Google Scholar] [CrossRef] [Green Version]
  55. Brudvig, L.A.; Damschen, E.I.; Tewksbury, J.J.; Haddad, N.M.; Levey, D.J. Landscape connectivity promotes plant biodiversity spillover into non-target habitats. Proc. Natl. Acad. Sci. USA 2009, 106, 9328–9332. [Google Scholar] [CrossRef] [PubMed] [Green Version]
  56. Florencia Gutierrez, M.; Tavsanoglu, U.N.; Vidal, N.; Yu, J.L.; Teixeira-de Mello, F.; Cakiroglu, A.I.; He, H.; Liu, Z.; Jeppesen, E. Salinity shapes zooplankton communities and functional diversity and has complex effects on size structure in lakes. Hydrobiologia 2018, 813, 237–255. [Google Scholar] [CrossRef]
  57. Brede, N.; Sandrock, C.; Straile, D.; Spaak, P.; Jankowski, T. The impact of human-made ecological changes on the genetic architecture of Daphnia species. Proc. Natl. Acad. Sci. USA 2009, 106, 4758–4763. [Google Scholar] [CrossRef] [PubMed] [Green Version]
  58. Wang, L.F.; Tong, J.X.; Li, Y. River Chief System (RCS): An experiment on cross-sectoral coordination of watershed governance. Front. Environ. Sci. Eng. 2019, 13, 1–3. [Google Scholar] [CrossRef]
Figure 1. Location of Lianshi Lake.
Water 12 01428 g001
Figure 2. Framework for urban lake health evaluation.
Water 12 01428 g002
Figure 3. Connection degree of the assessment standards and assessment indices.
Water 12 01428 g003
Figure 4. Weight distribution diagram of the standard difference rate.
Water 12 01428 g004
Figure 5. Partition map of the risk of the index.
Water 12 01428 g005
Figure 6. Relationships between modules in the pressure–state–response (PSR) framework.
Water 12 01428 g006
Figure 7. Risk classification chart of the evaluation indices.
Water 12 01428 g007
Table 1. Health quality evaluation system for urban lakes.
Objective Layer AIntegrity Criterion Layer B (Weight)Index Layer CUnitCalculation ResultIndex Layer C
Peer WeightGlobal Weight
Lake Ecological Health APressure B1 (0.1643)Population density C1.1Person/km21640.14770.0241
Utilization of water Resources C1.2%220.16350.0267
Intensity of pesticide application C1.3kg/hm2320.32700.0534
Intensity of fertilizer application C1.4kg/hm218300.36180.0591
State B2 (0.5396)Natural rate of lakeside zone C2.1%790.04460.0241
Landscape connectivity C2.2time/10 km120.02190.0406
The width of the landward radiation belt of the lakeside belt C2.3m47.80.04180.0226
Coefficient of shoreline development C2.4/5.60.02760.0149
Compactness C2.5/0.040.02180.0118
Shape ratio C2.6/0.030.02190.0118
Minimum ecological water requirement C2.7%740.07610.0411
Lake residence period C2.8Day/time1730.12940.0698
Eutrophication status C2.9/52.60.15060.0813
Heavy metal pollution index C2.10/960.06020.0325
Water qualification rate C2.11%750.16610.0896
Zooplankton diversity index C2.12/1.440.05260.0284
Biomass of large aquatic plants C2.13mg/L46.70.06480.0349
Phytoplankton diversity index C2.14/1.770.06350.0343
Benthic biodiversity index C2.15/1.10.03830.0207
Response B3 (0.2970)Public satisfaction C3.1point840.12890.0383
Degree of perfection of relevant laws and regulations C3.2point850.16060.0477
Degree of perfection of management functions C3.3point750.14810.0440
Environmental investment index C3.4%1.70.18450.0548
Regional population quality C3.5%0.230.37780.1122
Table 2. Calculation methods of different indicators and related data sources.
Integrity Criterion Layer B (Weight)Index Layer CUnitCalculationData Sources
Pressure B1
[39]
Population density (C1.1)Person/km2Urban lake area population/Lake areaPopulation and area statistics
Utilization of water resources (C1.2)%Exploitation and utilization of lake water resources/Total lake water resourcesBeijing water resources bulletin (2018) and development utilization statistics (2018)
Intensity of pesticide application (C1.3)kg/hm2Actual application amount of cultivation-related agricultural pesticides p.a./Agricultural acreageStatistical data on actual pesticide use and census data on cultivated land area
Intensity of fertilizer application (C1.4)kg/hm2Actual application amount of cultivation land chemical p.a./Agricultural acreageStatistical data on actual use of chemical fertilizer and census data on cultivated land area
State B2
[40,41,42,43]
Natural rate of lakeside zone (C2.1)%Unspoiled area of a lakeside/Total area of lakeside zoneEcological environment survey of lakeside zone
Landscape connectivity (C2.2)time/kmLakeside interrupted by buildings (>100 m) for every 10 kmEcological environment survey of lakeside zone
Width of landward radiation belt of the lakeside belt (C2.3)mWidth of the lakeside zone along the lake shorelineArithmetic average of multi-section monitoring data obtained according to selected sampling zone
Coefficient of shoreline development (C2.4)/ D L = S L 2 π A Lake shoreline length and lake area size obtained from remote sensing data
Compactness (C2.5)/ F R = A L 2 The longest axis length and size of lake area obtained from remote sensing data
Shape ratio (C2.6)/ C = A A 0 Minimum circumferential circle A calculated from measurement data, and size of lake area obtained from remote sensing data
Minimum ecological water requirement guarantee rate (C2.7)%Time to reach minimum ecological water requirement/Total timeBased on the principle of ecological hydrology, the water resource function of the lake was analyzed according to monitoring statistics, and the minimum ecological water demand was calculated
Lake residence period (C2.8)Day/timeAverage number of days a lake is updated onceStatistics from lake management department
Eutrophication status (C2.9)/ T L I ( ) = j = 1 m W j × T L I ( j ) Nutritional status index of each parameter obtained by field monitoring data
Heavy metal pollution index (C2.10)/ H P I = i = 1 n W i Q i i = 1 n W i Indicators obtained from water quality monitoring data
Water qualification rate (C2.11)%Monitoring frequency in compliance with specified water quality standards/Total monitoring timesLake water quality data obtained by field investigation and sampling
Zooplankton diversity index (C2.12)/ H = ( N i / N ) log 2 ( N i / N ) Individual number of zooplankton and individual number of total species obtained by water samples
Biomass of large aquatic plants (C2.13)mg/LDensity of large aquatic plants in lakesField sampling, survey statistics
Phytoplankton diversity index (C2.14)/ H = ( N i / N ) log 2 ( N i / N ) Individual number of phytoplankton and individual number of total species obtained by water samples
Benthic biodiversity index (C2.15)/ H = ( N i / N ) log 2 ( N i / N ) Individual number of benthic animals and total number of species obtained from our survey
Response B3
[39]
Public satisfaction (C3.1)pointSatisfaction of public investigated and scored through questionnairesData obtained from questionnaire survey
Degree of perfection of relevant laws and regulations (C3.2)pointRelevant questionnaires, staff familiar with laws and regulations scoreData obtained from questionnaire survey
Degree of perfection of management functions (C3.3)/Staff familiar with lake management measures scored through relevant questionnairesData obtained from questionnaire survey
Environmental investment index (C3.4)%Total environmental investment/Proportion of GDPConsulted environmental protection department and obtained statistical data
Regional population quality (C3.5)%Number of illiterate/Regional populationStatistical data
Table 3. Assessment criteria of each health level.
IndexUnitHealthy
(Level Ⅰ)
Sub-Healthy
(Level Ⅱ)
Unhealthy
(Level Ⅲ)
Morbid
(Level Ⅳ)
C1.1Person/km2C < 100100 ≤ C < 300300 ≤ C < 500C ≥ 500
C1.2%C < 1010 ≤ C < 2020 ≤ C < 40C ≥ 40
C1.3kg/hm2C < 3030 ≤ C < 6060 ≤ C < 90C ≥ 90
C1.4kg/hm2C < 15001500 ≤ C < 30003000 ≤ C < 4500C ≥ 4500
C2.1%100 > C ≥ 8080 > C≥6060 > C ≥ 40C < 40
C2.2time/kmC < 22 ≤ C < 66 ≤ C < 10C ≥ 10
C2.3mC ≥ 5050 > C ≥ 3030 > C ≥ 10C < 10
C2.4/C ≥ 66 > C ≥ 22 > C ≥ 0.5C < 0.5
C2.5/C ≥ 0.50.5 > C ≥ 0.30.3 > C ≥ 0.1C < 0.1
C2.6/C ≥ 0.50.5 > C ≥ 0.30.3 > C ≥ 0.1C < 0.1
C2.7%100 > C ≥ 9090 > C ≥ 7575 > C ≥ 50C < 50
C2.8Day/timeC < 2020 ≤ C < 4040 ≤ C < 90C ≥ 90
C2.9/C < 3030 ≤ C < 5050 ≤ C < 70C ≥ 70
C2.10/C < 150150 ≤ C < 300300 ≤ C < 1200C ≥ 1200
C2.11%C ≥ 8080 > C ≥ 7070 > C ≥ 60C < 60
C2.12/C ≥ 1.51.5 > C ≥ 0.80.8 > C ≥ 0.2C < 0.2
C2.13mg/LC ≥ 10001000 > C ≥ 500500 > C ≥ 100C < 100
C2.14/C ≥ 1.51.5 > C ≥ 0.80.8 > C ≥ 0.2C < 0.2
C2.15/C ≥ 1.51.5 > C ≥ 0.80.8 > C ≥ 0.2C < 0.2
C3.1pointC ≥ 9090 > C ≥ 8080 > C ≥ 70C < 70
C3.2pointC ≥ 9090 > C ≥ 7070 > C ≥ 60C < 60
C3.3pointC ≥ 9090 > C ≥ 7070 > C ≥ 60C < 60
C3.4%C ≥ 2.52.5 > C ≥ 22 > C ≥ 1.5C < 1.5
C3.5%C < 33≤C < 66≤C < 12C≥12
C in each row represents the value of the row index.
Table 4. Ecosystem health status scale.
Health ClassificationHealth StatusEcosystem Characteristics
Level IHealthy
(3–5)
Ecological structure is reasonable, the system is highly dynamic, external pressure is small, no ecological abnormality, perfect ecological function, system is in stable and sustainable state
Level ⅡSub-healthy
(2–3)
Ecological structure is reasonable, pattern is still perfect, system is vigorous, external pressure is small, no ecological abnormality, ecosystem function relatively perfect, system still stable, ecosystem sustainable
Level ⅢUnhealthy
(1–2)
Ecological structure reasonable, pattern is still perfect, external pressure relatively large, close to ecological threshold, more sensitive areas, a few ecological abnormalities, able to function ecologically, ecosystem can be maintained
Level ⅣMorbid
(0–1)
Ecological structure is defective, system vitality low, external pressure is great, ecological function cannot meet the needs of maintaining the region, ecological system begins to degenerate
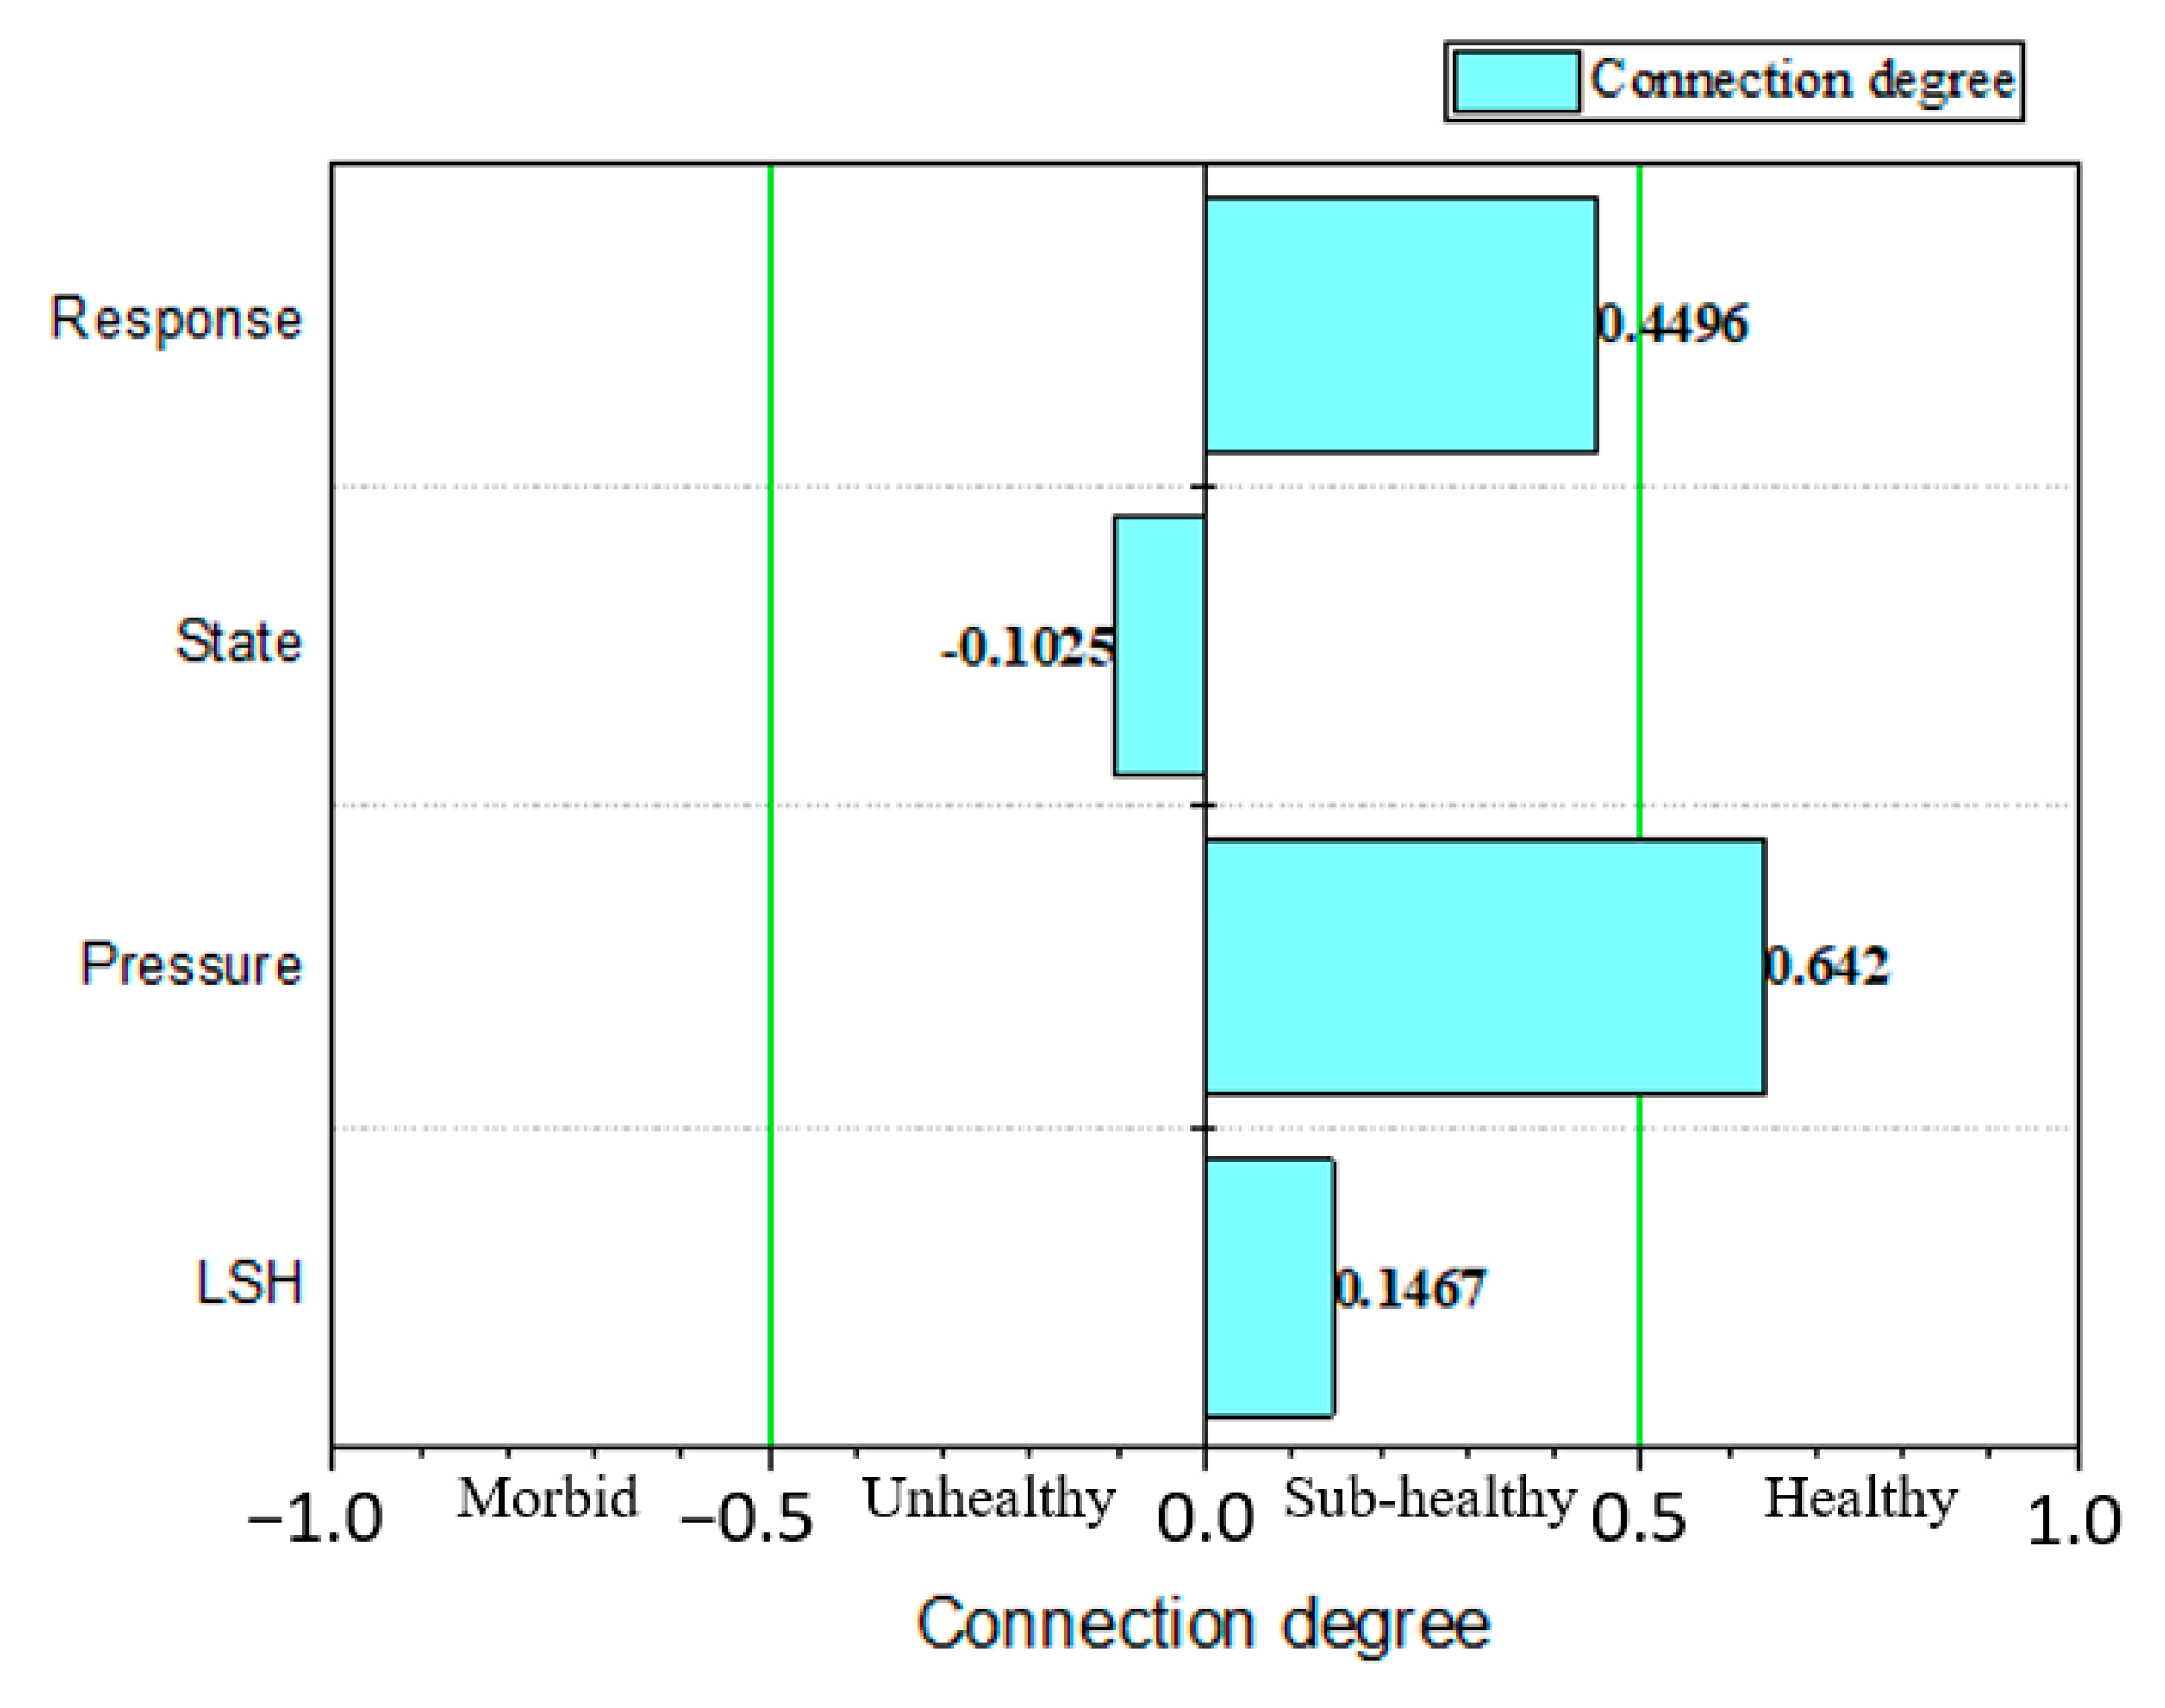
Table 5. Expression of the connection degree of the total index and the submodule.
IndexConnection Degree of Comprehensive AssessmentResult
Lake healthy μ = 0.3079 + 0.3134 i 1 + 0.1976 i 2 + 0.1998 j 0.1467
Pressure μ = 0.5393 + 0.3844 i 1 + 0.0764 i 2 0.6420
State μ = 0.1550 + 0.3019 i 1 + 0.2199 i 2 + 0.2848 j −0.1025
Response μ = 0.4581 + 0.2951 i 1 + 0.2098 i 2 + 0.0369 j 0.4496

