Article

The Urgent Need for River Health Biomonitoring Tools for Large Tropical Rivers in Developing Countries: Preliminary Development of a River Health Monitoring Tool for Myanmar Rivers

1
Department of Water Management, Delft University of Technology, Stevinweg 1, 2628CN Delft, The Netherlands
2
Department of Ecology, Environment and Evolution, La Trobe University, Wodonga 3690, Australia
3
Institute of Land Water and Society, Charles Sturt University, Elizabeth Mitchell Dr., Albury 2640, Australia
4
Department of Water Resources and Ecosystems, IHE Delft, Westvest 7, 2611 AX Delft, The Netherlands
*
Author to whom correspondence should be addressed.
These authors contributed equally to this work.
Water 2020, 12(5), 1408; https://doi.org/10.3390/w12051408
Submission received: 28 February 2020 / Revised: 11 May 2020 / Accepted: 12 May 2020 / Published: 15 May 2020

Abstract

:
Anthropogenic pressures such as river infrastructure, agriculture and power generation are rapidly increasing in Southeast Asia, aimed at providing food security within the region. However, this will lead to unintended river health consequences, and, currently, most Southeast Asian countries have no country-specific tools for monitoring river health. In Myanmar, one of Southeast Asia’s poorest and most rapidly developing countries, no country-specific tools exist, and there is an urgent need to provide tools that can inform better management and trade-off decision making. This research evaluated three rapid macroinvertebrate bioassessment methods under Myanmar conditions. The objective of the research was to assess the applicability of existing internationally accepted indexing methods for use in Myanmar. Through taxa identification in the laboratory and statistical analysis, it was concluded that the method with the best fit for Myanmar taxa is The Asia Foundation index method, although differences were small. This Asia Foundation method is comparable to the Australian Waterwatch method but includes a family present in our samples that is not included in the Waterwatch method. We then modified this method to include Myanmar taxa not recorded in The Asia Foundation method. The modified index method could be further developed into a Myanmar specific tool for widespread use potentially in combination with the also tested miniSASS, a much easier order-based method better suitable for non-professionals. We recommend additional testing using sites on other rivers across the country to establish a professional indexing method for Myanmar.

1. Introduction

Anthropogenic activities in developing countries such as river regulation and pollution have a potentially negative cumulative impact on rivers and wetlands water quantity and quality, hence negatively impacting on river-dependent people, often the poorest people in a region [1,2]. Dudgeon [3] pointed to the fact that the deterioration in river water quality is increasing in developing countries, particularly in Southeast Asian (SE Asia) countries. Hughes [4] also found that SE Asia is a popular global hotspot of biodiversity, but also known as the most biologically threatened region by anthropogenic activities. Additionally, the scarcity of useful monitoring tools hinders informing managers of the health of all waterways and possible management actions required [5].
A growing interest in low-cost river health monitoring approaches has introduced different rapid assessment methods using aquatic macroinvertebrates communities [6,7]. The idea of designing these approaches was to make a scientifically reliable, rapid and low-cost technique that could be an alternative to physical and chemical methods to monitor river water quality by both scientist and non-scientist [8,9].
The most frequently used methods are scoring based that involve identifying the present taxa with or without their abundance to calculate the ecological water quality index or class [10]. The score of individual taxa indicates the level of tolerance to water quality [9]. The scoring system approach calculates the ecological water quality index based on average score per taxon (ASPT). ASPT can be calculated by dividing the sum of score per present taxa by the total number of scoring taxa. The highest number of taxa with the highest number of abundance gives the high value of ASPT which can classify a better level of river water quality [11].
Although there are some assessments of biomonitoring protocols using species-level taxonomy [12], most scoring methods rely on identification to family-level taxonomy [13]. Family level identification has the issue of reducing the information which can be extracted from the macroinvertebrate community data compared with species identification. Each species has an ecological range of tolerances to environmental conditions, whereas, at the family-level, there is a much wider range of tolerances.
Consequently, there is considerable literature comparing the two levels of identification, with some arguing that the family-level loses information and is not as robust as species-level identification [14]. Armitage et al. [10] declared that the community-based family level rapid approaches based on score systems could lose detailed ecological information, but it has value because local citizens can use it so they can be involved in regional water resources management decisions. A review of the literature showed that there is no particular index value which can satisfy all requirement for universal application as they have been developed at the local scale for a specific country [10,15], for example Britain biotic indices (Biological Monitoring Working Party (BMWP)) and Australian biotic indices (Stream Invertebrate Grade Number Average Level (SIGNAL)).
Transferability of methods developed in one area and applied in another, although cost and time efficient, depends on a number of factors and testing within the local conditions is critical [16]. When considering transferring methods from one country or river type to another, species are often different and may not occur in a specific research area, which complicates universal use in areas where methods do not exist [17]. Therefore, it is essential to know the transferability of existing international standard methods to new areas where they have not yet been tested [5]. There are various national-scale biomonitoring protocols which were developed independently for different regions in the USA, Europe, South Africa, Australia, New Zealand and South Korea based on the objectives and requirements of the various countries [13]. However, there has been limited development for a method for the SE Asian region, except The Asia Foundation method [18].
Myanmar is a SE Asian developing country experiencing rapid growth and it is expected to increase in the coming decades. Negative impacts through water control infrastructure, water abstraction, mining and pollution all have the potential to significantly impact ecosystem integrity in a country where millions are reliant on the ecosystem services that healthy rivers and wetlands provide [19]. Currently, there is no systematic research on aquatic macroinvertebrates of rivers and streams in Myanmar.
To our best knowledge, only a few initial, piloting studies have been performed using biomonitoring. There has been an initial study on aquatic macroinvertebrates by Myanmar Healthy Rivers Initiative (MHRI) in the main stream of the Ayeyarwady River, downstream of Mandalay, and in the lower Salween (also called Thanlwin River), 65 km upstream from the sea [20]. These early studies concluded that aquatic macroinvertebrates communities are not appropriate to use as an indicator to describe river health in the downstream reaches of Myanmar’s large rivers due to the significant flow variation, high sediment loads and unsuitable substrates. Dickens et al. [20] recommended using aquatic macroinvertebrates as an indicator in small streams or tributaries where the riparian, marginal vegetation and flow regime are more stable as compared to large rivers. Eriksen et al. [21] proved that macroinvertebrates could be applied to identify river health in small streams based on their pilot sampling in the Bago River basin.
Therefore, this research was focused on testing a number of internationally developed macroinvertebrate-based rapid assessment methods and evaluating their applicability in Myanmar. The chosen methods included miniSASS (mini Stream Assessment Scoring System) developed in South Africa (www.minisass.org), The Asia Foundation method developed from work in Mongolia and Lao PDR (http://asiafoundation.org), and The Australian Waterwatch developed in Australia (www.nswwaterwatch.org.au/resources). These three methods are widely used techniques in their respective regions. All three methods are rapid field-based score index methods. All methods are similar in that they score macroinvertebrate families in relation to their sensitivity to anthropogenic activities. The scores generally relate to categories related to natural or unmodified condition, with scores progressing downwards to largely modified and poor river health conditions.
The overarching objective of this research was to determine which of the existing internationally accepted indexing methods is most appropriate for use in Myanmar. Hereto, we divided our work into four parts: (1) determine if enough macroinvertebrates across a number of taxa could be collected for further analysis using both rapid assessment methods and laboratory analysis for statistical comparison; (2) access how applicable internationally accepted methods for rapid bioassessment to use in Myanmar; (3) show if modifications would be needed to adapt the method for use in Myanmar; and (4) recommend further development and research of biomonitoring tools required for successful and nation-wide application of biomonitoring in Myanmar, including as citizen science tools.

2. Materials and Methods

2.1. Study Area

It is required to use data from pristine or least disturbed sites because data from impacted sites can give reduced diversity, which can bias the data to communities [22]. However, many of the rivers in Myanmar have already been disturbed by the construction of dams and, unfortunately, political and safety issues often hinder accessibility. Finally, we selected two rivers in Myanmar, namely the Myitnge and Chaungmagyi Rivers (Figure 1), 528 and 100 km long and with 29,630 km2 and 5720 km2 catchment area, respectively. The Myitnge River flows from the hills of eastern Hseni and through Shan state and Mandalay region. The Chaungmagyi River originates from the Shan Plateau of Eastern part of Myanmar and flows to the central part of the country. There are hydropower dams on the Myitnge and Chaungmagyi Rivers of 790 and 25 Megawatt (MW), respectively, in the downstream reaches before they end into the Ayeyarwady River near the Mandalay plain at the central dry zone of the country (Figure 1). The average annual inflows of the Myitnge and Chaungmagyi Rivers are 24 and 2.7 × 10⁹ m3/year, with min and max monthly discharge of 167.06 and 1069.84 m3/s for Myitnge River and 14.17 and 107.52 m3/s for Chaungmagyi River [23].
We collected samples from three sampling sites on upstream sections of both rivers where anthropogenic impacts were minimal to represent our reference sites for analysis. There were two sampling sites on the Myitnge River (MT-1, 22°42′55.39″ N, 97°20′55.33″ E, and MT-2, 22°1′36.09″ N, 96°57′49.74″ E) and one sampling site on the Chaungmagyi River (CM-1, 22°49′28.62″ N, 96°33′32.78″ E). Sites MT-1 and MT-2 are located at 432 and 259 m a.s.l., respectively and Site CM-1 is situated at 680 m a.s.l. We selected sampling sites which had a rocky substrate with vegetation along the edge of the river where suitable habitat for macroinvertebrates is likely to remain even under low water levels. At each site, three samples were collected and this was repeated during two sampling occasions.

2.2. Physico-Chemical Water Quality Variables

We measured four physico-chemical water quality variables at all sampling sites at the time of sampling. We used a pH test strips with a range of 4.5–9.0 and water clarity tubes for in situ monitoring of pH and turbidity (NTU: Nephelometric Turbidity Unit). In addition, we measured electrical conductivity (EC—μS cm−1) and water temperature (Temp—°C) using a multiparameter meter.

2.3. Macroinvertebrates Sampling and Identification

In the period of November–December 2016, three macroinvertebrate samples were collected from each of the three sites. This exact sampling regime was repeated again at each site between February and March 2017. In total, 18 macroinvertebrates samples were available for analysis. At each site, samples were collected from a 5-m transect parallel to the riverbank. We used a kick or sweep net method [13] to collect samples of macroinvertebrates with a five side nylon net (500 and 1000 MU mesh). We held the kick net vertically on the riverbed and disturbed the substrate by kicking the cobbles or by using hands to disrupt the stones so that the macroinvertebrates were washed into the net by the stream flow. We first placed the macroinvertebrates samples in a white plastic tray (30 cm × 30 cm) filled with water. We ‘live-pick’ sorted the macroinvertebrates for the first sample on site. We used the first sample to conduct the rapid assessment using each of the three methods, and then preserved each of the three samples in 70% ethanol for later identification in the laboratory.

2.4. Rapid Assessment Index Methods—Field-Based Testing

In the field at each site, we conducted a live pick and tested against each of the three international rapid biomonitoring methods: miniSASS, The Asia Foundation and Australian Waterwatch. These methods vary in the taxonomic level they use and thereby the complexity. The miniSASS is order based, whereas the Asia Foundation and the Australian Waterwatch methods are based on the score of family level counting (see the Supplementary Materials for more details on the methods). Macroinvertebrates samples collected were identified at family level as one of the protocols for each method. Collected taxa were scored based on a prescribed score per taxon of individual approaches to calculate ASPT. These were then recorded for each method to visualize any major differences while using the different methods in the field and to assess if enough macroinvertebrates were collected to apply the different methods.

2.5. Index and Statistical Analysis

Due to macroinvertebrate keys not existing in Myanmar to date, keys within the texts “Identification of Freshwater Invertebrates of the Mekong River and its Tributaries” by Narumon and Boonsoong [24] and “Tropical Asian Streams” by Dudgeon [3] were used to key species for identification. To be able to assess which of the three international methods was most appropriate for use as an assessment tool for Myanmar, we created a list of family level data derived from laboratory identification to calculate ASPT. We did not consider taxa which were absent in the current three indices methods in the estimating of indices of the three methods.
To test the applicability of three international methods to use in Myanmar rivers, we performed the statistical analysis program PRIMER v6 [25]. We constructed an indices matrix without transformation. We computed the resemblance matrix using Bray-Curtis similarity. Non-metric multidimensional scaling (MDS) was used to display rank order correlation plot with stress values. The MDS plot was used to show rank order distance among samples (dis)similarity calculated by Bray-Curtis [26]. One way analysis of similarity (ANOSIM) and similarity analysis (SIMPER) were carried out using a resemblance matrix by Bray-Curtis similarity. We applied ANOSIM to examine if the indices resemblance matrix differed among all sampling sites. ANOSIM provided a statistical coefficient Global R-value, which highlighted variables separations between the sites [25]. SIMPER was used to analysis the percentage of (dis)similarity between indices variable as a function of sampling sites within the same river, and between different rivers. More importantly, SIMPER also computed the contribution of each indexing method. These contributions were used to show which variables (Indexing methods) supported the percentage of (dis)similarity. All statistical significance for Bray-Curtis, ANOSIM, and SIMPER were to a 0.001 level [25].
To find which indexing method is the most likely to be appropriate with macroinvertebrates of Myanmar, we used the Biota and Environment matching routine (BEST) from PRIMER v6. BEST (Bio-Env) was used to estimate the rank correlation between two resemblance matrices (taxa and indices) [26]. BEST was used to find the best subset of environmental (Indexing methods) variables, which shows strong correlation between the biotic resemblance matrix and the environmental Euclidean distance matrix. We applied the 99 random permutations (probability of 0.01) for the null distribution to find the optimal rank correlation values. The detailed statistical process can be seen in the Supplementary Materials.

3. Results

3.1. Physico-Chemical Water Quality Variables

The physico-chemical water quality variables at all sampling sites for two sampling periods (November–December 2016 and February–March 2017) are given in Table 1. The pH values ranged from 5.5 to 7.6 across all sites. We found the highest turbidity of 307.8 NTU in the Chaungmagyi River during the first sampling campaign (November–December 2016). The surface water temperature varied from 22 to 29 °C among all sampling sites. The electric conductivity (EC) ranged from 65 to 427 μS cm−1. We found that the level of EC was higher in the Myitnge River than in the Chaungmagyi River for both November-December 2016 and February-March 2017 sampling campaigns.

3.2. Macroinvertebrates Richness and Abundance

The result of identification from all 18 macroinvertebrate samples was a total of 10 orders with 36 families and 58 different species. Table 1 shows the a number of all taxa, and sensitive taxa (Ephemeroptera, Plecoptera, Trichoptera and Odonata (EPTO)) with the abundance data per sample at each sampling site on both study rivers. The number of different aquatic macroinvertebrates taxa ranged from 3 to 17, with the abundance ranging from 12 to 380 individuals from the samples collected in the Myitnge River. In the Chaungmagyi River, the number macroinvertebrates taxa ranged from 1 to 19, with the abundance ranging from 1 to 245 individuals from the samples collected. The highest contribution of taxa among all sampling sites were sensitive taxa, EPTO (Table 1). The most abundant taxa among EPTO at each sample in both rivers were Ephemeroptera. Table 2 shows a detailed list of collected family and morphospecies-level taxonomy.

3.3. Ecological Water Quality Index and Statistical Analysis

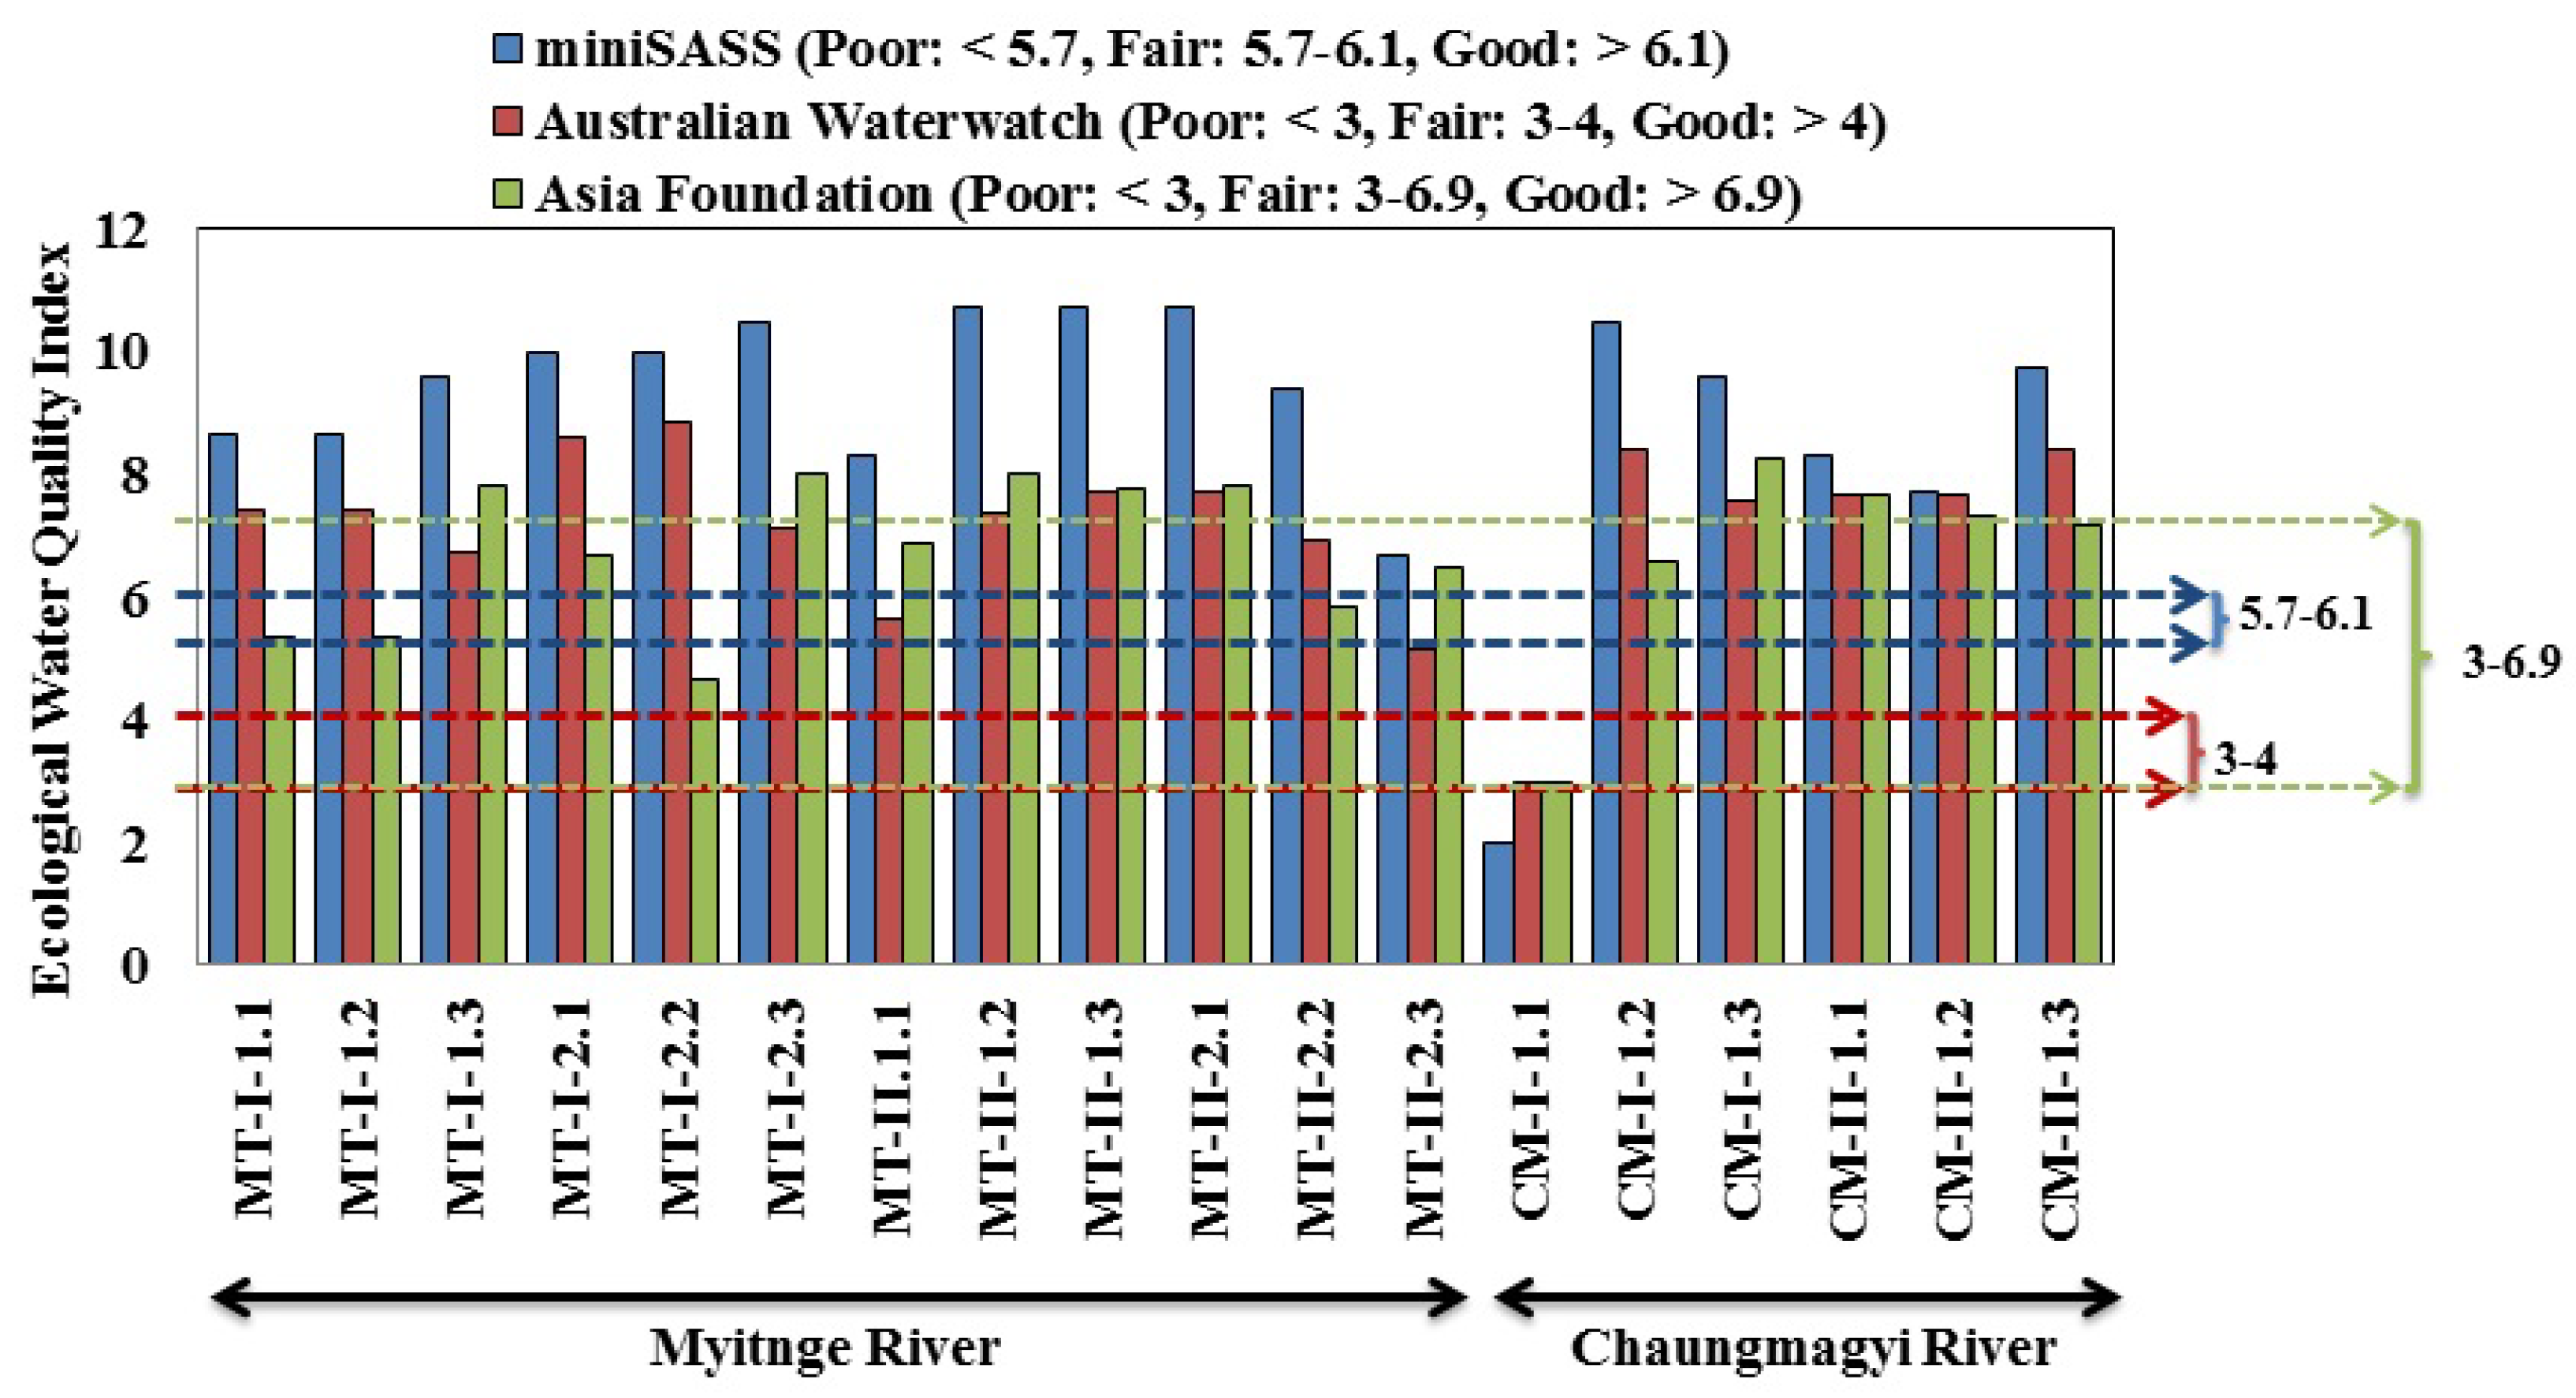
Laboratory identification was used to calculate ASPT following the three different methods to calculate the ecological water quality indices of each sample for both rivers (Figure 2). The estimated water quality indices using the three methods generally showed fair and above water quality conditions across all samples (Figure 2).
Dimensionless MDS ordinations plots for the non-transformed ecological water quality indices by three methods were calculated. Based on Bray-Curtis similarity between the Myitnge and Chaungmagyi Rivers, the stress calculated at 0.04 (<0.05) (Figure 3, Left), indicating that rank order correlation is a good representation of indices similarity matrix by Bray-Curtis between the Myitnge and Chaungmagyi Rivers. This indicates that the three different scoring methods provide similar ecological trend results in relation to water quality conditions in both rivers. The Global R test plot calculated close to zero (−0.096) (Figure 3, Right), which mean that there was overlap between indices of the three methods. The dark vertical line on the plot (Figure 3, Right) is not separated from the distributions. Therefore, the null hypothesis is correct that there is no significant difference between all indices derived by the three methods among all sites in both rivers.
The similarity analysis routine SIMPER provided the percentage of (dis)similarity of indices of the three methods within the same river and between the two rivers. The similarity of indices among sampling sites within the Chaungmagyi River was 96 % and between sampling sites within the Myitnge River was 92%. Table 3 shows the detailed results of SIMPER with the percentage of contribution of each index method.
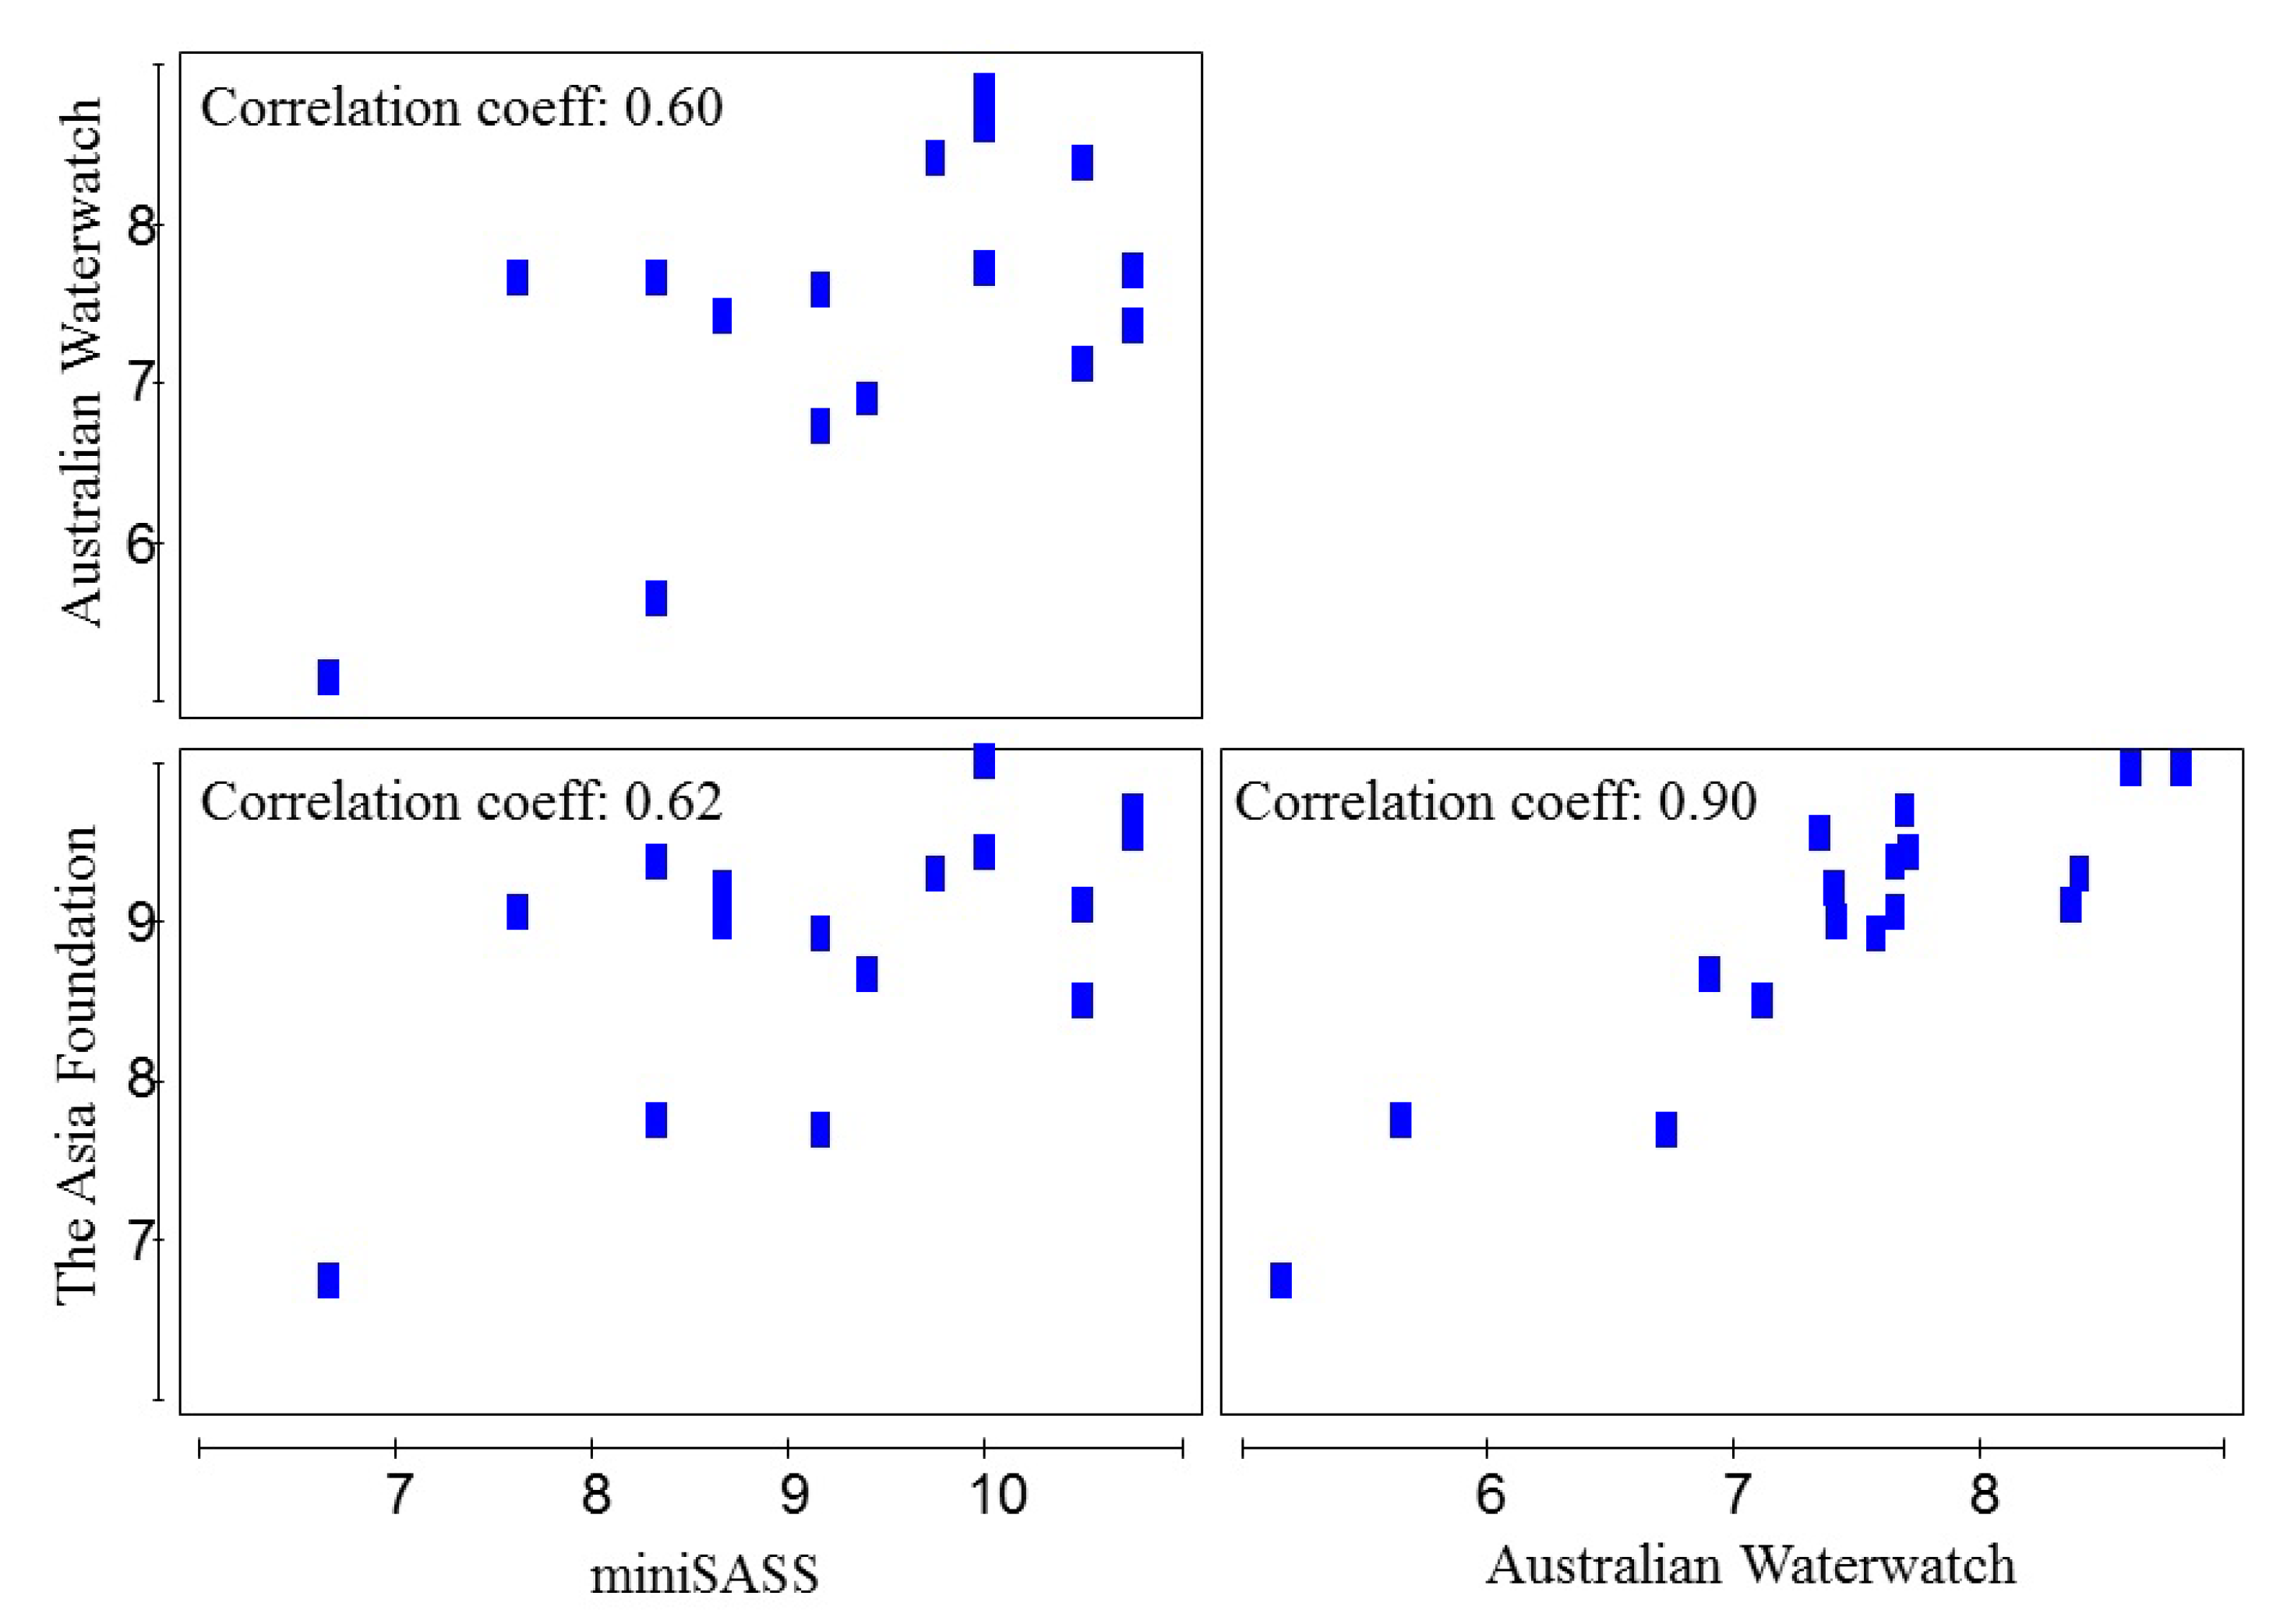
According to the results of the MDS plot, ANOSIM, and SIMPER, the three methods all calculated similar ecological water quality conditions among all sampling sites of both studied rivers. The correlation plot between each indexing method was calculated and was 0.6 between miniSASS and the Australian Waterwatch; the highest correlation (0.9) was between The Asia Foundation index method and Australian Waterwatch index method (Figure 4). Rank correlations calculated using BEST (Bio-Env) showed The Asia Foundation indexing method produced the highest rank correlation (0.774) between taxa resemblance matrix and Euclidean distance matrix for the indices, followed closely by the rank correlations of The Australian Waterwatch indexing method (0.772) and miniSASS (0.683).
The miniSASS is a less rigorous method designed for school children and community groups. This method is an ‘Order’ based method (12 order/taxa groups) rather than using detailed family groups. The Australian Waterwatch method is also designed for community monitoring but is a more rigorous method than miniSASS with 30 family/taxa groups. On the other hand, the Asia Foundation method is a rigorous scientific method designed for scientists or government organizations using 45 family/taxa groups.
In addition, We collected 58 aquatic macroinvertebrates families across all sites, in which four families are absent in The Asia Foundation score grades, and five families are absent in Australian Waterwatch score grades (see Table 2). Although arguments could be made for the use of any of the three methods, based on the above results and considerations, we finally selected The Asia Foundation index for further refinement for Myanmar. The Asia Foundation index method was developed in Lao PDR (Mekong River basin) and Mongolia where climate and watershed characteristics have more similarity with Myanmar than the other methods, and had more macroinvertebrate taxa representative of Myanmar than the other two methods (Australia and South Africa). We then modified the Asia Foundation method by adding four new taxa of Myanmar to see how much the ecological water quality index changed compared to the original method without the new taxa.

3.4. Method Development and Modification–Myanmar Modified The Asia Foundation Index

During laboratory testing, it was found that a number of families found in the Myanmar streams were not represented in The Asia Foundation Method. These include three taxa of Ephemeroptera (Prosopistomatidae, Polymitarcyidae and Isonychiidae) and one family of Diptera (Athericidae). Not including these families would reduce the precision of the method for Myanmar and could cause confusion if they were identified but not able to be used in the method. All other families were included in the original index method. Therefore, we modified The Asia Foundation method by including the extra four families with an appropriate sensitivity score. To derive sensitivity scores, we used SIGNAL 2 as the score range is consistent with the score of an individual taxon (ranging from 1 to 10) for The Asia Foundation index [27]. Using the SIGNAL 2 index, we added grade scores for the four missing family groups.
The Prosopistomatidae were given a grade score of 4 because they are less sensitive to water quality changes than other families of mayflies [28]. Polymitarcyidae were given a grade score of 6 due to their similar habitat requirements of other burrowing mayflies (e.g., Ephemeridae) in the original Asia Foundation index [3]. Both SIGNAL 2 grades and the original Asia Foundation did not include Isonychidae–Isonychia; however, this family of macroinvertebrates behave ecologically similar to the Australian genus Coloburiscidae, which filters organic material from the water column with hairs on the legs, and both are weak swimmers. These two families were originally placed in the same family but have since been separated [29]. The Isonychidae–Isonychia from Myanmar was therefore given the same score as Coloburiscidae in SIGNAL 2 grades (i.e., grade 8) in the modified index. The Athericidae in SIGNAL 2 has a grade of 8, indicating it is a sensitive family. Hence, Athericidae was placed in a pollution sensitive grade (8).
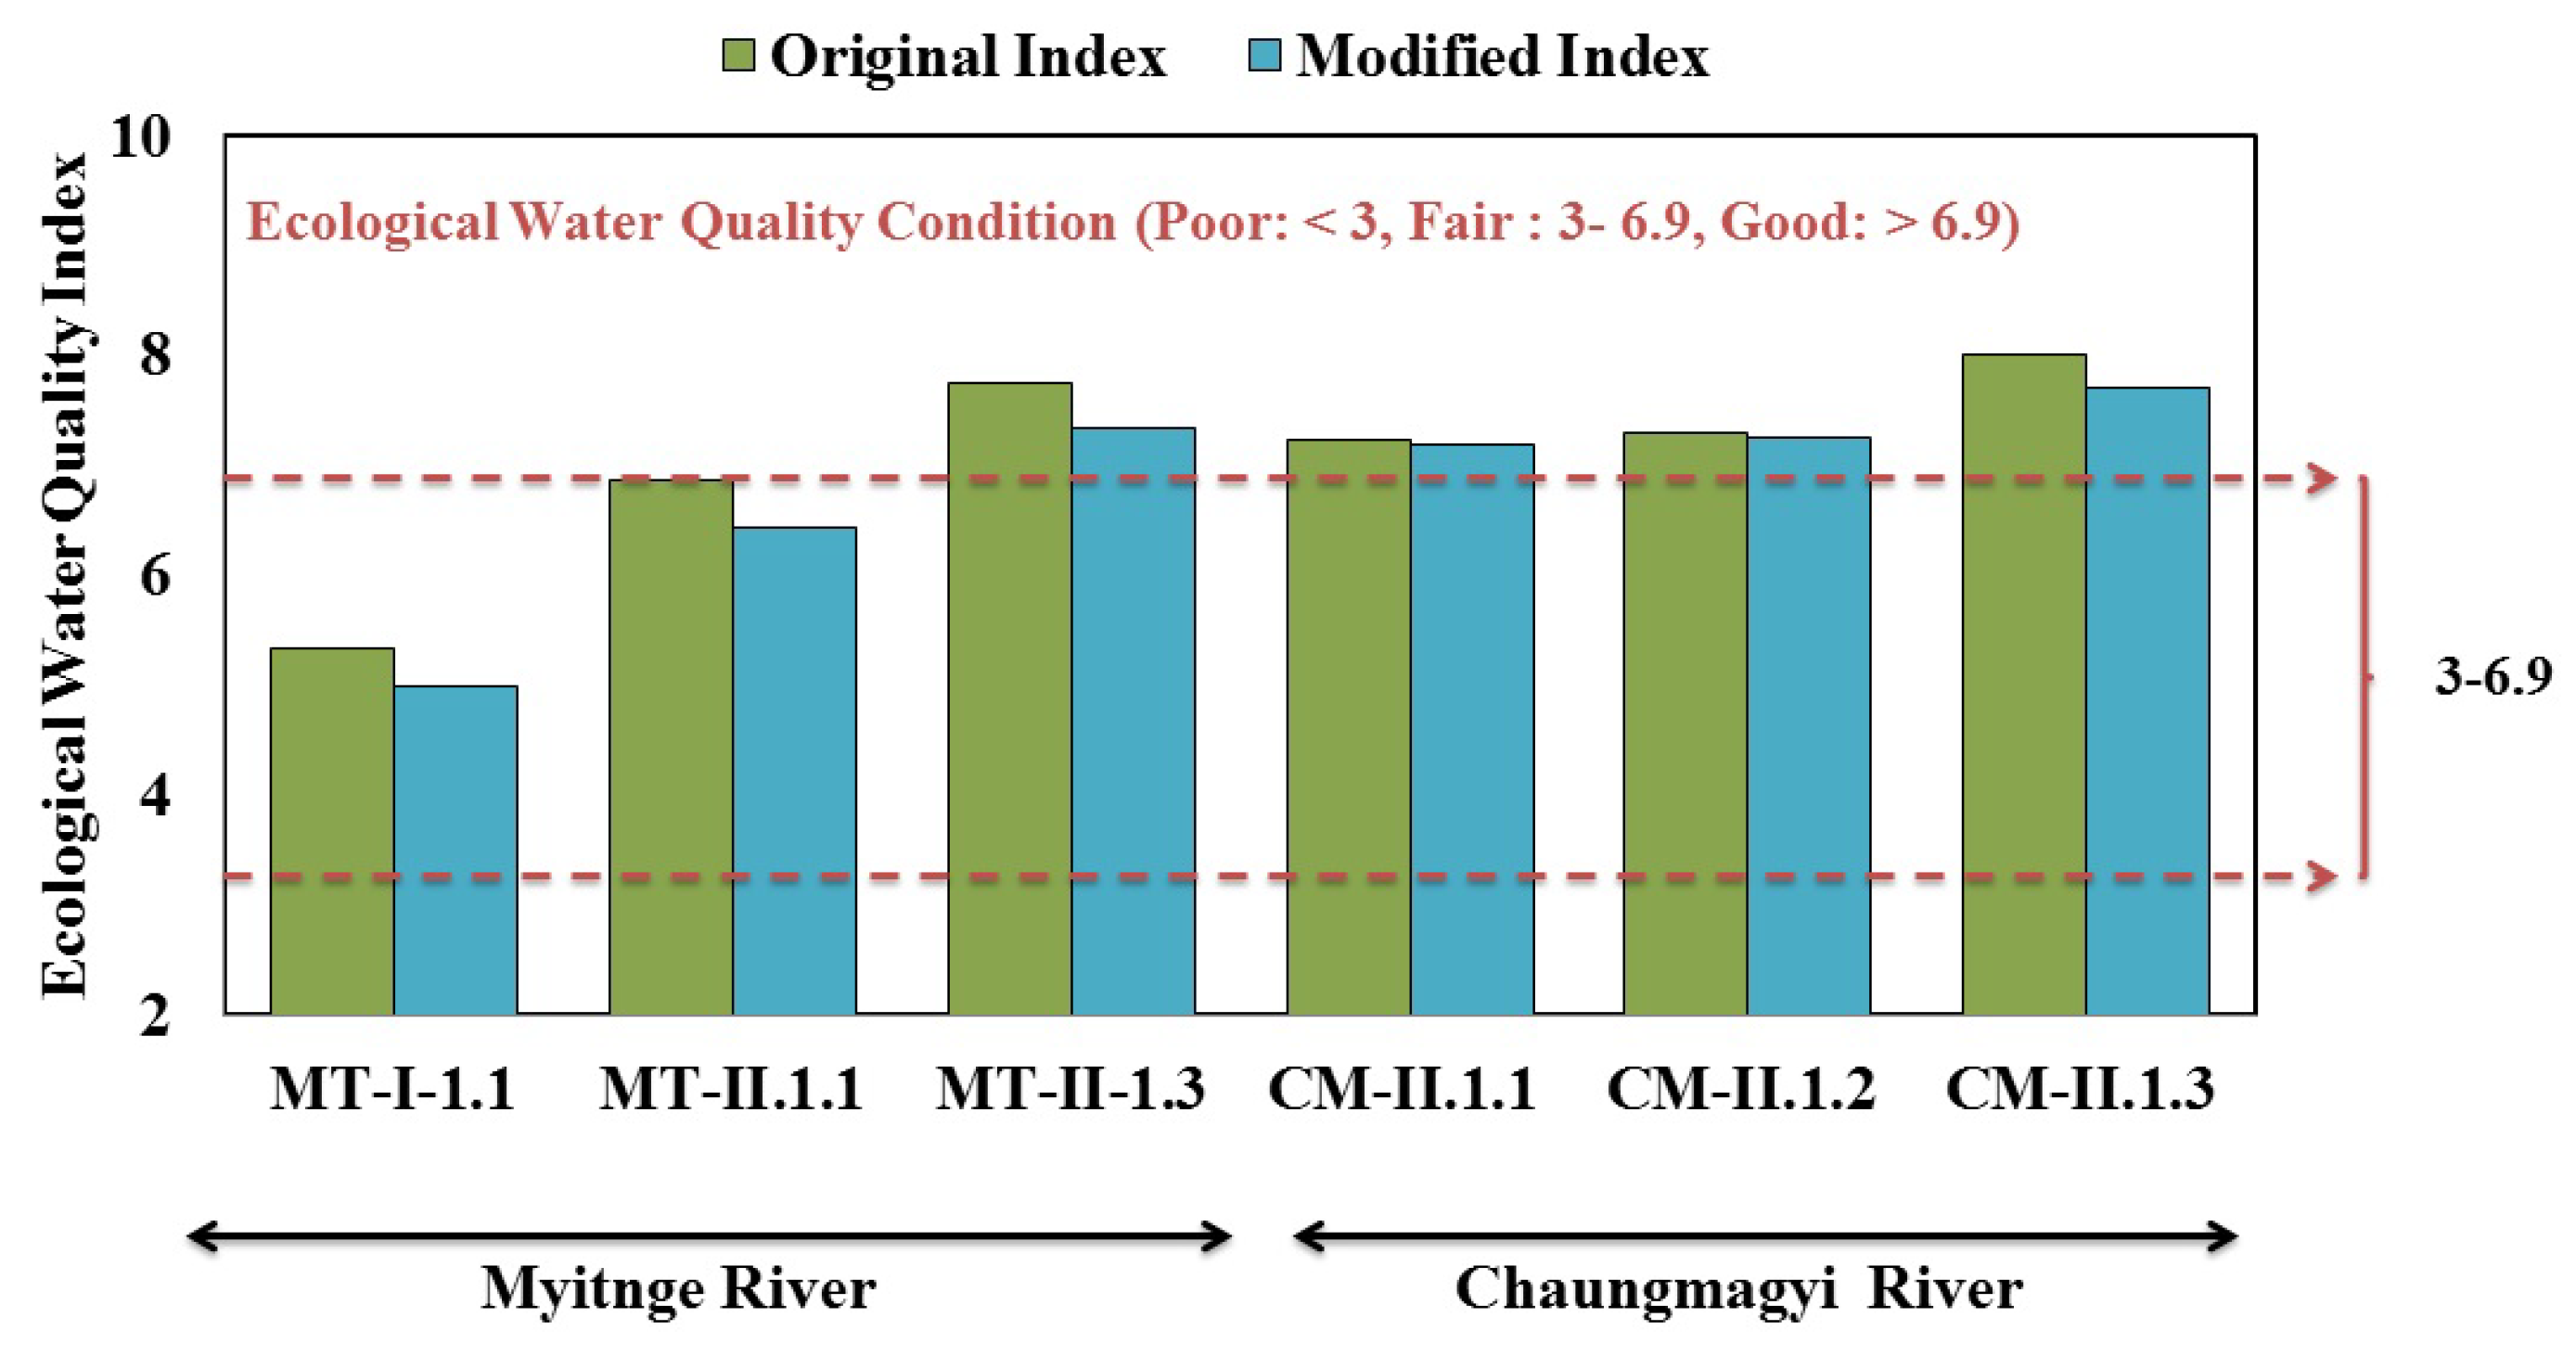
The ecological water quality indices of the original and modified Asia Foundation method were calculated for each sample where the additional four families occurred (Figure 5 ). The difference in indices between the modified method with the additional four taxa and the original method without the four taxa are not significant, for example, for samples CM-II-1.1 and CM-II-1.2 where the intolerant family (Athericidae) and mid-range tolerant family (Polymitarcyidae) were found.

4. Discussion

There are various approaches for assessing river water quality using physical, chemical and biological indicators [30,31]. Among these, biological indicators are well suited for assessing river water quality because they can detect the level of impact and identify which pressures may be causing the impact. Algae, bacteria, fish and aquatic macroinvertebrates are popular biological assemblages in different biomonitoring approaches, all with advantages and disadvantages [32]. Biomonitoring using aquatic macroinvertebrates have diversified and have been extensively applied internationally to monitor river water quality since the 1980s. Macroinvertebrate-based river health monitoring tools hold potential for developing countries to be able to monitor the health of their rivers and wetlands using rapid and relatively low cost technology, but methods developed outside of the country need to be tested and modified to be locally applicable [13].
This study aimed to investigate the potential use of a biological monitoring method suitable with enough taxa data to monitor river health at the local scale for Myanmar. Hereto, we selected minimally impacted sites in the upstream part of two rivers. Unfortunately, there is human disturbance on all water resources around the world [33]. Therefore, although we selected sites with minimal anthropogenic pressure in both rivers, some human influences may exist, for example direct household waste disposal. However, our results show that the current sampling sites had a similar dominance of aquatic insects consistent with other Asian countries (such as Thailand, Nepal and Malaysia). Six species from five families of Trichoptera [34] and 30 families of all taxa were the same as found in Thailand [5]. Four out of seventeen families of Odonata were the same found in Nepal [35] and the six dominant families of EPT in Peninsular Malaysia found by Abdo et al. [36] were all recorded in the study. Based on collected taxa-richness and their abundance, it was concluded that macroinvertebrates could be collected in numbers across different taxa to warrant the trialing of the different rapid assessment methods.
Our main objective was to find an appropriate macroinvertebrate-based index method based on the three different international standardized index methods under Myanmar taxonomic condition and then to modify the index for use in Myanmar. At all sites tested (except one site on one sampling occasion), an adequate number of macroinvertebrates were able to be collected to test the three methods. The three different methods trialed gave slightly different results, which is not surprising as they use data of different taxonomic level and are developed for different areas of the world. Differences were not significant and both the proposed modified version of The Asia Foundation method and miniSASS may play a role in river health monitoring in Myanmar.
Generally, the lower is the taxonomic level used, the more specific is the understanding of river health that can be expected in temporal and spatial sense but also more training is needed to apply such a method. Out of the three methods we tested, the Asia Foundation method and the Australian method had a comparable level of detail. The miniSASS is much easier as it uses only order level. In our samples, the Asia Foundation method had the least number of families missing (four) compared to five missing in the Australian method. We chose to modify this method to better represent Myanmar conditions. The addition of the four missing families did not alter the score results for these unmodified waters substantially, but makes the method more Myanmar specific and the detection of river health degradation easier in the country.
An important aspect of biomonitoring is the characterization of the water quality at time of sampling and even the pollution in the period before the sampling, as it has a strong influence on the results. We collected basic physico-chemical analysis of the water in-situ at time of sampling. All in-situ levels were within acceptable standards for ecological integrity based on the references [30,37], but we did not measure any organic pollution levels. No information on the historical water quality in the Myitnge and Chaungmagyi Rivers is known. However, concerns have been raised on the water quality downstream of the industrial concentration of the Mandalay and Sagaing urban areas [19]. However, these sampling points were all upstream of the major urban and industrial concentrations. Furthermore, the land use in the upstream catchments is mainly forest and agriculture, where the latter is known for low application of fertilizers and pesticides, but the negative effects currently unknown [19].
Biomonitoring programs are not always linked to public involvement for raising awareness and citizen science approaches for river water quality monitoring. However, there is a well-known trade-off between the number of families required for accurate assessment and determination problems by non-scientists [11]. Our research suggests that the adjusted index with an additional four families improved the performance of the index slightly. The inclusion could also lessen confusion for both experts and citizen scientists when utilizing the method, as, if they were left out but then identified, there would be no category for them. The current state of the Myanmar biomonitoring assessment tool should be improved by more use and testing in different river types and adjusted accordingly. The miniSASS method may be valuable for wider application by citizens next to the modified index proposed.
There is currently no surface water quality monitoring network in place in Myanmar. Only initial steps in developing a water quality monitoring network for the Ayeyarwady have been presented using a low-cost sensor network [38]. Furthermore, towns along rivers are growing larger with inadequate pollution control infrastructure and more water control infrastructure including hydropower dams are planned [39]. Assessing river health is therefore of utmost importance but at the same time absent in Myanmar where the water resources are central to the Myanmar economy [19].
The presented results are promising at a localized scale, but at the same time we recognize the need for rapidly extending to reach a national wide biomonitoring system [13]. We are aware that this study is a pioneering start with a modest dataset collected in challenging conditions. We studied two large tributaries of the Ayeyarwady using three locations and sampling in two seasons, which is inadequate to establish a system wide monitoring tool, but the tool can be trialed and improved as more data become available. The method can be considered representative for this region, but it is important to also determine the rest of the country, which will take a more comprehensive sampling regime across all river types. We recognize that the dataset is limited but these preliminary results are encouraging and additional sampling of impacted sites and minimal impacted sites is warranted.
Currently, we conclude that this modified index is useful as an initial assessment to develop a professional biomonitoring method at a national scale where no baseline research exists potentially in combination with an easier biomonitoring tool for citizens such as miniSASS. However, from a utility and reliability perception, we recommend further comprehensive study in other rivers of Myanmar to investigate its value in detecting impacts from human activities. This can be done using the tool in the field, but also testing in the laboratory to better refine the method.

Supplementary Materials

The following are available online at https://www.mdpi.com/2073-4441/12/5/1408/s1.

Author Contributions

Conceptualization, N.T.K., P.S., J.C., M.R. and T.B.; methodology, N.T.K., P.S., J.C., M.R. and T.B.; software, P.S.; validation, N.T.K., P.S., J.C., M.R. and T.B.; formal analysis, N.T.K. and P.S.; writing—original draft preparation, N.T.K.; and writing—review and editing, P.S., J.C., M.R. and T.B. All authors have read and agreed to the published version of the manuscript.

Funding

This research was funded by The Netherlands Fellowship Program (NFP) for four-year PhD study. The APC was funded by Delft University of Technology, The Netherlands.

Acknowledgments

The authors would like to acknowledge the efforts of the volunteers in Myanmar who helped in the logistics and the sampling. A special thank you to Ye Yint Aung, Min Min Naing, Kyaw Kyaw and Kyaw Min Naing. This paper forms part of a PhD research funded by Nuffic NFS Fellowship program (four-year personal PhD grant).

Conflicts of Interest

All authors declare that this research have no conflict of interest.

References

  1. Hoang, H.T.T.; Duong, T.T.; Nguyen, K.T.; Le, Q.T.P.; Luu, M.T.N.; Trinh, D.A.; Le, A.H.; Ho, C.T.; Dang, K.D.; Némery, J.; et al. Impact of anthropogenic activities on water quality and plankton communities in the Day River (Red River Delta, Vietnam). Environ. Monit. Assess. 2018, 190, 67. [Google Scholar] [CrossRef] [PubMed]
  2. Nilsson, C.; Renöfält, B.M. Linking flow regime and water quality in rivers: A challenge to adaptive catchment management. Ecol. Soc. 2008, 13, 2. [Google Scholar] [CrossRef] [Green Version]
  3. Dudgeon, D. Tropical Asian Streams: Zoobenthos, Ecology and Conservation; Hong Kong University Press: Hong Kong, China, 1999; Volume 1. [Google Scholar]
  4. Hughes, C.E. Are there many different routes to becoming a global biodiversity hotspot? Proc. Natl. Acad. Sci. USA 2017, 114, 4275–4277. [Google Scholar] [CrossRef] [Green Version]
  5. Mustow, S. Biological monitoring of rivers in Thailand: Use and adaptation of the BMWP score. Hydrobiologia 2002, 479, 191–229. [Google Scholar] [CrossRef]
  6. Boonsoong, B.; Sangpradub, N.; Barbour, M.T. Development of rapid bioassessment approaches using benthic macroinvertebrates for Thai streams. Environ. Monit. Assess. 2009, 155, 129–147. [Google Scholar] [CrossRef] [PubMed]
  7. Oliveira, R.B.; Mugnai, R.; Castro, C.M.; Baptista, D.F. Determining subsampling effort for the development of a rapid bioassessment protocol using benthic macroinvertebrates in streams of Southeastern Brazil. Environ. Monit. Assess. 2011, 175, 75–85. [Google Scholar] [CrossRef]
  8. Buss, D.F.; Vitorino, A.S. Rapid bioassessment protocols using benthic macroinvertebrates in Brazil: Evaluation of taxonomic sufficiency. J. N. Am. Benthol. Soc. 2010, 29, 562–571. [Google Scholar] [CrossRef]
  9. Graham, P.M.; Dickens, C.W.; Taylor, R.J. miniSASS—A novel technique for community participation in river health monitoring and management. Afr. J. Aquat. Sci. 2004, 29, 25–35. [Google Scholar] [CrossRef]
  10. Armitage, P.; Moss, D.; Wright, J.; Furse, M. The performance of a new biological water quality score system based on macroinvertebrates over a wide range of unpolluted running-water sites. Water Res. 1983, 17, 333–347. [Google Scholar] [CrossRef]
  11. Dickens, C.W.; Graham, P.M. The South African Scoring System (SASS) Version 5 Rapid Bioassessment Method for Rivers. Afr. J. Aquat. Sci. 2002, 27, 1–10. [Google Scholar] [CrossRef]
  12. Buss, D.F.; Salles, F.F. Using Baetidae species as biological indicators of environmental degradation in a Brazilian river basin. Environ. Monit. Assess. 2007, 130, 365. [Google Scholar] [CrossRef] [PubMed]
  13. Buss, D.F.; Carlisle, D.M.; Chon, T.S.; Culp, J.; Harding, J.S.; Keizer-Vlek, H.E.; Robinson, W.A.; Strachan, S.; Thirion, C.; Hughes, R.M. Stream biomonitoring using macroinvertebrates around the globe: A comparison of large-scale programs. Environ. Monit. Assess. 2015, 187, 4132. [Google Scholar] [CrossRef] [PubMed]
  14. Wright, I.A.; Chessman, B.C.; Fairweather, P.G.; Benson, L.J. Measuring the impact of sewage effluent on the macroinvertebrate community of an upland stream: The effect of different levels of taxonomic resolution and quantification. Aust. J. Ecol. 1995, 20, 142–149. [Google Scholar] [CrossRef]
  15. Ollis, D.J. Rapid Bioassessment of the Ecological Integrity of the Lourens, Palmiet and Hout Bay Rivers (South Western Cape, South Africa) Using Aquatic Macroinvertebrates. Ph.D. Thesis, Stellenbosch University, Stellenbosch, South Africa, 2005. [Google Scholar]
  16. Stein, E.D.; Brown, J.S.; Mazor, R.D. Transferability of bioassessment indices among water body types and ecoregions: A California experiment in wetland assessment. Ecol. Indic. 2017, 81, 65–73. [Google Scholar] [CrossRef]
  17. Watson, M.; Dallas, H. Bioassessment in ephemeral rivers: Constraints and challenges in applying macroinvertebrate sampling protocols. Afr. J. Aquat. Sci. 2013, 38, 35–51. [Google Scholar] [CrossRef]
  18. Nixon, N.; Mustafa, M. Asia Foundation Supports Water Quality Monitoring Project in Mongolia. 2009. Available online: https://asiafoundation.org/2009/07/08/asia-foundation-supports-water-quality-monitoring-project-in-mongolia/ (accessed on 22 April 2019).
  19. HIC. Ayeyarwady SOBA 2017: Synthesis Report State of the Basin Assessment; The World Bank: Yangon, Myanmar, 2017. [Google Scholar]
  20. Dickens, C.; Cox, A.; Johnston, R.M.; Davison, S.; Henderson, D.; Meynell, P.; Shinde, V. Monitoring the Health of the Greater Mekong’s Rivers; CGIAR Research Program on Water, Land and Ecosystems: Patan, Nepal, 2018. [Google Scholar]
  21. Eriksen, T.E.; Nesheim, I.; Friberg, N.; Aung, T.T.; Myint, Z.W. Characterization of the Bago Sub-Basin Pilot Implementing the EU Water Framework Directive; NIVA-rapport; Ministry of Natural Rescources and Environmental Conservation: Naypyitaw, Myanmar, 2017.
  22. Choÿ, S.; Thompsons, P. River Bioassessment and monitoring using benthic macroinvertebrate community structure: The Monitoring River Heath initiative. In Downstream Effects of Landuse; Department of Natural Resources: Brisbane, Australia, 1996; pp. 53–55. [Google Scholar]
  23. Department of Meteorology and Hydrology; Myanmar. Available online: https://www.moezala.gov.mm/ (accessed on 12 September 2019).
  24. Narumon, S.; Boonsoong, B. Identification of Freshwater Invertebrates of the Mekong River and Tributaries; Faculty of Science, Appllied Taxonomic Research Center Khon Kean University: Khon Kean, Thailand, 2004. [Google Scholar]
  25. Clarke, K.; Gorley, R. PRIMER v6: User Manual/Tutorial, Primer E: Plymouth; Plymouth Marine Laboratory: Plymouth, UK, 2006. [Google Scholar]
  26. Clarke, K.R. Non-parametric multivariate analyses of changes in community structure. Aust. J. Ecol. 1993, 18, 117–143. [Google Scholar] [CrossRef]
  27. Chessman, B.C. New sensitivity grades for Australian river macroinvertebrates. Mar. Freshw. Res. 2003, 54, 95–103. [Google Scholar] [CrossRef] [Green Version]
  28. Soldán, T.; Braasch, D. Two new species of the genus Prosopistoma (Ephemeroptera, Prosopistomatidae) from Vietnam. Acta Entomol. Bohemoslov. 1984, 81, 370–376. [Google Scholar]
  29. Suter, P.J. The Taxonomy and Ecology of the Ephemeroptera (Mayflies) of South Australia. Ph.D. Thesis, University of Adelaide, Department of Zoology, Adelaide, Australia, 1980. [Google Scholar]
  30. Carter, J.L.; Resh, V.H.; Hannaford, M.J. Macroinvertebrates as biotic indicators of environmental quality. In Methods in Stream Ecology; Elsevier: Amsterdam, The Netherlands, 2017; pp. 293–318. [Google Scholar]
  31. Fairweather, P.G. State of environment indicators of ‘river health’: Exploring the metaphor. Freshw. Biol. 1999, 41, 211–220. [Google Scholar] [CrossRef]
  32. Norris, R.H.; Thoms, M.C. What is river health? Freshw. Biol. 1999, 41, 197–209. [Google Scholar] [CrossRef] [Green Version]
  33. Chessman, B.C.; Royal, M.J. Bioassessment without reference sites: Use of environmental filters to predict natural assemblages of river macroinvertebrates. J. N. Am. Benthol. Soc. 2004, 23, 599–615. [Google Scholar] [CrossRef]
  34. Prommi, T.; Thamsenanupap, P. Diversity and Structure of Trichoptera Communities and Water Quality Variables in Streams, Northern Thailand. World Acad. Sci. Eng. Technol. Int. J. Environ. Chem. Ecol. Geol. Geophys. Eng. 2015, 9, 1065–1072. [Google Scholar]
  35. Nesemann, H.; Shah, R.D.T.; Shah, D.N. Key to the larval stages of common Odonata of Hindu Kush Himalaya, with short notes on habitats and ecology. J. Threatened Taxa 2011, 2045–2060. [Google Scholar] [CrossRef] [Green Version]
  36. Abdo, A.S.S.; MD Rawi, C.S.; Ahmad, A.H.; Rosmahanie Madrus, M. Biodiversity of stream insects in the M alaysian P eninsula: Spatial patterns and environmental constraints. Ecol. Entomol. 2013, 38, 238–249. [Google Scholar] [CrossRef]
  37. Ward, J.V. Aquatic Insect Ecology. 1. Ecology and Habitat; John Wiley & Sons, Inc.: Hoboken, NJ, USA, 1992. [Google Scholar]
  38. Thatoe Nwe Win, T.; Bogaard, T.; van de Giesen, N. A low-cost water quality monitoring system for the Ayeyarwady River in Myanmar using a participatory approach. Water 2019, 11, 1984. [Google Scholar] [CrossRef] [Green Version]
  39. Dim, A.B.H.; Rutten, W.Z.; Hoes, O. Estimation of Hydropoweer Potential in Myanmar. Glob. J. Eng. Technol. Rev. 2017, 2, 78–85. [Google Scholar]
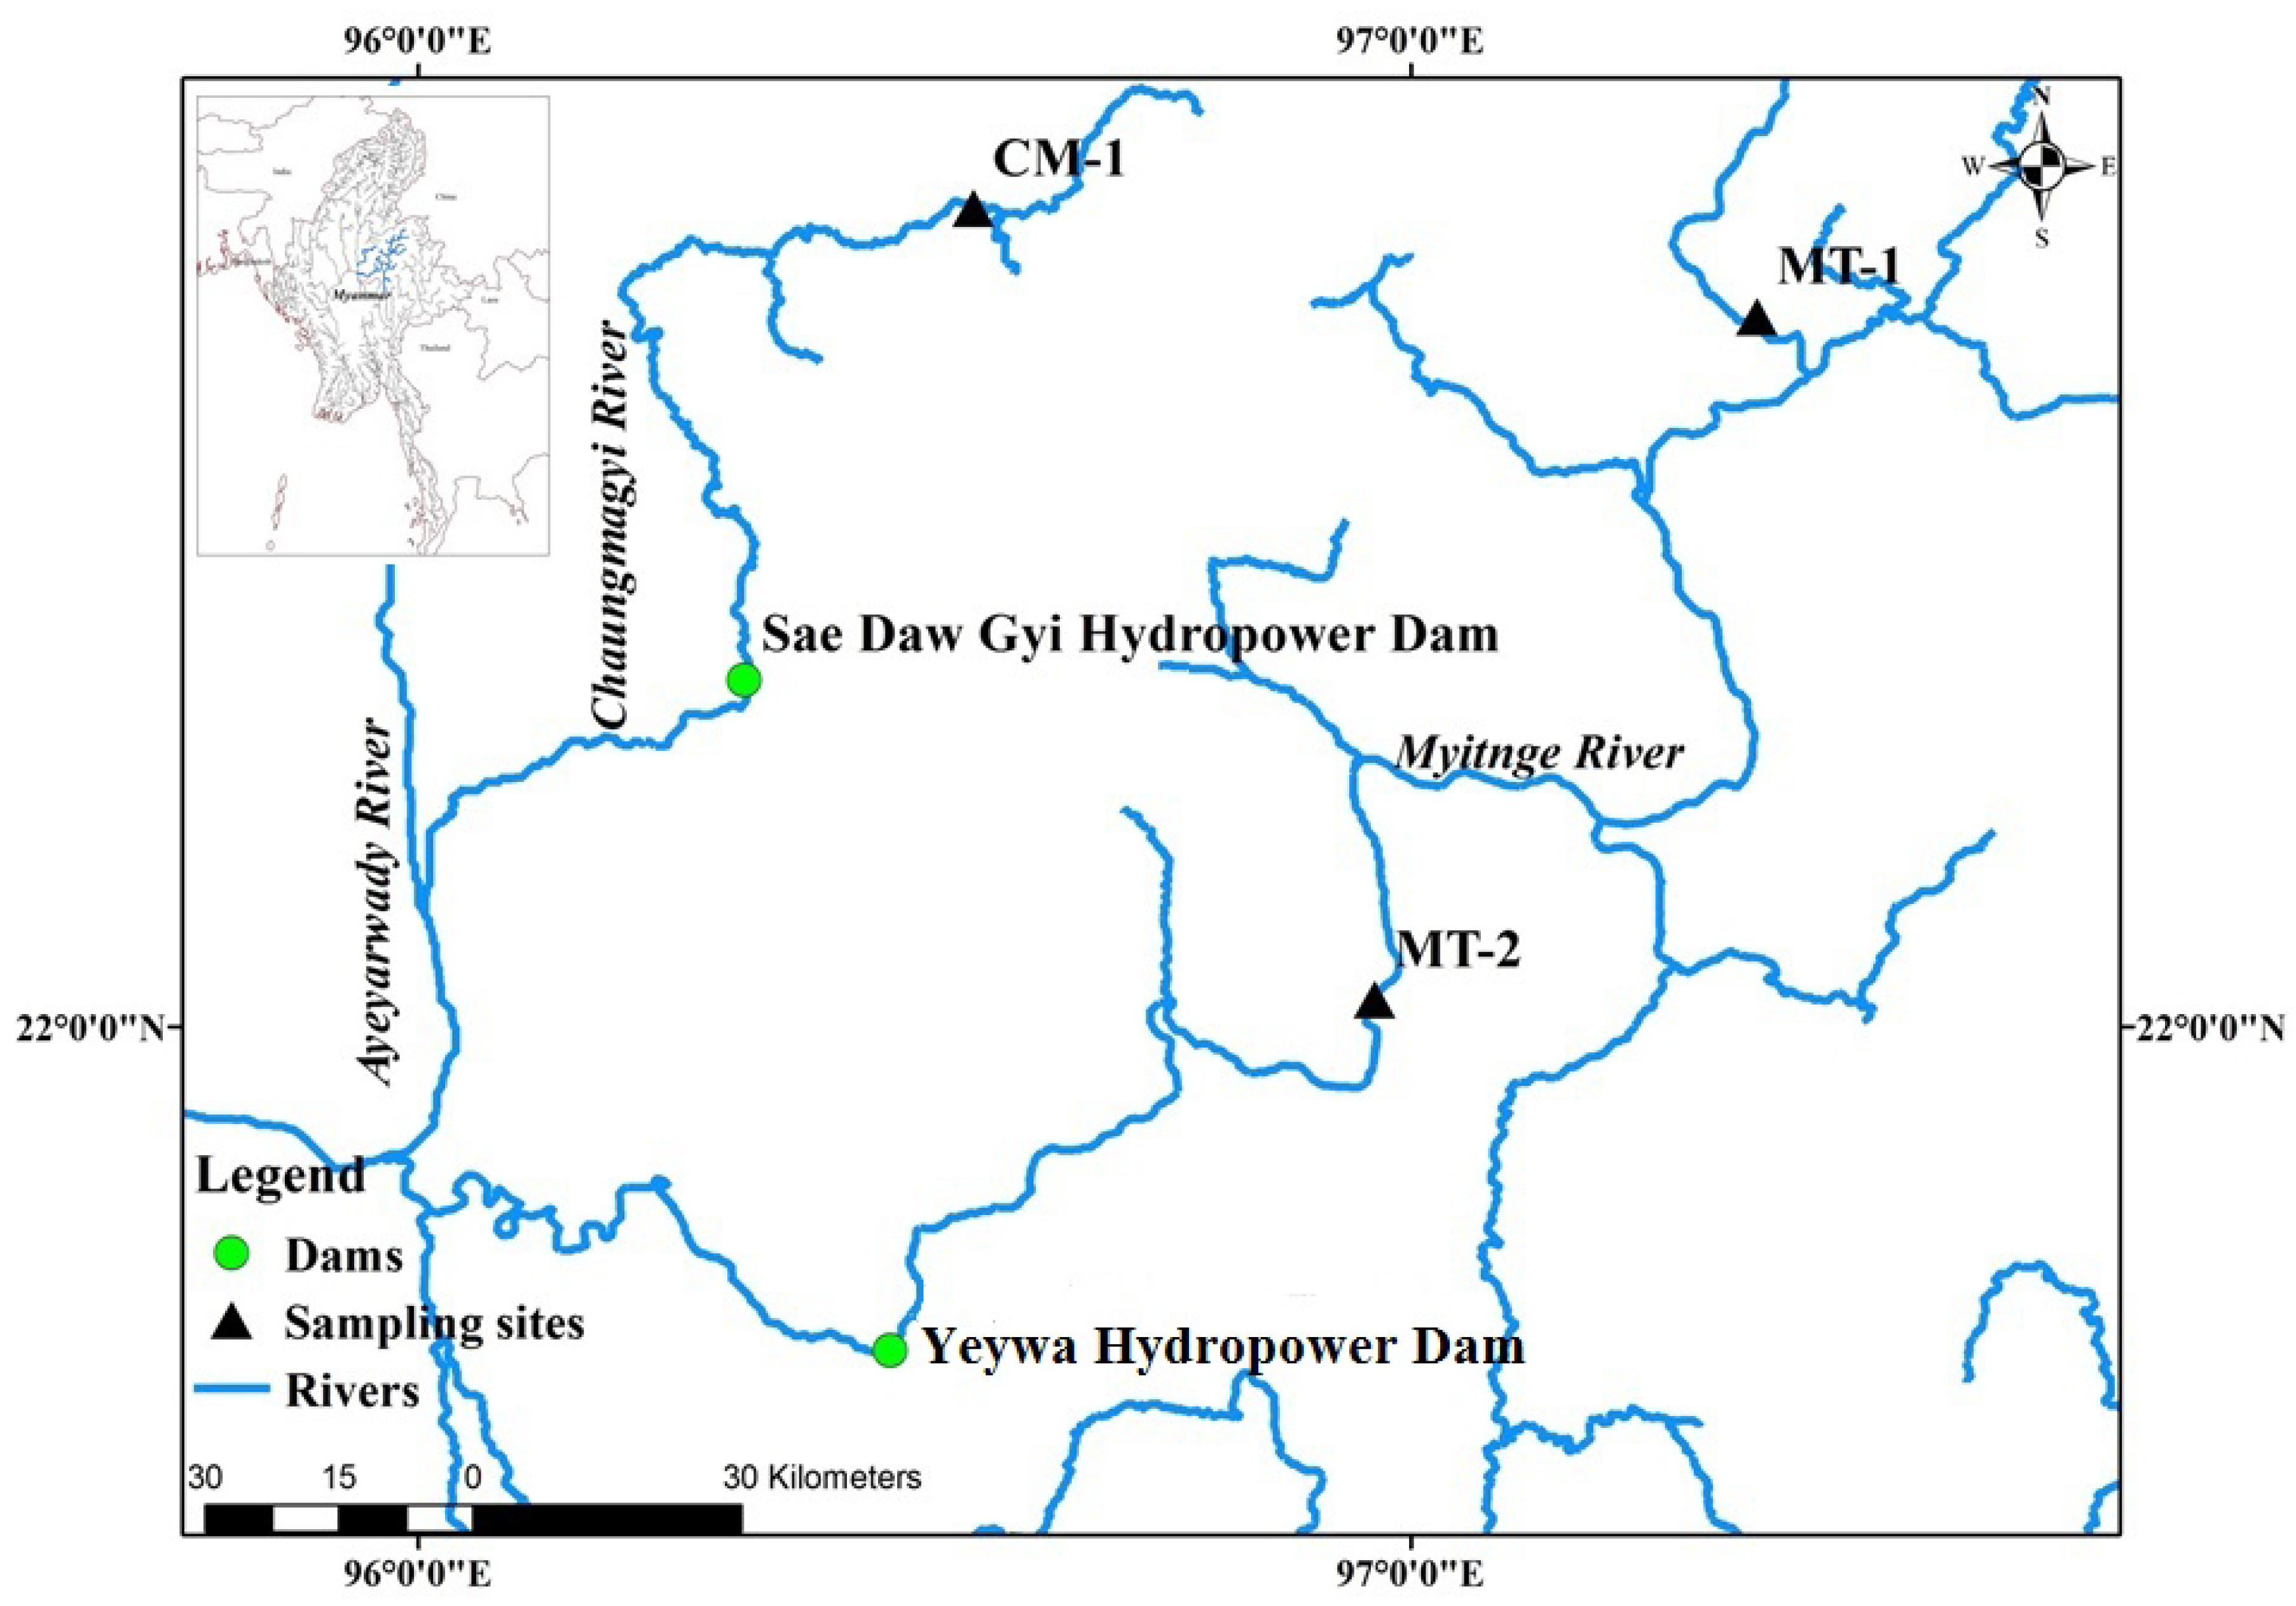
Figure 1. Locations of selected sampling sites on the Myitnge and Chaungmagyi Rivers in Myanmar. MT, Myitnge River; CM, Chaungmagyi River.
Water 12 01408 g001
Figure 2. Estimated ecological water quality indices by three methods per sample of each site on the Myitnge and Chaungmagyi Rivers for two occasions.
Water 12 01408 g002
Figure 3. Matching of indices by three methods between two study rivers by non-metric multidimensional scaling (MDS) plot (Left); and matching of indices by three methods among all sampling sites by Global R statistic test by one way analysis ANOSIM (Right).
Water 12 01408 g003
Figure 4. Correlation values between three index methods.
Water 12 01408 g004
Figure 5. Ecological water quality indices of six samples based on the original Asia Foundation Method and Myanmar Modified Method. Dotted line shows Fair condition according to the index.
Water 12 01408 g005
Table 1. Collected number of all taxa and Ephemeroptera, Plecoptera, Trichoptera and Odonata (EPTO) with their abundance data and four physico-chemical variables at each sample at each site of both study rivers for two sampling occasions.
Site ObservationOccasionLocationsSamplesTotal TaxaTotal AbundancepHTurbidity (NTU)EC (μS cm−1)Temp (°C)
AllEPTOAllEPTO
Myitnge RiverNovember–December 2016MT-I-1MT-I-1.15550507.514.028923
MT-I-1.2442525
MT-I-1.31273222
MT-I-2MT-I-2.14429296.514.035429
MT-I-2.2442525
MT-I-2.3551613
February–March 2017MT-II-1MT-II.1.11713119557.34.332722
MT-II-1.299380380
MT-II-1.31313267267
MT-II-2MT-II-2.114133043006.86.042723
MT-II-2.2873330
MT-II-2.342126
Chaungmagyi RiverNovember–December 2016CM-I-1CM-I-1.110105.5307.87224
CM-I-1.2109124123
CM-I-1.3121010396
February–March 2017CM-II-1CM-II-1.119171481467.6108.06523
CM-II-1.21915245236
CM-II-1.3983837
Table 2. Collected abundance and their original and modified scores of The Asia Foundation Index and Stream Invertebrate Grade Number Average Level (SIGNAL 2) Grades.
The Asia FoundationSIGNAL 2Rivers
OrderFamilySpeciesOriginalModifyGradesMyitngeChaungmagyi
Ephemeroptera *Baetidae * *Platybaetis sp 155567189
Baetis sp 1555814183
Procloeon sp 155560
Prosopistomatidae **Prosopistoma sp 1N.A4440
Ephemeridae **Ephemera sp 166N.A30
Heptageniidae **Asionurus sp 11010N.A1827
Asionurus sp 21010N.A09
Caenidae **Caenis sp 144420
Leptophlebiidae **Chloroterpes sp 110108203
Chloroterpes sp 21010820
Potamanthidae **Potamanthindus sp 155601
Polymitarcyidae **EphoronN.A66031
Isonychiidae **IsonychiaN.A8801
Ephemerellidae **Torleya1010901
Cincticostella gosei sp 11010903
Plecoptera *Perlidae **Neoperla sp 11010101114
Neoperla sp 210101031
Neoperla sp 310101001
Etrocorema sp 110101011
Etrocorema sp 210101091
Togoperla sp 1101010012
Togoperla sp 210101001
Togoperla sp 3101010023
Trichoptera *Hydropsychidae **Potamyia sp155610527
Oestropsyche sp 155610
Macrostemum sp 15564035
Amphipsyche sp 155601
Parapsyche sp 155601
Trichomacronema sp 1556046
Helicopsychidae **Helicopsyche sp 11010810
Odontoceridae **Marilia sp 110107183
Dipseudopsidae **Pseudoneureclipsis sp 11010946
Molannidae **Molanna sp 11010N.A70
Leptoceridae **Triplectides sp 11010610
Stenopsychidae **Stenopsyche sp 11010N.A05
Stenopsyche sp 21010N.A02
Odonata *Gomphidae **Gomphidae sp 1665617
Megapodagrionidae **Megapodagrionidae sp 166532
Euphaeidae **Euphaeidae sp 166501
MegalopteraCorydalidae **Corydalidae sp 11010768
Diptera *ChironomidaeOrthocladinae sp 1333360
CeratopogonidaeCeratopogonidae sp 133410
Tipulidae (L)Tipulidae (L)33510
Tipulidae-LimnoninaeTipulidae Limnoninae sp 133504
TipulidaeAntocha33501
AthericidaeAthericidae sp 1N.A8801
Coleoptera *Noteridae **Noteridae sp 177410
Gyrinidae **Gyrinidae sp 177410
Elmidae (L) **Elmidae (L) sp 1887201
Elmidae (L) sp 388701
Elimidae (A)88710
Psephenidae **Psephenidae sp 177610
Lepidoptera *CrambidaeEoephyla55301
Hemiptera *Naucoridae **Naucoridae sp 11010223
Aphelocheiridae **Aphelocheirus sp 11010N.A120
MicronectidaeMicronectidae sp 111201
Mesogastropoda *Thiaridae **Thiaridae sp 111460
Viviparidae **Viviparidae sp 111420
Total abundance 1291659
Number of sites 21
Nymber of occasion 22
Note: N.A is no data, sp means species, L is larval, A is adult. (*) is miniSASS taxa, (**) is Australian Waterwatch taxa.
Table 3. The results of Average (dis)similarity percentage and contribution variables by similarity analysis SIMPER routine of PRIMER v6.
Group CM
Average similarity: 95.92
SpeciesAverage AbundanceAverage SimilaritySimilarity/standard deviationContribution %Cumulative.%
The Asia Foundation9.1534.5530.7336.0236.02
miniSASS9.0831.914.9633.2669.28
Australian Waterwatch7.9429.4735.1730.72100
Group MT
Average similarity: 92.43
SpeciesAverage.AbundanceAverage.SimilaritySimilarity/standard deviationContribution %Cumulative.%
miniSASS9.4134.1713.3836.9736.97
The Asia Foundation8.8532.3617.6435.0171.98
Australian Waterwatch7.2225.912.6928.02100
Groups CM & MT
Average dissimilarity = 6.13
Group ChaungmagyiGroup Myitnge
SpeciesAverage AbundanceAverage AbundanceAverage DissimilarityDissimilarity/standard deviationContribution%Cumulative %
miniSASS9.089.412.51.3440.8340.83
Australian Waterwatch7.947.2221.1132.7273.55
The Asia Foundation9.158.851.621.1226.45100