Evaluating Spatiotemporal Variations of Groundwater Quality in Northeast Beijing by Self-Organizing Map
Abstract
:1. Introduction
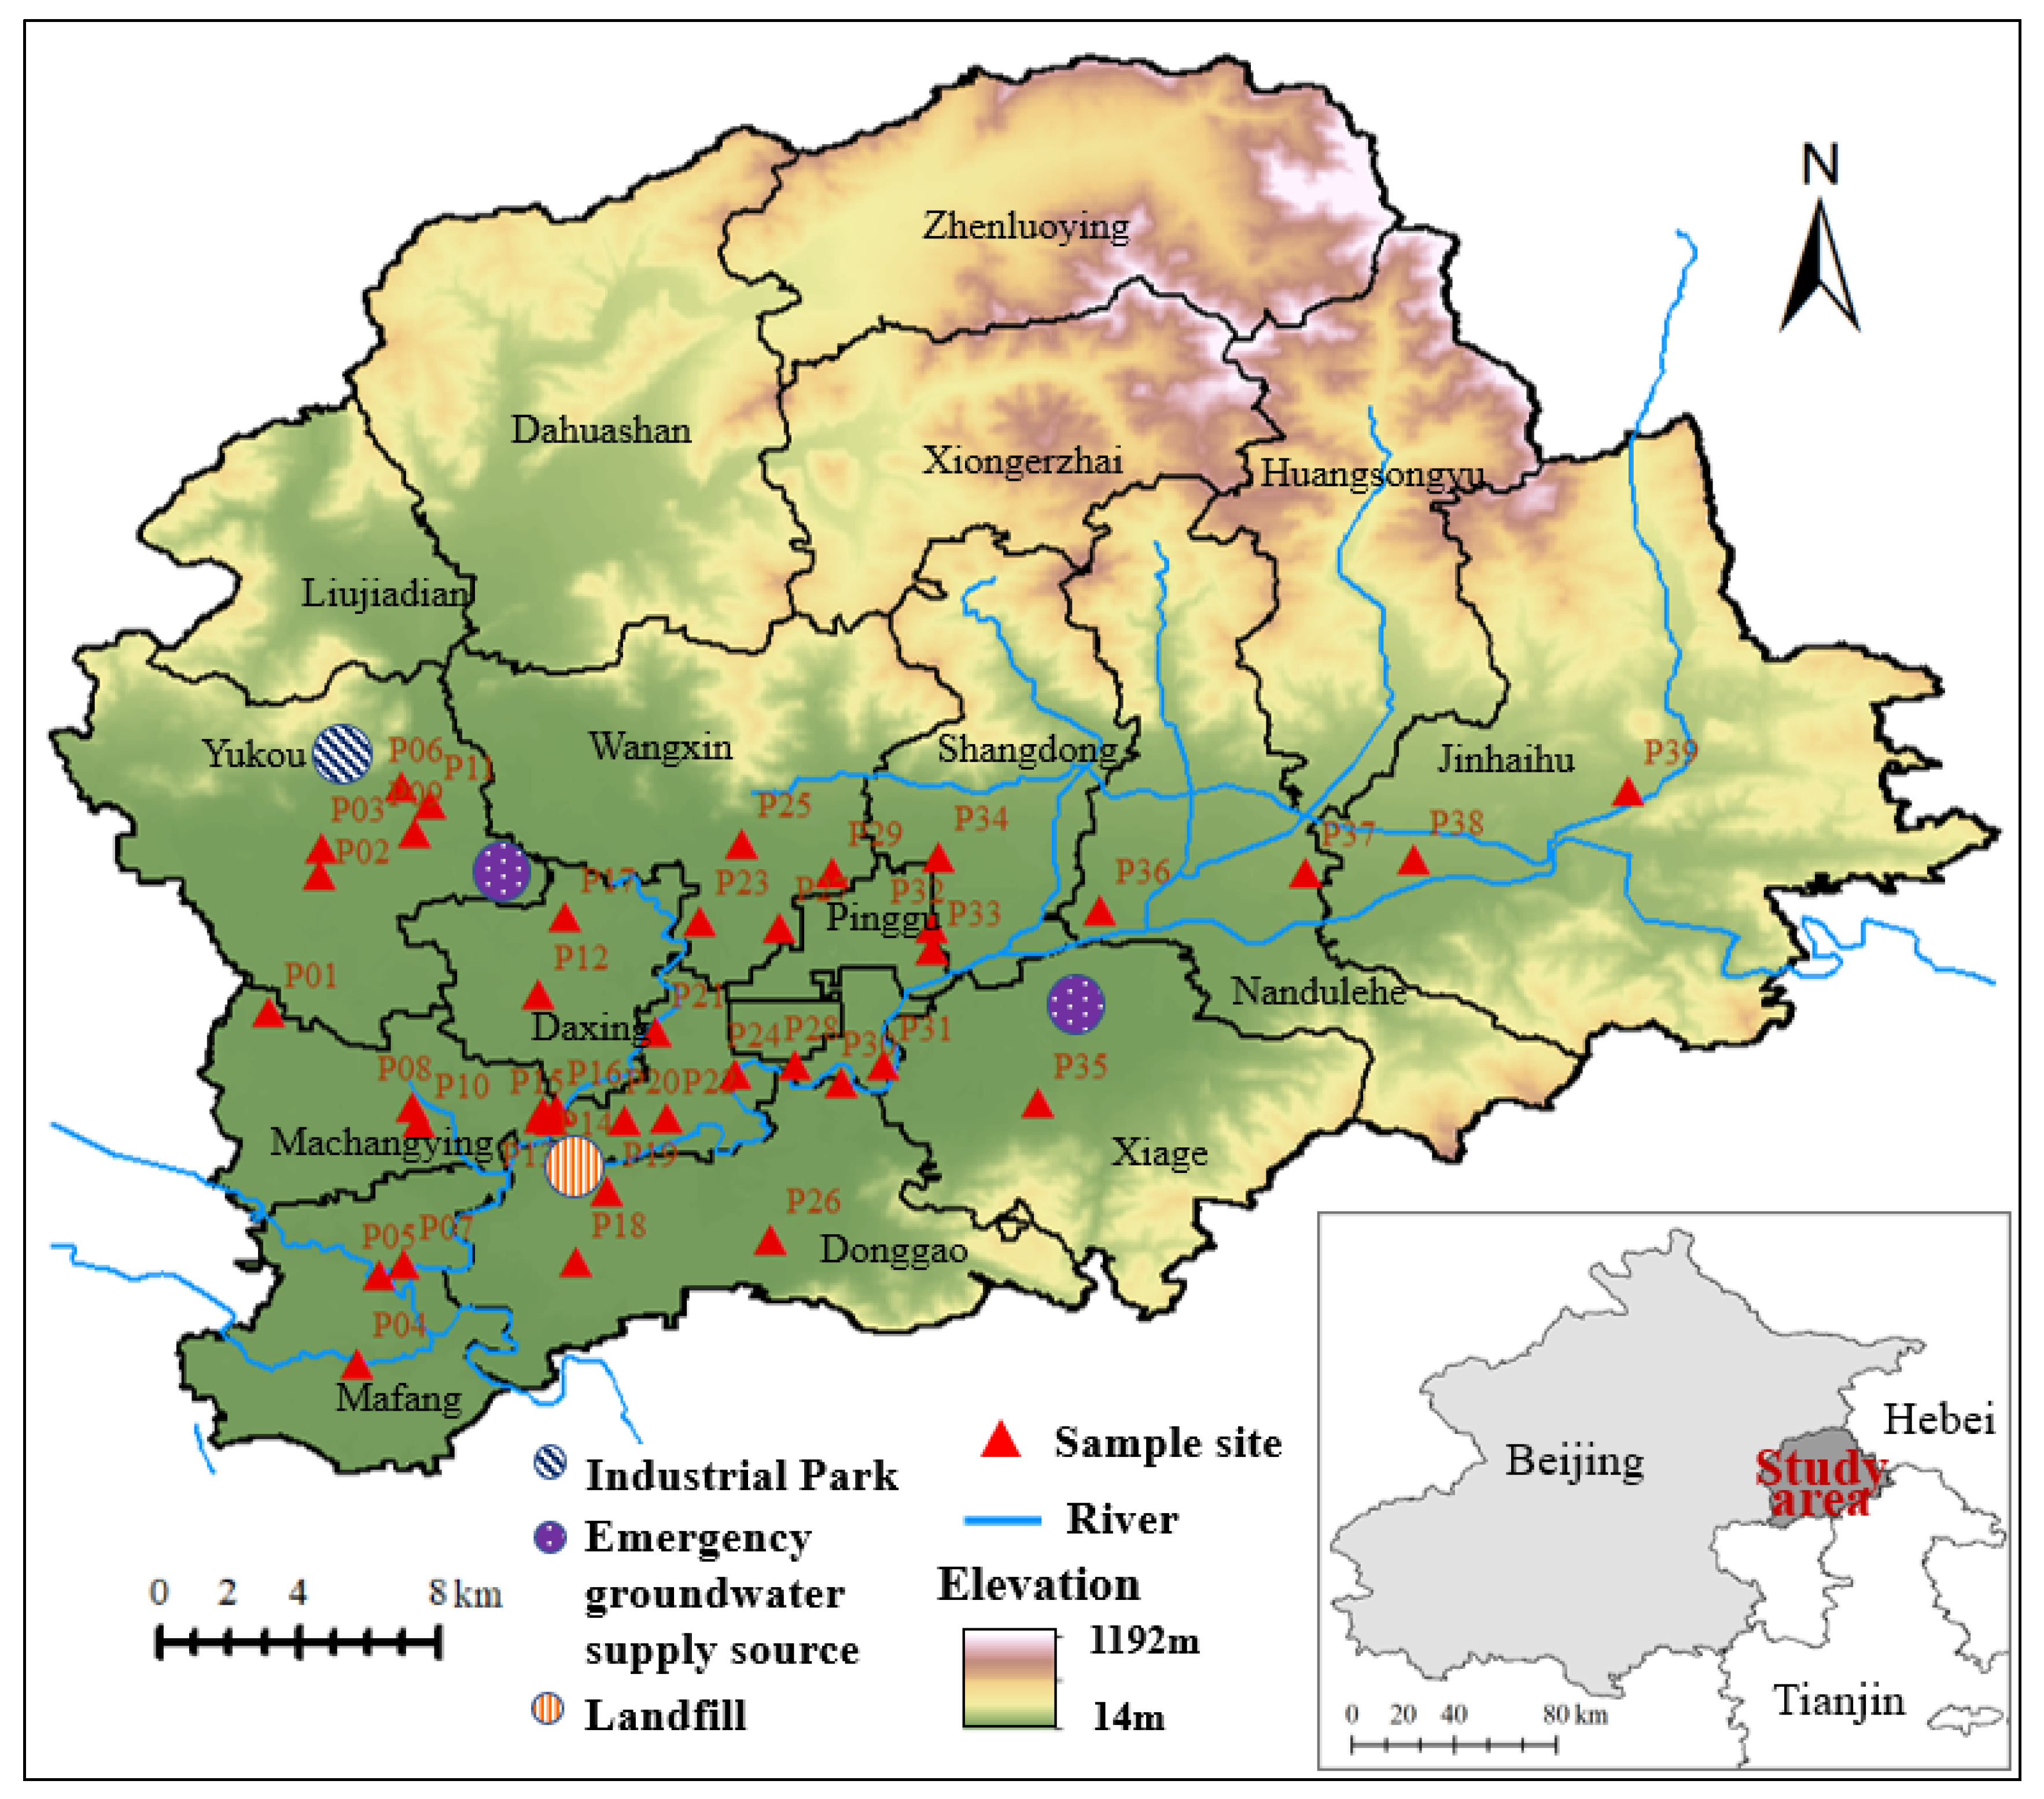
2. Study Area
3. Material and Methods
3.1. Sample Collection and Analysis
3.2. Self-Organizing Maps (SOM)
4. Results
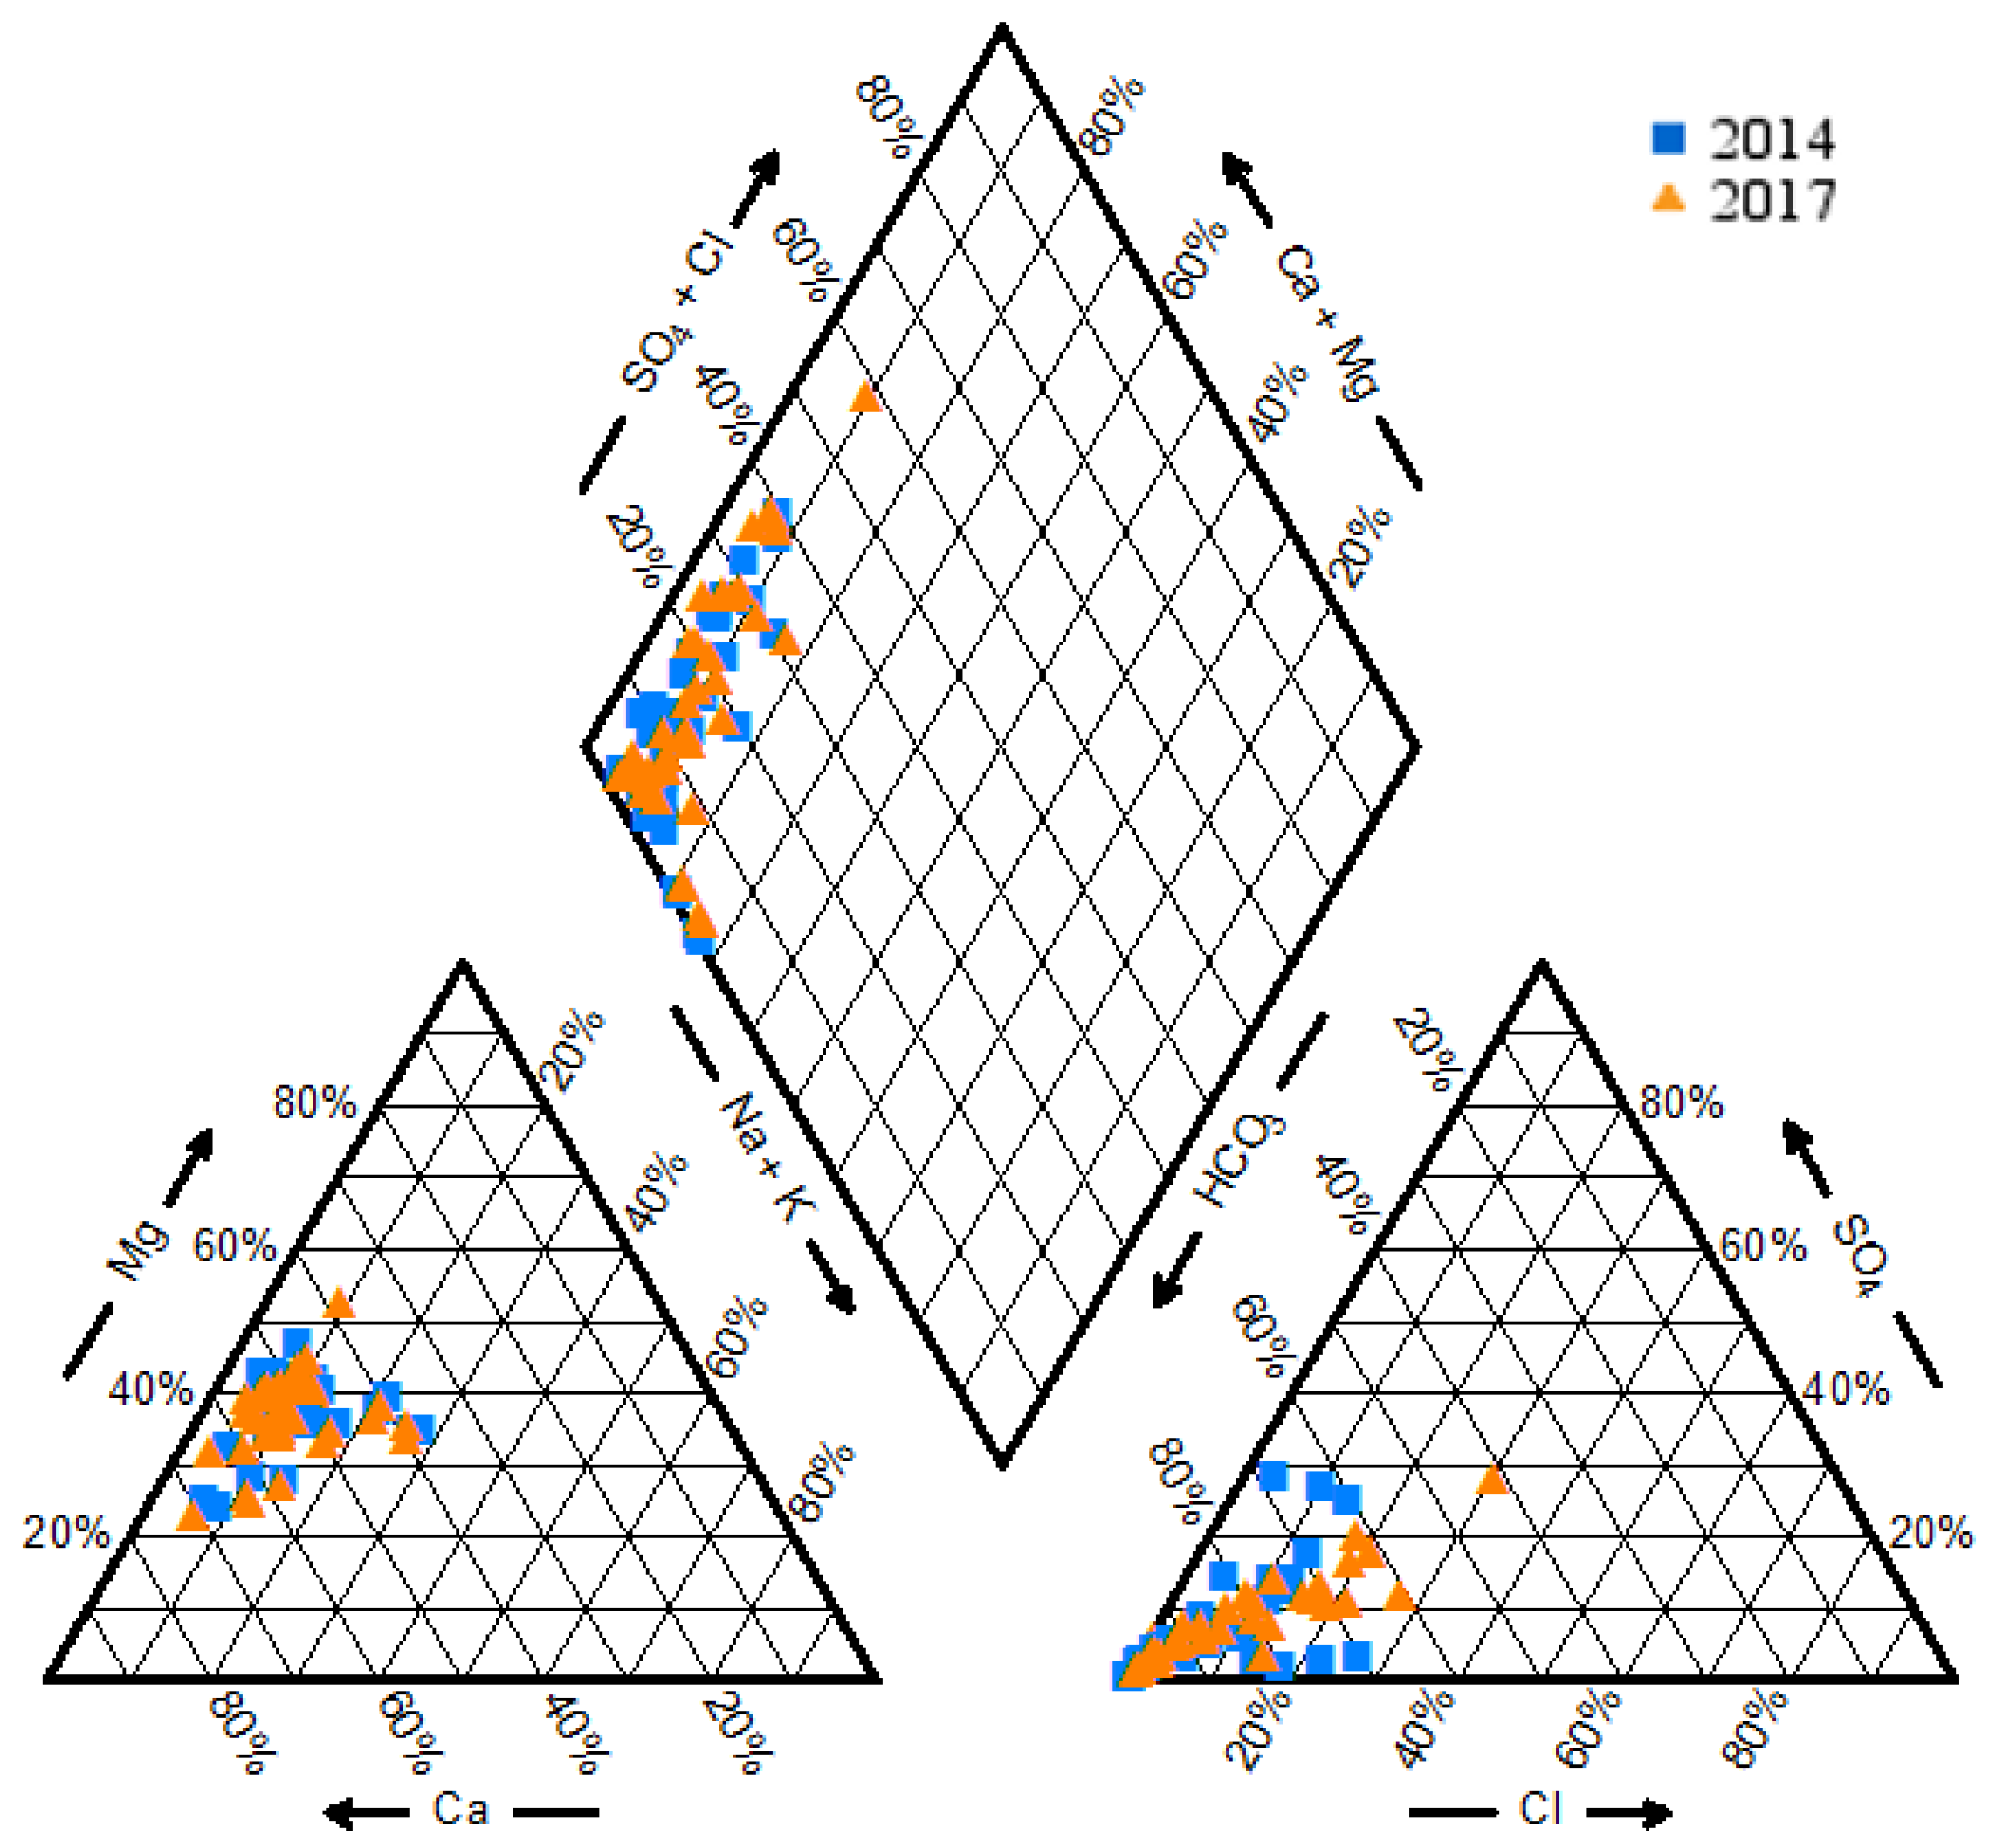
4.1. General Hydrochemical Characteristics
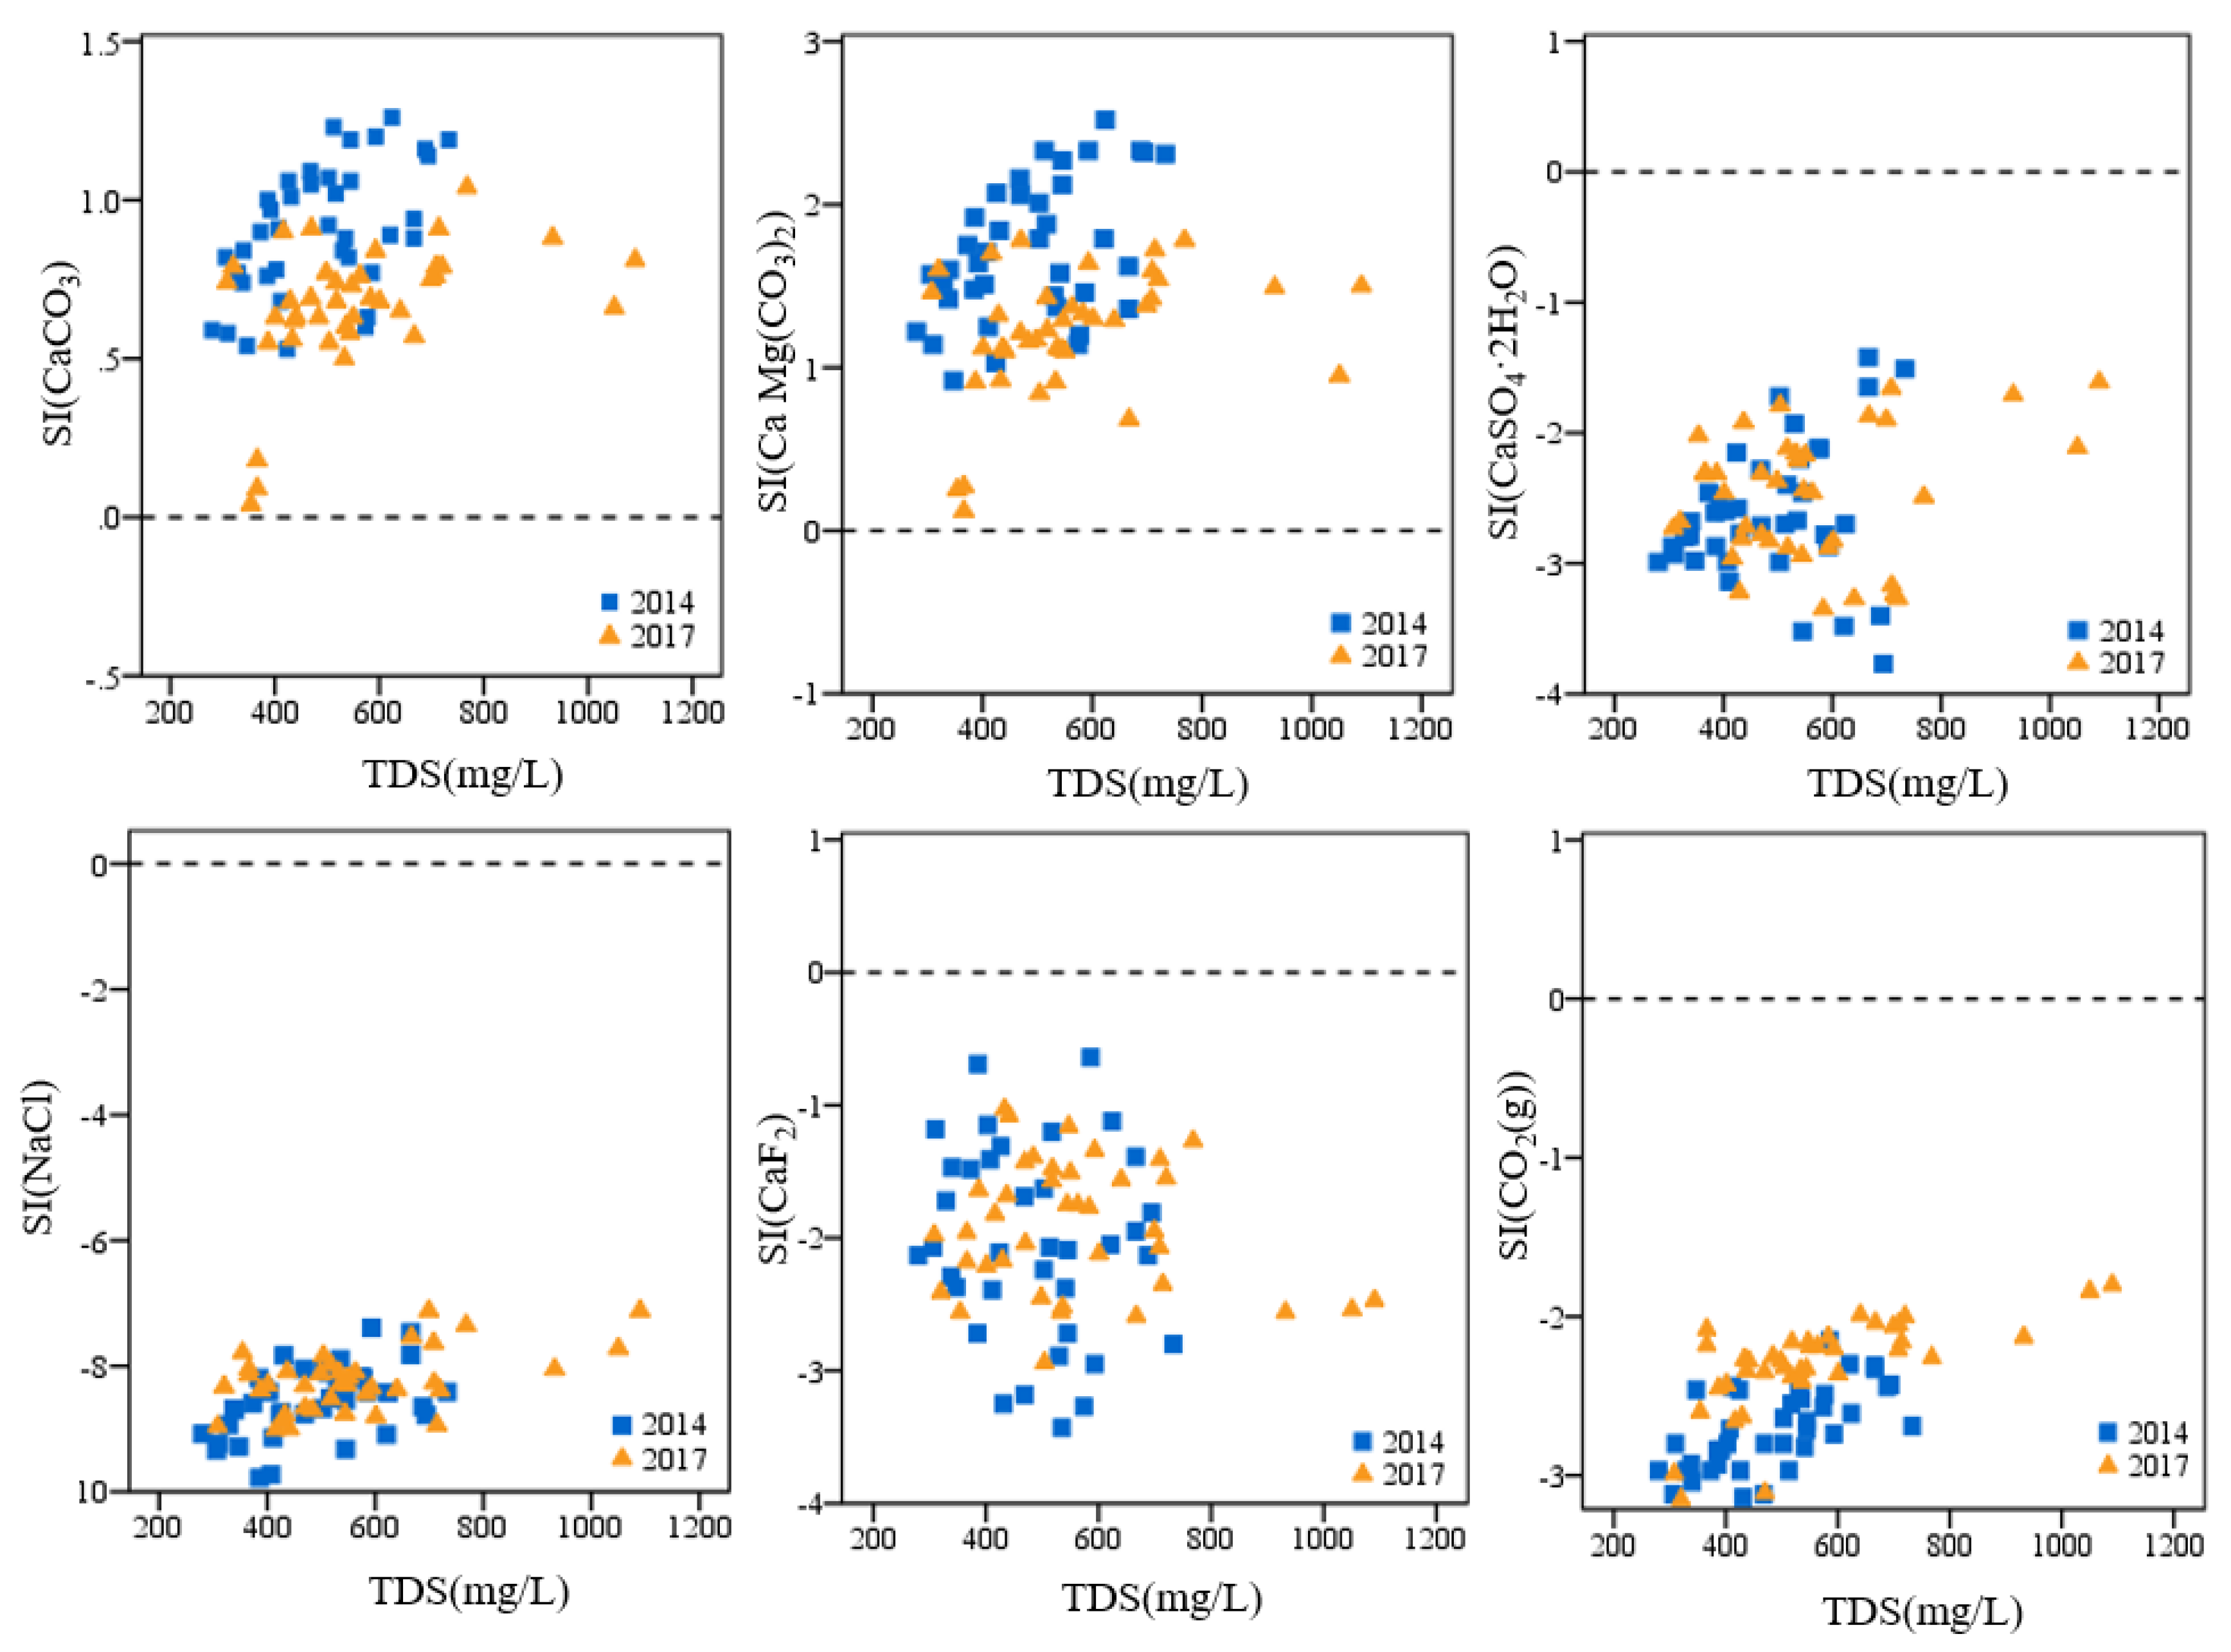
4.2. Correlation and Saturation Index Analysis
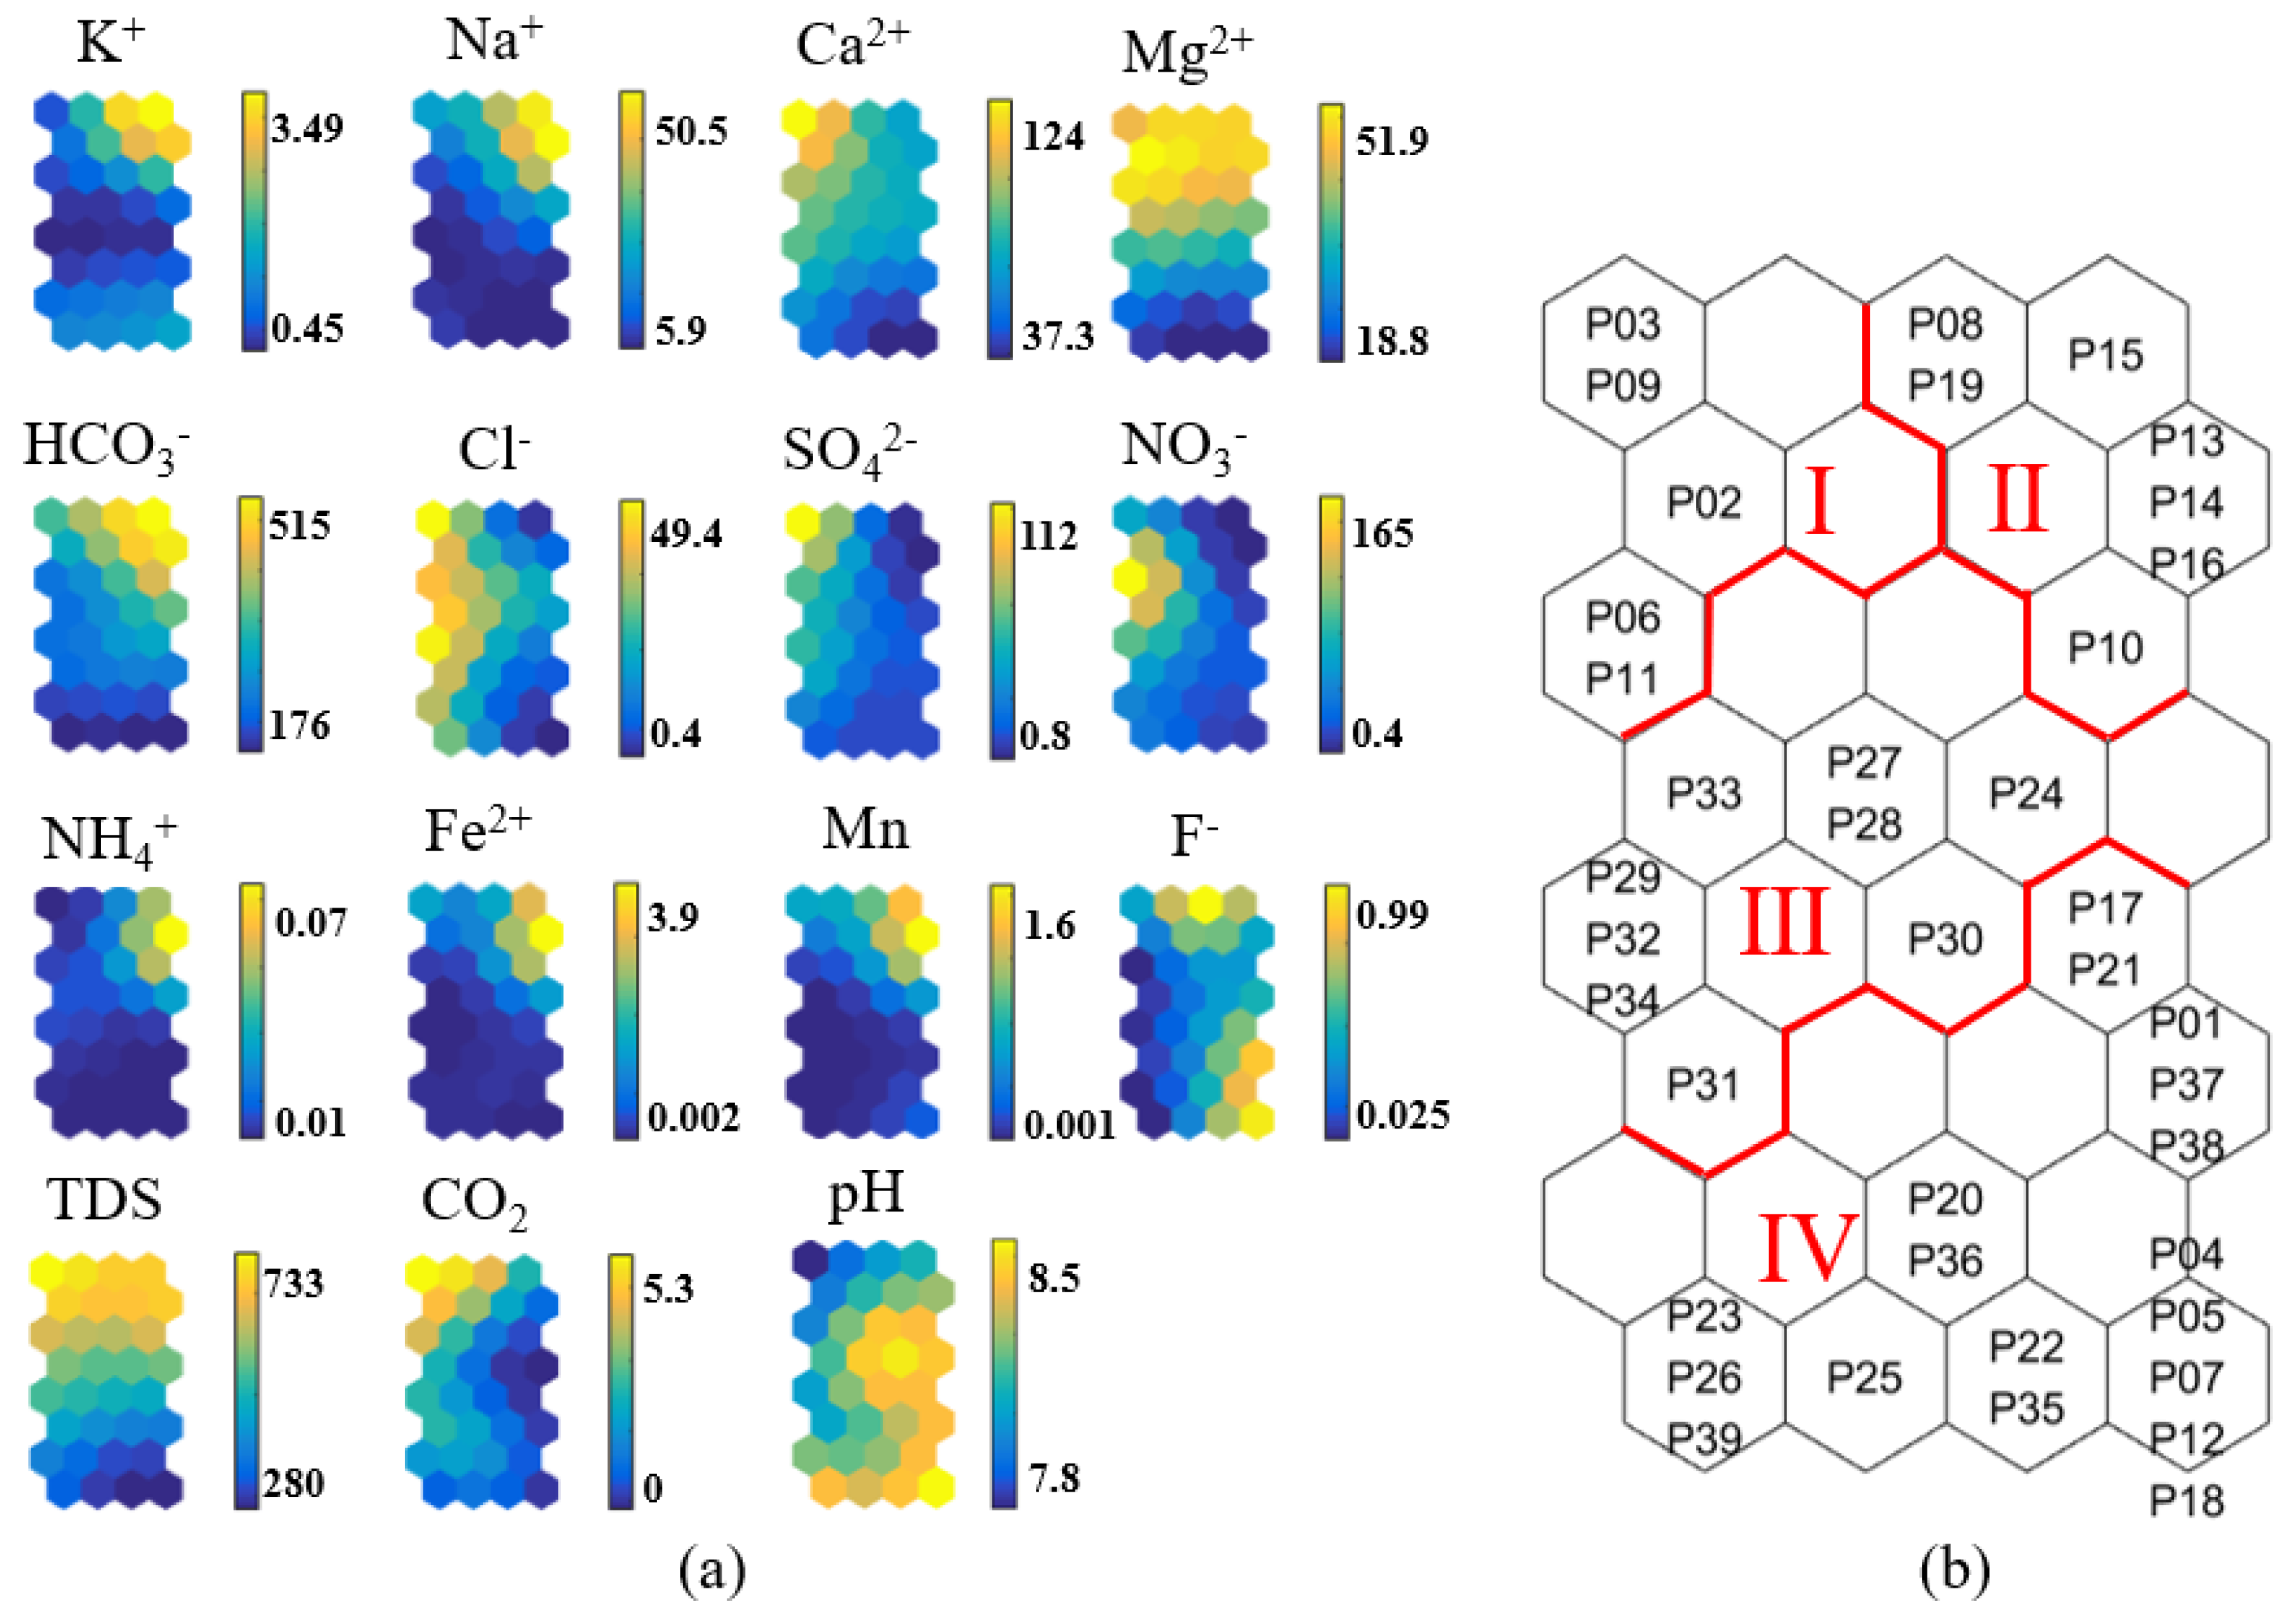
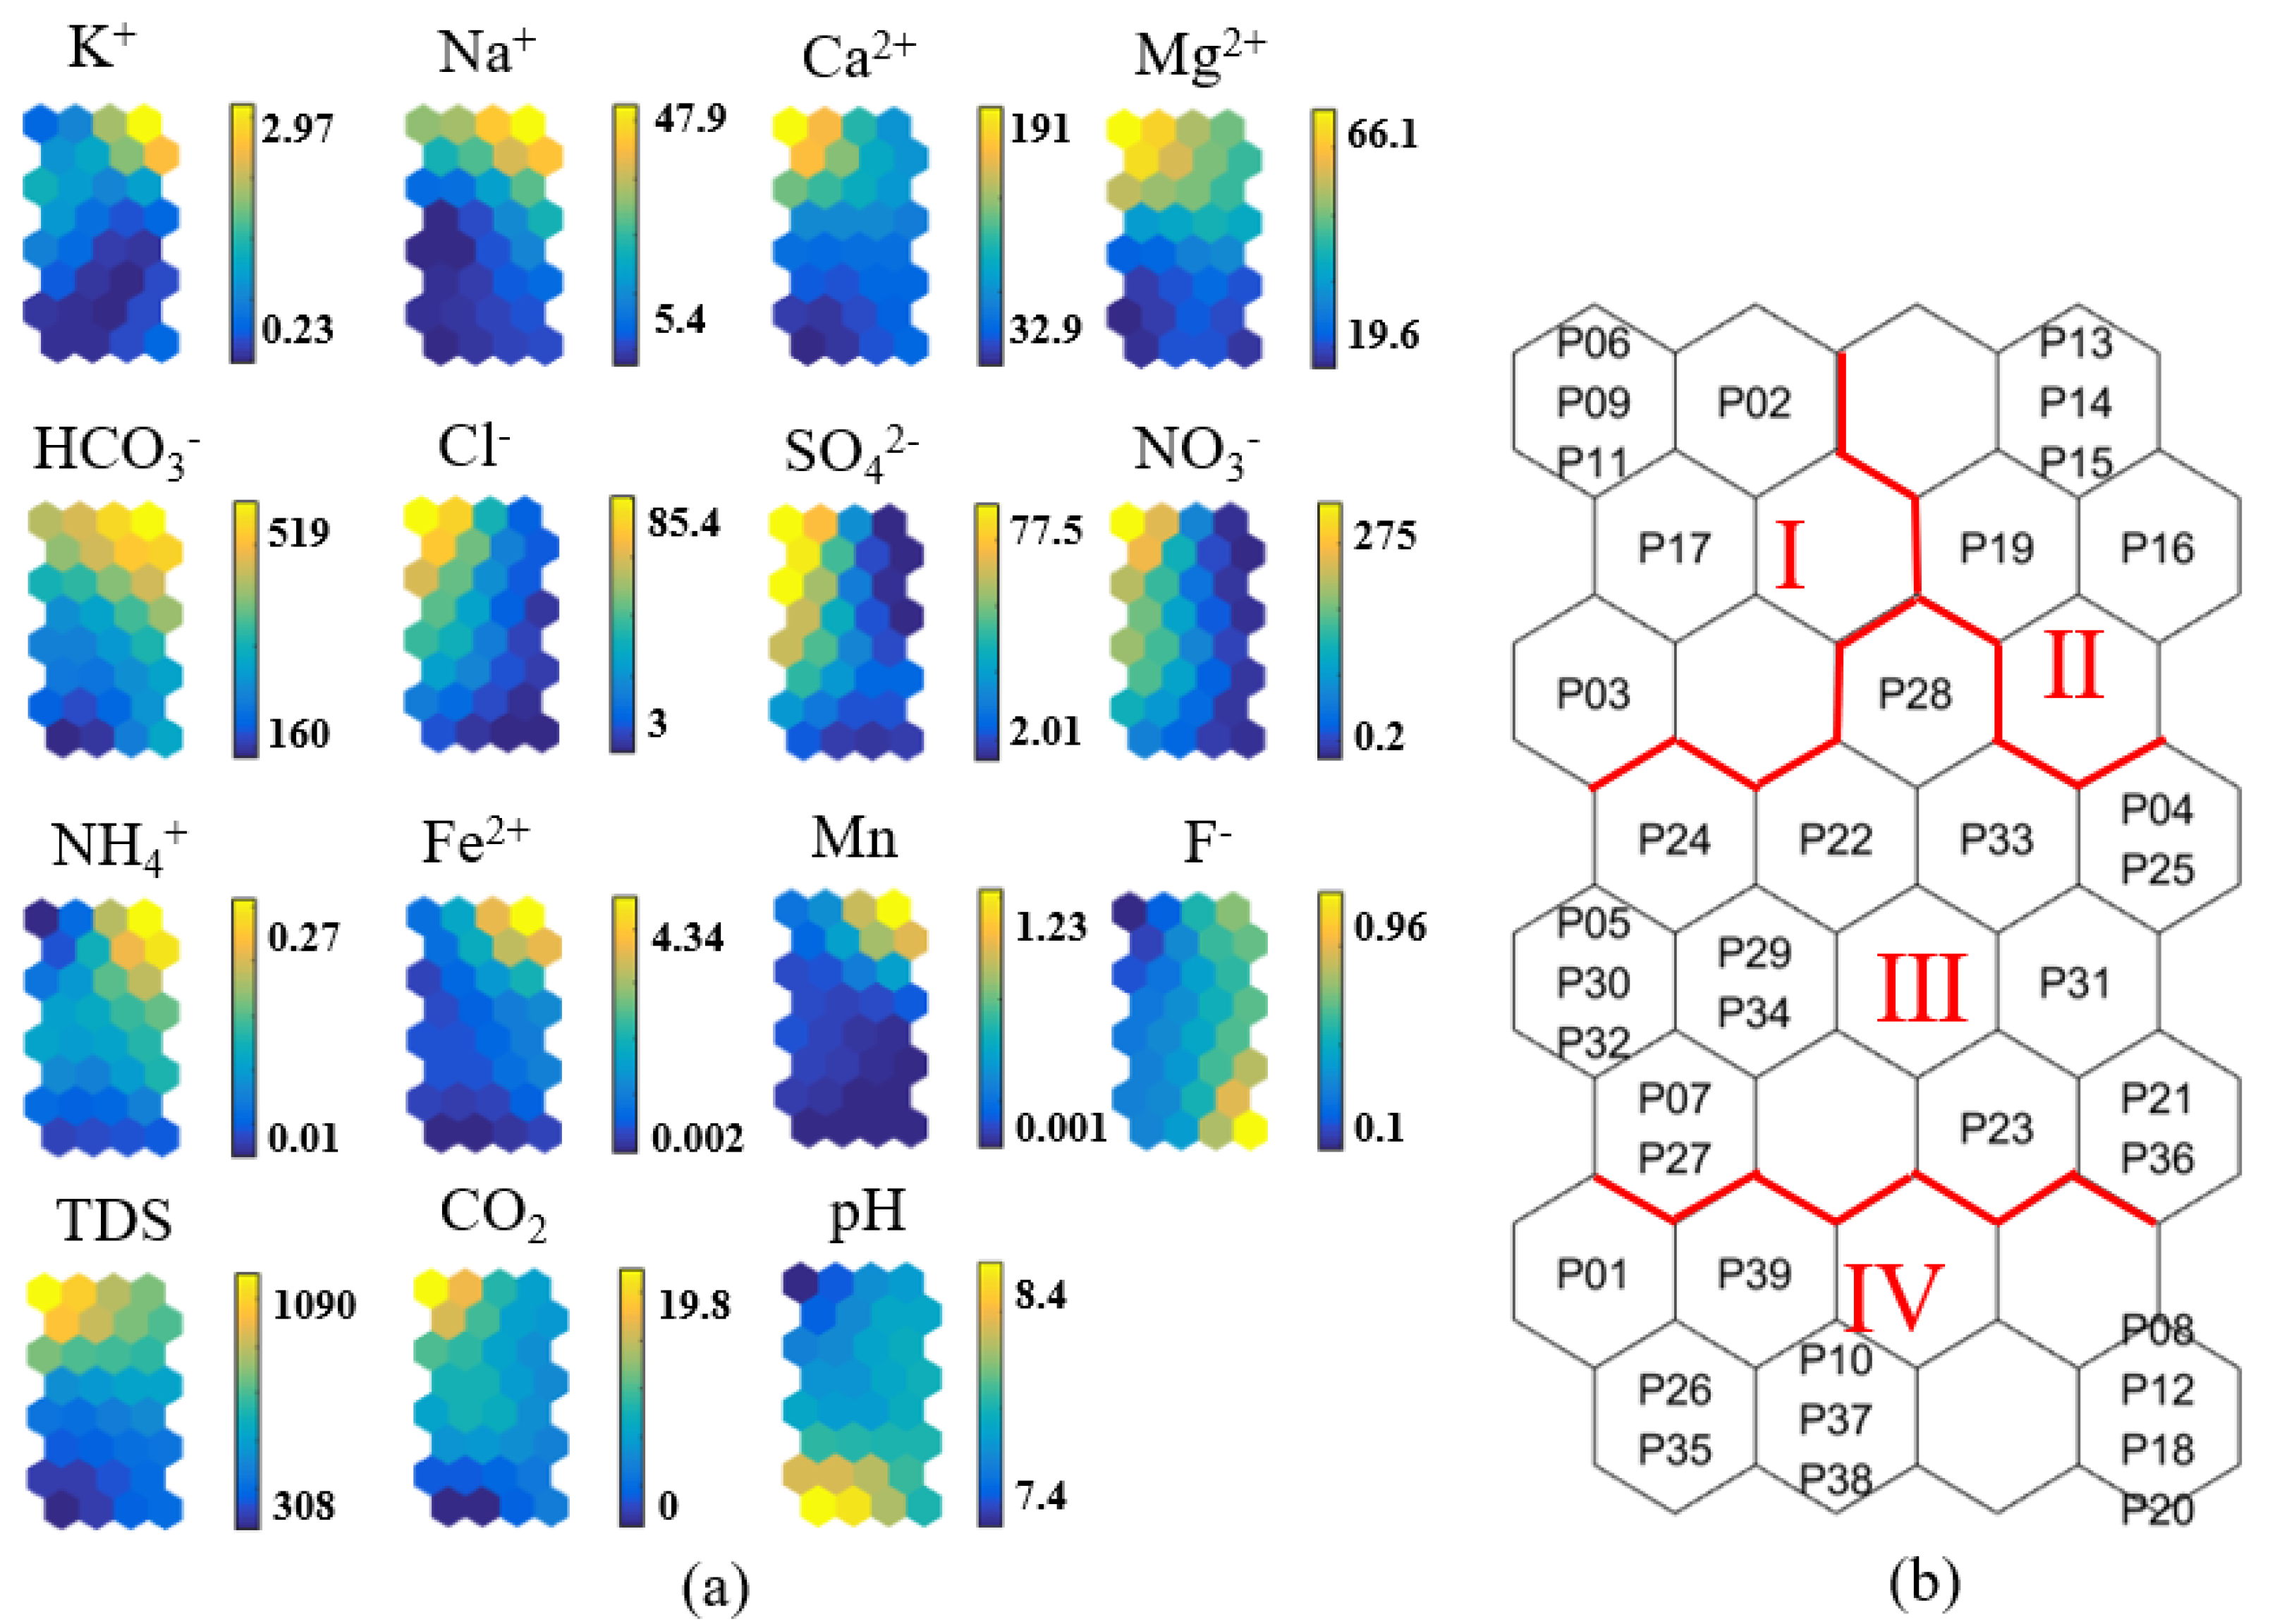
4.3. SOM Results
5. Discussion
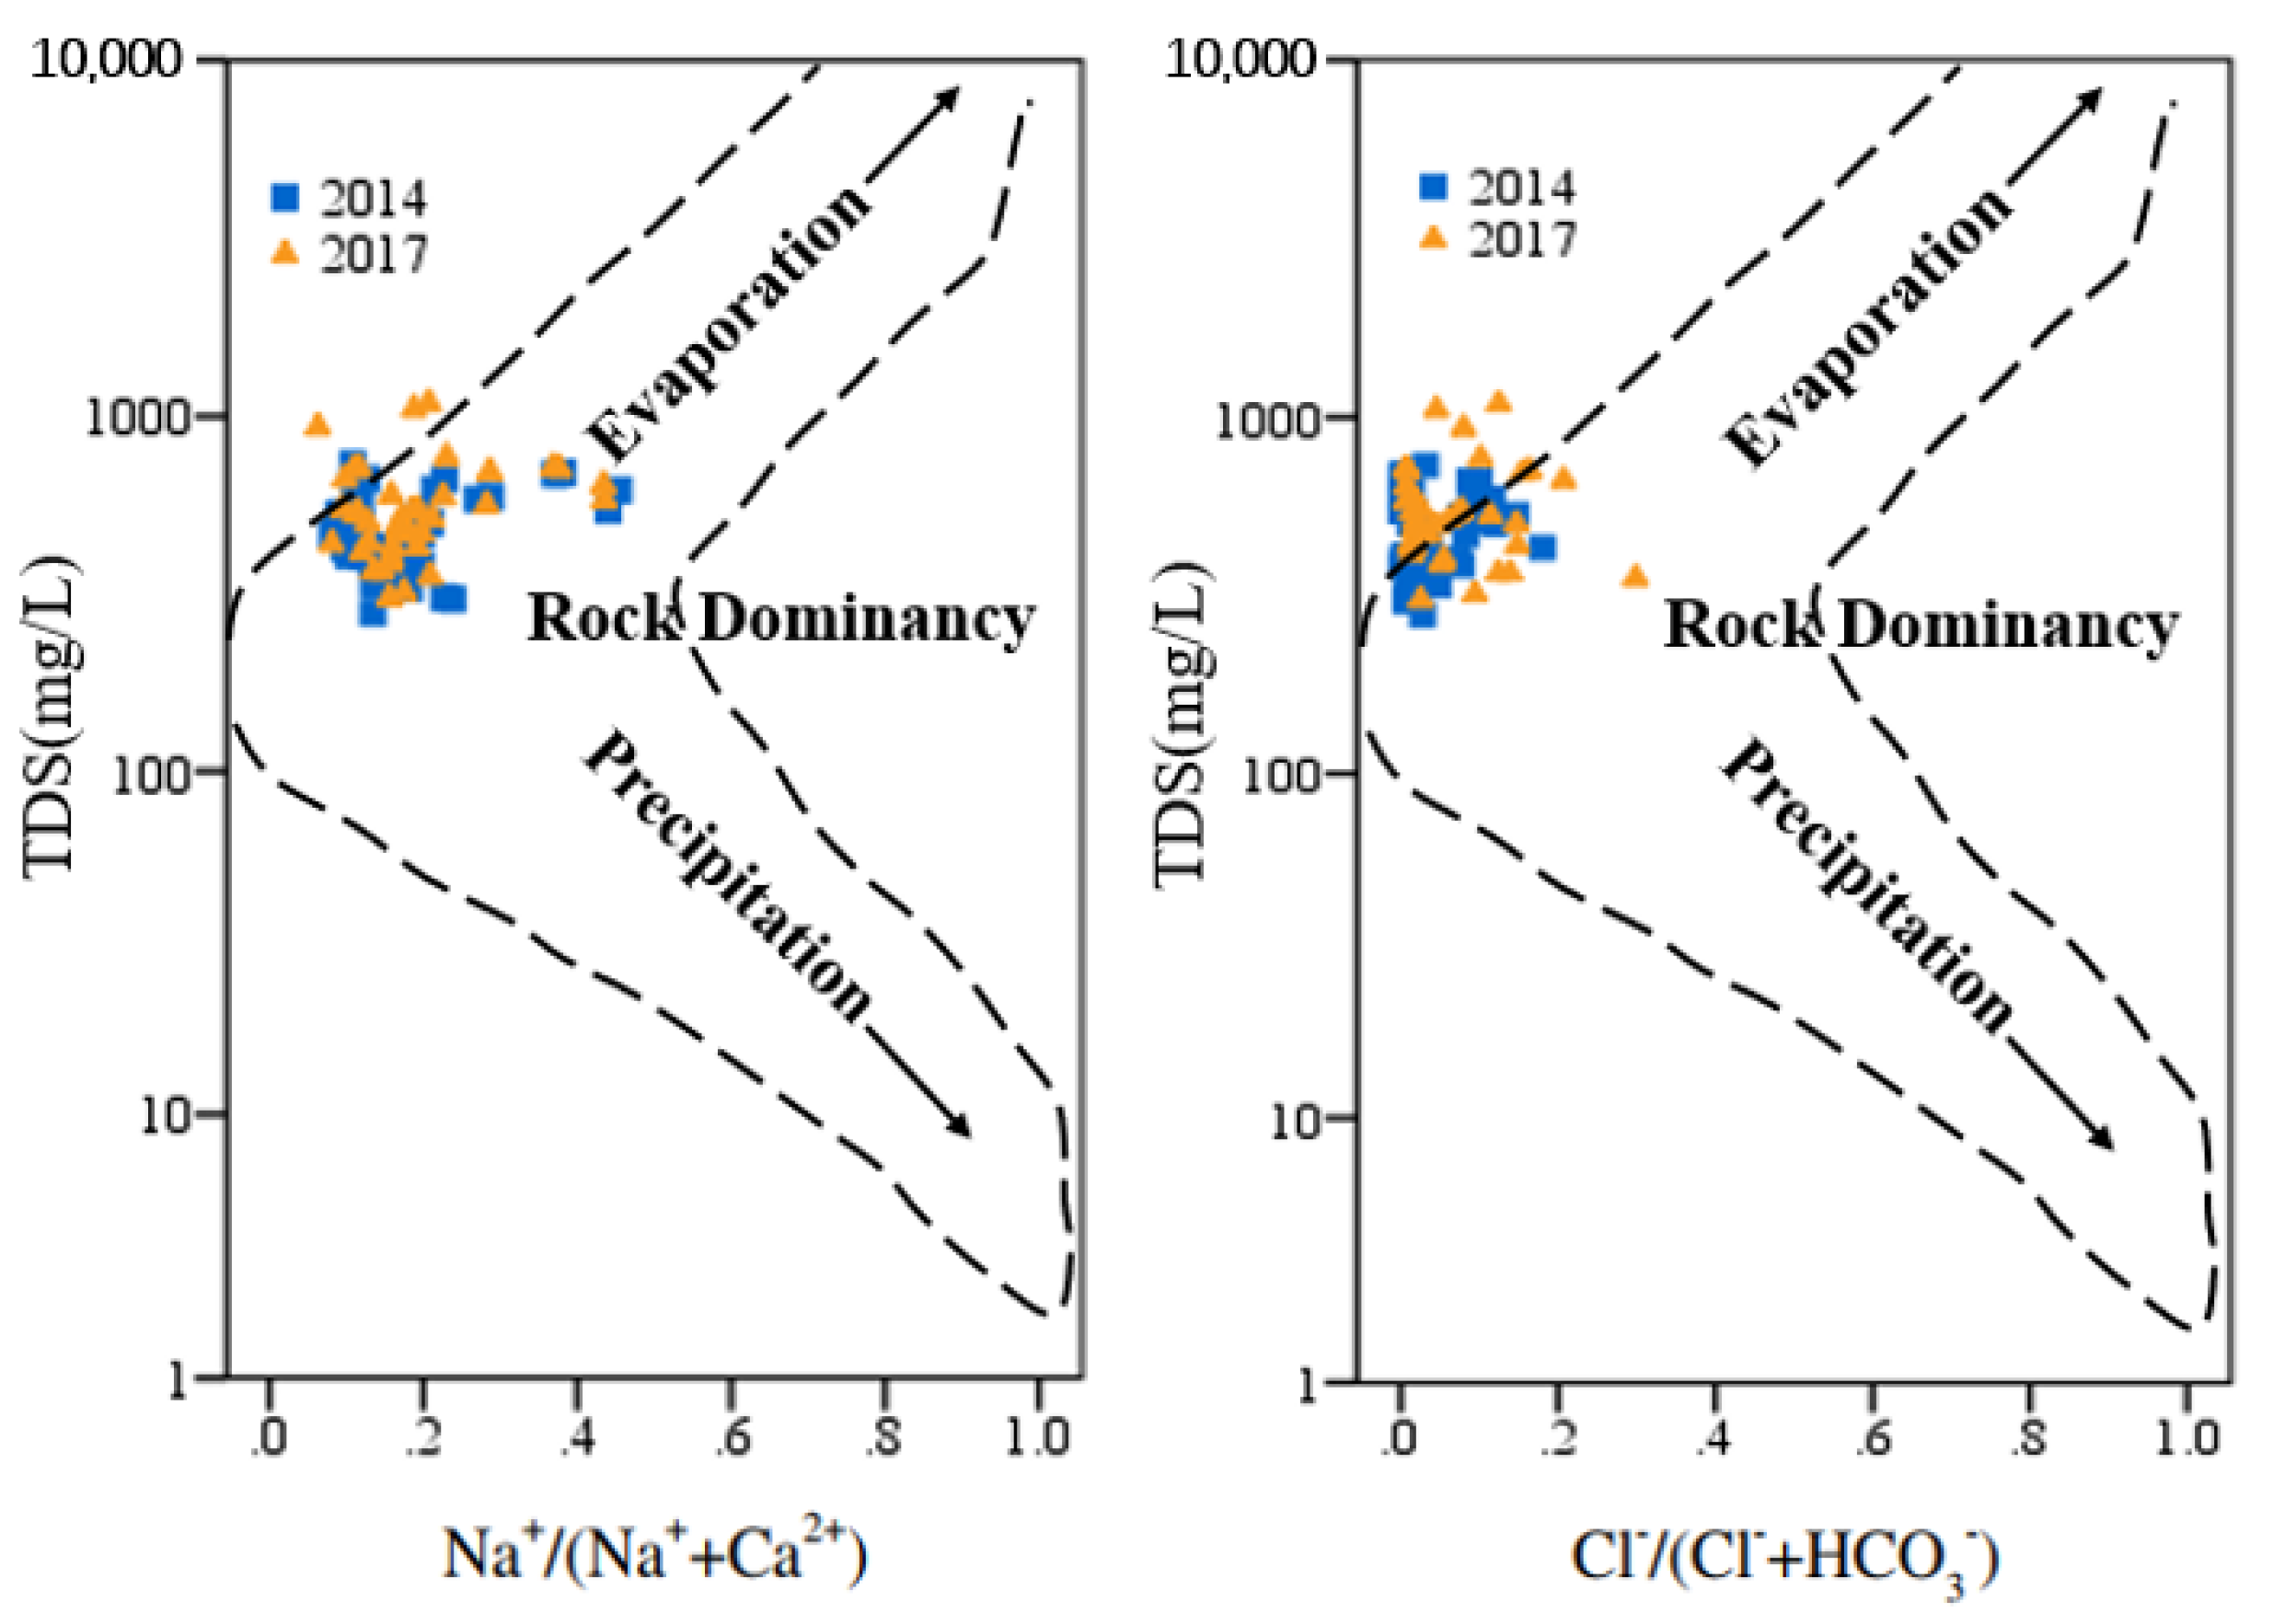
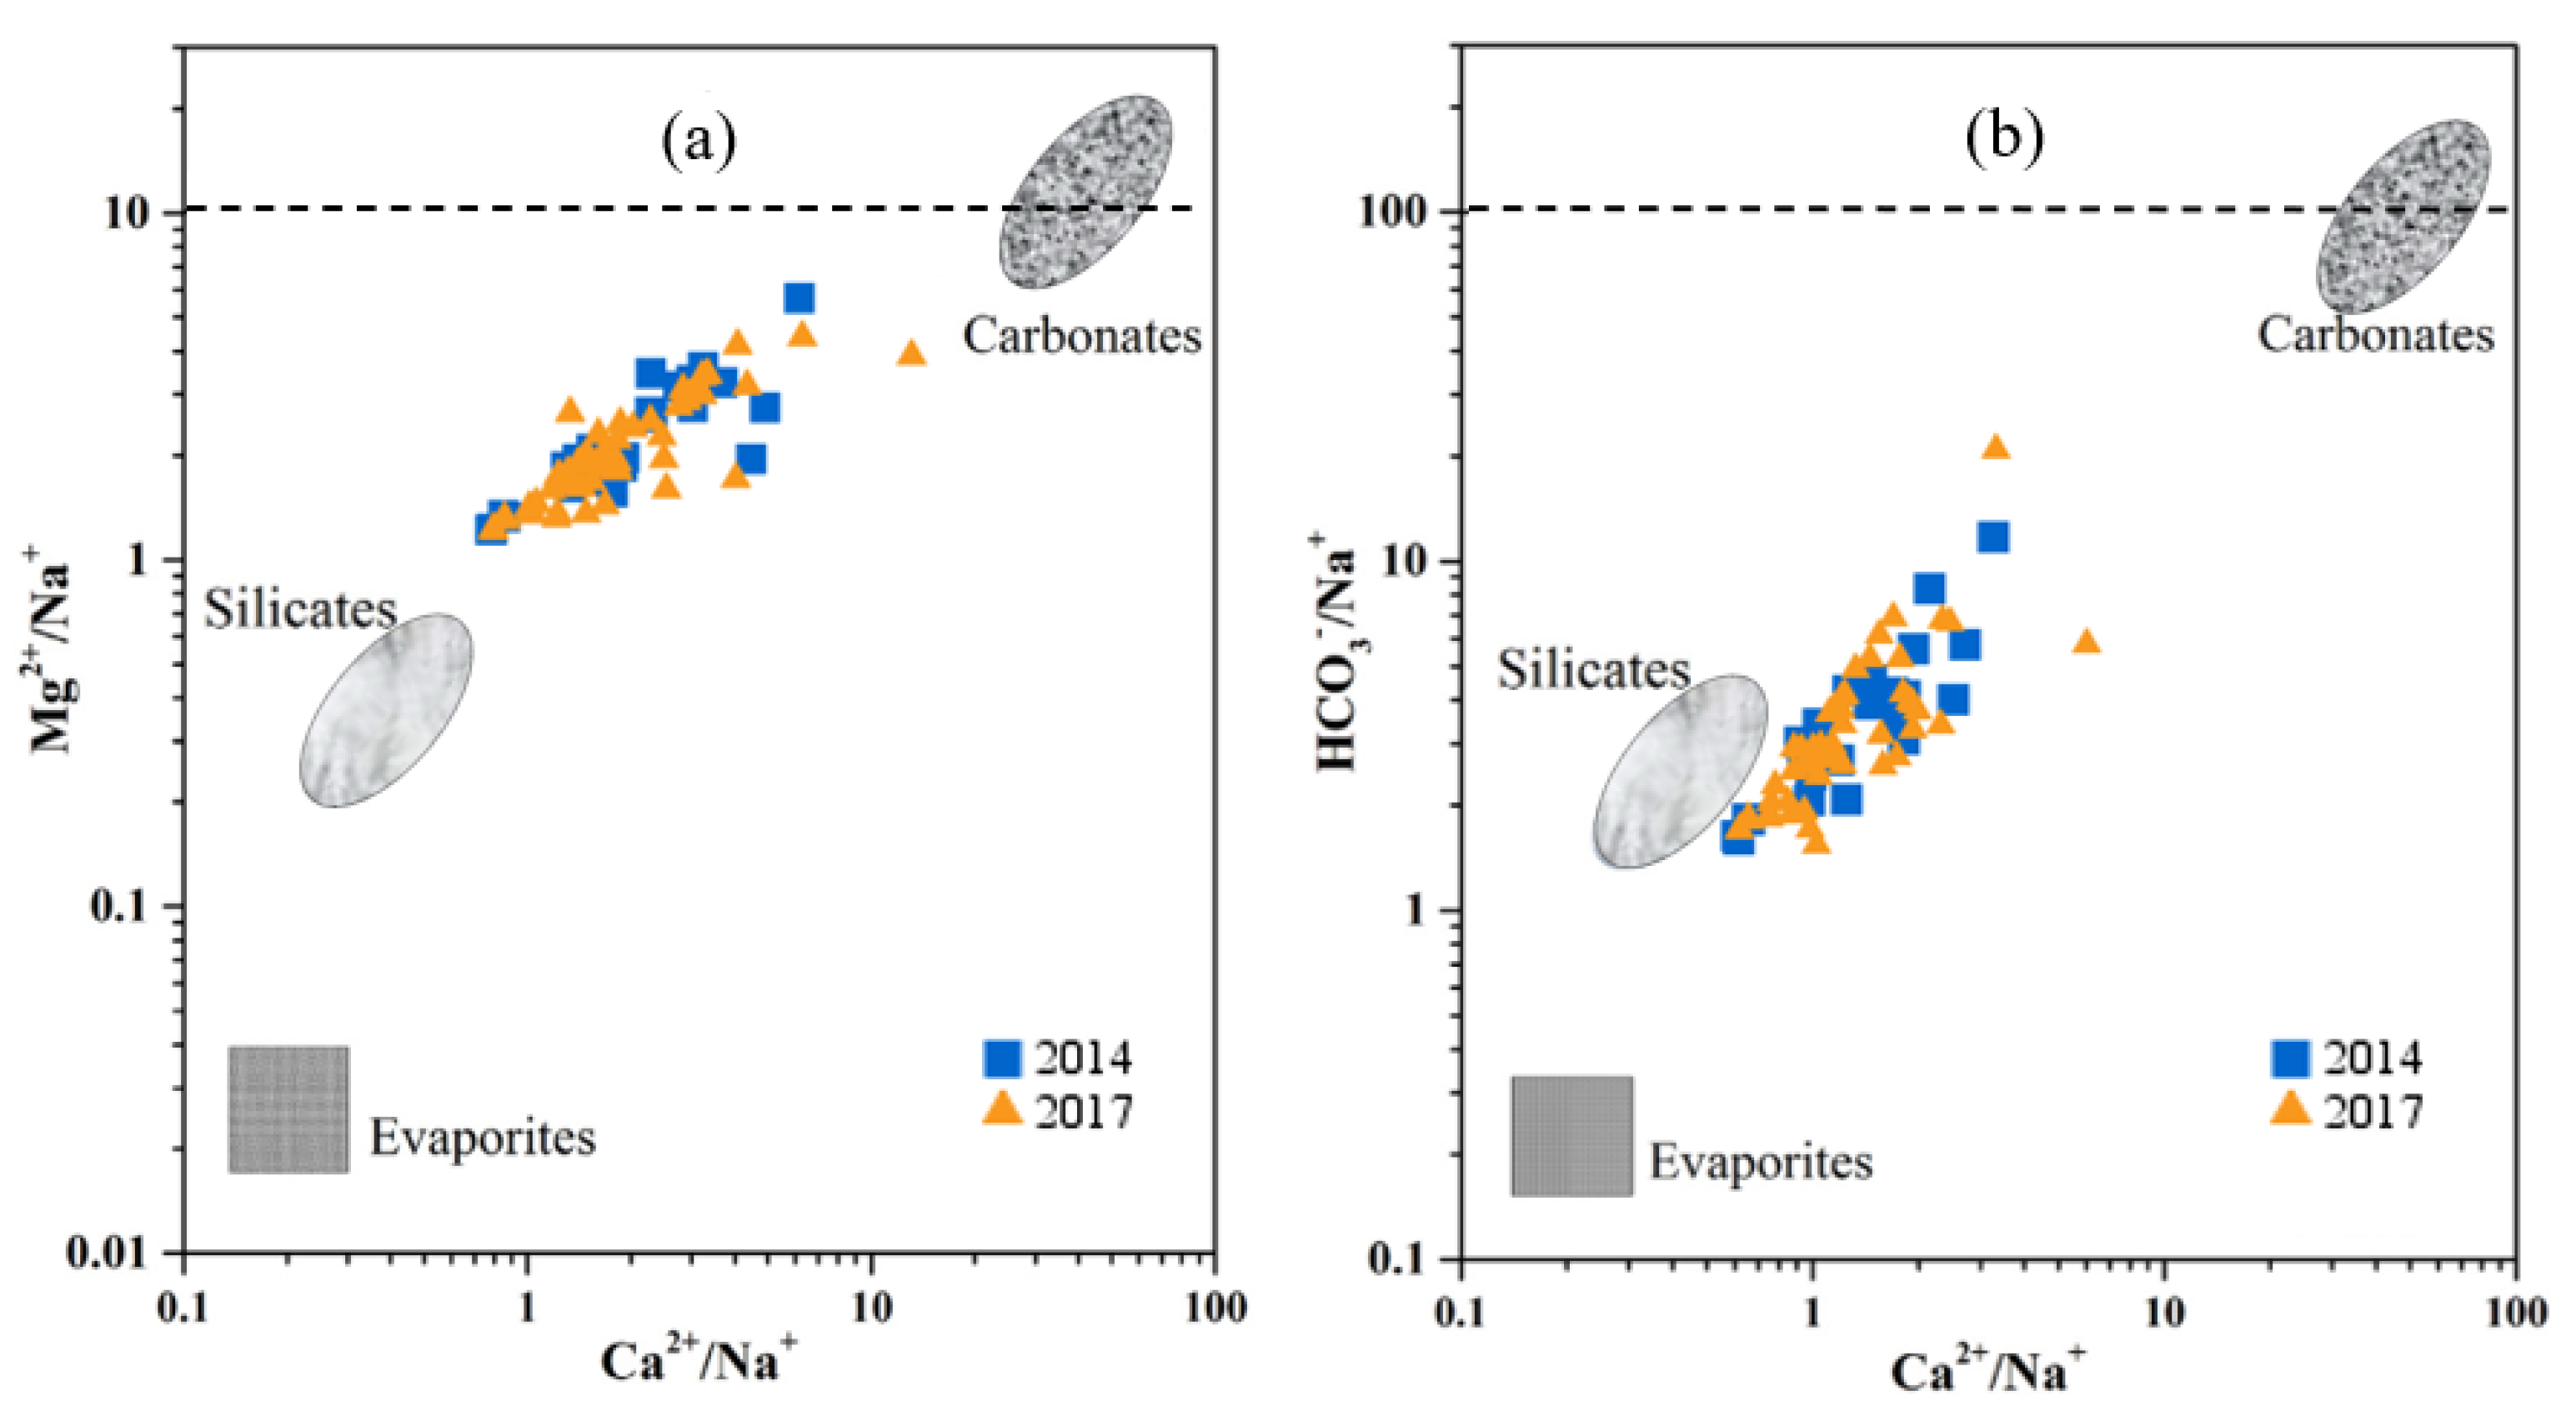
5.1. Formation Mechanisms of Groundwater Chemistry
5.2. Spatiotemporal Variations
6. Conclusions
Author Contributions
Funding
Acknowledgments
Conflicts of Interest
References
- Huang, G.; Sun, J.; Zhang, Y.; Chen, Z.; Liu, F. Impact of anthropogenic and natural processes on the evolution of groundwater chemistry in a rapidly urbanized coastal area, South China. Sci. Total Environ. 2013, 463–464, 209–221. [Google Scholar] [CrossRef] [PubMed]
- Xiao, J.; Jin, Z.; Wang, J. Assessment of the hydrogeochemistry and groundwater quality of the Tarim River Basin in an extreme arid region, NW China. Environ. Manag. 2014, 53, 135–146. [Google Scholar] [CrossRef] [PubMed]
- Li, P.; Wu, J.; Qian, H.; Lyu, X.; Liu, H. Origin and assessment of groundwater pollution and associated health risk: A case study in an industrial park, northwest China. Environ. Geochem. Health 2014, 36, 693–712. [Google Scholar] [CrossRef] [PubMed]
- Monjerezi, M.; Vort, R.D.; Aagaard, P.; Saka, J.D.K. Hydro-geochemical processes in an area with saline groundwater in lower Shire River valley, Malawi: An integrated application of hierarchical cluster and principal component analyses. Appl. Geochem. 2011, 26, 1399–1413. [Google Scholar] [CrossRef]
- Yan, B.; Xiao, C.; Liang, X.; Fang, Z. Impacts of urban land use on nitrate contamination in groundwater, Jilin City, Northeast China. Arab. J. Geosci. 2016, 9, 105. [Google Scholar] [CrossRef]
- Lu, H.; Yin, C. Shallow groundwater nitrogen responses to different land use managements in the riparian zone of Yuqiao Reservoir in North China. J. Environ. Sci. 2008, 20, 652–657. [Google Scholar] [CrossRef] [Green Version]
- Gurunadha Rao, V.V.S.; Tamma Rao, G.; Surinaidu, L.; Mahesh, J.; Mallikharjuna Rao, S.T.; Mangaraja Rao, B. Assessment of geochemical processes occurring in groundwaters in the coastal alluvial aquifer. Environ. Monit. Assess. 2013, 185, 8259–8272. [Google Scholar] [CrossRef]
- Sahraei Parizi, H.; Samani, N. Geochemical evolution and quality assessment of water resources in the Sarcheshmeh copper mine area (Iran) using multivariate statistical techniques. Environ. Earth Sci. 2013, 69, 1699–1718. [Google Scholar] [CrossRef]
- Pant, R.R.; Zhang, F.; Rehman, F.U.; Wang, G.; Ye, M.; Zeng, C.; Tang, H. Spatiotemporal variations of hydrogeochemistry and its controlling factors in the Gandaki River Basin, Central Himalaya Nepal. Sci. Total Environ. 2018, 622–623, 770–782. [Google Scholar] [CrossRef]
- Güler, G.; Kurt, M.A.; Alpaslan, M.; Akbulut, C. Assessment of the impact of anthropogenic activities on the groundwater hydrology and chemistry in Tarsus coastal plain (Mersin, SE Turkey) using fuzzy clustering, multivariate statistics and GIS techniques. J. Hydrol. 2012, 414–415, 435–451. [Google Scholar] [CrossRef]
- Reghunath, R.; Sreedhara Murthy, T.R.; Raghavan, B.R. The utility of multivariate statistical techniques in hydrogeochemical studies: An example from Karnataka, India. Water Res. 2002, 36, 2437–2442. [Google Scholar] [CrossRef]
- Lischeid, G. Non-linear visualization and analysis of large water quality data sets: A model-free basis for efficient monitoring and risk assessment. Stoch. Environ. Res. Risk Assess. 2009, 23, 977–990. [Google Scholar] [CrossRef]
- Wongravee, K.; Lloyd, G.R.; Silwood, C.J.; Crootveld, M.; Brereton, R.G. Supervised Self Organization Maps for classification and determination of potentially discriminatory variables: Illustrated by application to nuclear magnetic resonance metabolomic profiling. Anal. Chem. 2010, 82, 628–638. [Google Scholar] [CrossRef] [PubMed]
- Güler, C.; Thyne, G.D.; McCray, J.E.; Turner, A.K. Evaluation of graphical and multivariate statistical methods for classification of water chemistry data. Hydrogeol. J. 2002, 10, 455–474. [Google Scholar] [CrossRef]
- Nguyen, T.T.; Kawamura, A.; Tong, T.N.; Nakagawa, N.; Amaguchi, H.; Gilbuena, R., Jr. Clustering spatio–seasonal hydrogeochemical data using Self-Organizing Maps for groundwater quality assessment in the Red River Delta, Vietnam. J. Hydrol. 2015, 522, 661–673. [Google Scholar] [CrossRef]
- Pearce, A.R.; Rizzo, D.M.; Mouser, P.J. Subsurface characterization of groundwater contaminated by landfill leachate using microbial community profile data and a nonparametric decision-making process. Water Resour. Res. 2011, 47, W06511. [Google Scholar] [CrossRef] [Green Version]
- Skwarzec, B.; Kabat, K.; Astel, A. Seasonal and spatial variability of 210Po, 238U and 239+240Pu levels in the river catchment area assessed by application of neural network based classification. J. Environ. Radioact. 2009, 100, 167–175. [Google Scholar] [CrossRef]
- Zelazny, M.; Astel, A.; Wolanin, A.; Malek, S. Spatiotemporal dynamics of spring and stream water chemistry in a high-mountain area. Environ. Pollut. 2011, 159, 1048–1057. [Google Scholar] [CrossRef]
- Yang, Q.C.; Liang, J.; Liu, L.C. Numerical Model for the Capacity Evaluation of Shallow Groundwater Heat Pumps in Beijing Plain, China. Procedia Environ. Sci. 2011, 10, 881–889. [Google Scholar] [CrossRef] [Green Version]
- Kohonen, T. Self-organized formation of topologically correct feature maps. Biol. Cybern. 1982, 43, 59–69. [Google Scholar] [CrossRef]
- Hazrati, Y.S.; Datta, B. Adaptive surrogate model based Optimization (ASMBO) for unknown groundwater contaminant source characterizations using Self-Organizing Maps. J. Water Resour. Prot. 2017, 9, 193–214. [Google Scholar] [CrossRef] [Green Version]
- Vesanto, J.; Himberg, J.; Alhoniemi, E.; Parhankangas, J. SOM Toolbox for Matlab 5, Report A57; Helsinki University of Technology: Espoo, Finland, 2000. [Google Scholar]
- Wang, C.; Lek, S.; Lai, Z.; Tudesque, L. Morphology of Aulacoseira filaments as indicator of the aquatic environment in a large subtropical river: The Pearl River, China. Ecol. Indic. 2017, 81, 325–332. [Google Scholar] [CrossRef]
- Choi, B.Y.; Yun, S.T.; Kim, K.H.; Kim, J.W.; Kim, H.M.; Koh, Y.K. Hydrogeochemical interpretation of South Korean groundwater monitoring data using Self-Organizing Maps. J. Geochem. Explor. 2013, 137, 73–84. [Google Scholar] [CrossRef]
- McArthur, J.M.; Sikdar, P.K.; Hoque, M.A.; Ghosal, U. Waste-water impacts on groundwater: Cl/Br ratios and implications for arsenic pollution of groundwater in the Bengal Basin and Red River Basin, Vietnam. Sci. Total Environ. 2012, 437, 390–402. [Google Scholar] [CrossRef] [PubMed] [Green Version]
| Min | Max | Mean | C.V. (%) | Min | Max | Mean | C.V. (%) | |
|---|---|---|---|---|---|---|---|---|
| 2014 | 2017 | |||||||
| TDS | 280 | 733 | 487 | 25.1 | 308 | 1090 | 561 | 32.3 |
| pH | 7.8 | 8.5 | 8.2 | 2.26 | 7.4 | 8.4 | 7.8 | 2.66 |
| K+ | 0.45 | 3.5 | 1.66 | 46.7 | 0.23 | 2.97 | 1.40 | 47.8 |
| Na+ | 5.87 | 50.5 | 16.5 | 72.1 | 5.41 | 47.9 | 18.8 | 69.4 |
| Ca2+ | 37.7 | 124 | 68.7 | 28.2 | 32.9 | 191 | 78.3 | 42.5 |
| Mg2+ | 18.8 | 51.9 | 30.3 | 24.9 | 19.6 | 66.1 | 31.5 | 29.9 |
| NH4+ | 0.01 | 0.1 | 0.01 | 87.4 | 0.01 | 0.27 | 0.07 | 95.2 |
| HCO3− | 176 | 515 | 295 | 31.4 | 160 | 519 | 337 | 28.2 |
| Cl− | 0.4 | 48.4 | 14.2 | 99.4 | 3.01 | 85.4 | 22.1 | 105 |
| SO42− | 0.8 | 112 | 18.8 | 126 | 2.01 | 77.5 | 21.1 | 98.4 |
| NO3− | 0.4 | 165 | 26.8 | 149 | 0.2 | 275 | 35.2 | 144 |
| F− | 0.025 | 0.99 | 0.38 | 76.7 | 0.1 | 0.96 | 0.40 | 55.5 |
| Fe2+ | 0.002 | 3.89 | 0.25 | 268 | 0.002 | 4.34 | 0.21 | 327 |
| Mn | 0.001 | 1.59 | 0.15 | 235 | 0.001 | 1.23 | 0.15 | 199 |
| CO2 | 0 | 5.30 | 0.94 | 170 | 0 | 19.8 | 5.52 | 83.9 |
| K+ | Na+ | Ca2+ | Mg2+ | NH4+ | HCO3− | Cl− | SO42− | NO3− | F− | Fe2+ | Mn | TDS | CO2 | pH | |
|---|---|---|---|---|---|---|---|---|---|---|---|---|---|---|---|
| K+ | 1.00 | 0.25 * | 0.02 | 0.28 * | 0.09 | 0.25 * | −0.16 | −0.10 | −0.18 | 0.24 * | 0.15 | 0.23 * | 0.19 | −0.04 | 0.20 |
| Na+ | 1.00 | 0.48 ** | 0.52 ** | 0.20 | 0.73 ** | −0.04 | −0.12 | −0.31 ** | 0.12 | 0.42 ** | 0.53 ** | 0.71 ** | 0.27 * | −0.09 | |
| Ca2+ | 1.00 | 0.68 ** | 0.08 | 0.60 ** | 0.51 ** | 0.40 ** | 0.24 * | −0.25 * | 0.12 | 0.18 | 0.87 ** | 0.44 ** | −0.19 | ||
| Mg2+ | 1.00 | 0.07 | 0.57 ** | 0.18 | 0.12 | 0.08 | −0.07 | 0.17 | 0.25 * | 0.83 ** | 0.25 * | −0.03 | |||
| NH4+ | 1.00 | 0.25 * | 0.07 | −0.06 | −0.06 | 0.16 | 0.44 ** | 0.58 ** | 0.21 | 0.43 ** | −0.39 ** | ||||
| HCO3− | 1.00 | 0.00 | −0.08 | −0.30 ** | 0.22 * | 0.33 ** | 0.54 ** | 0.82 ** | 0.45 ** | −0.27 * | |||||
| Cl− | 1.00 | 0.81 ** | 0.64 ** | −0.33 ** | −0.04 | 0.06 | 0.26 * | 0.37 ** | −0.11 | ||||||
| SO42− | 1.00 | 0.66 ** | −0.20 | −0.22 * | −0.04 | 0.15 | 0.31 ** | −0.09 | |||||||
| NO3− | 1.00 | −0.39 ** | −0.11 | −0.19 | 0.00 | 0.17 | 0.03 | ||||||||
| F− | 1.00 | 0.11 | 0.21 | −0.09 | 0.04 | 0.05 | |||||||||
| Fe2+ | 1.00 | 0.55 ** | 0.28 * | 0.17 | −0.13 | ||||||||||
| Mn | 1.00 | 0.45 ** | 0.51 ** | −0.47 ** | |||||||||||
| TDS | 1.00 | 0.50 ** | −0.28 * | ||||||||||||
| CO2 | 1.00 | −0.78 ** | |||||||||||||
| pH | 1.00 |
| N | TDS | pH | K+ | Na+ | Ca2+ | Mg2+ | NH4+ | HCO3− | Cl− | SO42− | NO3− | F− | Fe2+ | Mn | CO2 | ||
|---|---|---|---|---|---|---|---|---|---|---|---|---|---|---|---|---|---|
| C1 | 2014 | 5 | 643.2 | 7.95 | 1.22 | 16.8 | 101.3 | 38.1 | 0.01 | 303.6 | 26.6 | 58.9 | 78.5 | 0.20 | 0.32 | 0.18 | 3.08 |
| 2017 | 6 | 857.7 | 7.61 | 1.40 | 26.6 | 139.0 | 44.1 | 0.01 | 396.7 | 59.9 | 59.5 | 93.2 | 0.18 | 0.09 | 0.12 | 12.0 | |
| C2 | 2014 | 7 | 621.6 | 8.13 | 2.93 | 37.7 | 70.7 | 37.3 | 0.03 | 450.1 | 9.2 | 3.9 | 2.8 | 0.46 | 0.94 | 0.63 | 1.26 |
| 2017 | 5 | 680.0 | 7.78 | 2.48 | 40.3 | 80.9 | 34.9 | 0.18 | 470.6 | 14.0 | 3.5 | 1.1 | 0.53 | 1.17 | 0.77 | 5.28 | |
| C3 | 2014 | 9 | 503.1 | 8.18 | 1.08 | 10.9 | 76.6 | 31.9 | 0.01 | 275.6 | 22.3 | 27.5 | 43.4 | 0.20 | 0.04 | 0.00 | 0.78 |
| 2017 | 17 | 512.7 | 7.79 | 1.25 | 14.4 | 70.2 | 29.7 | 0.08 | 324.0 | 29.8 | 31.8 | 47.8 | 0.37 | 0.09 | 0.05 | 5.49 | |
| C4 | 2014 | 18 | 382.4 | 8.23 | 1.59 | 10.9 | 55.0 | 24.6 | 0.01 | 243.0 | 8.6 | 9.1 | 13.6 | 0.49 | 0.07 | 0.04 | 0.29 |
| 2017 | 11 | 418.5 | 8.02 | 1.15 | 11.5 | 56.4 | 26.0 | 0.02 | 265.5 | 8.8 | 9.4 | 15.0 | 0.49 | 0.03 | 0.02 | 2.12 |
| Year | Ⅰvs.Ⅱ | Ⅰvs.Ⅲ | Ⅰvs.Ⅳ | Ⅱvs.Ⅲ | Ⅱvs.Ⅳ | Ⅲvs.Ⅳ | ||||||
|---|---|---|---|---|---|---|---|---|---|---|---|---|
| 2014 | 2017 | 2014 | 2017 | 2014 | 2017 | 2014 | 2017 | 2014 | 2017 | 2014 | 2017 | |
| TDS | 0.81 | 0.27 | * | * | * | * | * | * | * | * | * | * |
| pH | 0.12 | * | * | * | * | * | 0.67 | 0.58 | 0.23 | * | 0.68 | * |
| K+ | * | 0.1 | 0.55 | 1 | 0.16 | 0.92 | * | * | * | * | * | 0.19 |
| Na+ | * | 0.14 | * | 0.14 | 0.09 | * | * | * | * | * | 0.88 | 0.34 |
| Ca2+ | * | * | * | * | * | * | 0.31 | 0.33 | * | * | * | * |
| Mg2+ | 0.81 | 0.14 | 0.23 | * | * | * | 0.1 | 0.13 | * | * | * | 0.17 |
| NH4+ | * | * | 0.27 | * | 1 | 0.35 | * | * | * | * | 1 | * |
| HCO3− | * | 0.12 | 0.46 | * | 0.1 | * | * | * | * | * | 0.11 | * |
| Cl− | * | * | 0.46 | * | * | * | * | * | 0.25 | * | * | * |
| SO42− | * | * | 0.46 | * | * | * | * | * | * | * | * | * |
| NO3− | * | * | 0.46 | * | * | * | * | * | * | * | * | * |
| F− | 0.09 | * | 0.64 | * | 0.06 | * | * | 0.6 | 0.9 | 0.43 | * | 0.38 |
| CO2 | 0.15 | * | * | * | * | * | 0.67 | 0.64 | 0.08 | * | 0.18 | * |
| Fe2+ | * | * | 0.52 | 0.48 | 0.939 | 0.24 | * | * | * | * | 0.37 | * |
| Mn | * | * | 0.12 | 0.87 | 0.07 | 0.17 | * | * | * | * | 0.48 | 0.1 |
© 2020 by the authors. Licensee MDPI, Basel, Switzerland. This article is an open access article distributed under the terms and conditions of the Creative Commons Attribution (CC BY) license (http://creativecommons.org/licenses/by/4.0/).
Share and Cite
Li, J.; Shi, Z.; Wang, G.; Liu, F. Evaluating Spatiotemporal Variations of Groundwater Quality in Northeast Beijing by Self-Organizing Map. Water 2020, 12, 1382. https://doi.org/10.3390/w12051382
Li J, Shi Z, Wang G, Liu F. Evaluating Spatiotemporal Variations of Groundwater Quality in Northeast Beijing by Self-Organizing Map. Water. 2020; 12(5):1382. https://doi.org/10.3390/w12051382
Chicago/Turabian StyleLi, Jia, Zheming Shi, Guangcai Wang, and Fei Liu. 2020. "Evaluating Spatiotemporal Variations of Groundwater Quality in Northeast Beijing by Self-Organizing Map" Water 12, no. 5: 1382. https://doi.org/10.3390/w12051382
APA StyleLi, J., Shi, Z., Wang, G., & Liu, F. (2020). Evaluating Spatiotemporal Variations of Groundwater Quality in Northeast Beijing by Self-Organizing Map. Water, 12(5), 1382. https://doi.org/10.3390/w12051382


