1. Introduction
The landscape of Europe has been changed by the river regulations in the past 200 years [
1,
2]. Ninety percent of the original floodplain ecosystems are either disrupted, altered, or have disappeared, decreasing the biodiversity of Europe’s landscapes [
3]. Changing the floodplains had the same effect in Hungary. Before river regulations, the total area of floodplains was 23,000 k
. In the 19th Century, however, ninety-seven percent of wetland habitats were lost [
4]. The remaining habitats are endangered by anthropogenic influence with increasing intensity [
5], mostly affecting saline drylands and floodplains [
6]. Hungarian wetland habitats suffer under environmental loads due to permanent high-water coverage, less frequent changes in water level [
7], and faster aggradation [
8].
Climate change threatens agricultural production in large parts of the world. Groundwater can enhance the resilience of domestic, agricultural, and industrial uses of freshwater in the face of climate variability and change [
9]; thus, better understanding of river flow–shallow groundwater (SGW) systems is a step forward to a more sustainable food production, especially in dry areas [
10]. Hungary will face severe drought stress according to the climate predictions [
11]; thus, understanding processes that determine SGW is crucial especially in the Hungarian Great Plain where our study area is located.
In 1977, the Eötvös Loránd Geophysical Institute of Hungary (ELGI) performed complex geophysical-hydrogeological research on the Danube-Mohács bank by drilling. The complex geophysical-hydrogeological research plan for the whole area of the island [
12] was prepared considering the measurements showing favorable hydrogeological conditions. They aimed to study the thickness and extent of Pleistocene alluvium and to assess the intensity of communication between the aquifer and the Danube. In 1981, geophysical research was carried out to find the hydrogeological conditions of Mohács Island [
12,
13]. Draskovits and Jósa [
12] defined surface formations, the thickness of the alluvium, the impermeable Pannonian clay formations, and the high resistance basement.
Structural changes in the area gradually followed flood control and draining operations [
14]. Since regulations, the riverbed deepened by about 1.5 m [
15], lowering groundwater tables. Consequently, as water has become inaccessible to plant roots farther from the river, vegetation has gradually reduced in inland areas.
SGW in the area of Mohács Island is still connected to the Danube River through aquifers. While floods usually do not reach lands beyond the levee anymore, due to underground flood wave propagation, they raise the body of SGW. It is important to investigate and properly understand such connections in spatial and temporal terms during flood events, especially in different aquifer types.
Bank filtrate wells also pose danger to the SGW tables of islands [
16]. Fast recharge rates result in spatial and temporal differences in the efficacy of filtration and increase the potential migration of pollutants (e.g., heavy metals) into the aquifer. As a result, artificial recharge by production wells increases the vulnerability of the aquifer. Forced groundwater abstraction changes natural SGW dynamics by creating high negative hydraulic gradients, causing surface water to infiltrate into bank and bottom sediments [
17], further enhancing surface water and groundwater interaction.
SGW level was used as the base metric in the analysis, which is one of the most essential metrics in hydrogeology, measuring hydraulic head. It can be used for a multitude of analyses, like determining aquifer stress from pumping and recharge or to characterize groundwater and surface water interactions [
18]. SGW level data—coming from piezometric measurements—are considered multi-factor time-series data, incorporating many processes from the hydrological cycle [
18]. Due to memory effects mostly resulting from periodic behavior with a lagged response [
19], such time-series data need careful evaluation.
Sophocleous [
20] stated that an aquifer with a shallow and relatively thin clay cover layer behaves as a confined aquifer with low storativity, but high transmissivity, thus allowing pressure waves of a flood to travel rapidly. According to Vekerdy and Meijerink [
21], the increased pressure causes only an elastic compression of aquifer material and fast propagation of the pressure head in the semi-confined aquifer. Furthermore, Wett et al. [
22] stated that water fills un- and semi-saturated pores of the body of the uncovered aquifer and causes an expansion of the water body. Subsequently, the elevated groundwater table propagates the pressure. Under confined or semi-confined circumstances, however, the expansion of the water body is hindered. Both researchers claimed that pressure head propagation occurs in unconfined or phreatic aquifers much slower than in confined or semi-confined aquifers.
During our study, several time-series of daily piezometer data were used. There were 20 years of time-series from 30 monitoring wells scattered throughout the study area and from the Danube River level gauge. A 10 year time-series was available for 25 production wells. Daily precipitation data were also at out disposal from six different meteorological stations with different intervals. Data from the monitoring wells were compared to the Danube water levels measured using a linear regression model (LM). Furthermore, since besides the Danube, production wells and precipitation also affect groundwater tables, additional time-series were included in the LM. Finally, summarized effects on the LM with every independent variable were assessed and visualized on maps. From the comparisons, the strength of the relationship, propagation speed, and the proportion of the groundwater head rise and the flood wave were determined. Effect and propagation maps and diagrams were generated from the results.
The northern part of Mohács Island is complex in terms of both water management and geology. Riverside areas with similar geological structures are found in many places on the globe. Our goal was to survey this complex system so that we could provide important groundwater information for agriculture and nature conservation. Our further goal was to know more about the flood events’ effect on SGW when its surface changes from confined to unconfined conditions, which is common in riparian areas. However, the SGW in our study area is affected not only by river water, but also by production wells and precipitation during floods. We, therefore, planned to build an application that could be used to understand the complex effects of these factors on groundwater. Besides, we were interested in the strength of different factors. Bank filtrate wells are also very common in semi-confined or confined riparian areas, one of the most important sources of human water supply in these areas [
16,
23,
24].
Plant-available water in the soil is a primary driver of biomass production and yield [
25]. However, the influence of the groundwater has been mostly neglected in the existing studies applying land surface and soil hydrological models. Because of the groundwater effects, spatial variations in the groundwater table can create an additional spatial variability of soil moisture flux. Soil moisture content and evapotranspiration, thus crop yield, can be considerably higher when groundwater is considered [
26]. The maximum rooting depths of plants and crops are usually much greater than conventionally thought [
27,
28]. There was an extensive, multiple-year crop production dataset collected for the study area, and the interpretation of yield required a precise understanding of groundwater effects. That was the major motivation of our study.
2. Study Area
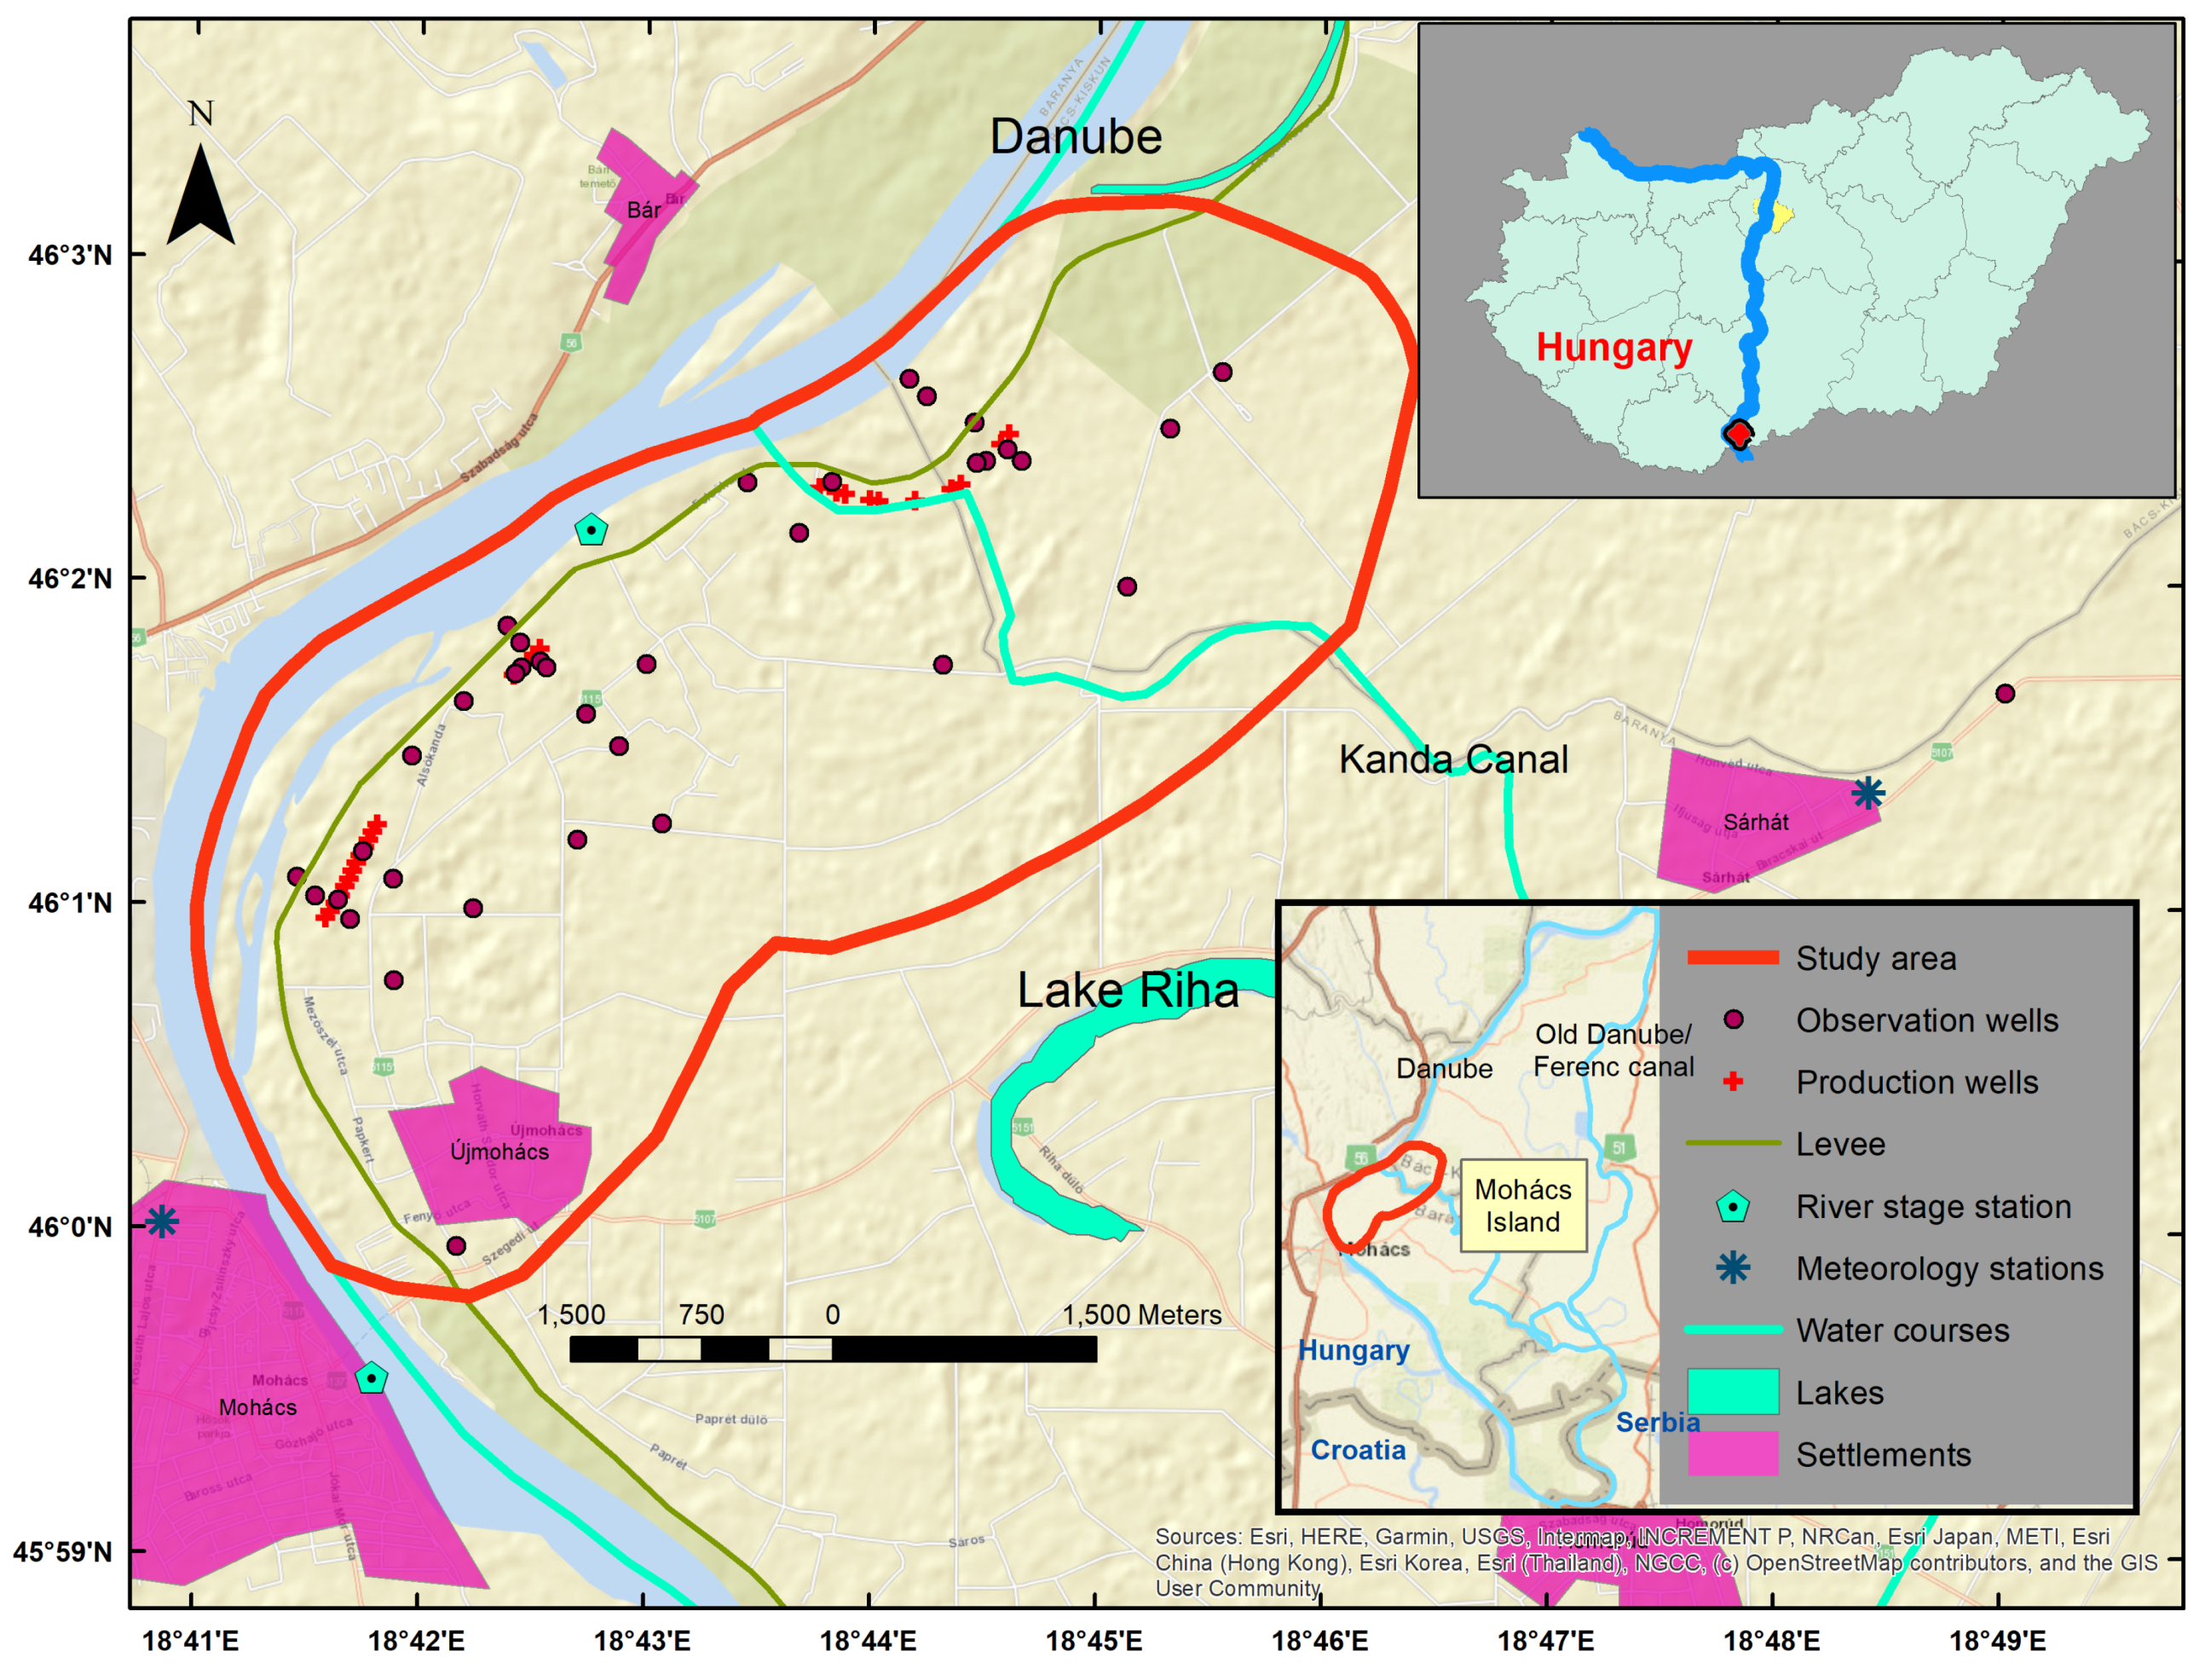
Mohács Island, our study area, is located in the southern part of Hungary, with a small part reaching over the Croatian border (
Figure 1). The area is bordered by the Danube on the west and acted as its floodplain until the 19th Century.
The left branch of the Danube was closed in 1870 and currently functions as a canal. Therefore, the floods only reach the right side of the island. Water does not flow from the river into the old left branch of the Danube and other smaller canals on the island, even during floods. However, the geographical name of the area is still Mohács Island.
The island was a natural floodplain with riparian vegetation two hundred years ago. It has a total area of 322 k
, from which the remaining floodplain has 25.2 k
, while the controlled area spans over 296.8 k
[
29]. The controlled area is protected by a levee with a height of 4–5 m.
In the 1980s, twenty-five bank production wells and three reserve wells were deployed on the island, allowing harvesting a maximum of 33,000
of water a day [
30] and 4,200,000
per year for drinking water according to the permissions. It consists of 28 wells distributed over a 3–400 m distance on the left bank of the Danube River.
Geologically, the Triassic carbonates of the basement are overlain by Miocene marls, Pliocene (Pannonian) clays, fine-grained sands, and finally, various Pleistocene-Holocene siliciclastic sediments. The Triassic formations crop out only north of Mohács, near Váripuszta [
31]. The aquifer is Pleistocene and Holocene sands, sandy gravels, and gravels. The production wells on the island are located within one kilometer from the Danube where the average thickness of the aquifer layers is 25 m, but some places, it can reach a thickness of 50–60 m and elsewhere is absent.
Based on Draskovits and Jósa [
12], the aquifer becomes continuously thicker eastward. In the investigated area, the maximum thickness (40 m) can be measured near Riha Lake. The aquifer is the thinnest at the river bend in front of Mohács, where it is less than 25 m thick. The resistance values of the aquifer-like sediments varied between 40 and 70
m by the VES (vertical electrical sounding) method. In most cases, the aquifer is a single layer according to the geophysical investigation; however, sometimes it is separated into two or more layers [
12].
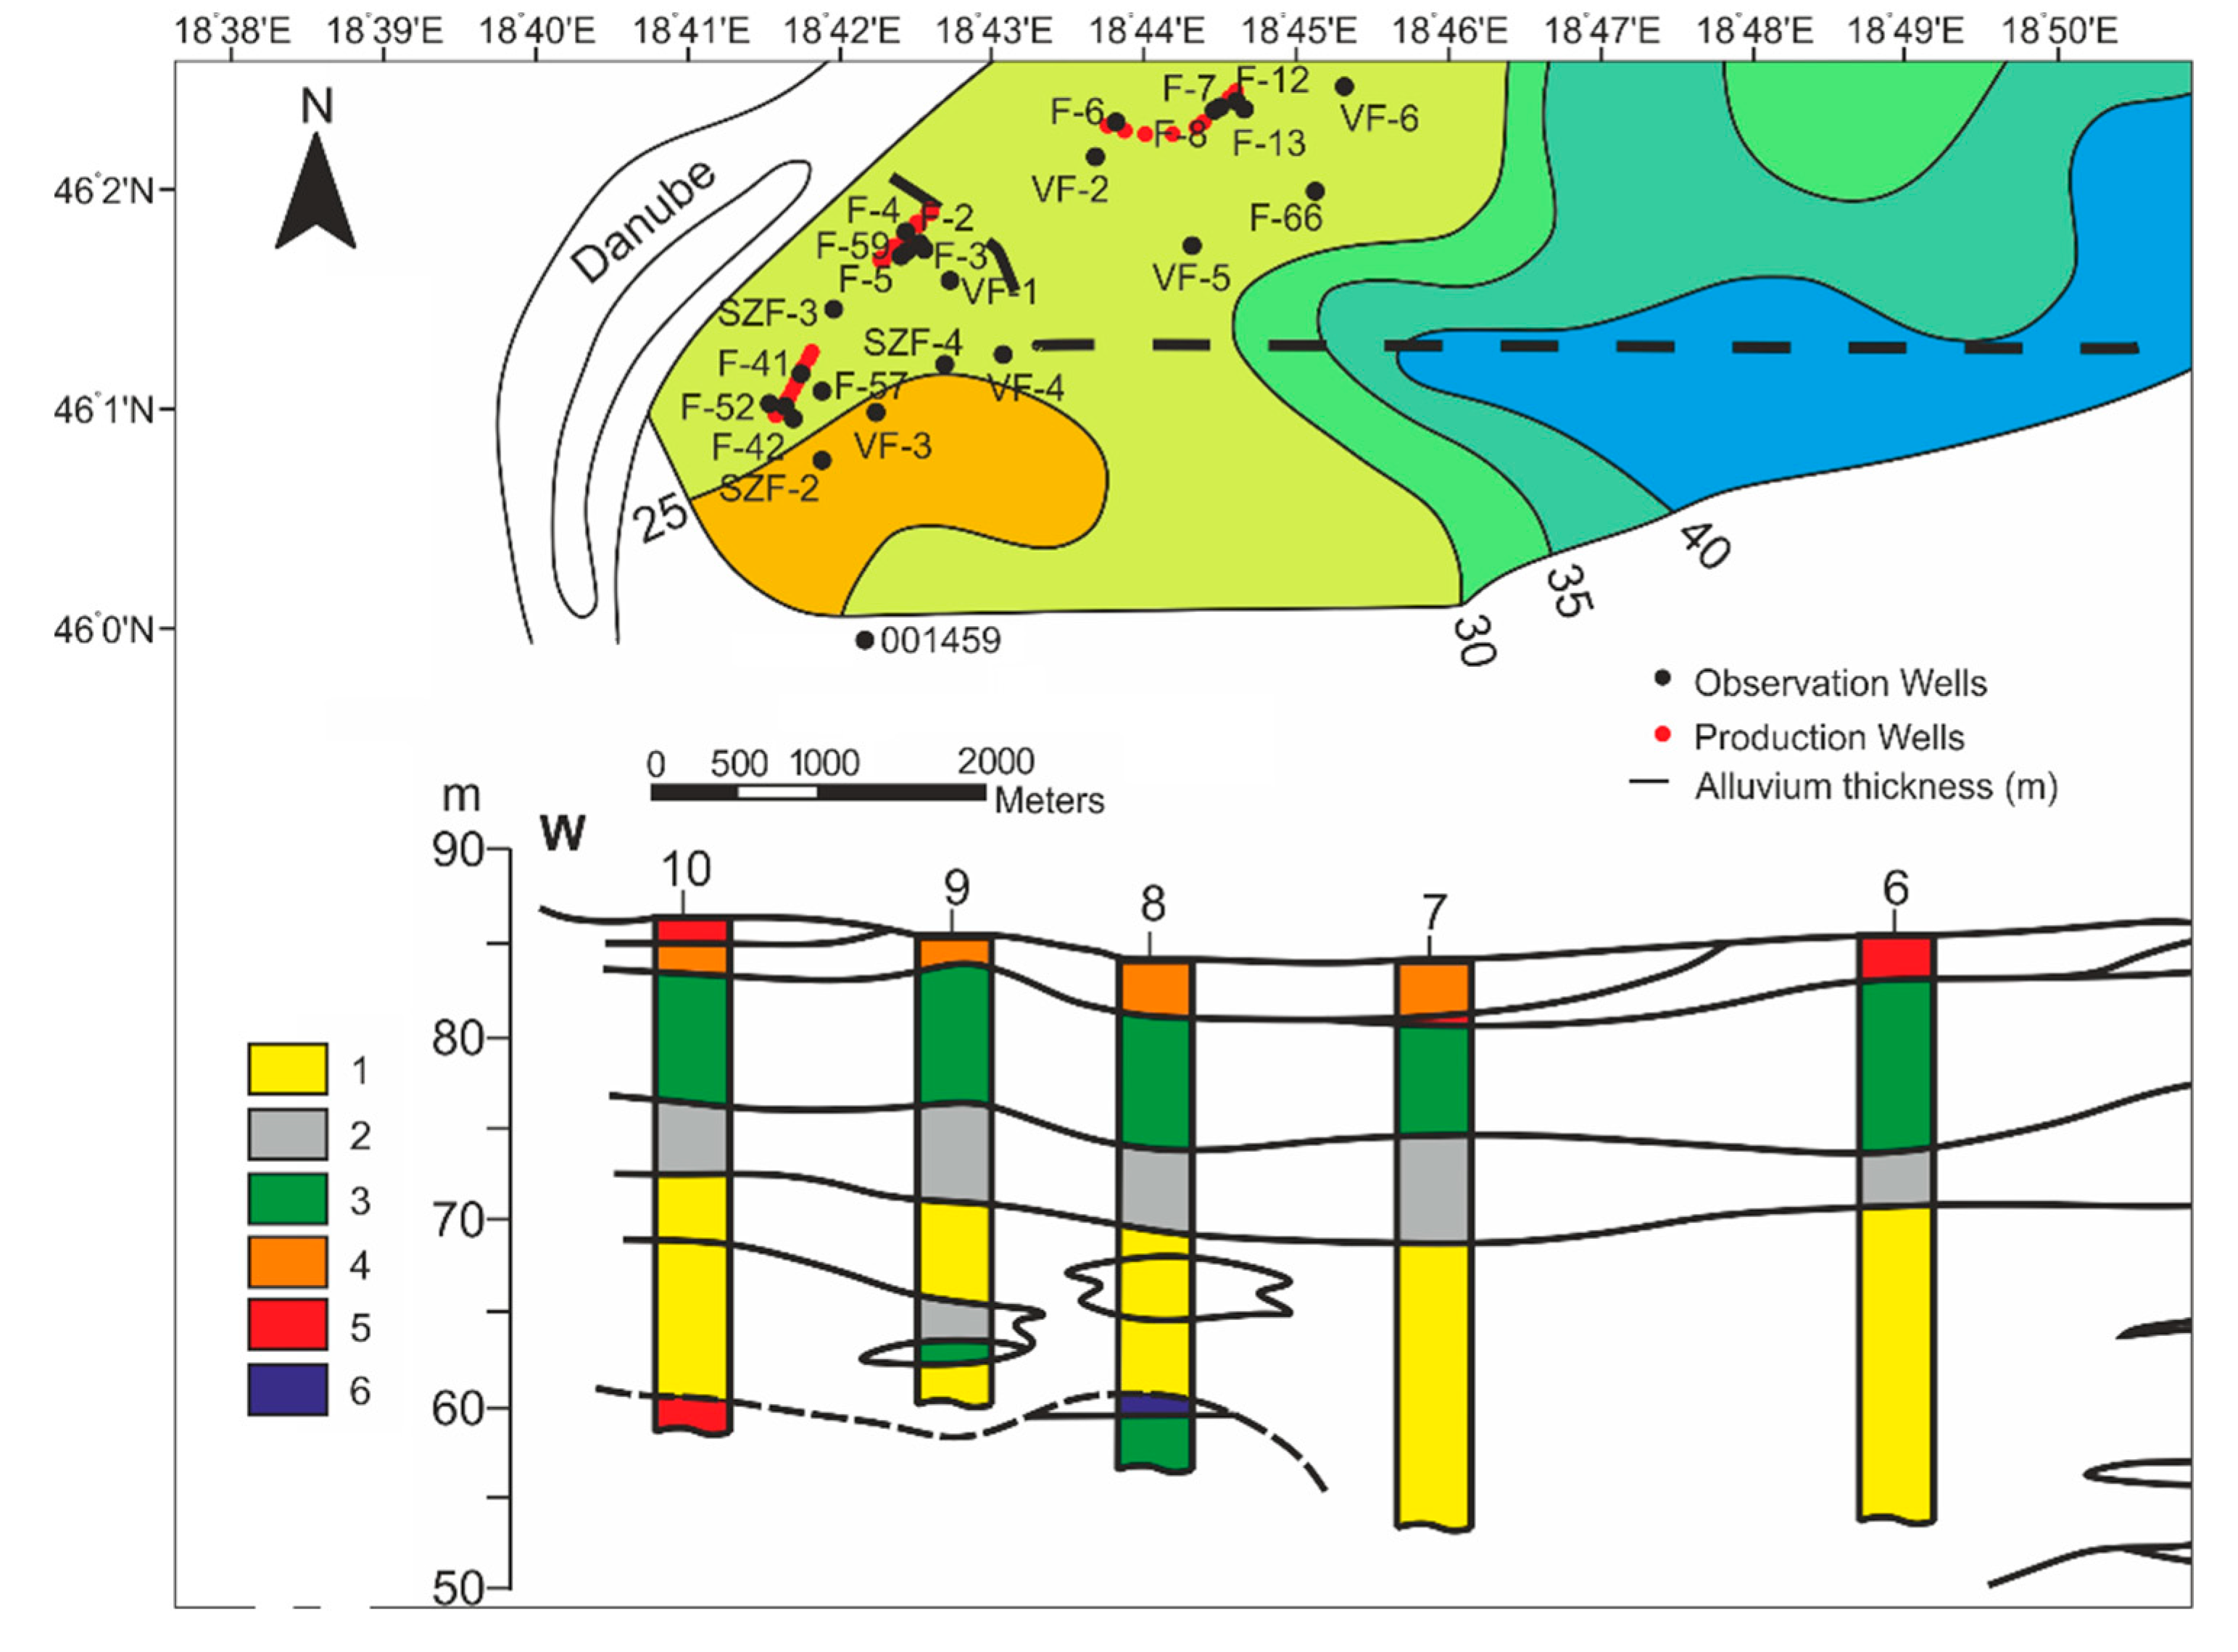
The aquifer is overlain by Pleistocene and Holocene clays and silts, which are aquitards. Their combined maximum thickness can reach 4 m, but the average is only 1–1.5 m, and they are absent from many places. A sandy silt layer is overlain by this confining layer in a large part of the island. The average thickness of this semi-confining layer is 3–4 m. The geological strata are presented for the area along the middle production wells (
Figure 2, red rectangle). Draskovits and Jósa prepared a detailed section diagram of the area based on SBP (standard borehole probes) measurements [
12]. Near the bank (about 1 km), silty clays (red) cover the surface. Underneath it, a semi-permeable sandy silt bed (orange) can be found. The underlying layer here is the aquifer, from which production wells draw water. The bottom layer is impervious Pannonian clay. Beyond one kilometer, the confining layer is eliminated, the silty sand layer is thinning out, and the real aquifer becomes thicker.
The resistance of these sediments varies between 20 and 30
m by the VES method [
12]. In those areas where the aquitard layers are absent above the aquifer, the water can be considered as phreatic water.
Under the aquifer, Pliocene (Pannonian) and Pleistocene fine-grained sediments (clays and silts) can be found, which represent an extended aquitard with low resistance (8–15
m). In some places, especially east of Mohács, the sand content of the Pannonian sediments is a little higher [
12].
3. Materials and Methods
The Danube water stage level, the groundwater wells’ level, the production wells’ level, and the precipitation daily time-series were obtained from DDVIZIG, ADUVIZIG, DRV, and OMSZ (water and meteorological authorities and companies in Hungary). The investigated period lasted from 1 January 2007 to 31 December 2018. Data were organized into a daily time-series database, as the production data had daily time steps only. All water level data were recalculated to meters above sea level in Baltic Normal Height. Outliers were removed from the data series by cutting the upper and lower one centiles from the distribution graph. Geological data were used to produce a map showing the depth of Quaternary clay beds and presenting the thickness of the confining layer. Every available and relevant borehole strata description was studied from the Hydrogeological Data Store of Mining and the Geological Survey of Hungary. Spatial data were inserted into ArcGIS feature classes, and time-series were inserted into ArcGIS tables. ArcGIS 10.4.1. was used for data visualization and processing.
Using the linear regression model function (LM) of the R software package, we calculated the regression between groundwater wells’ water level (m a.s.l.) as dependent variables and the Danube water level (m a.s.l.), production wells’ water level (m a.s.l.), and the precipitation as independent variables.
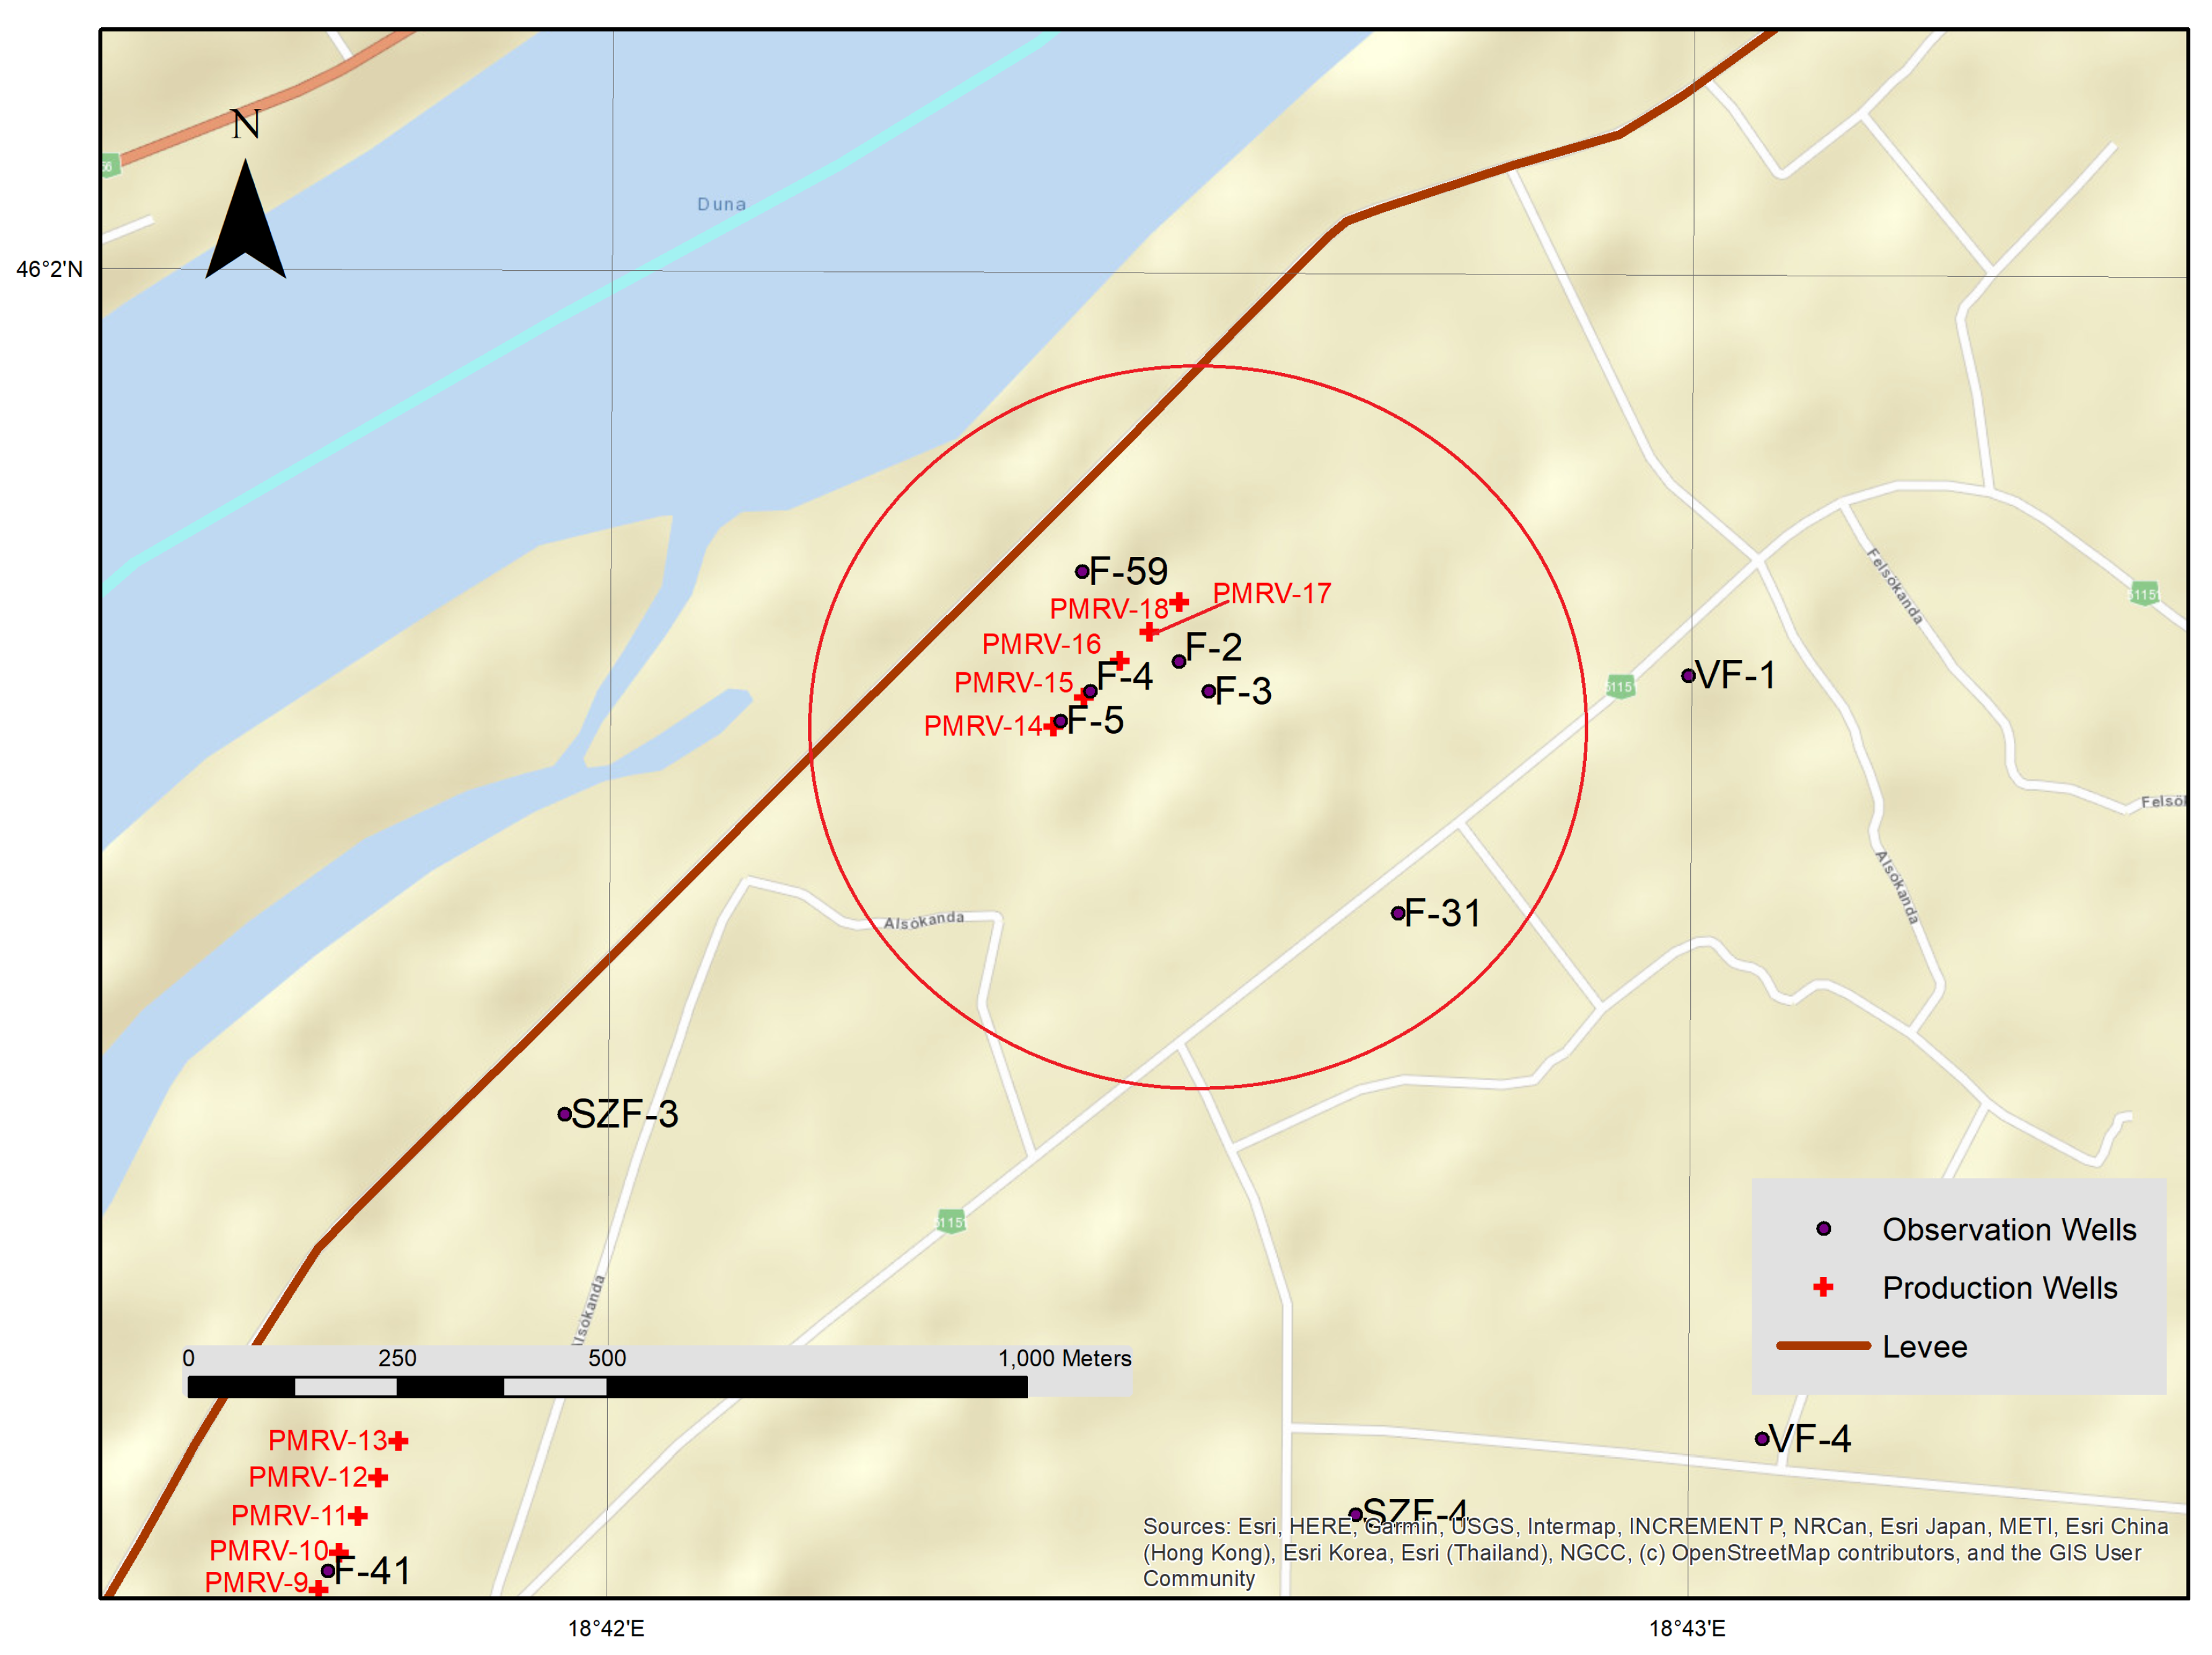
The dependent variable in the linear regression model was the time-series of the given observation well. In the final model, we had two independent variables. The first independent variable was the Danube time-series with the combination of the close averaged production wells time-series. The reason for this was that the time-series of production wells were not independent of the time-series of the Danube. Therefore, they must not be inserted into the linear regression model alone. Moreover, when there was no production in a specific production well, it acted as an observation well (see in
Figure 3). Thus inserting them into the LM would ruin the explanation. With a mathematical calculation, we combined the Danube water level values with the production well values. This was a multi-step process. As a first step, we tried to find the strongest effect of the Danube. The curve of the Danube was time-shifted and transformed (Equations (
1)–(
3),
Figure 4 and
Figure 5) to get the true effect of the Danube on SGW. Then, the LM (R API) function was called only with this transformed Danube time-series (
, Equation (
3)). As a result, we registered the optimum coefficient of determination and the lag time value of the Danube. Then, we selected the production wells in the vicinity of the examined observation well, and we also looked for the optimum coefficient of determination and optimum lag times for them. Only the production wells in operation were included in the statistical procedure, and non-significant wells were expelled from the final equation. After filtering, the selected and day-shifted production wells were averaged (
, Equation (
4)). This value was also averaged with the day-shifted Danube time-series (
, Equation (
5),
Figure 6). Finally, the combined time-series was inserted into the LM again (through our software and R API). Once we found the optimum lag time value of the production wells combined with the Danube, we added the precipitation time-series to the model, which in this sense was the second independent variable. We calculated the optimum lag time of the precipitation as well.
The five largest flood events of the Danube were selected for the study. The threshold water level was 700 cm (=86.195 m a.s.l.) to classify an event as a major flood wave. The largest flood of the last hundred years was among the events culminating on 13 June 2013, reaching a height of 964 cm at Mohács. The further four events peaked on 16 September 2007, at 776 cm, on 5 July 2009, at 856 cm, on 11 June 2010, at 925 cm, and on 21 January 2011, at 776 cm. Production wells’ data and precipitation data were available for these periods, and these were independent significant flood waves with distinct clear peaks.
The selected study period for a flood wave was 40 days with the middle point in each period being the peak. This length of time was chosen according to the hydrograph characteristics of the Danube, and it covered complete flood events in all five selected cases.
To confirm that our LM complemented with function transformations showed the correct result, our mathematical-statistical model was tested out graphically using Excel software. The test period was the June 2013 flood event, and the test area (
Figure 3, red circle) was the central production wells and the monitoring wells in their environment (F-59, F-5, F-4, F-2, F-3, F-31). Most of the observation wells are placed here perpendicular to the Danube stretching inland into Mohács Island.
In the first step of our procedure, the relationship between the time-series of monitoring wells and the Danube, was examined.
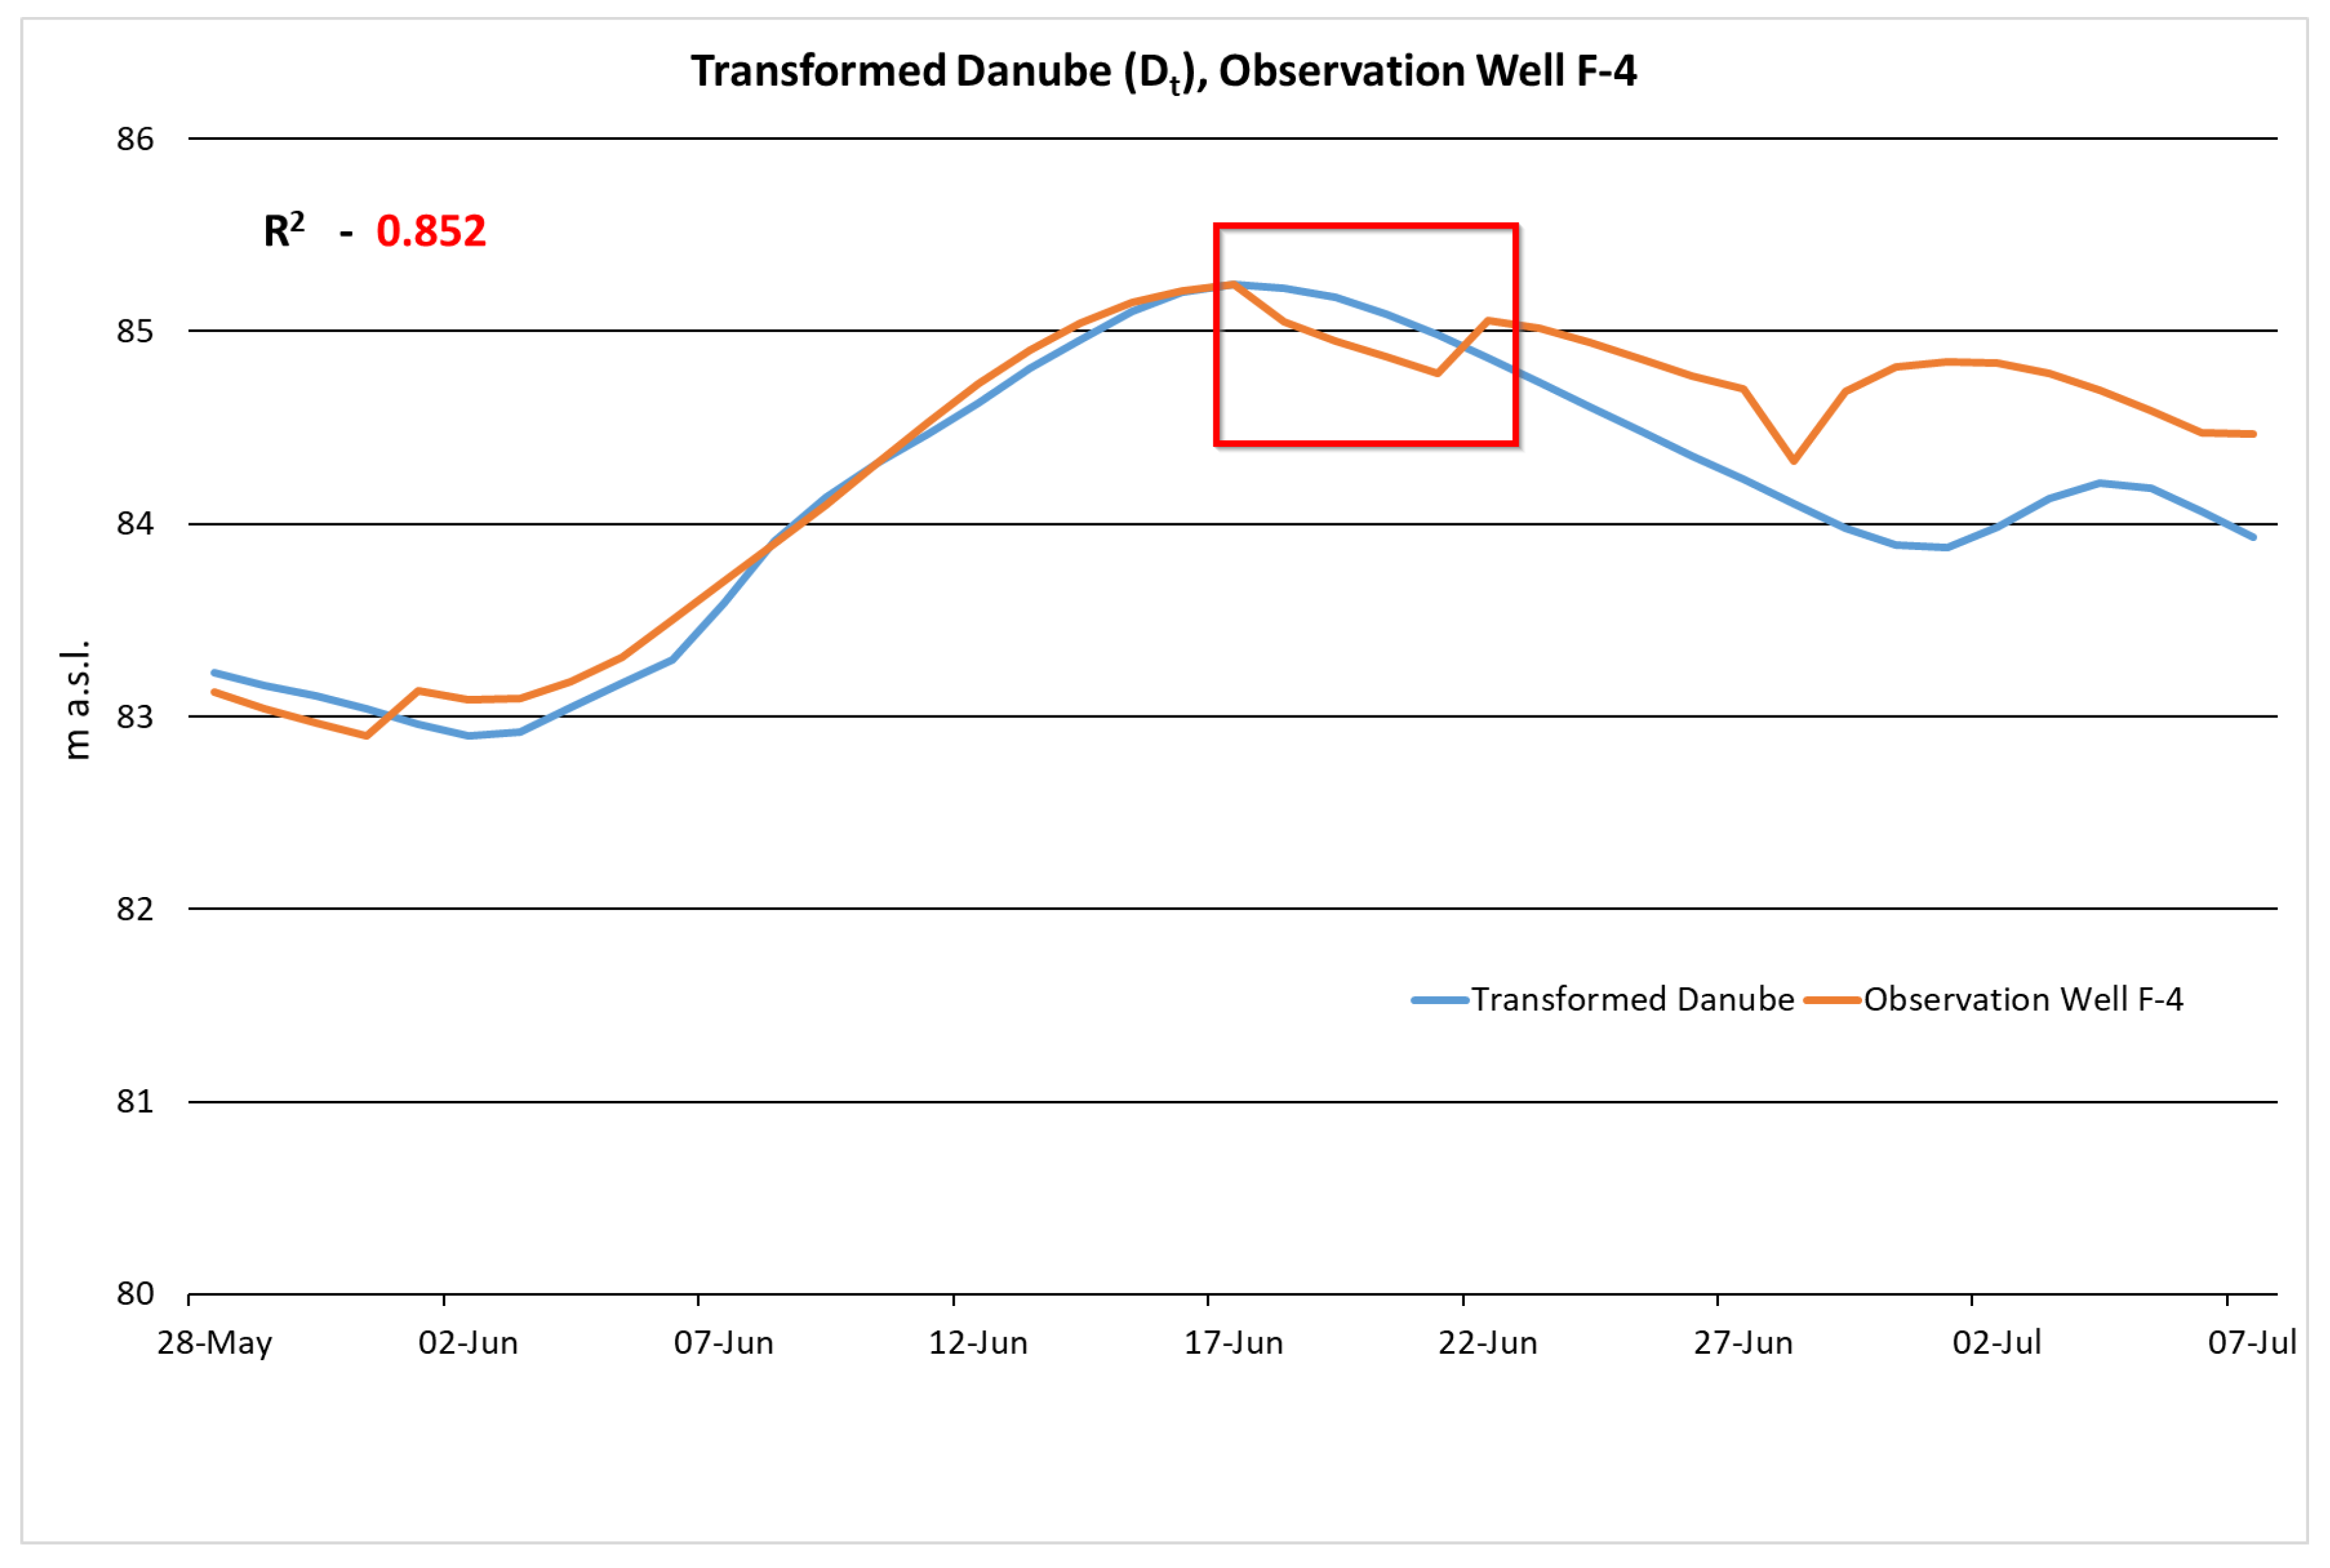
Figure 4 presents the water level values of the Danube and the F-4 observation well measured during the flood event in June 2013. This well is at a 340 m distance from the Danube bank. The water level values of the monitoring wells were compared with those of the Danube.
Figure 4 shows that there was a relationship between the two time-series.
The day of the highest water level in both waves was identified, and the lag time was obtained as the difference between these dates. The time-series of the Danube were shifted with this value to coincide in time. We assumed that the two curves were more or less convertible into each other also in the
y-direction. Therefore, the wave proportionality factor of the flood
(Equation (
1)) was calculated.
Minimum () and maximum () water level values for the Danube, as well as the minimum () and maximum () values for the given observation well and their differences were calculated. The difference for the observation well was divided by the difference for the Danube. This equation () gives the fraction of the groundwater wave compared to the flood wave of the Danube.
The functional transformation of the Danube value was generated in two steps. First, the peak value of the Danube was moved to the day of the given groundwater peak value (Equation (
2)).
The new
time-series contained the same values as
, but the data values (
x-axis) were shifted with the lag time.
Then, the transformed Danube value (
, Equation (
3)) was calculated from the proportionality factor and lag time. The maximum value of the Danube at the time of flood (
) was subtracted from each lag time value of the Danube (
). This difference value was multiplied by the proportionality factor (
), and in the end, the maximum value of the monitoring well (
) at flood time was added.
The transformed Danube time-series and the groundwater time-series were then plotted together, and the strength of the regression between them was recalculated. In our example, we found a very close (
= 0.831) relationship between the time-shifted and y-transformed Danube and groundwater well time-series. At wells relatively close to the riverbank (<500 m), the transformation resulted in a curve similar to the monitoring well shown in the example (
Figure 5).
After clarifying the relationship between the Danube and monitoring well, we assessed the impact of production wells on the groundwater. For the production wells, only the water level values were known; the water abstraction values were not. Nevertheless, water abstraction information was less useful than water level information in our linear regression model. The water abstraction time-series contained production values, which probably correlated with the drop of the groundwater level curve close to the production well. However, the fast recharge [
16] was missing from the production well values. It can be seen in
Figure 5 within the red rectangle that the curve of the observation well had a drop immediately after production started. Somewhat later—with a jump—the curve of the observation well fit its original arc. Such a jump would never appear in a curve created purely from production values.
Usually, more than one production well could influence the monitoring wells. Thus, we aimed to describe their combined effect. The time-series of the production wells and the Danube were interdependent. Usually, several production wells are located next to one another parallel with the Danube riverbank. The surface elevation and groundwater depth of these wells are very similar in a quiet period of non-operation. The wells are not used simultaneously; only a few are operating at one time. The average groundwater level for all production wells was calculated in one row next to one another (Equation (
4)). The average water level in the production wells and the water level in a nearby observation well must be correlated with an eventual time delay if the distance is larger. Lag times based on the best fit were selected. We found a maximum of 1–2 day lag times, but in cases where the effect of the production wells was remarkable on the observation well, there was usually no lag time.
The effect of averaged production wells on the given observation well (F4 in the example) was investigated. After a few iterations, the lag time with the strongest relationship was usually found.
The effect of production wells’ (
, Equation (
4)) time-series, as well as the transformed Danube time-series (
, Equation (
5)) was averaged.
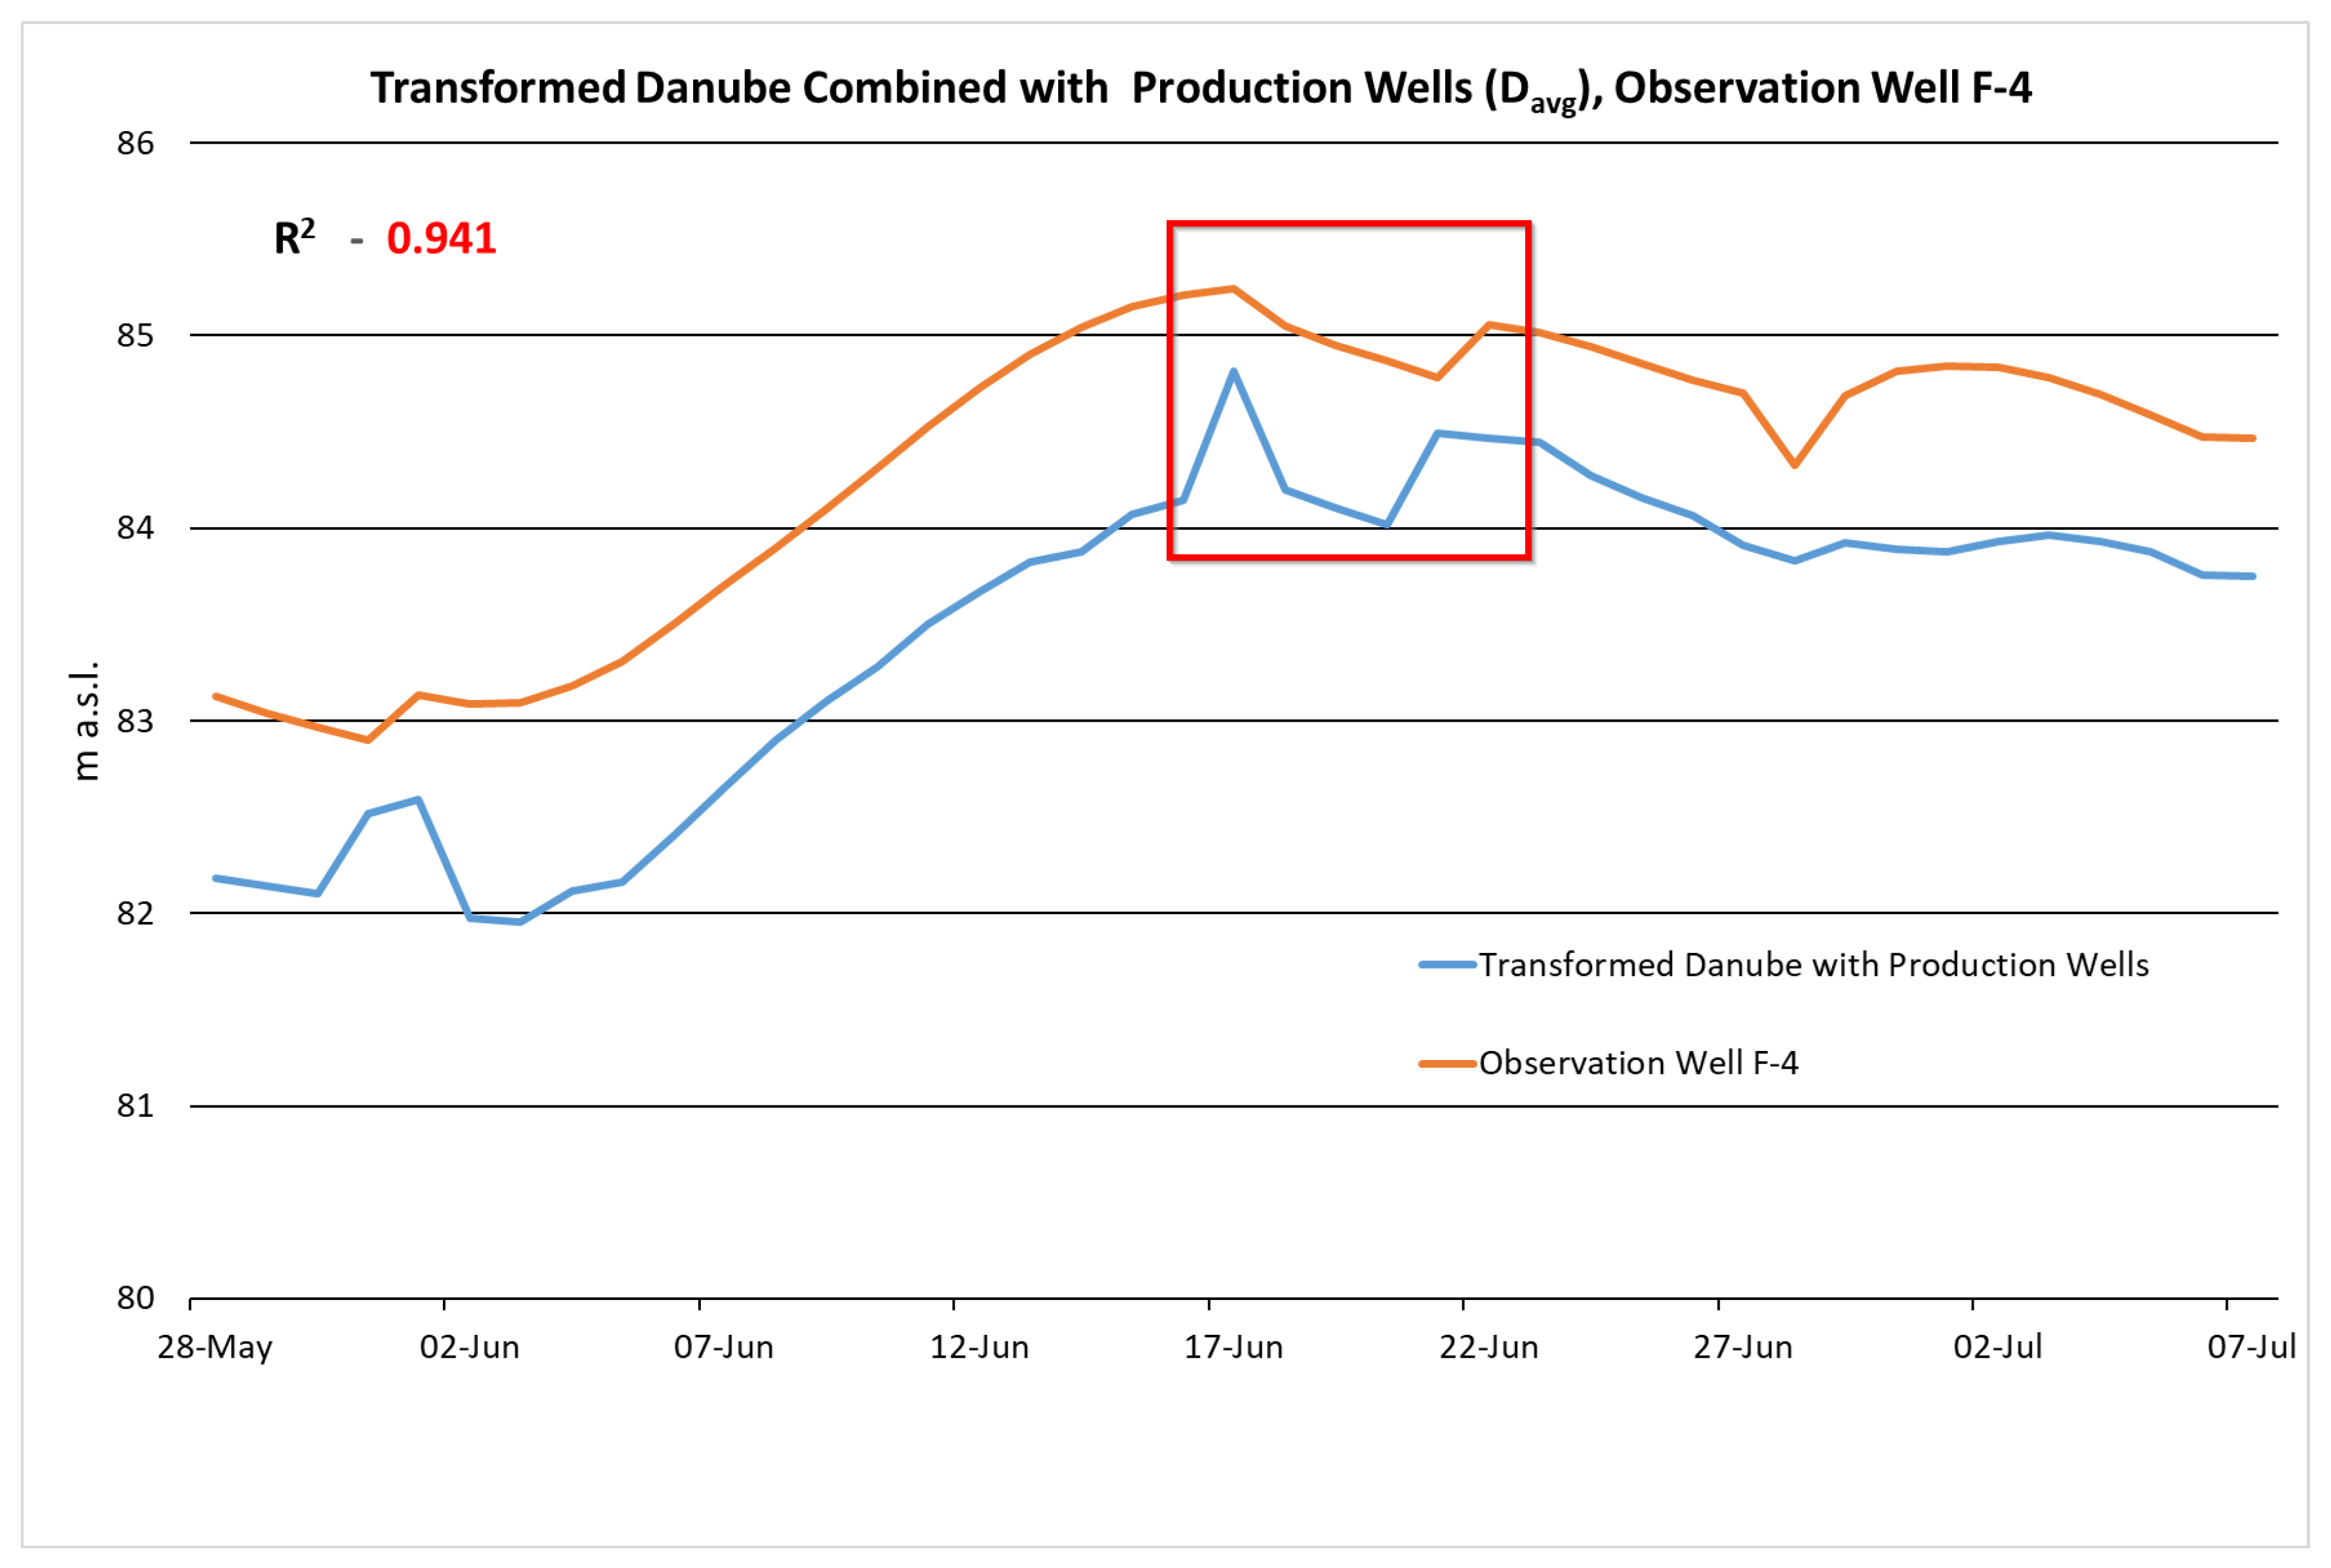
With this procedure, the effect of production wells was superimposed on the influence of the Danube. In
Figure 6 within the red rectangle, it can be seen that not only the drop, but the jump in the curve of combined Danube and production wells also followed the curve of the observation well. We only superimposed the effect of production wells when this caused a significant increase in the overall determination coefficient to describe water level in observation wells.
With this method, we were able to estimate the groundwater level quite well at the F-4 monitoring well. In this case, the coefficient of determination was 10% stronger (
= 0.937,
Figure 6) than with modified Danube data alone. For wells near production wells (F-4, F-5, F-2, F-3), their average impact improved the strength of the relationship. In other cases, however, the results were poorly improved (F-59) or reduced at wells with a larger distance from production wells (F-31). In these cases, production well results were rejected, and only the transformed Danube data were used. More than 100 m away from the production wells, their effects could not be confirmed.
The calculation method for the test area and period was extended to all other monitoring wells and flood events. The calculations were based on the R software package API (Application Programming Interface). Our software was written in the C#.net language, in the Visual Studio 2017 IDE (Integrated Development Environment). This development environment was chosen because it enabled importing data with the Excel API, exporting data with the ArcGIS API, and performing statistical analysis with the R API. The software development for the multiple calculations of the LM proved to be a complex task. We compared 40 day time windows from each data series (monitoring wells, Danube, average of production wells) with lag times (Equation (
2)), which were selected with the best coefficient of determination as a performance measure. The calculation was repeated for all monitoring wells.
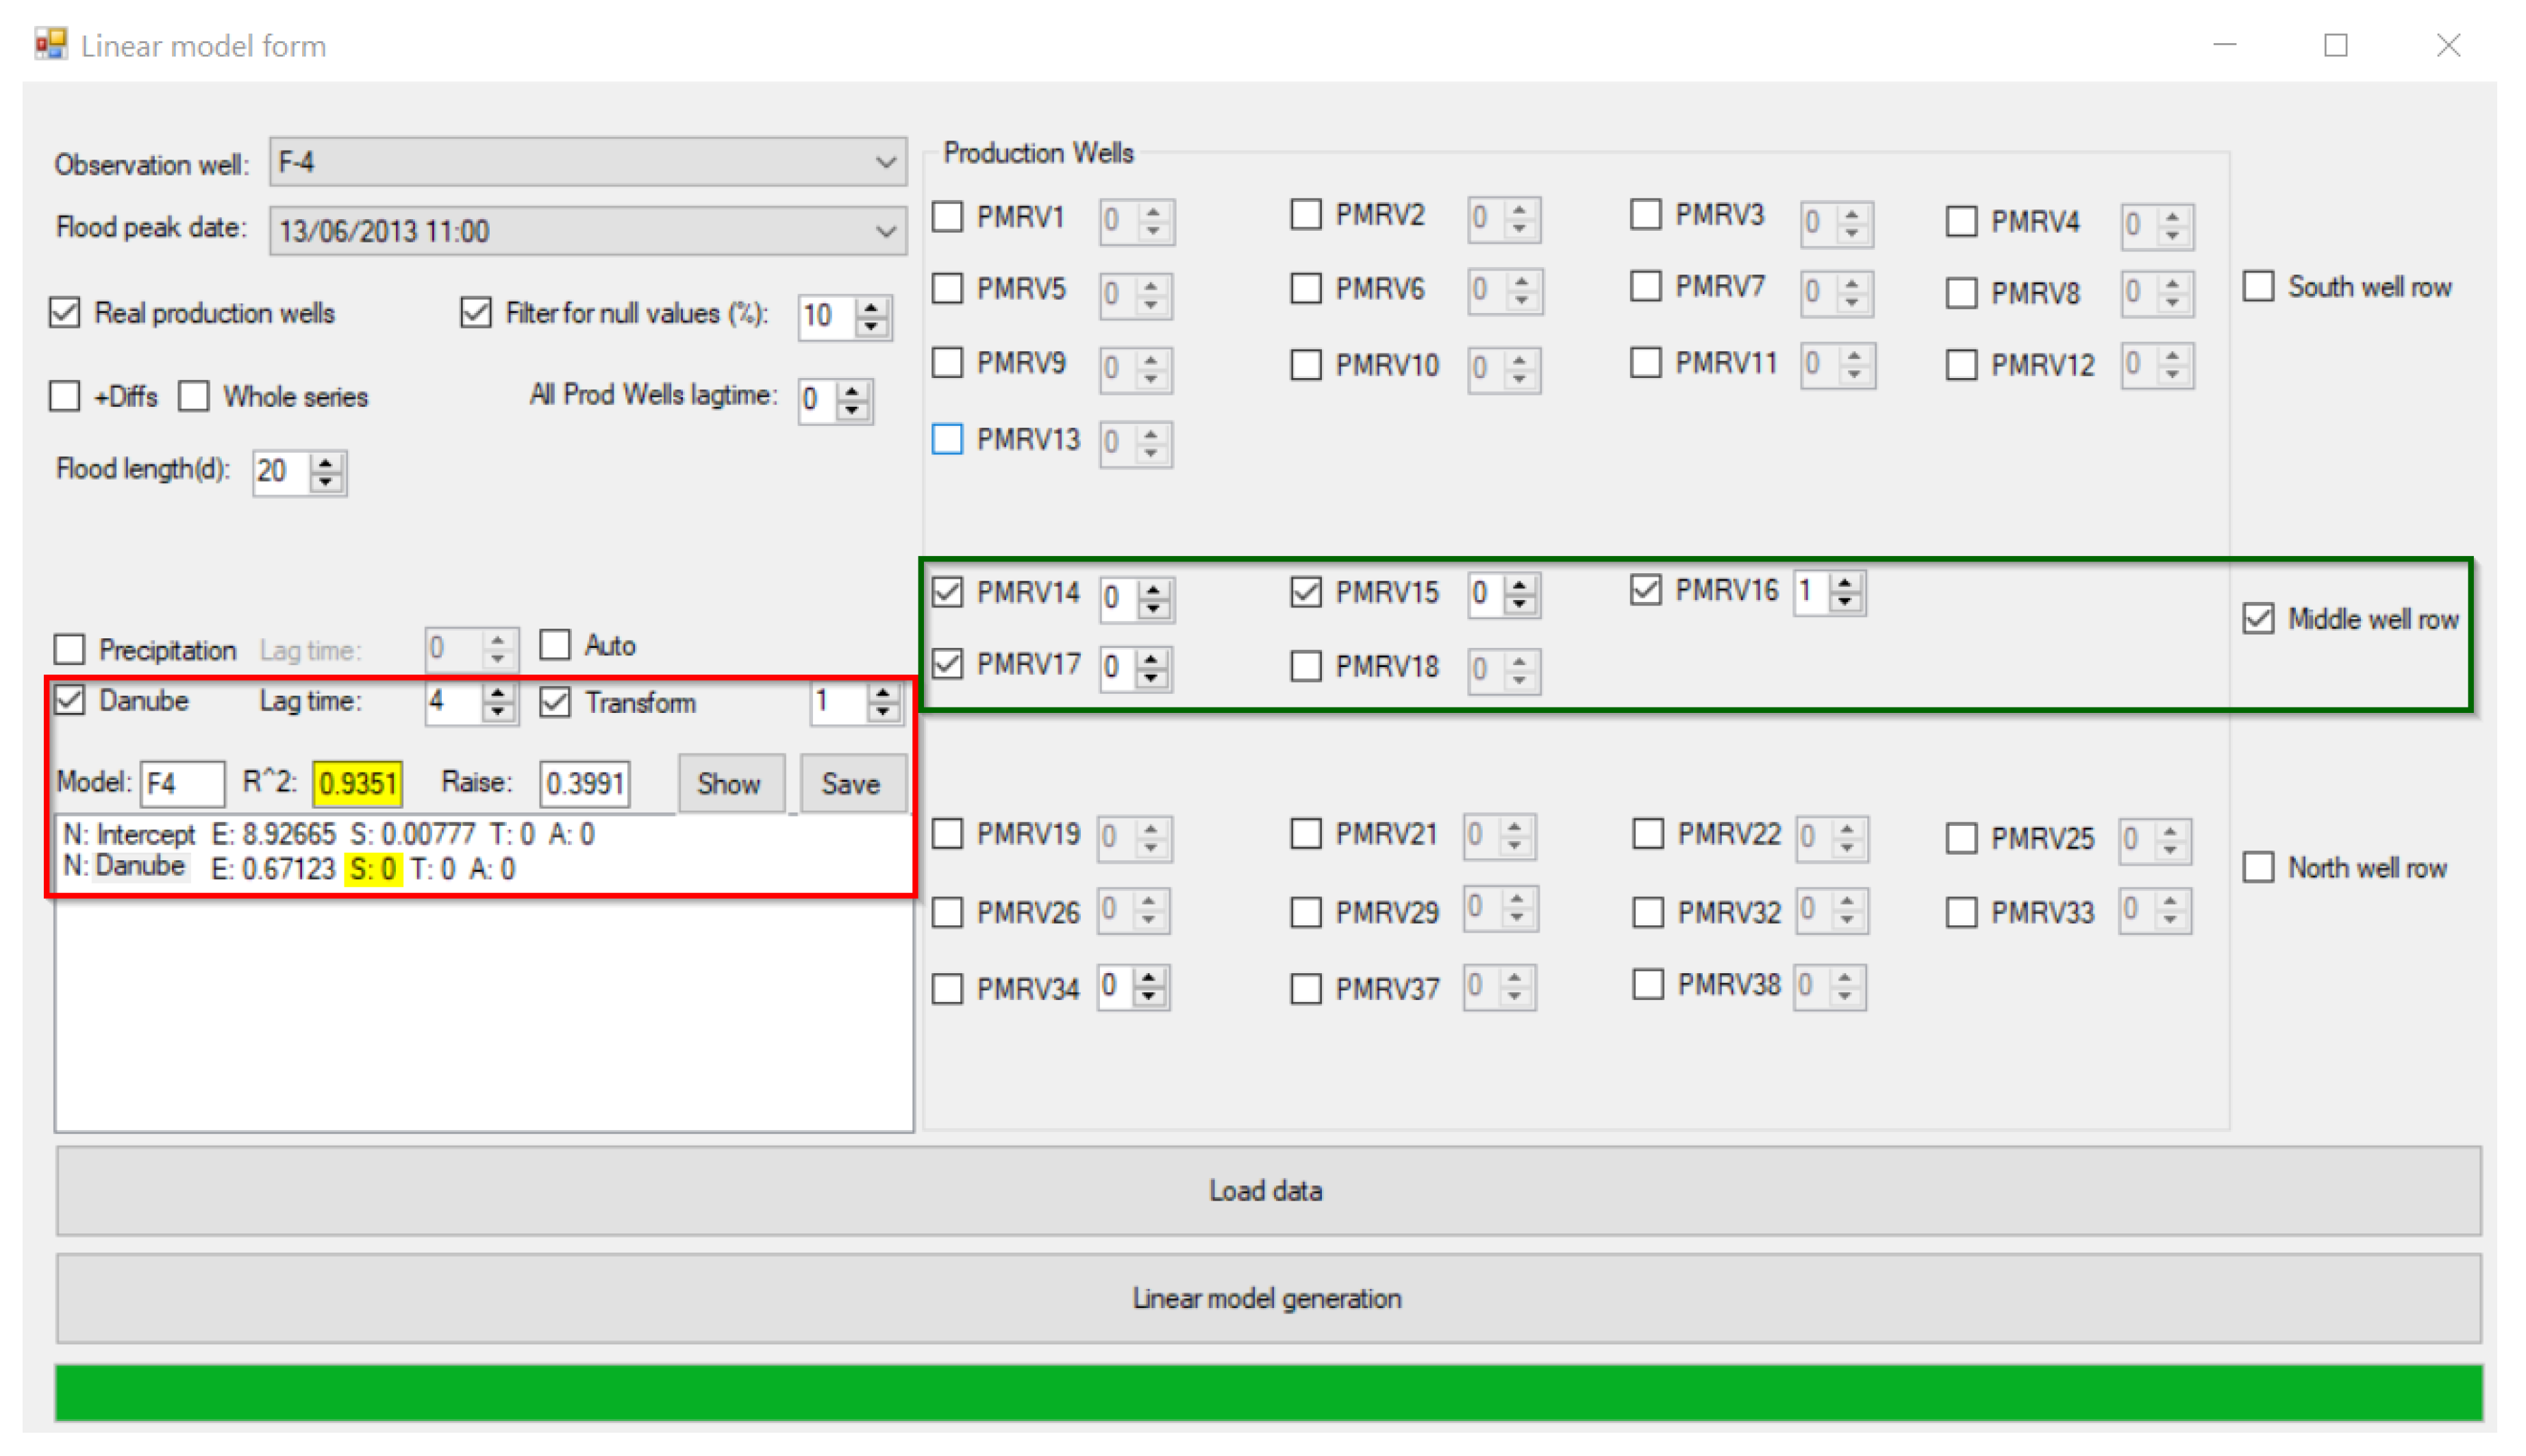
The effect of the complex variable (Danube and production wells together) was simultaneously checked. Therefore, we created a GUI (graphical user interface) for our software (
Figure 7). With this tool, it was possible to select the monitoring well for investigation, the flood event of the Danube, and the value of the Danube lag time. On the right side of the GUI, individual production wells could be selected for the calculation (
Figure 7, green rectangle). The lag time could be altered at each production well individually. Only those production wells that were in operation were inserted. The criteria for that were the percentage of production days that could also be set in the software. If the ratio of the production days reached 10% of the observation period (four days out of the 40 days), then the dataset for that selected well was included in the model. Otherwise, they were excluded.
The user interface (
Figure 7, red rectangle) showed the combined effect of different production wells and the Danube on the observation well. After several iterations, we were able to identify the best predictors of production wells with the highest coefficient of determination.
In the next phase, precipitation was added to the LM as an individual vector also with time shift possibility. However, the vector of precipitation time-series was only included in very few monitoring wells and had little effect on the final LMs.
The model results for wells and flood events were saved into an ArcGIS table with all their values (coefficient of determination, lag time, Danube uplift effect). The
data and lag times were summarized for the different wells. Charts and interpolated maps were generated from the aggregated data. Kriging (spherical) interpolated maps were generated to present the strengths of the Danube impact, production well impacts, and inferred geological impact by the ArcGIS software. From among several interpolation techniques (IDW, kriging, spline), kriging was chosen as it produced the most feasible outputs in terms of accuracy, a result confirmed by other groundwater-related studies as well [
32].
4. Results
SGW levels were influenced not only by the Danube, but also by production wells [
30] and precipitation [
33], although the impact of precipitation was usually subordinate. The water levels of the Danube and production wells were inserted into the LM in a combined manner as we described in the Methods section. Investigating their effects was a complex task, as several wells could operate simultaneously during a flood. Furthermore, they were located at different distances from the observation wells. Theoretically, it was not even certain that they were in operation during floods. Technically, however, at each of the well series, at least one, but rather several of the wells were used at the same time of the selected flood events. Certainly, only those wells in operation had to be included in the LM. Eventually, the combination of production wells and the transformed Danube curve generated a combined outcome curve. Inserting this outcome curve into the LM showed the real effect of the Danube on each piezometer. The production wells, as presented in
Figure 5, cut only a few percentages from the top of the Danube curve. Their direct effects reached a maximum 100 m distance.
Precipitation time-series were included in the LM if their significance level was less than 0.05. Precipitation vectors had only a very minimal effect on the LMs. Rainfall effect appeared only in the inner part of the island and only during the July 2009 flood. It improved the coefficient of determination by 0.03 for well VF-2, 0.15 for well VF-4, and 0.04 for well VF-5. This means that the measured values explained only a few percentages of the LM (3–4%). Therefore, in these three observation wells, precipitation explained between 0.6% and 3%. We found higher ratios (15%) only once. In all other cases, we were not able to measure the effect of precipitation on groundwater, so this was not included in the averaged LM in most cases.
In summary, the charts that present the decrease of the coefficient of determination, lag time, and raised Danube levels with growing distance from the bank demonstrate the effect of the Danube flood wave on groundwater head, at least during the selected five major flood events.
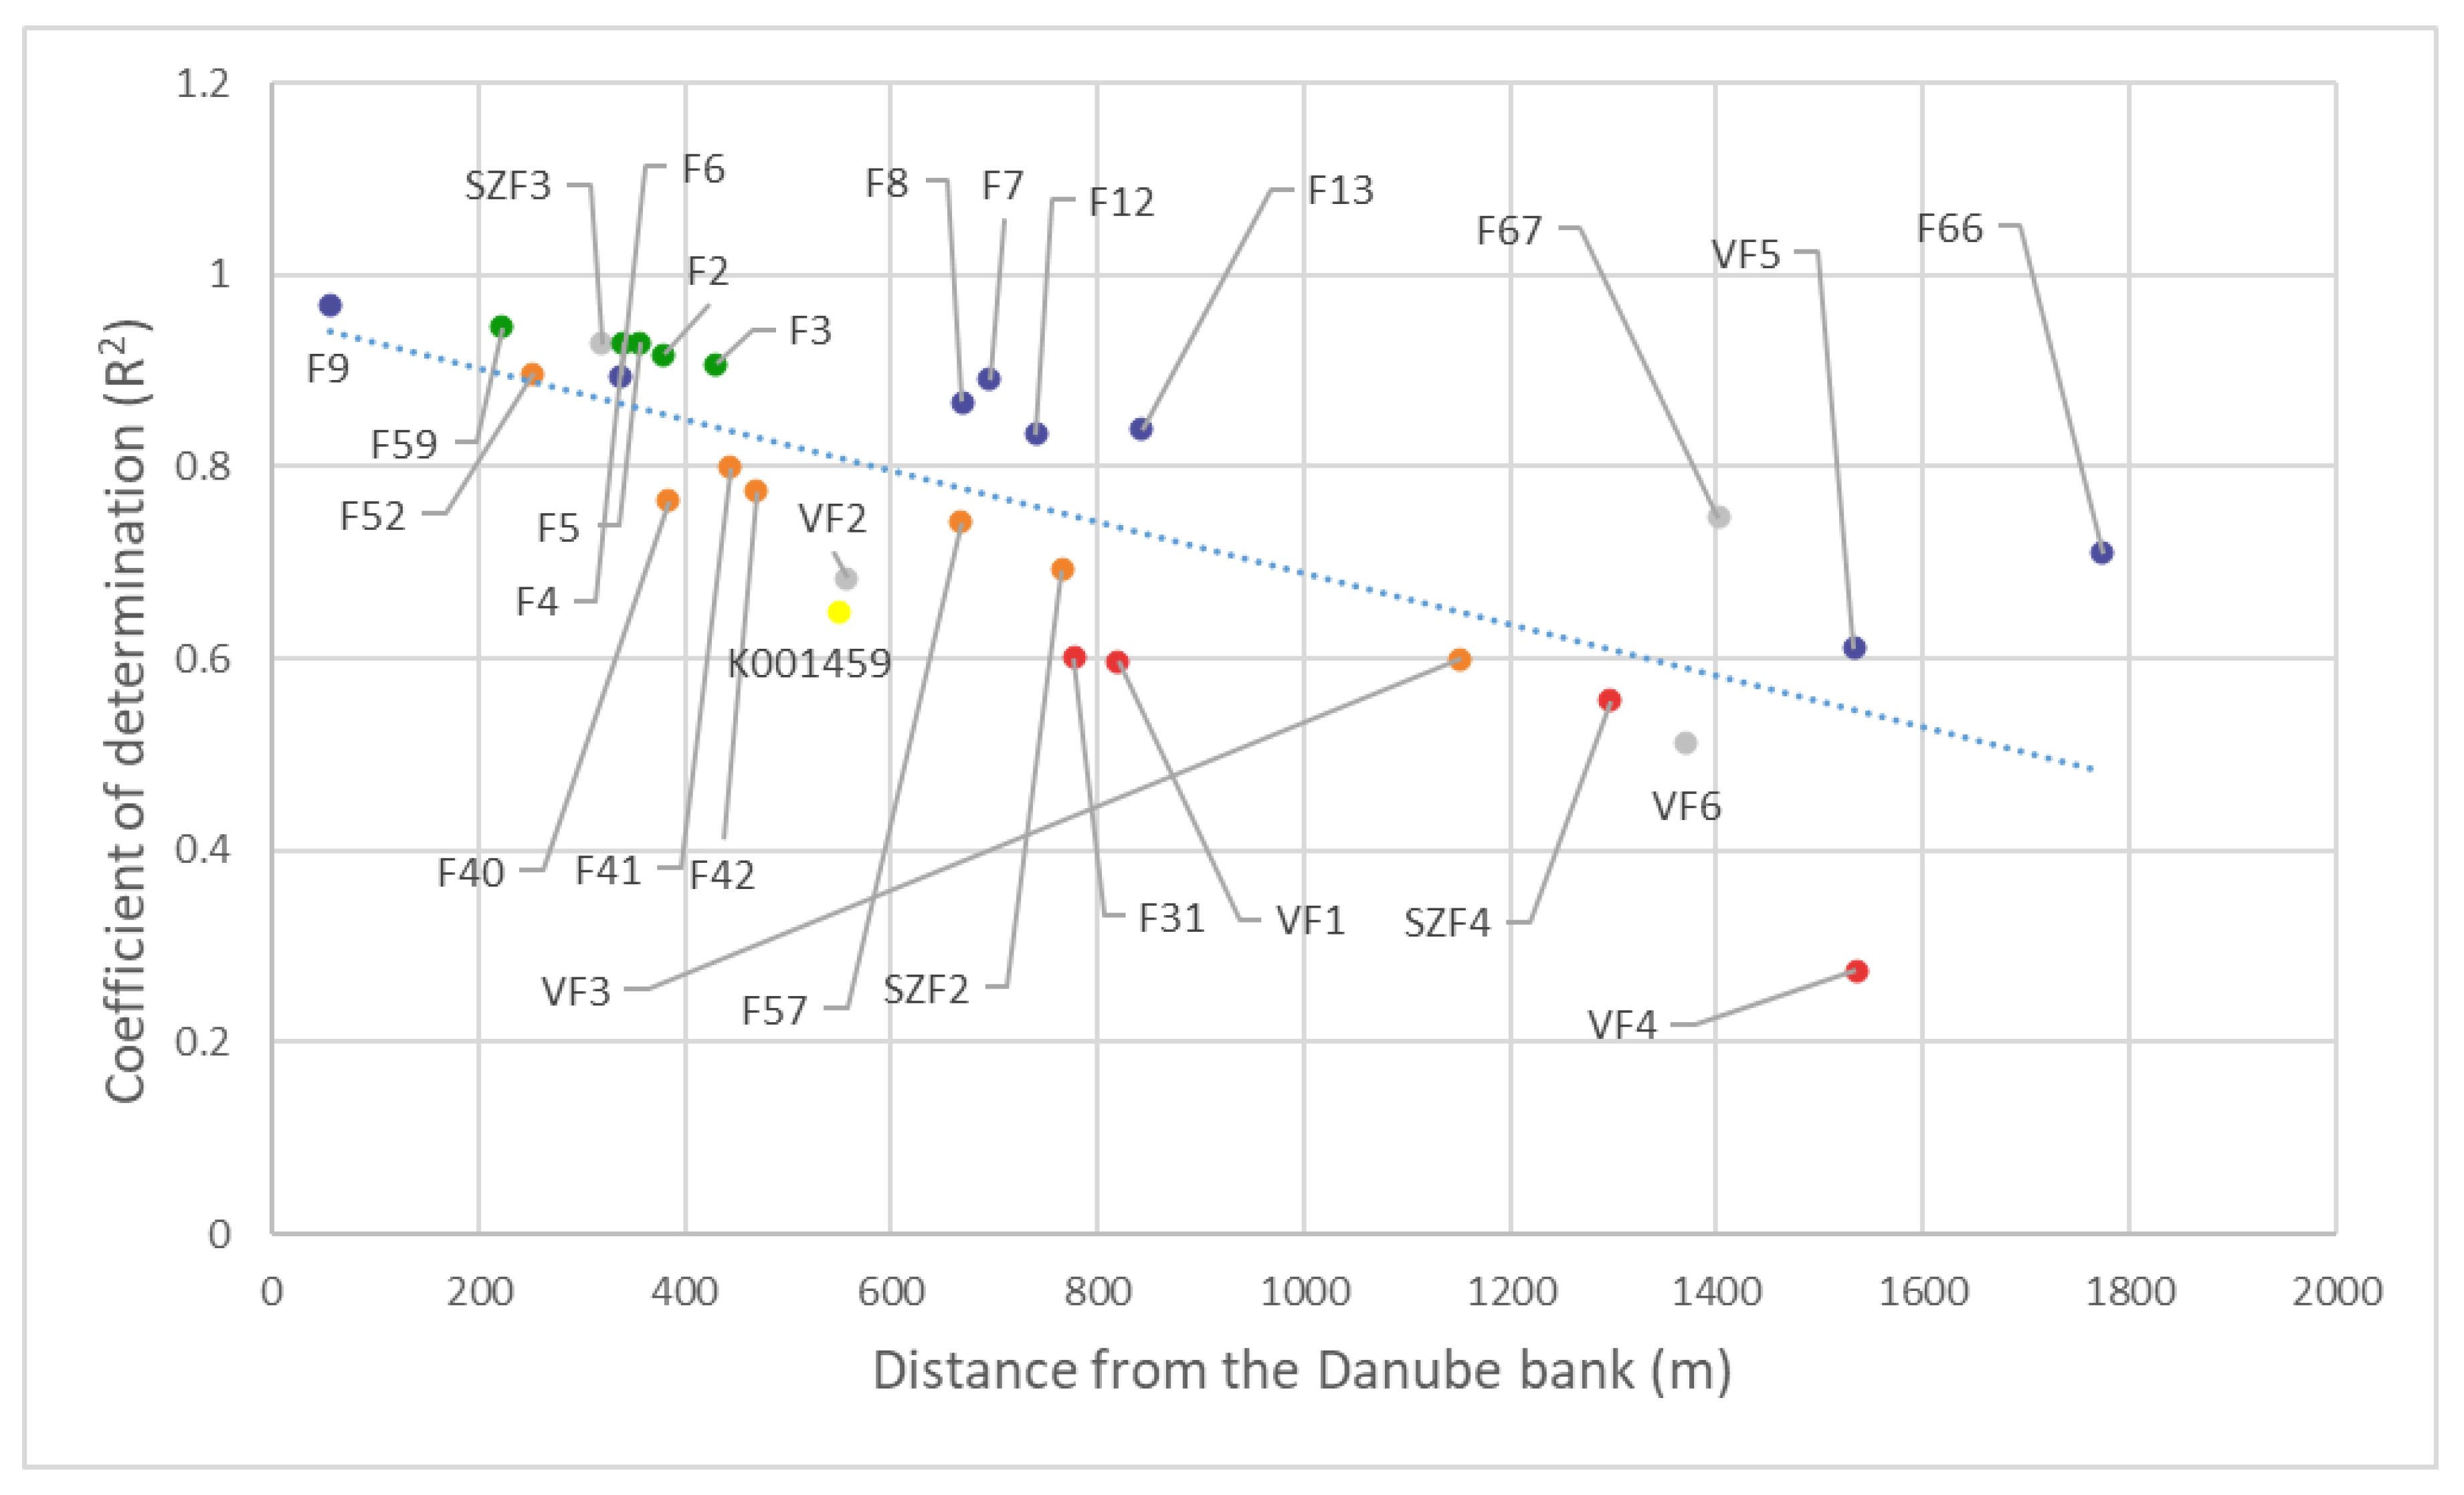
Figure 8 shows the change in the relationship between the river and the groundwater depending on the distance from the bank. The regression value of piezometers decreased and fluctuated up to 1800 m, but followed a linear trend line. The monitoring wells around the production wells could be divided into several groups (
Figure 8). The northern observation wells (blue spots) had a much stronger connection with the Danube than the other wells. The southern production wells (orange spots) were slightly below the trend line. The wells around the middle production well in the first 500 m (green spots) had a slightly stronger-than-average connection to the Danube. At 400 m, the calculated average coefficient of determination value was still around 0.9. After that, however, they started to lose contact with the Danube wave with increasing speed (spots marked in red). At 800 m, an average
of 0.6 was observed, while at 1500 m,
was only 0.25, which showed a looser connection with the Danube as would have been expected based on the distance.
K001459 is an observation well (yellow spot) in relatively close vicinity to the Danube bank, but based on its average coefficient of determination value, it also had a modest connection to the river in this reach. This piezometer was slightly different from the others because it was located very far from any production wells.
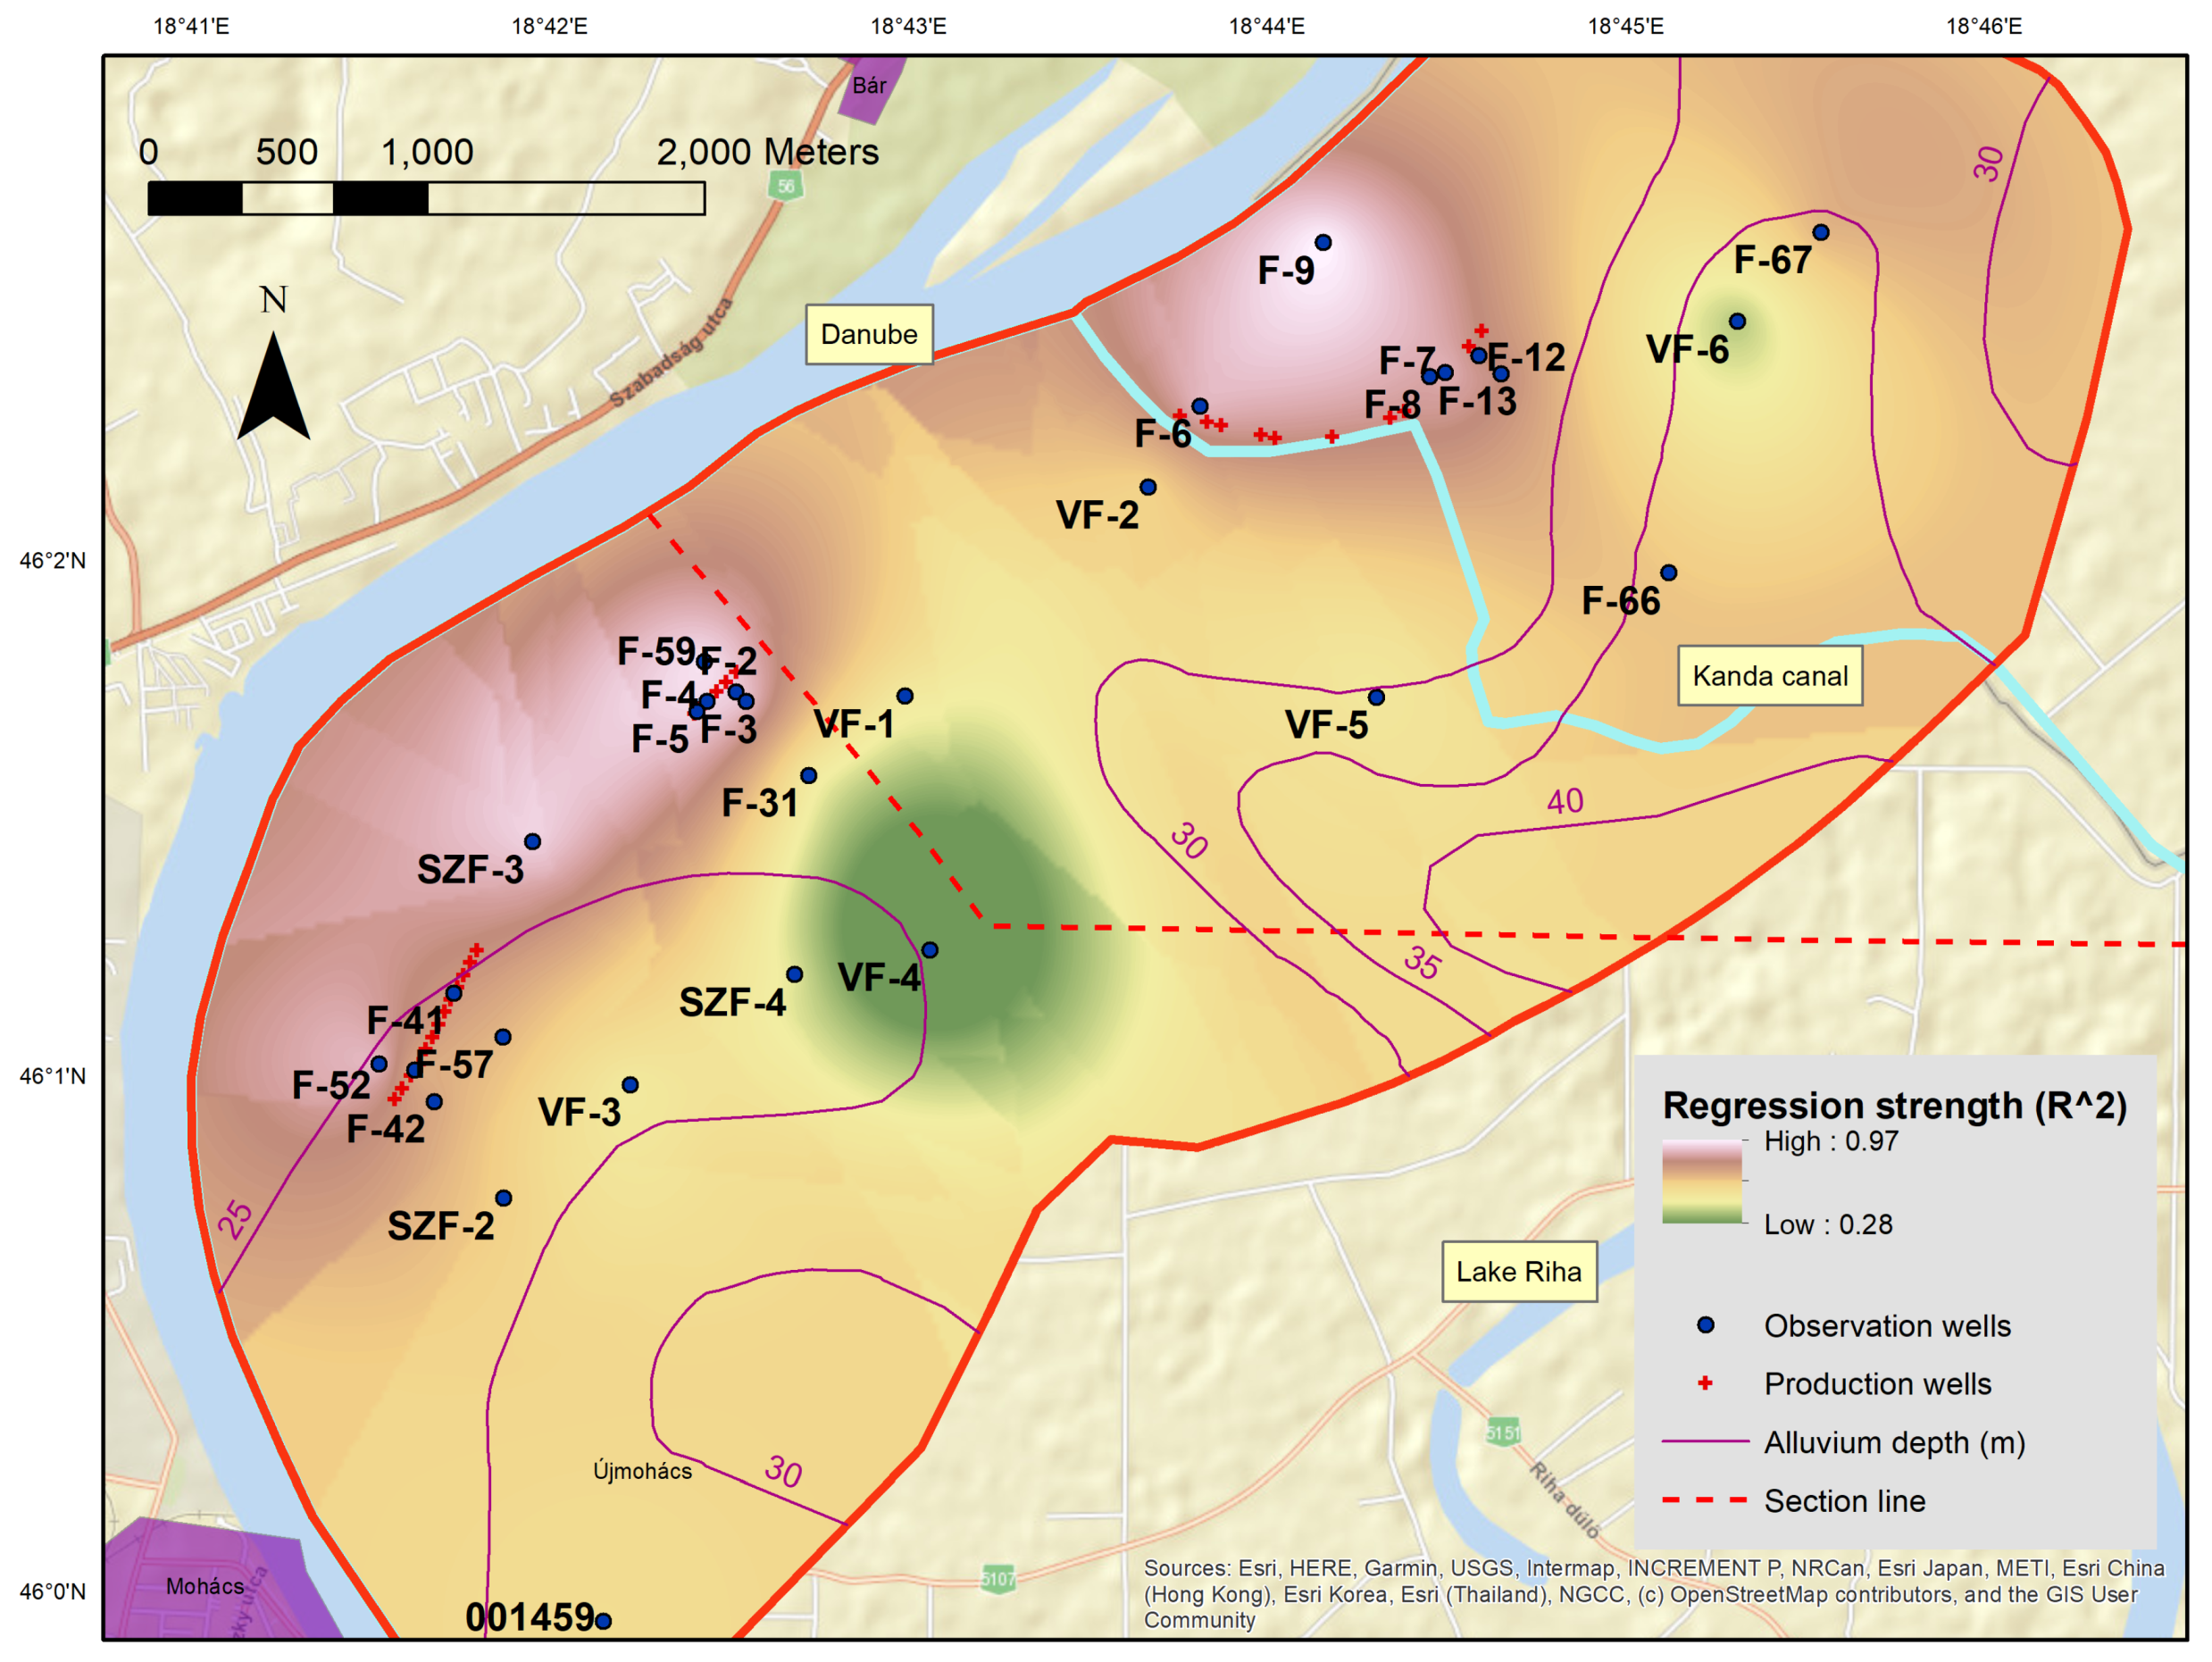
Based on the kriging interpolated average coefficient of determination map (
Figure 9), it was proven that close to the bank (within the first 500 m), the connection between the Danube and the groundwater was very strong during large flood events. Close to the area of the southern production wells, regression values were lower than for the northern ones. The lowest regression was measured in the southernmost section of the bank where K001459 is situated. Moving away from the bank, the effect of the Danube decreased everywhere, but not uniformly. The lowest effect was behind the middle production well series, just where the thickness of the confining layer was shown as zero (
Figure 9).
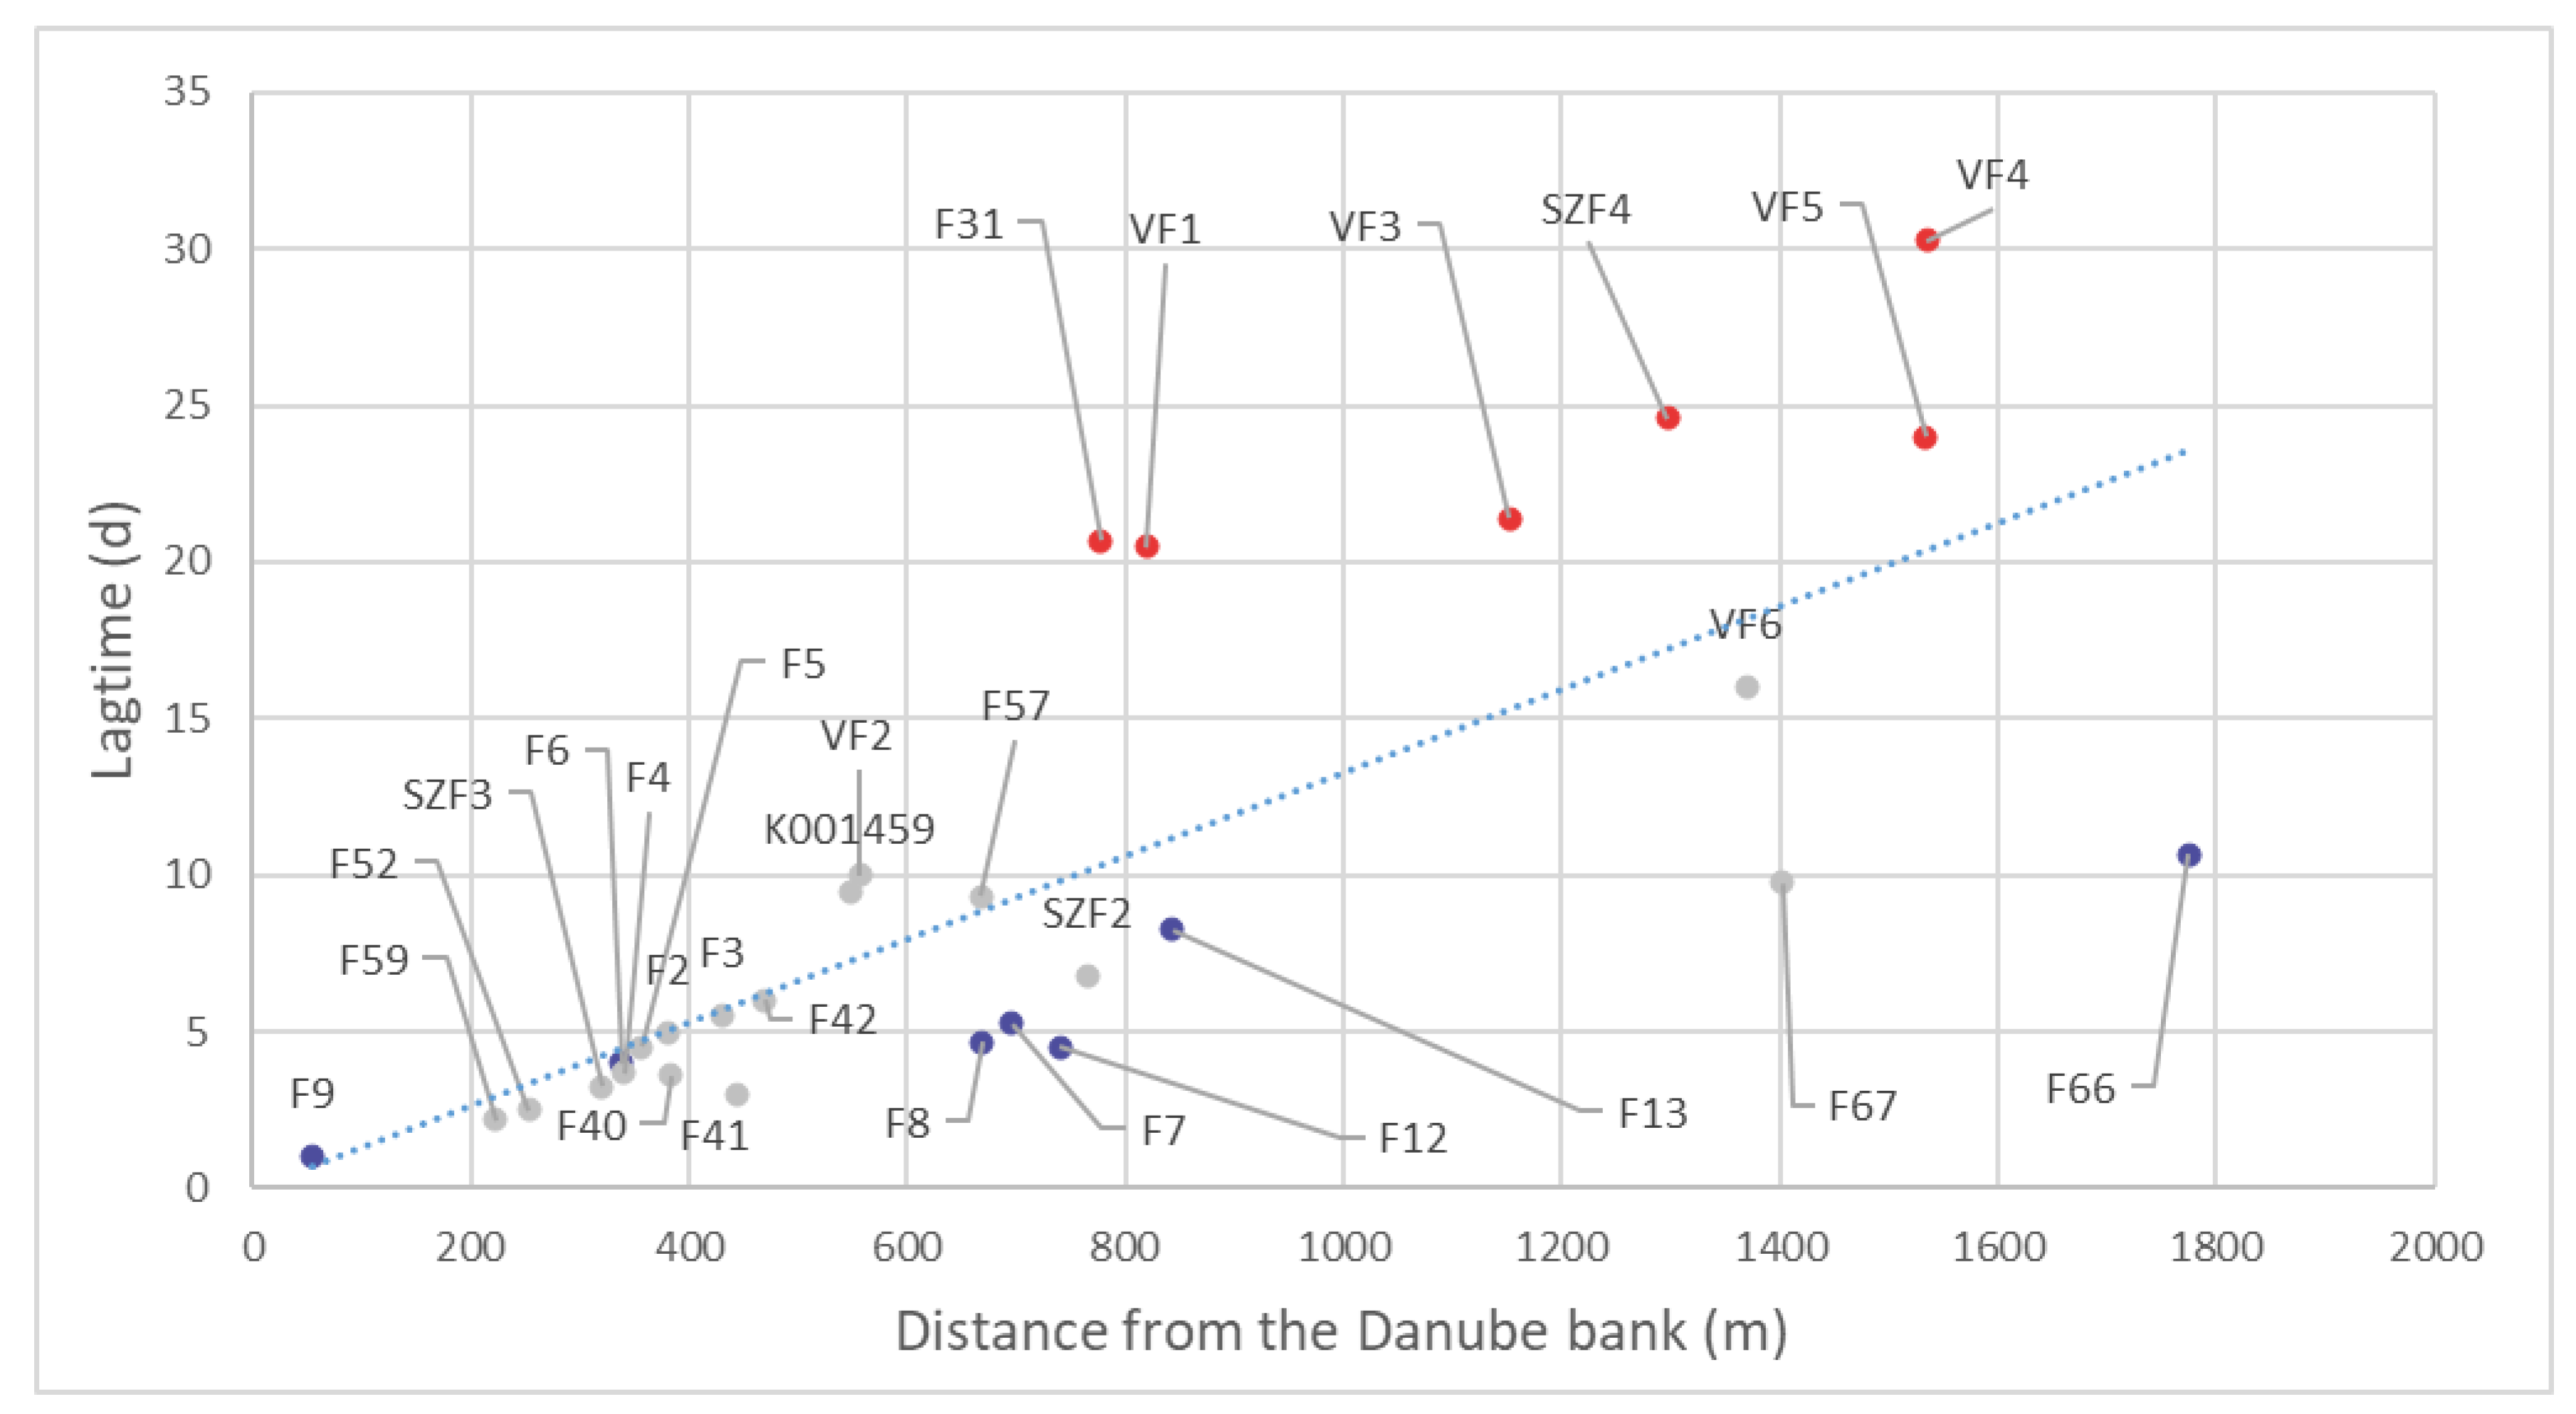
A chart of average pressure head peak lag time (
Figure 10) presents that the values were fluctuating with increasing distance from the bank. They fit roughly to a linear trend line, but even less so than in the case of the coefficient of determination, as they were scattered more around the trend line. A group of observation wells below the trend line (blue dots) was clearly identified as the wells that could be found in the neighborhood of the northern production wells. Moving away from the bank, their dispersion increased. This meant that the hydraulic heads traveled much faster to reach that distance than elsewhere.
The wells above the trend line (red dots) were a group of piezometers located at more than a 700 m distance from the Danube, behind the middle and southern producing wells. Thus, it was clear from these wells that not only they had much lower contact with the Danube, but the flood effects arrived there three to four times slower, despite their distance being only double the wells near the production well.
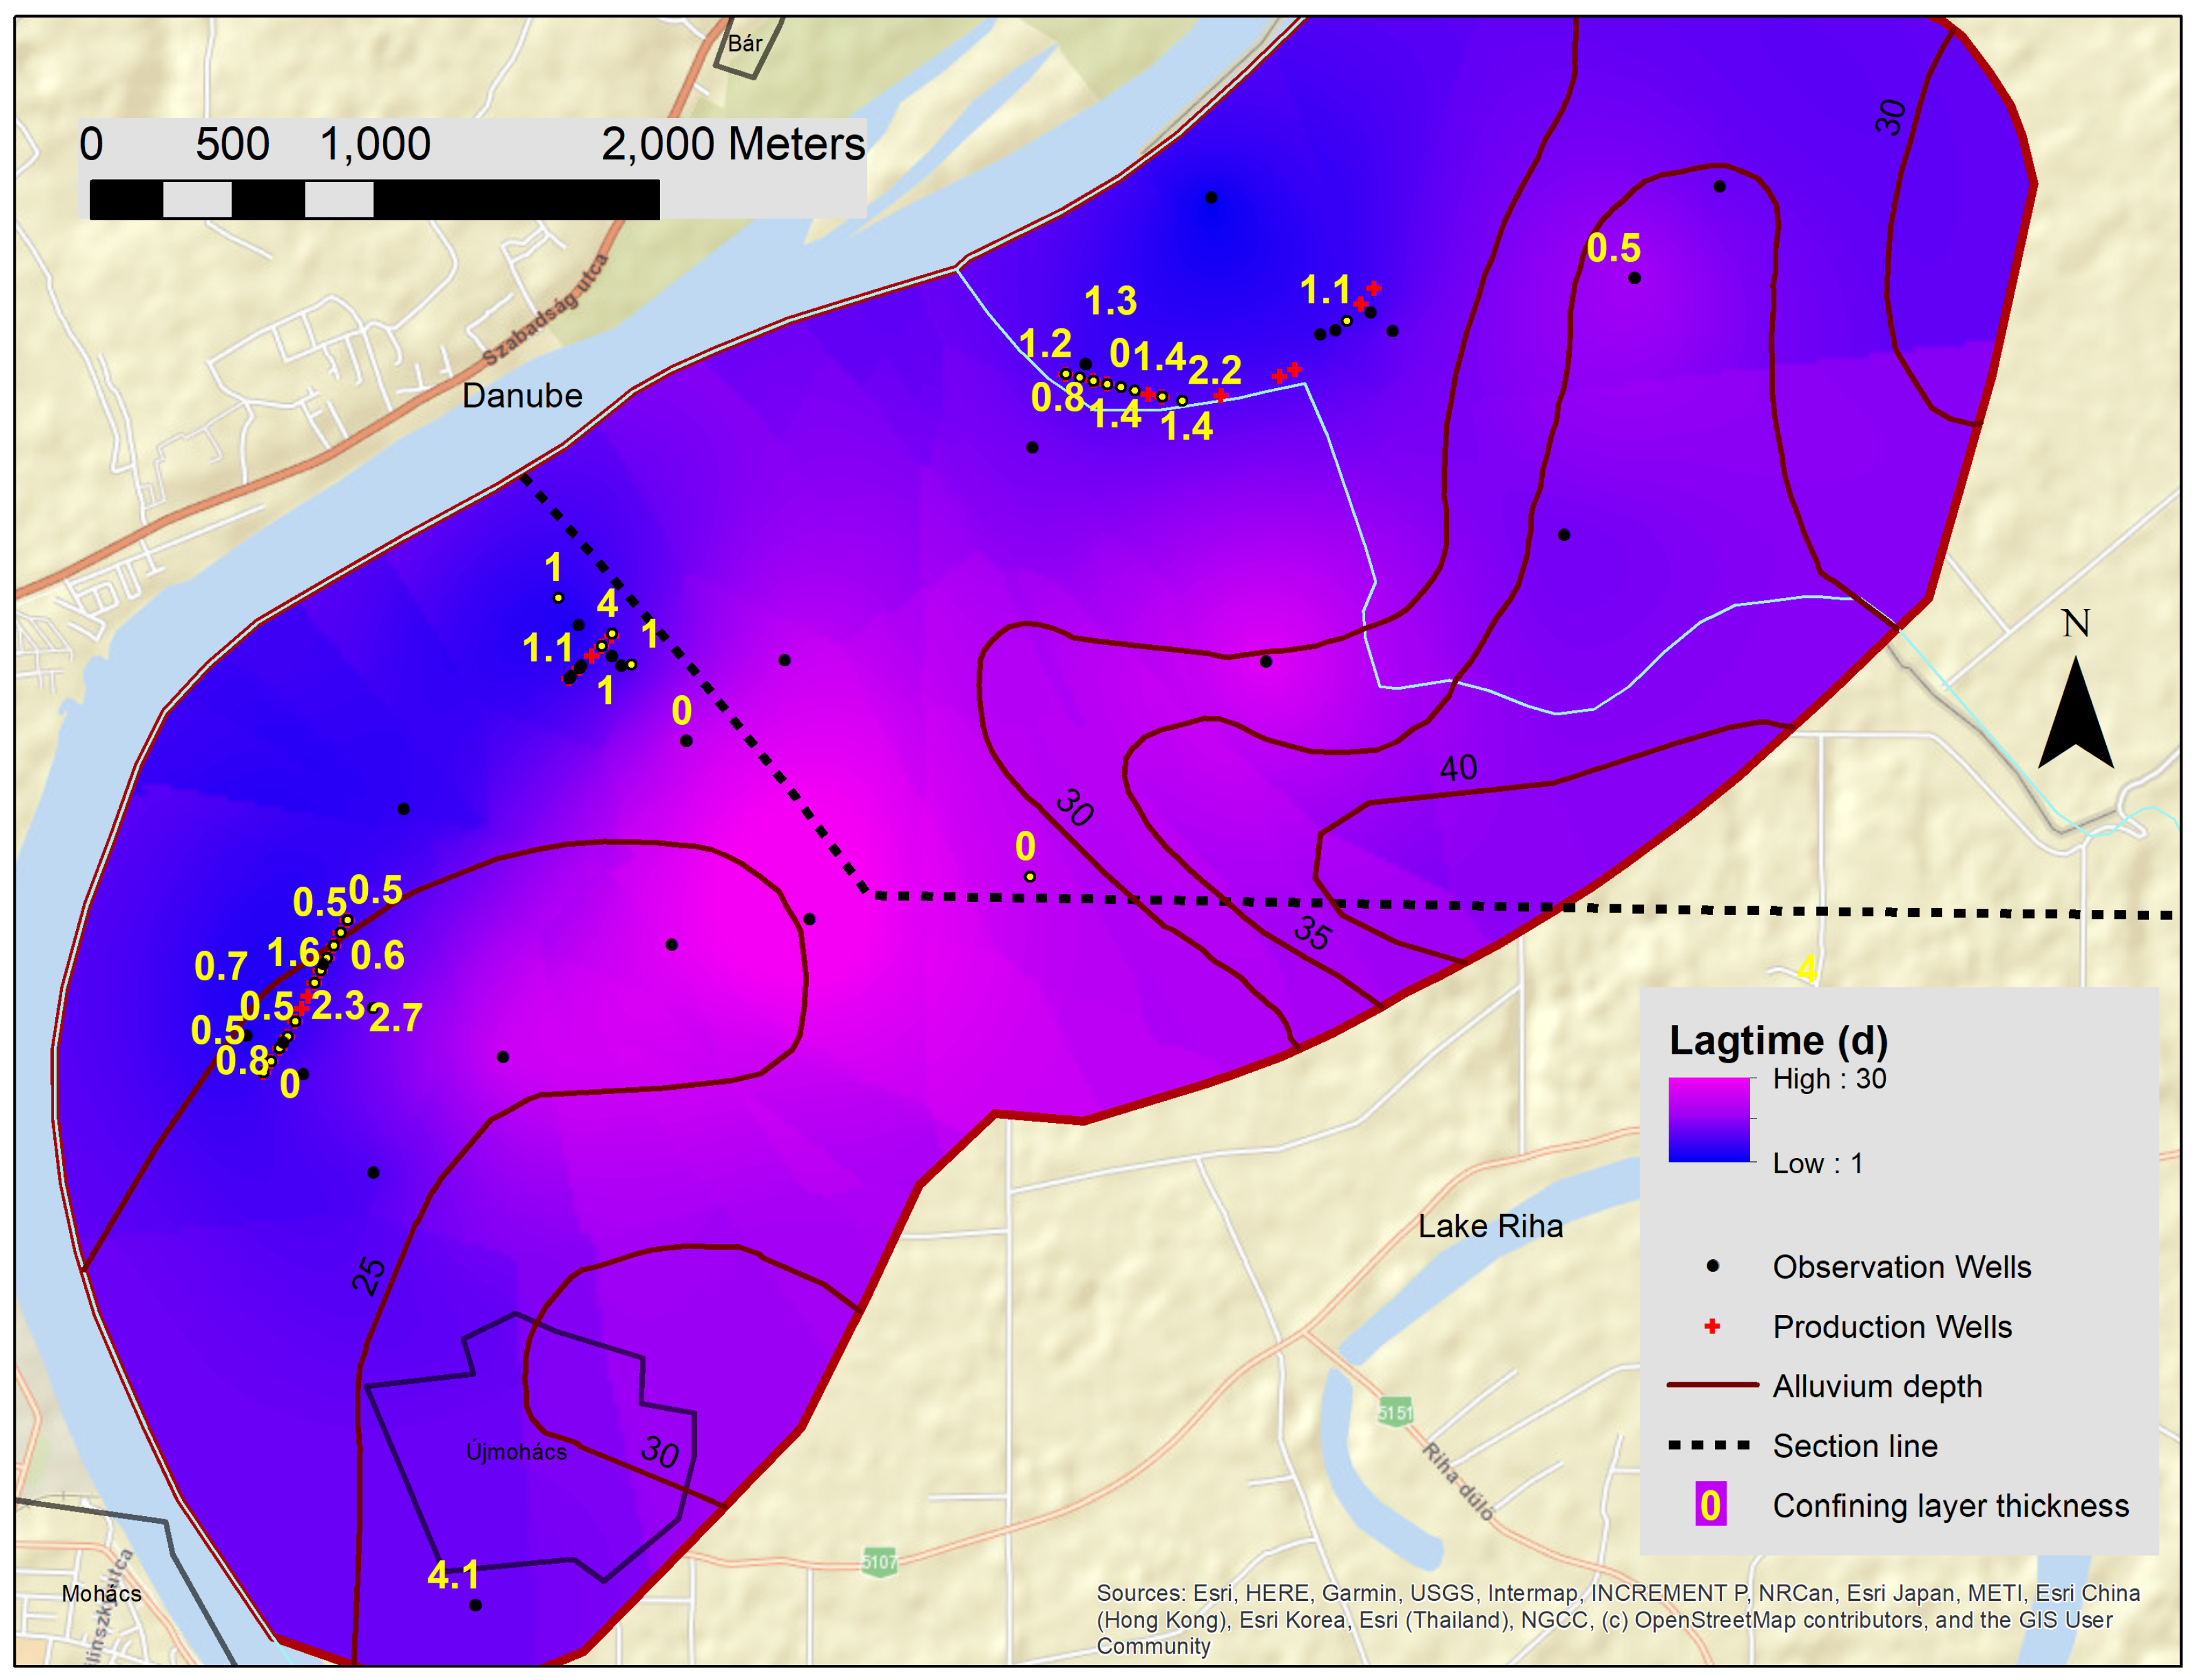
Taking a look at the results of the kriging interpolated map (
Figure 11) of the average characteristic lag time, the spatial distribution of the lag time differences could be seen. The map visually presents the observed deviations. Behind the area of the middle and southern production wells, the average pressure heads progressed at least three times slower than behind the northern production wells.
The average groundwater raising effect () of floods explained to what extent and at what distance from the Danube natural habitats or farmlands could expect excess water inundation during flood events.
Observing the functional relation of the wave proportionality factor of the flood
with distance (
Figure 12), it seemed that the curve followed an exponentially decreasing trend line, and the dispersions tended to decrease with distance. The piezometers in front of the northern production wells had data significantly above the trend line (blue dots). Wells located at more than a 700 m distance from the Danube, behind the middle and southern production wells (red dots), had generally lower water rise than wells at the same distance in the northern area.
The kriging interpolated map of the mean groundwater raising effect (proportionality factor (
),
Figure 13) shows similar results of the LM considering Danube levels only. This effect was the strongest close to the bank. The lowest average proportionality factor, the coefficient of determination, was found at the southernmost section of the bank. Farther from the bank, the rise tended to be reduced with spatial differences in its magnitude. Beyond the northern production well series, the proportionality factor was still high, even though production wells removed some amount of groundwater. Beyond the middle and the southern production well series, the Danube raised the SGW only by a tiny fraction.
Observing the interpolated maps (
Figure 9,
Figure 11, and
Figure 13), it can be seen that they had similarities in many ways. It can be clearly stated that the strong influence of the Danube extended to about 500 m, and beyond this distance, it gradually decreased. This effect disappeared everywhere at 1500 m. It can also be observed that it decreased most rapidly around the middle production wells, and here, its effect ceased at 1000 m. Naturally, this could also be due to the fact that the production wells extracted a large amount of water. Nevertheless, that would not explain the regional differences in the southern, central, and northern producing wells. Furthermore,
Figure 5 and
Figure 6 clearly show from the transformed Danube and groundwater chart of the 2013 floods that the influence of production wells only explained up to 10% of the floodwater variance during major events. Therefore, at least in the case of these floods, the missing contact must be searched elsewhere.
Figure 11 shows the depth of the Pannonian clay layer as determined by geophysical measurements [
12,
13], as well as the thickness of the confining cover layer (yellow numbers) received from hydrogeological drilling logs. We were able to find data on the geological structure of the middle row of the production wells (
Figure 2). Draskovits [
12] published a geological profile made by standard borehole probe (SBP) measurement, which was almost in line with the monitoring wells. The section line is displayed on all of the kriging interpolated maps (
Figure 9,
Figure 11 and
Figure 13). These data were also confirmed by the descriptions of geological boreholes.
Further examination of the monitoring wells around the middle production wells brought the results represented in
Figure 2, which showed that from a 500 m distance from the Danube, this barrier layer was thinning out just where the relationship seemed to be drastically reduced. Beyond this distance, there were only sporadic stratigraphic data available for the area. However, those two stratigraphic data (
Figure 11, along the section line) and the geological section (
Figure 2) itself proved that there was an already exposed series of coarse river deposits. The value of the average coefficient of determination decreased sharply (from 0.9 to 0.6 first, then to 0.2–0.3 at 1500 m). Moreover, lag time suddenly extended from one week to about a month; meanwhile, the distance only doubled.
In order to see exactly how the described geological factors affected the groundwater, it was worth examining in more detail how the pressure head progressed in the vicinity of the middle production well during the 2013 flood.
The propagation of the hydraulic head could be observed on the 2013 flood waves along wells perpendicular to the middle production wells.
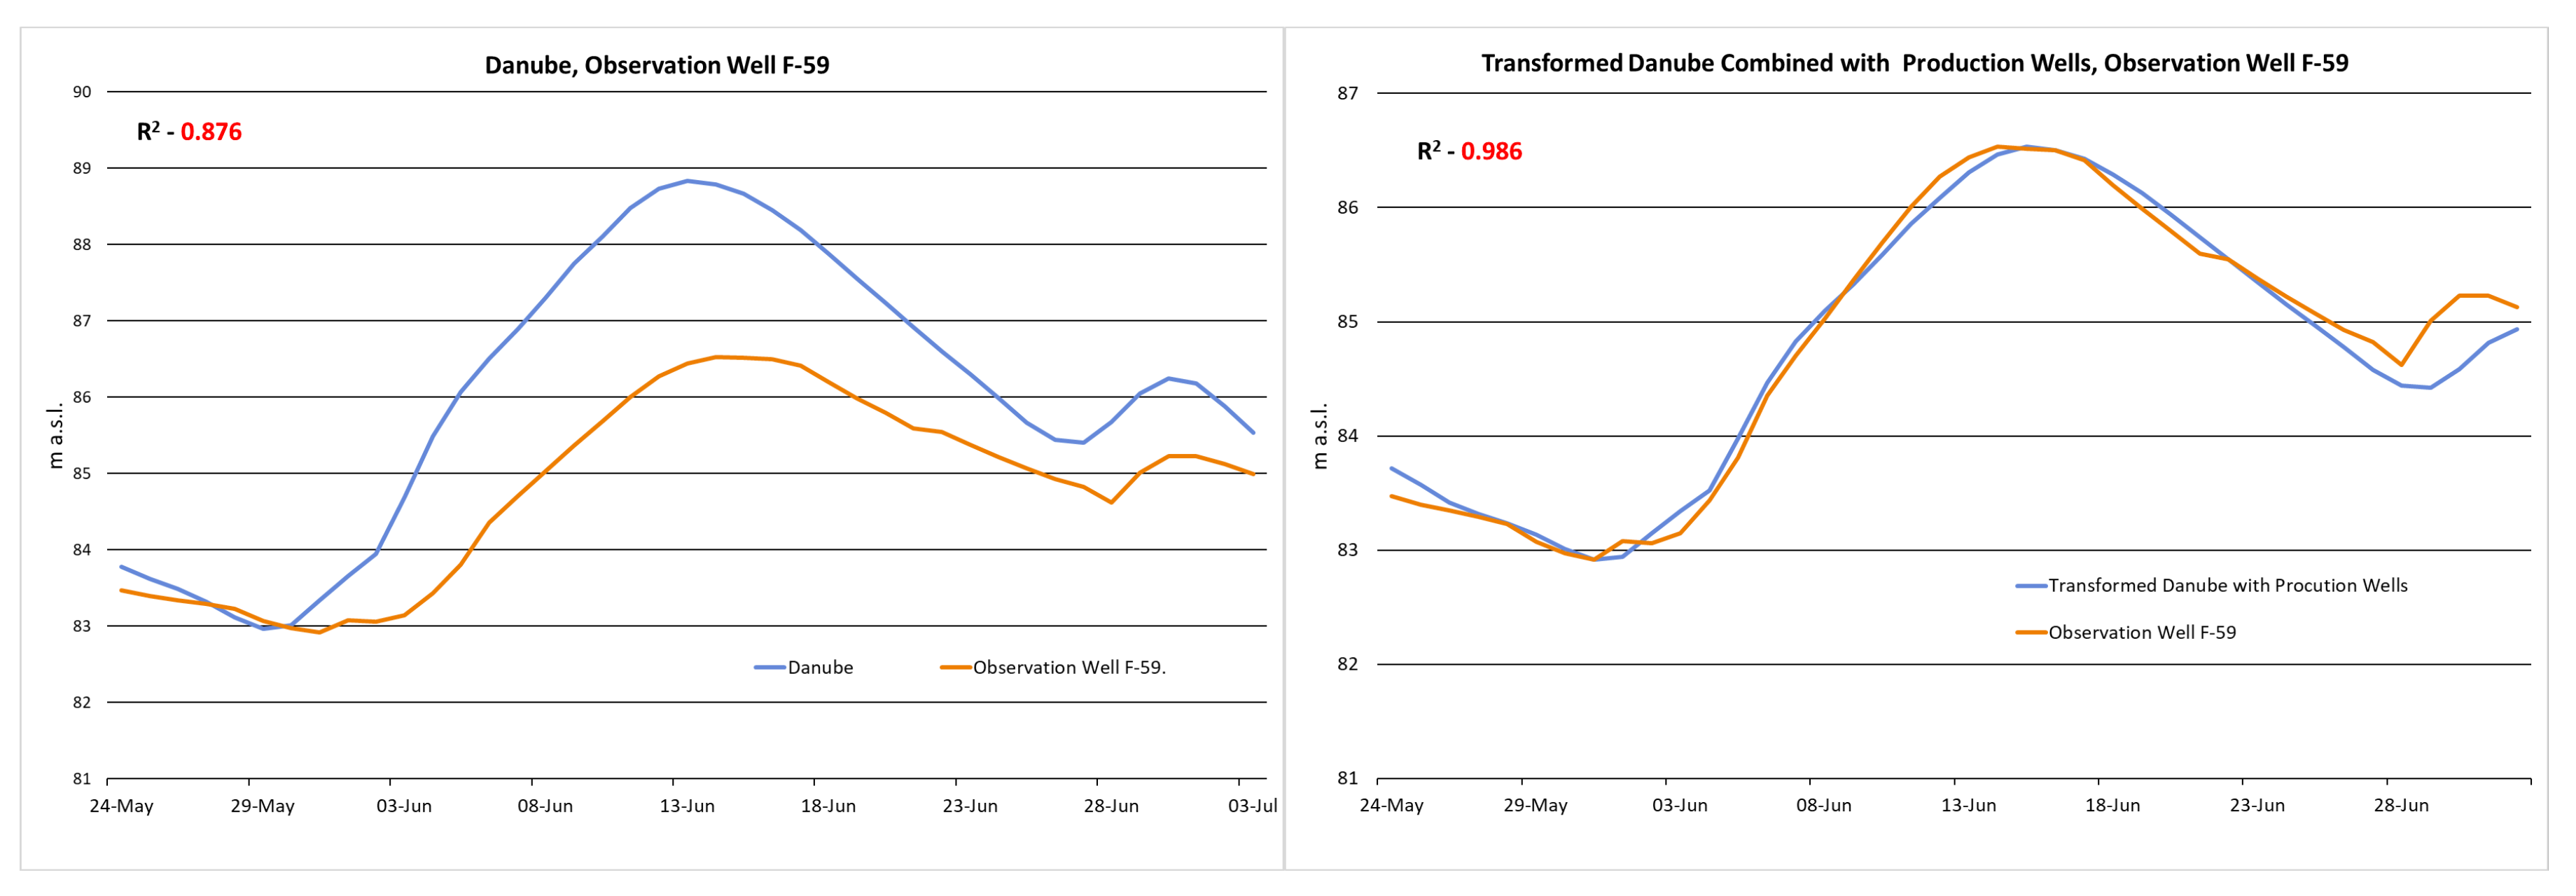
Figure 14 shows that at a 222 m distance from the river (F-59 well), both on the original and on the transformed chart, the curve of the levels of the Danube and the groundwater well were very similar.
As shown in
Figure 4 and
Figure 6 in the methodological section, the amplitude of the F-4 observation well was reduced, but the curves were still remarkably similar even without transformation. The coefficient of determination supplemented by the production wells between well F-4 and the Danube was 0.941.
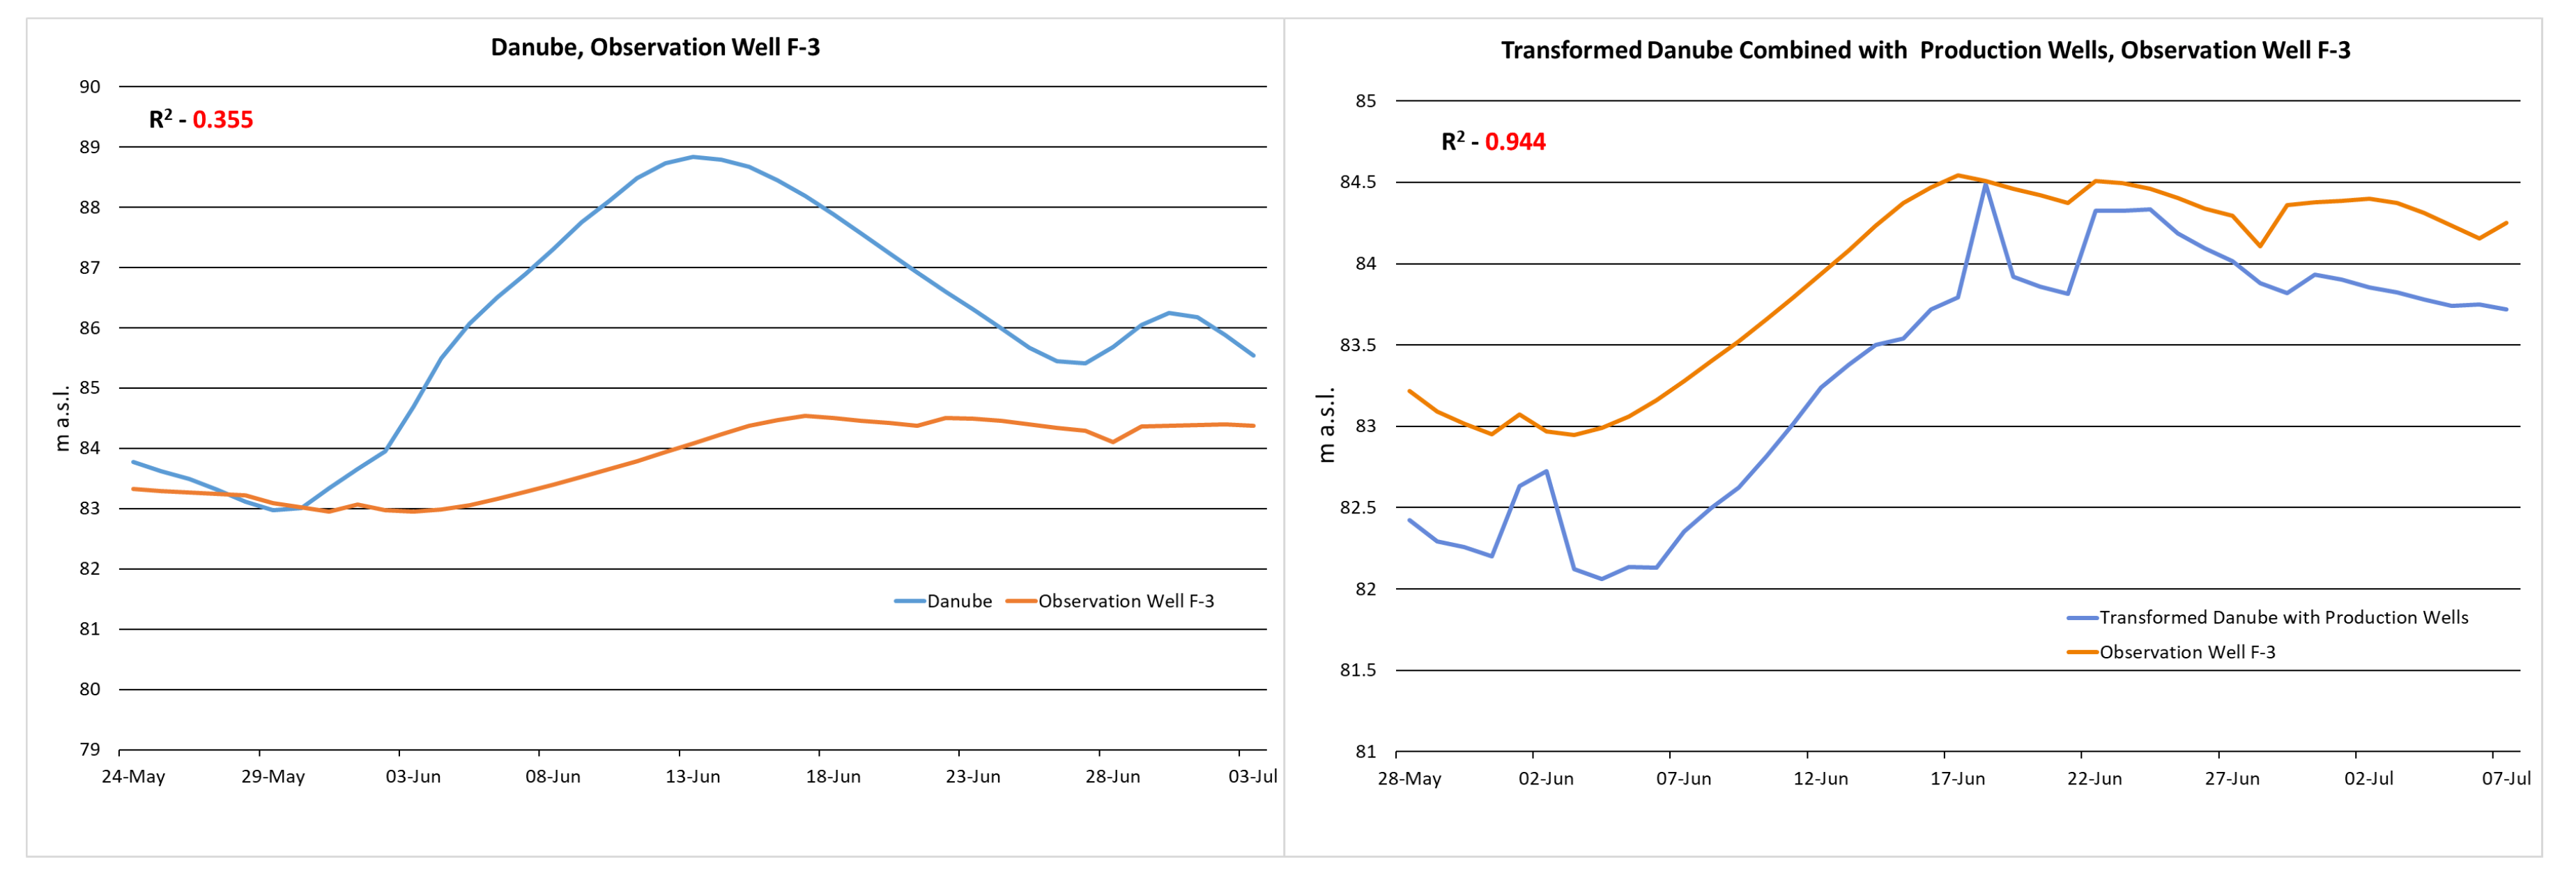
The F-3 well, 430 m away, also proved (
Figure 15) that after wave amplitude differences were removed and transformation was done, we could see that wavelength did not change.
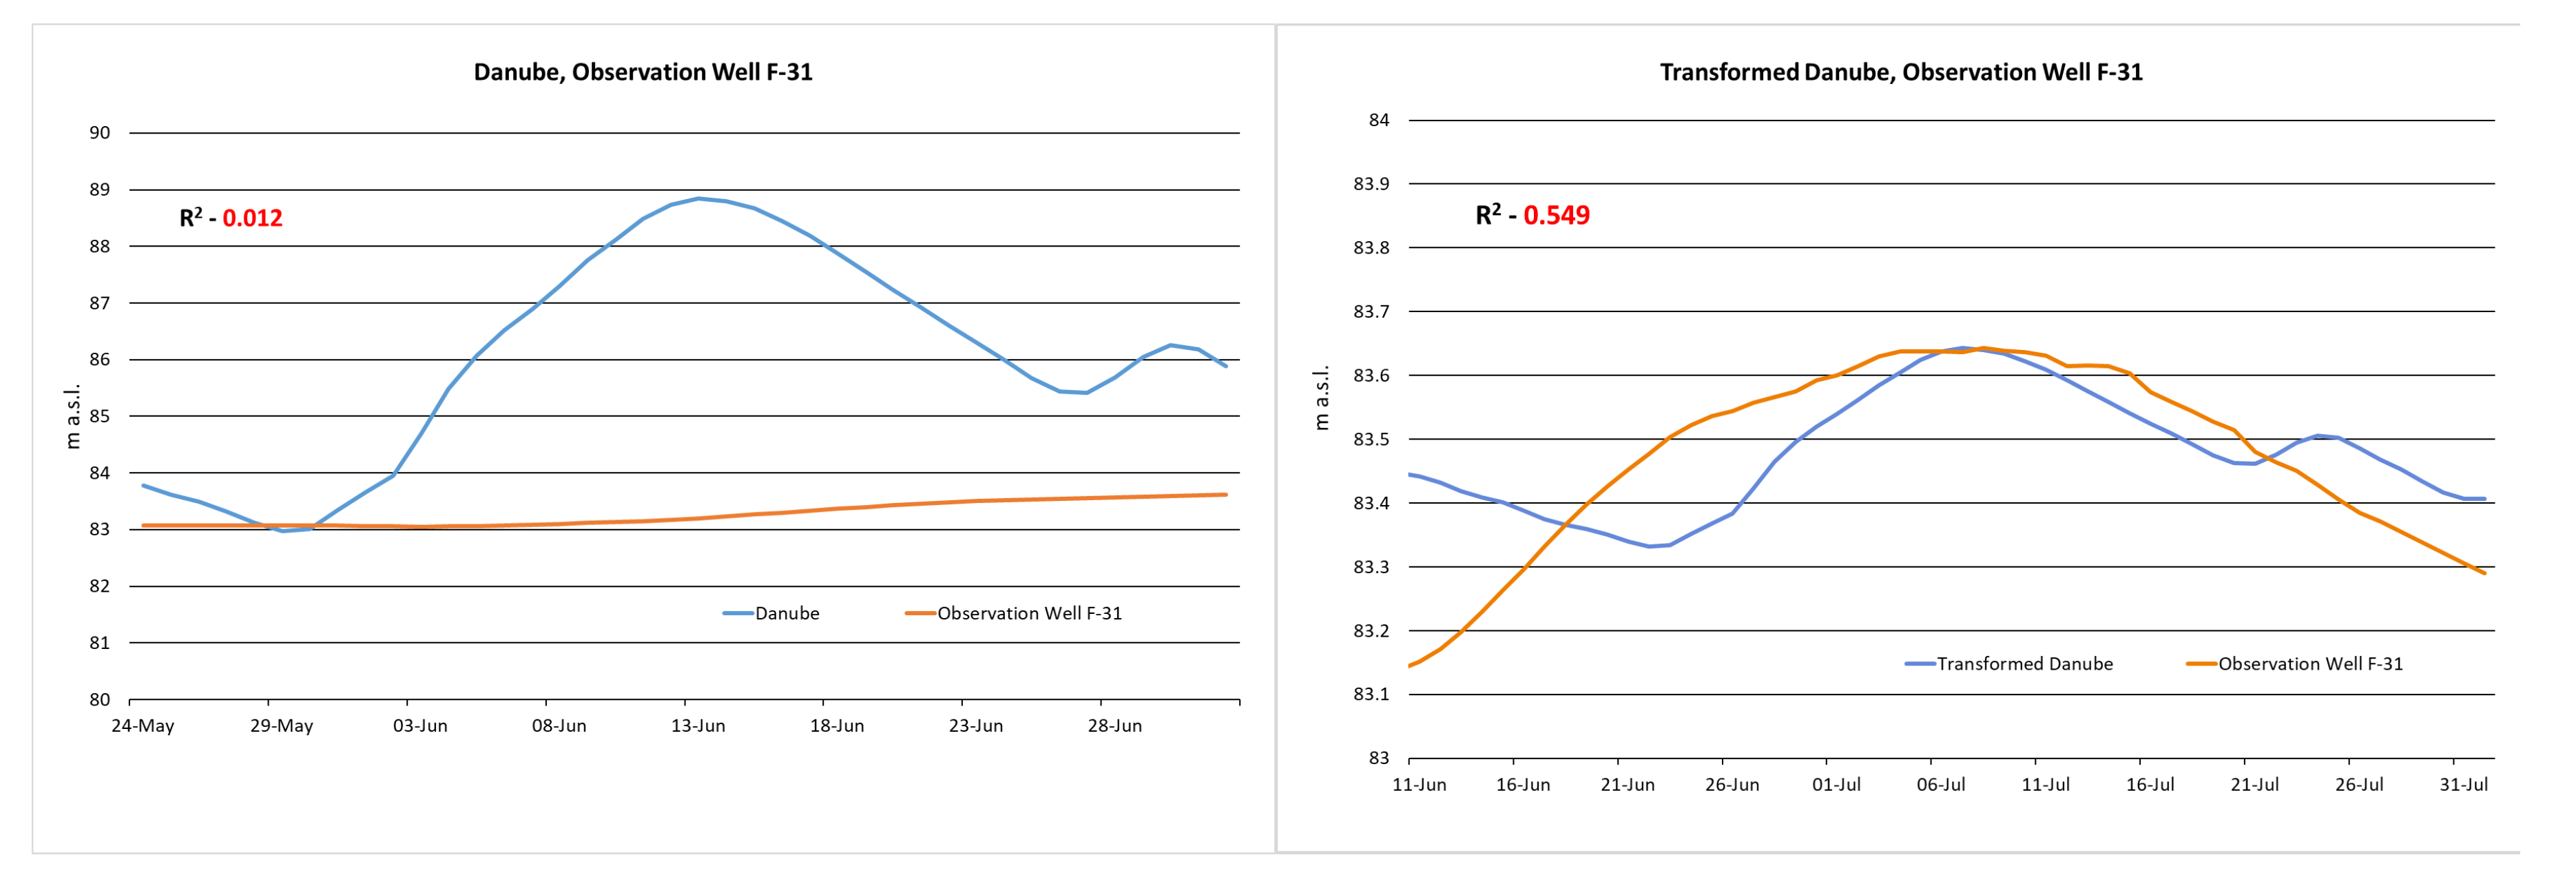
In contrast, the F-31 observation well, 777 m from the bank, had a completely different shape. At such a well, the distance from the Danube of which was less than double that of F-3, not only the wave amplitude shrank, but the wavelength nearly doubled, as shown in
Figure 16). This groundwater wave was induced by the flooding of the Danube, but its shape was very elongated.
In summary, it can be stated that the pressure head wave was traveling with constant velocity at high pressure in the not completely impermeable, silty sand, which was furthermore covered by a layer of clay of one meter in thickness. The waves then reached an uncovered thinner sandy silt layer at a 500 m distance from the bank and became elongated. By taking a look at the lag times chart (
Figure 10), it could be deduced that the average speed of pressure heads in confined environments were 80 m/day (F-2, F-3 at 400 m). This speed then decelerated to 16 m/day under phreatic circumstances (F-31, VF-1 at 800 m).
A schematic figure (
Figure 17) presents how SGW pressure heads became elongated in the middle area of production wells with increasing distance from the bank.
5. Discussion and Conclusions
Our software could calculate the
values between Danube flood waves and SGW waves under the influence of production wells and rainfall effects with variable time shifts of the influencing variables compared to the dependent variable (monitoring well water level). In our study, the average coefficient of determination was reduced from 0.9 to 0.4 within the first 2000 meters from the bank. The effect of clay and medium-grained granular sediments could be understood from the lag time values of the LM. Within the same distance, the measured and averaged lag time grew from zero to 25 days. We also proved that the propagation in a phreatic environment was much slower than in a semi-confined environment. Among the studies that intended to determine the intensity of the connection between flood waves and SGW heads, only very few measured the maximum coefficient of determination with lag time. Jung et al. [
34] had very similar results both in confined and in phreatic circumstances, although they measured it only very close to the river (within 120 m).
It was possible to compare our results with the correlations presented in the literature. However, it was sufficient to only compare correlations on the level of magnitude. Our results were quite similar to the correlation obtained by Vekerdy and Meijerink [
21]. They measured rvalues between 0.3 and 0.85 in a phreatic environment, although in a semi-confined case, r values were between 0.6 and 0.9, even at a 5 km distance. Since the geological sequence (sandy gravel layers were sealed by clayey, silty sediments close to the surface) of their study area (Szigetköz at the Danube River) was very similar to that on Mohács Island, therefore their results were most relevant to us. In contrast to their correlation results, their conclusions on wave propagation differed considerably from ours. According to their research, the propagation rates could exceed 1500 m per day under a semi-confined aquifer of the Danube. Nevertheless, Vekerdy and Meijerink [
21] measured 200 m per day in a phreatic environment. Although these numbers differed from ours, the ratios between these two types were quite similar. We presented only very infrequent and moderate effects of precipitation on SGW at the individual examination of each flood. On the one hand, it was questionable if there was a significant rainfall event at all. Even if there was, it still provided insignificant amounts of water compared to large floods. On the other hand, most of the area was covered with clay. The average results of precipitation were almost zero for every observation well. Some researchers also studied the effects of rainfall on groundwater, presented zero or minimal effects [
35,
36], or arrived at quite different results [
23,
37] on the effect of precipitation on SGW during flood time. Chiaudani et al. [
38] calculated a very weak (0.16) correlation between rainfall and groundwater with a six to nine day time shift, an outcome very close to our average result.
Finally, we also found geological factors that could explain the differences in the Danube flood effect on SGW and pressure head lag time. As we described in the Results (
Figure 17), it seemed that beyond the areas of middle and southern observation wells, the SGW tended to lose connection with the Danube. Naturally, it would be conceivable for production wells to produce so much water that the pressure heads no longer reach distant wells, as described by Major and Sass [
30]. They found that the impact area of the Danube at flood time reached about 1500 m from the bank in the soil, while the average impact area was only 700–900 m. They also discovered the impact of production wells on SGW. According to their results, the most significant effect of the built water bases was the fact that the operating wells shielded the background pressure waves during high water, preventing the rise of groundwater levels. In this way, behind the production wells’ row, low SGW conditions developed. With our approach, we were able to prove impacts at a high distance (1500 m) even behind operating production wells during floods.
However, according to our results, at least in large floods, it was not the effect of the production wells that made the hydraulic heads disappear, but the disappearance of the silty cover layer and the thinning out of the alluvium. In our study, the pressure wave heads traveled in a confined aquifer from the bank. As the waves reached the sandy top layer, suddenly, the water was able to fill a much larger volume, and water flow decelerated. The wavelength became very long, and the strength of the regression was largely reduced, as Sophocleous [
20], Vekerdy and Meijerink [
21], and Wett et al. [
22] described. The most important phenomenon was the pressure wave head elongation difference between the area close to the bank (<500 m) and the area beyond the middle production wells. In that area where the aquifer changed from covered to uncovered conditions, we proved that this change could cause the loss of the hydraulic head (
Figure 17). This opinion was reinforced by the fact that it was only in this area that we could measure the effect of rainfall. Precipitation could contribute directly to the filling of the unsaturated alluvial aquifer [
35].
A buried paleochannel [
20,
39] (and more remotely accessible confining layer) may eventually be the reason for the stronger correlations and faster rate of propagation in the northern production wells’ area. The southern production well area had a lower correlation and lower proportionality factor (
) than the middle and northern production well area. The reason could be the spatially variable resistance of the cover layer [
21] or the spatial variability of the underlying pebbles and sands (here, the thickness of the alluvium was the lowest). Moreover, the clogged riverbed [
40] could cause similar effects. A positive outcome of our work was that we clarified the behavior of the groundwater system in the investigated part of the Mohács Island, which allowed us to predict water-related productivity variability within this area.
