Article

Multisource Groundwater Contamination under Data Scarcity: The Case Study of Six Municipalities in the Proximity of the Naameh Landfill, Lebanon

1
Nature Conservation Center, American University of Beirut, Beirut 1107 2020, Lebanon
2
Institute for Biodiversity and Ecosystem Dynamics, Faculty of Nature Science, Math and Computer Science, University of Amsterdam, 1098 XH Amsterdam, The Netherlands
3
Department of Land, Air and Water Resources, University of California, Davis, CA 95616, USA
4
Department of Internal Medicine, American University of Beirut Medical Center, Beirut 1107 2020, Lebanon
5
Outcomes and Implementation Research Unit, University of Kansas Medical Center, Kansas City, KA 66160, USA
6
Department of Mechanical Engineering, American University of Beirut, Beirut 1107 2020, Lebanon
7
Department of Chemical Engineering and Advanced Energy, American University of Beirut, Beirut 1107 2020, Lebanon
*
Authors to whom correspondence should be addressed.
Water 2020, 12(5), 1358; https://doi.org/10.3390/w12051358
Submission received: 20 March 2020 / Revised: 21 April 2020 / Accepted: 23 April 2020 / Published: 11 May 2020
(This article belongs to the Section Water Quality and Contamination)

Abstract

:
Lebanon is affected by a protracted environmental and solid waste crisis that is threatening the water resources and the public health of its communities. This study is part of a public participatory research project that aims to evaluate the impacts of solid waste disposal practices on water, air, and health in six villages of Lebanon, stigmatized by the presence of a regional landfill. Community mapping enabled the selection and testing of seven springs and three wells in the upstream basin and 11 wells in the lower basin, covering a broad list of chemical, physical, and bacteriological parameters. Two water quality indices (WQ-1 and WQ-2) were used to assess water quality in the study area. The results for the upstream wells and springs showed a significant bacteriological contamination, while the results in the lower wells showed high levels of conductivity, chlorides, and zinc along with the occurrence of organic micropollutants in trace concentrations. The comparison between the experimental data, with the natural background value established in the same area, did not show major differences, except for zinc and bacteriological indicators. The bacteriological contamination is most likely related to sewage infiltration into groundwater at the time of the assessment. Zinc may result from landfill leachate infiltration but also well corrosion. Saltwater intrusion affecting the coastal basin is masking the results for conductivity, chlorides, and sulfates, whereas the presence of small traces of organic micropollutants in the coastal aquifer may be related to leachate infiltration. WQI-1 results, which included bacteriological indicators, showed highly degraded water quality in the C1-C3 inner basin. In contrast, WQI-2, which includes physio-chemical indicators only, showed good water quality, slightly deteriorating in the coastal area, downstream of the Naameh landfill.

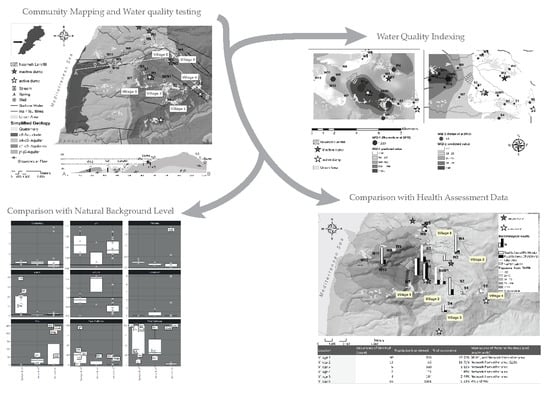
Graphical Abstract

1. Introduction

Nations and communities approaching the second decade of the new millennium are facing a multi-tiered challenge to improve their waste management practices and control the health impacts from the release of environmental pollutants [1]. Everyday news brings to light a new tragedy of the commons, exposing the public health consequences of unsustainable environmental practices, especially in the developing world. While the access to safe water as an inalienable human right has been recognized by the United Nations General Assembly Resolution 64/292 [2] and is at the center of the Sustainable Development Goals, there is still a long way to reach the targets of Goal 6: Clean Water and Sanitation for all by 2030 [3]. Lebanon is currently struggling with several socioeconomic and environmental challenges. These are linked, among other factors, to (a) a chronic environmental management deficit at the national level due to outdated regulations [4], (b) poorly implemented environmental policies [5], (c) the burden of a consumerist culture [6], and (d) the rapid influx and the permanence of 1.5 million Syrian refugees after the 2011 Syrian conflict [7]. As a result, several hazardous solid waste disposal and wastewater discharge practices are exacerbating the stressed Lebanese environmental resources and threatening the hosting and displaced communities’ health [8,9]. Concerning solid waste management, most of the municipalities in rural areas are currently open dumping or open burning a significant amount of waste [10,11,12]. In addition, landfilling has been practiced as a solution for waste disposal for the Beirut broader metro area, home to over 2.2 million residents (half of Lebanon’s population). Several international and some Lebanese studies have clearly demonstrated the negative effects of open burning, open dumping, and landfilling for the environment and public health of the nearby communities [9,13,14,15]. Another threat to the environment and public health is represented by poor sanitation in most of Lebanon, considering that 92% of the country’s wastewater is discharged untreated in surface water bodies or septic tanks or cesspits [16]. Untreated wastewater discharge in the environment is particularly hazardous in mountain areas, often marked by a well-developed karst and by a rapid connection between surface water and subsurface flow over large distances, e.g., [17].
Understanding the effects of waste disposal across the Lebanese water systems is therefore crucial considering the abovementioned implications for public health. Geochemistry has been found as an important tool to differentiate anthropic and natural geochemical phenomena occurring in aquifers [18,19,20,21]. At the same time, there is a growing consensus on the need to integrate scientific investigation with community knowledge and concerns [22,23].
This study is part of a public participatory multidisciplinary research described in [24]. The work was initiated by six municipalities in Aley District in the aftermath of the closure of the regional landfill of Naameh in 2015, which led to a national solid waste crisis that spanned till 2016 (Waste Crisis 2015–2016 [10]). The municipalities reached out to the American University of Beirut (AUB) for support in assessing the environmental (air, water, and health) damages from waste disposal and improve their waste management practices [24]. In particular, their interest stemmed from a public health scare that emerged from the long-awaited closure of the landfill after years of operation beyond its design capacity. The present study endeavors to answer two questions raised by the six communities:
  • In view of the solid waste crisis of 2015–2016, are there any residual damages on the quality of surface and groundwater resources (springs and wells)?
  • What are the other threats affecting the water quality in the area?
To answer these research questions, a water quality testing campaign was performed during high flow period in the hydrological year (November and April). A large spectrum of physical, chemical, and microbiological parameters were tested for 18 water sources. While national published studies focused on anthropic impacts on water resources and related public health implications [14,25,26,27], no research attempted to establish the effects on the groundwater resources from landfilling, open dumping, or wastewater disposal. This study is therefore the first of its kind in Lebanon.
Moreover, our data and approach have some broader implication: data scarcity undermines the capacity of local authorities and communities in the developing world to make decisions based on sound evidence [28]. Hence, there is a particular need for site-specific water quality assessments in a data-scarce context like Lebanon for well-informed water management strategies.

2. Materials and Methods

2.1. Study Area

The study area is located 15–20 km south of Beirut, Lebanon. It covers the cadastral area of six municipalities in Aley District, Mount Lebanon (Figure 1). The climate is Mediterranean, characterized by hot, dry summers, and short winters [29]. The annual rainfall in the area is between 700 and 900 mm [30]. The major surface water body in the area is the Damour River on the southern border of the area, while the central and the northern parts are characterized by the presence of seasonal surface water bodies (gullies and streams).
As shown in Figure 1, the area is geologically located in the flank of a regional anticline, giving a general slope of the layers EW dipping [31,32,33,34,35]. The coastal area is defined by the C4-C5 aquifer, part of the 19b Sarafand-Khaldi Cretaceous basin [32]. This aquifer is a strategic resource for the local communities and the Beirut metropolitan area (supplying around 40% of its water demand) [32]. The C4-C5 coastal basin has been facing saltwater intrusion since the 1960s [36,37]. The inland is a mountainous area, defined by alternating lithologies between sandstone (C1 formation), marls and locally limestone (C2a, C3 formation), and limestone (C2b formation). The general groundwater direction is east to west, with quality deterioration westward due to saltwater intrusion [36].
The boundary between the two basins is defined by the Hammana formation (C3), dominated by marl layers forming an impermeable base of the C4-C5 basin. While the C1-C3 basin is hydrogeologically defined by [32] UNDP-MOEW (2014) as an unproductive basin for groundwater (Basin 31-Aptian Albian), many seasonal and some perennial springs are present in the area. The local communities use these springs for irrigation, water supply in the dwelling and, in some cases, drinking. The Naameh landfill is located at the western edge of the C4 basin, at a lower hydrographical and hydrogeological position than the upper municipalities (Figure 1). Therefore, effects on the surface and groundwater from the landfill are not expected to occur in the C1-C3 Aptian Albian Basin. However, several open dumps are present in the C1-C3 used by the local municipalities in emergency cases. In fact, the pop up of municipal dumps in Mount Lebanon after 2015 is one of the consequences of the closure of the Naameh landfill in 2015 [10]. It is worth mentioning that while the Naameh landfill is an engineered landfill provided with a bottom liner and leachate draining and methane collection systems, local dumps do not have any environmental control in place.
The area has been studied by Khadra and Stuyfzand (2014) [33]. Their study defined the main hydrosomes and the hydro-geochemical facies, based on an extensive sampling for major cations and anions, isotopes, and heavy metals, and followed Stuyfzand’s, 1993 [38] methodologies. In this work, the authors identified one area, north-west of the landfill, to be likely affected by the landfill leachate percolation in the aquifer [33] (Khadra and Stuyfzand, 2014). The presence and extent of the contamination indicated by these authors was based on the results from one well, due to its elevated concentrations of chlorides, boron, lead, and zinc. Moreover, the sample was plotted below the boron/chloride (B/Cl) reference line constructed for the salinized samples, which reflected higher chloride content compared to the corresponding boron.

2.2. Methods

Guided by the local municipalities, mapping of the main water sources and local solid waste dumping sites in the area was conducted between October and November 2017. A total of 18 springs, 28 public and private wells, and seven municipality dumpsites (four inactive and three active) were identified. The selection of the sampling points from all mapped wells was based on the following two considerations: (a) prioritize water sources of public concern (municipal wells and private wells used for water trucking and municipal springs used for drinking) and (b) prioritize wells located in the proximity of the Naameh landfill (for the sources located downstream). Accordingly, 12 wells and seven springs were selected for sampling. Samples were also collected from a seasonal stream in the proximity of a local dumpster to estimate the impacts of open dumping on surface water. A summary table of the locations discussed with the community can be found in supplementary information Table S2.
Two wells (W4 and W5) were sampled twice during the campaign, due to their importance for the local community. In fact, W4 is used by many residents of Village 5 as a source of drinking water and W5 is the main water source for the largest municipalities in the area, serving approximately 15,000 citizens (information from the municipality).
A detailed list of the analytical methods deployed for the water quality measurements is presented in the supplementary information (Table S1). Analyses were performed at the Environmental Core Lab at AUB and at Eurofin Analytico, Netherlands. Samples were collected at the source outlet using sterile vials and bottles and strictly followed the laboratory standard procedures. Shipped samples were kept refrigerated and delivered within two days to the Netherlands. All bacteriological analyses were conducted at AUB laboratories.
The sample from the local river (R1) in the proximity of an active municipal dumpsite was tested for physical parameters (pH, conductivity, and temperature), general chemical parameters (chlorides, nitrate, phosphates, and sulfates), oil and grease, metals, microbiology (total and fecal coliforms and Escherichia coli (E. coli)) and volatile organic compounds (VOCs). Springs in the C1-C3 basin were tested for physical parameters, general chemical parameters, heavy metals, microbiology, total petroleum hydrocarbons (TPH), and adsorbable organic halides (AOX). AOX is a sum parameter used as a proxy for persistent organic pollutants in water. Possible sources of AOX include landfilling with high organic waste fraction [39], open dumping and burning practices [40], or other sources including sludge and sewage infiltration [41,42]. It is worth mentioning that the use of AOX as an indicator of pollution is disputed by a portion of the scientific community [43]. The same tests performed for the C1-C3 springs were also conducted for the three wells located in the C1-C3 basin. The wells located in the C4-C5 basin—the unit that hosts the Naameh landfill—were tested for a more extensive range of organic compounds. These include mono aromatic hydrocarbons, benzene, toluene, ethylbenzene and xylene (BTEX), phenols, poly aromatic hydrocarbons (PAH), halogenated hydrocarbons (volatile halogenated hydrocarbons, chlorinated benzenes, chlorinated phenols, polychlorinated bisphenols (PCBs)), chloronitrobenzenes, pesticides (chlorine, nitrogen and phosphorus based), and total petroleum hydrocarbon (TPH).
Each result was compared to the relevant national and international guidelines for drinking water Ministry of Health (MOH), 1999 [44] and World Health Organization (WHO), 2008 [45]. Sampling was conducted in November 2017, February and April 2018, corresponding generally to high flow period in the study area.
To evaluate the anthropogenic impacts on water quality, a comparison was made with the natural background concentration established in the same area by Khadra and Stuyfzand (2014) [33]. For each hydrogeological area and type of water source (springs or wells), a 95% confidence level interval was calculated from the results. For bacteriological parameters that were not included in the study of [33] Khadra and Stuyfzand (2014), a natural background value was assigned equivalent to the limits of detection (1 colony-forming unit (CFU) for total and fecal coliforms).
To establish the water quality across the area of study, two water quality indices (WQI) referred to as WQI-1 and WQI-2 respectively, adapted from Muzenda et al. (2019) [46] and Soltan et al. (2013) [47], were determined from the experimental water quality data (Appendix A, Equations (1)–(6)). Both indices compare the water quality results to a reference water quality standard. The Lebanese Ministry of Health (MOH) Standard 1999 [44] was adopted in this study. The parameters included in WQI-1 are conductivity, pH, chlorides, nitrate, phosphorous, barium, chromium, selenium, zinc, and fecal and total coliforms. The parameters for WQI-2 were almost identical to WQI-1 but excluded the total and fecal coliforms results. WQI-1 has a relatively high weight for the bacteriological parameters (fecal and total coliforms) and is therefore more appropriate as an indicator for possible sewage and wastewater effect on water quality. A value for WQI-1 that exceeds 100 indicates that at least one of the parameters is above the referenced standard. On the other hand, WQI-2 averages the ratio between the results and the reference standard adopted. Accordingly, a value of 100 for WQ-2 indicates that several parameters exceeded the WQ referenced standard. WQI-2 is used therefore to indicate differences in physicochemical water quality across the area (the two methods are described in detail in Appendix A).
The results for water quality were interpolated using the Kriging operator of the Spatial Analyst toolset of ArcGIS Desktop 10, ESRI [48] (ordinary Kriging method, spherical variogram with variable searching radius, output cell size 100 m). All statistical analysis was performed using R software. Plots and graphs were created using ggplot open source packages for R [49].

3. Results

The results of the water quality parameters are presented in Table 1, Table 2 and Table 3 and will be elaborated below according to the different sampling areas and sources.

3.1. Stream

The sample R1 was collected in the immediate proximity of a local municipality dumpster. R1 showed six flagged values against Ministry of Health (MOH) [44] maximal concentration limits (MCL) for wastewater disposal in surface water; nominally, conductivity (1576 uS/cm), nitrate, sulfides, manganese, oil and grease in water (Table 1). The microbiology analysis showed concentrations above the limits, with fecal coliforms and E. coli above 10,000 CFU.

3.2. C1-C3 Groundwater Basin

The results for the C1-C3 groundwater basin (Table 2) revealed values of conductivity and pH within the standards for both springs and wells. Nitrate and phosphates spiked in three samples (two springs and one well). Barium is present at low concentration (5.4–18 ug/L) in all the samples, selenium and chromium are present in one well at trace concentration, and zinc is above 100 ug/L in two wells. Low concentrations of TPH were detected in one spring and low levels of oil and grease were reported for one of the wells. AOX was not detected in any of the samples. All the samples contained total and fecal coliforms and six of the 10 samples were positive for E. coli. Full results are presented as supplementary information (Table S3: results from water quality testing of springs in C1-C3 basin and Table S4: results from water quality testing of wells in C1-C3 basin).

3.3. C4-C5 Groundwater Basin

Three wells in C4-C5 basin exhibited high values of conductivity, chlorides, and sulfates (Table 3). One well showed moderate nitrite levels (0.095 mg/L). For the metals, trace concentration levels of arsenic, chromium, copper, mercury, and molybdenum were detected in different sources in the aquifer. As for the C1-C3 aquifer, barium was present as background in all samples, while zinc spiked in three wells (W4, W8, and W9). For the organic compounds, low levels of TPHs were detected in four wells, in association with phenol and trichloromethane (chloroform). Biphenyl was detected at very low concentration in two wells. Phenols were also detected at higher concentration (400 ug/L) in one sample (well W5A) but were not detected in the same well when sampled again (W5B). Two of the wells showed high levels of fecal and total coliforms and positive E. coli, while low levels of bacteria were detected in two wells (Fc 1–2 CFU/250 mL; TC 3–4 CFU/100 mL). Full results are presented as supplementary information (Table S5: results from water quality testing of wells in C4-C5 basin).

3.4. WQI

Water quality indices WQI-1 and WQI-2 are presented in Table 4. The springs of the C1-C3 basin have very poor water quality as WQI-1 is higher than 100 for all locations and has an average of 1121. Similarly, the wells in the C1-C3 and C4-C5 basin have poor water quality, with an average WQI-1 of 444 and 377, respectively. More generally, WQI-1 is significantly lower for wells than for springs. On the other hand, values of WQI-2, (which do not include total and fecal coliform values), were below 100 for all locations. Full results for the water quality indices computation are presented as supplementary information (Table S6: Wi and K value for WQI-1 and Table S7: Result from WQI-1 Analysis; Table S8: Result from WQI-2 Analysis).

4. Discussion

4.1. Comparison with Natural Background

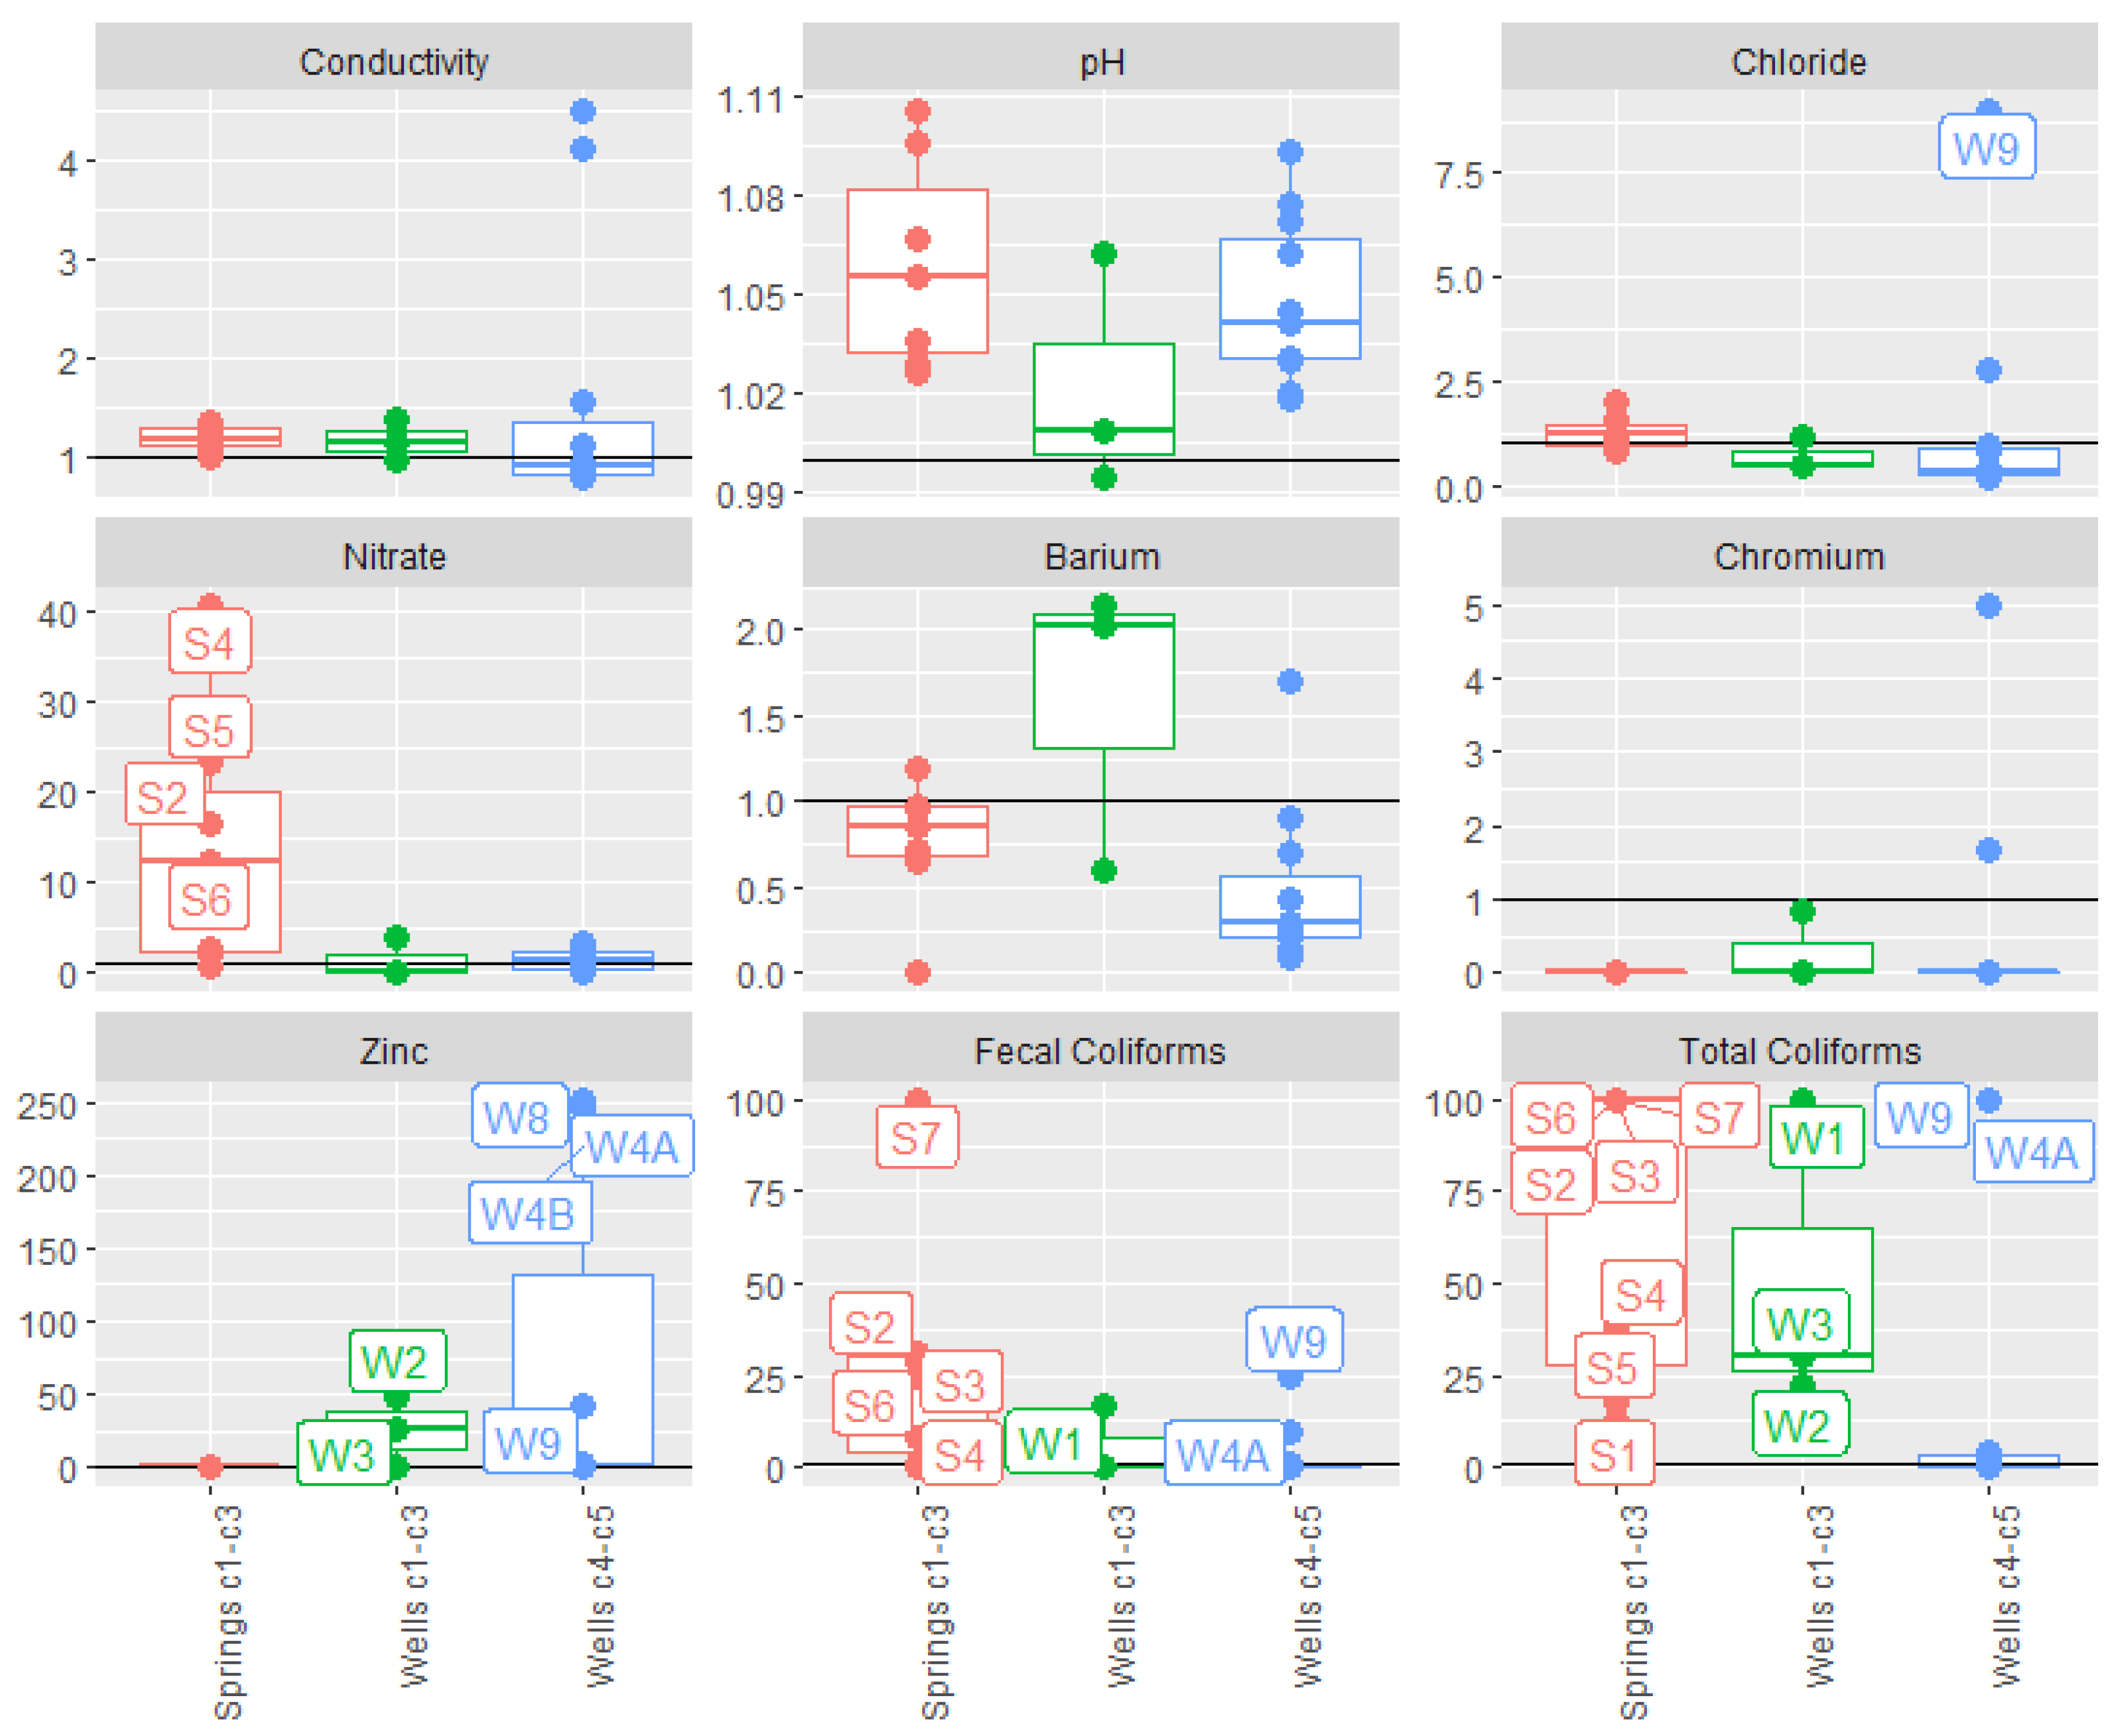
In order to evaluate the extent of the anthropogenic effects in the tested wells and springs, the results recorded in this work were compared with the natural background level (NBL) established by Khadra and Stuyfzand 2014 [33]. Figure 2 presents the water parameters results normalized by the natural background levels for mountain and coastal hydrosomes. The results for springs and wells in the C1-C3 basin were normalized by the natural background for the mountain hydrosome while results for C4-C5 wells were normalized by the coastal hydrosome background levels. Total and fecal coliforms were not included in the study of Khadra and Stuyfzand 2014 [33]; an arbitrary background value of 1 CFU (the limit of quantification) was assigned to those two parameters.
As shown in Figure 2, most results fall close to the background values (corresponding to 1 in the graph) except for zinc (in wells C1-C3 and wells C4-C5), fecal coliforms (in springs C1-C3), and total coliforms in all sampling areas. High values of nitrate in the C1-C3 springs were also observed. Nevertheless, the data does not show large deviations from the natural background values.

4.2. Possible Sources Of Contamination

Different studies in Lebanon suggest metals (Zn, Cd, Cr, and Pb) as possible marker indicators for solid waste contaminants in surface water bodies [27,50,51]. Additionally, elevated values of conductivity, chlorides, and sulfates are commonly used as indicators for leachate contamination in groundwater [52,53], while AOX are used by some authors as a proxy to evaluate the presence of persistent organic compounds. The results in the upper area (C1-C3 basin) did not flag any of these markers except the stream sample R1, sampled in the proximity of a local dumpsite, which showed high levels of manganese, oil and grease, and nitrate. At the same time, the presence of very high values of E. coli in the same sample (>10,000 CFU/250 mL) suggests a strong contribution of sewage. This interpretation was also confirmed by the local municipalities in the area at the time of the assessment. C1-C3 springs and wells results are also consistent with a hypothesis of prevailing sewage contamination rather than solid waste, as indicated by the presence of nitrate, phosphorous, and bacteriological indicators (e.g., [54]). It can be argued that fecal coliforms in water may not necessarily indicate the presence of feces and hence sewage infiltration [55]. Nevertheless, the fact that 7/8 samples that were positive for fecal coliforms were also positive for E. coli is an indication that sewage infiltration from septic tank or sewage lines is likely to be the major source of bacteriological contamination in the area. Another possible contribution to the contamination of the springs could be agricultural runoff (e.g., [56]), even though most of the springs sampled were located in the proximity of urban/peri urban areas (Figure 1). Agricultural runoff can be a second contribution of bacteriological contamination particularly in the sources located at lower hydrographic level from agricultural areas (W11, S7). For the coastal area (C4-C5 basin), relatively high values of conductivity, sulfates, and chlorides were recorded along with trace concentrations of organic compounds (phenols, TPHs, and trichloromethane). Zinc, at values higher than 100 ug/L, was measured in three wells (W4, W8, and W9). The high values of chlorides and sulfates may either be the result of saltwater intrusion, as indicated by different studies in the area [36,37], or leachate percolation in the groundwater [52,53].
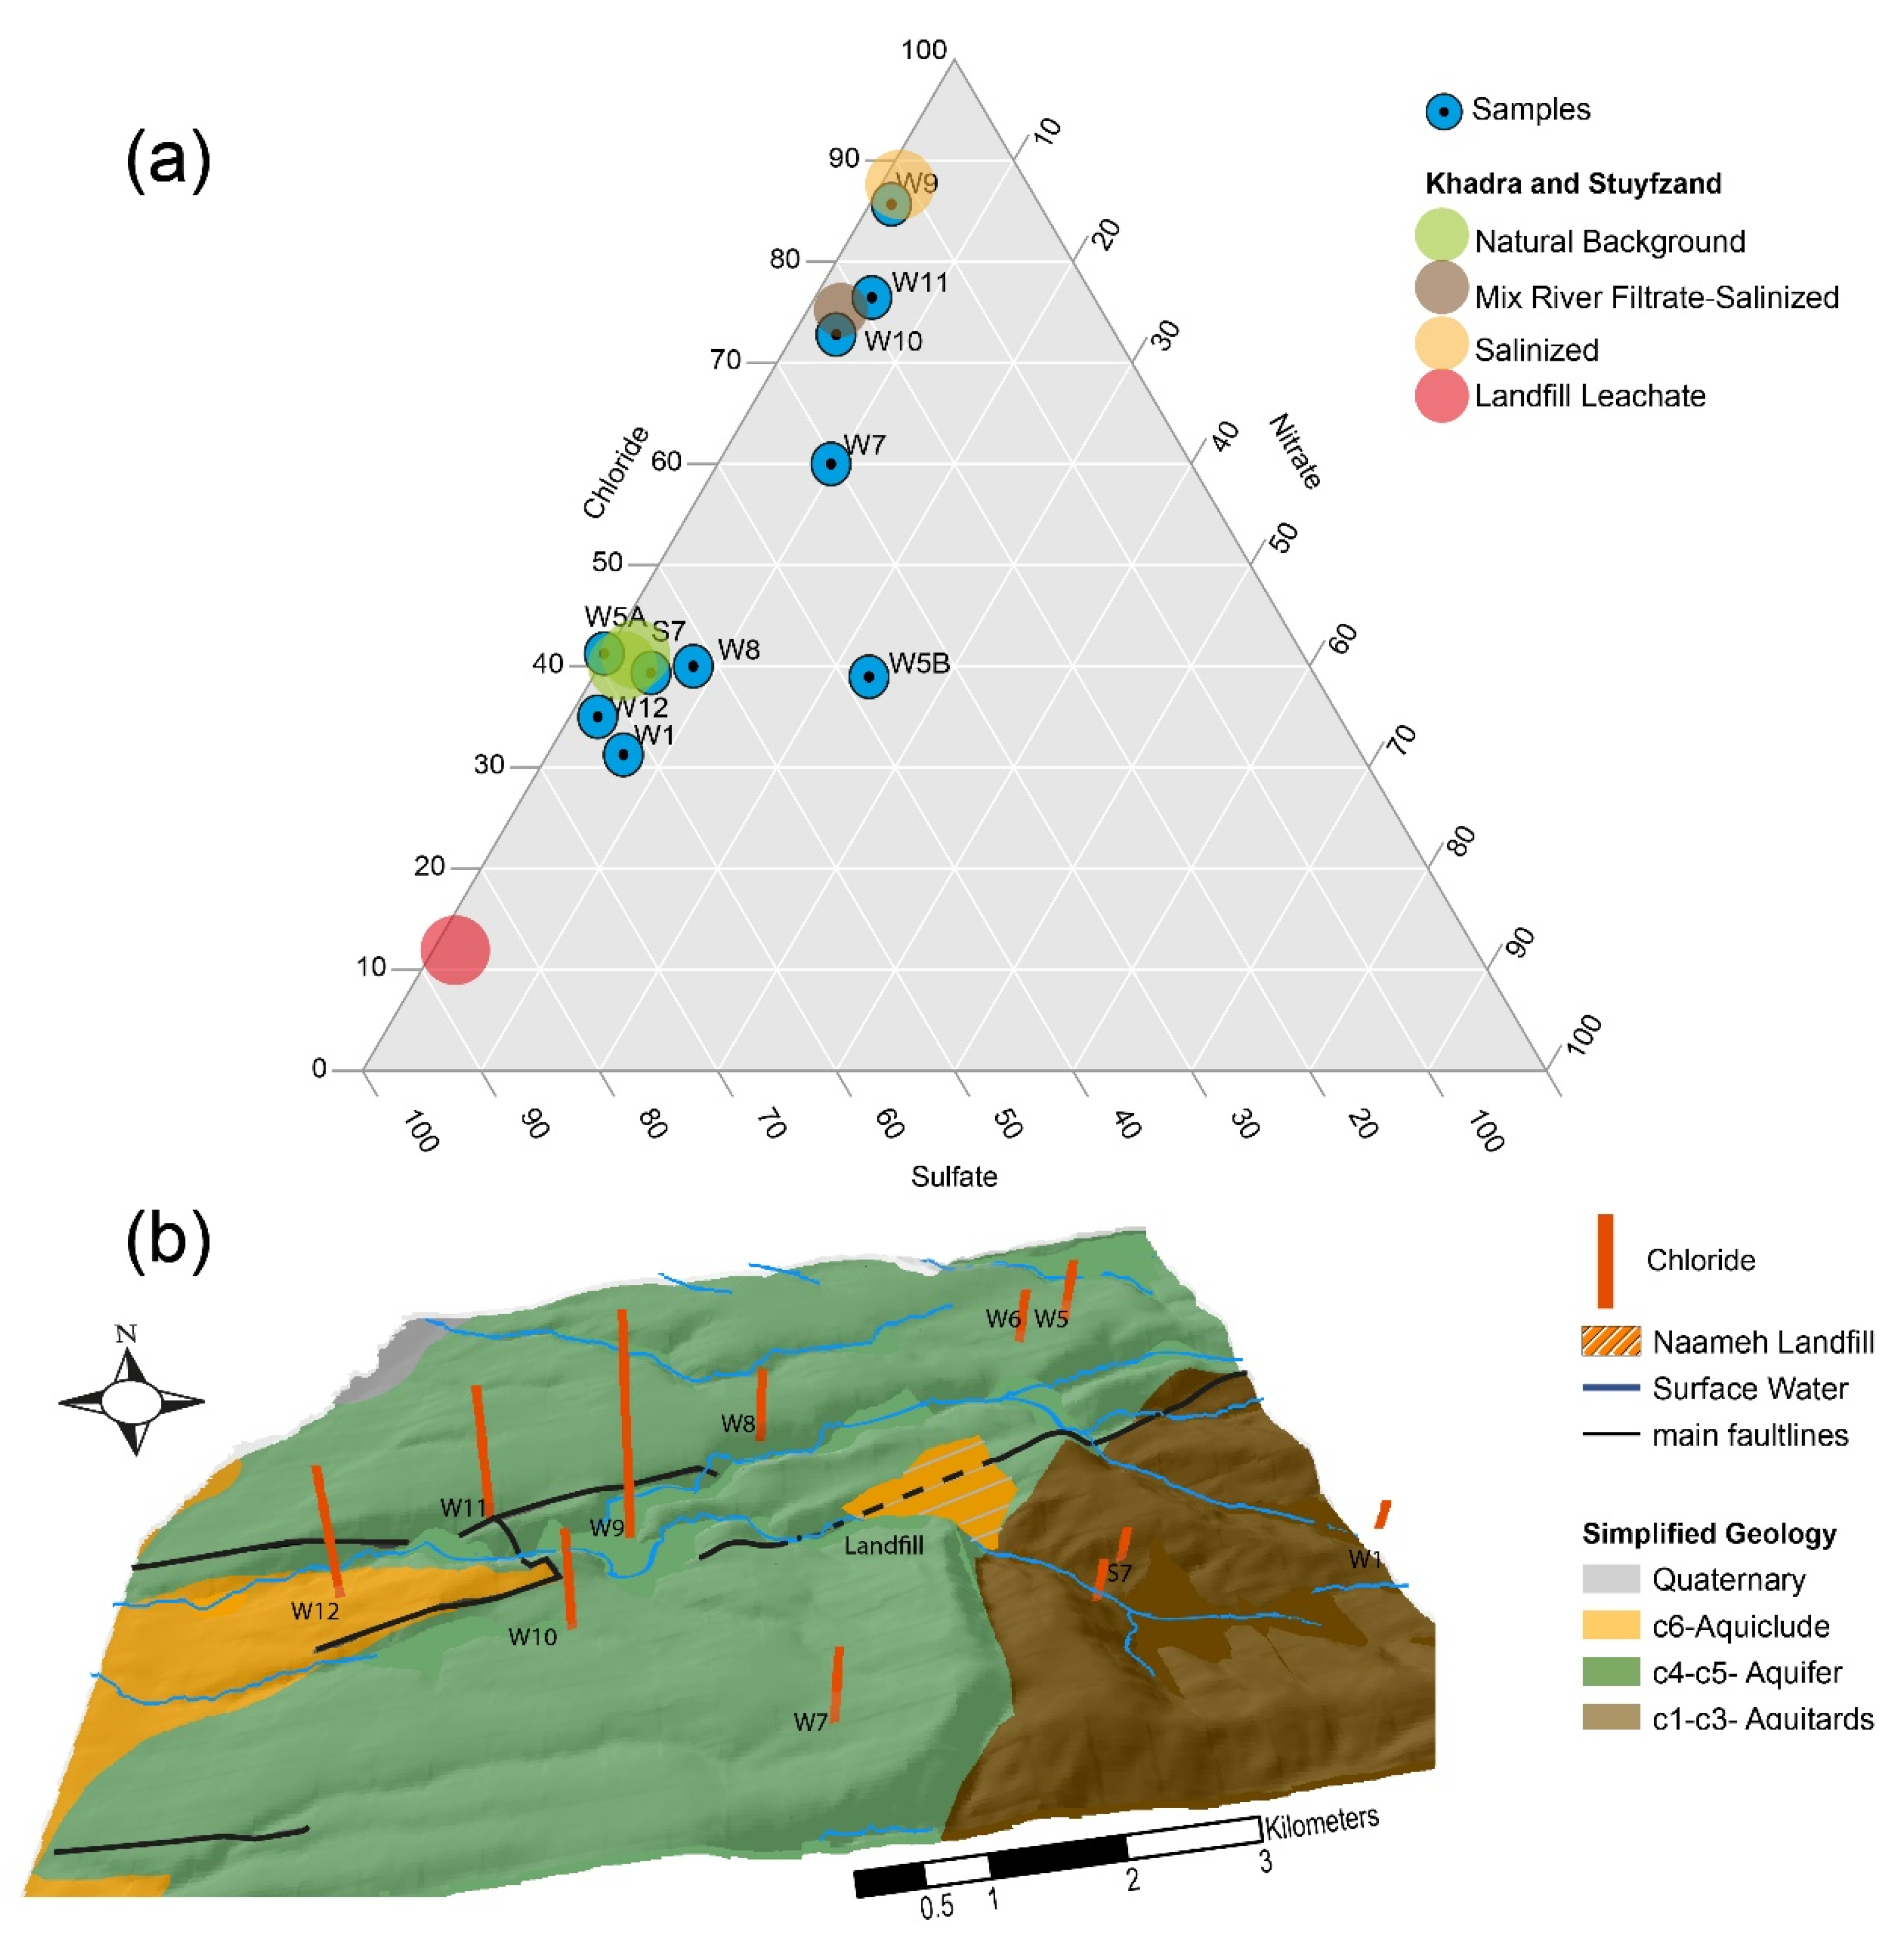
The result for the water sources in close proximity of the landfill were plotted in a ternary diagram for sulfates, nitrate, and chlorides (Figure 3a). Together with the samples collected in this research, the values of some relevant hydrogeochemical facies identified by Khadra and Stuyfzand [33] are displayed in this same diagram. The facies are (a) the natural background for mountain and coastal hydrosomes, (b) the salinized facies of the aquifer, (c) the sample suspected to be affected by landfill leachate. Nitrate levels range from 0% to 10% for all samples except W5B (23%). This suggests that agricultural runoff was probably not affecting the aquifer at the time of the assessment. A group of sources clusters around the natural background values. These sources are in the upper region of the aquifer with an exception of W12 which is located in the coastal plain. Four wells (W7, W9, W10, and W11) have a higher chloride sulfates ratio than the rest of the wells, ranging from 60% to 90% of chlorides. Furthermore, the well W9 falls exactly in the region of the hydrosomes affected by seawater intrusion [33]. Noteworthy, none of the samples is close to the landfill leachate region, characterized by a higher fraction of sulfates. However, it is necessary to have a larger sample of data and conduct further testing (analysis including the major cations and anions that were not part of this assessment) to come to a conclusive answer.
To further evaluate the possibility of a non-marine anomaly responsible for the chloride concentration found in the wells, a Cl/Br ratio was used (as illustrated by [57] Kelly et al. (2010)) for W9 and W11. Cl/Br ratio was employed in different studies to characterize the hydrogeochemical facies of groundwater bodies [57,58,59]. The ratios for the chloride concentration versus chloride boron ratio were plotted for W9 and W11 in Figure 4.
As can be seen in Figure 4, the W9 sample falls in the seawater classification, while the W11 sample falls in the basin brines and animal waste classification but is still very close to the seawater classification.
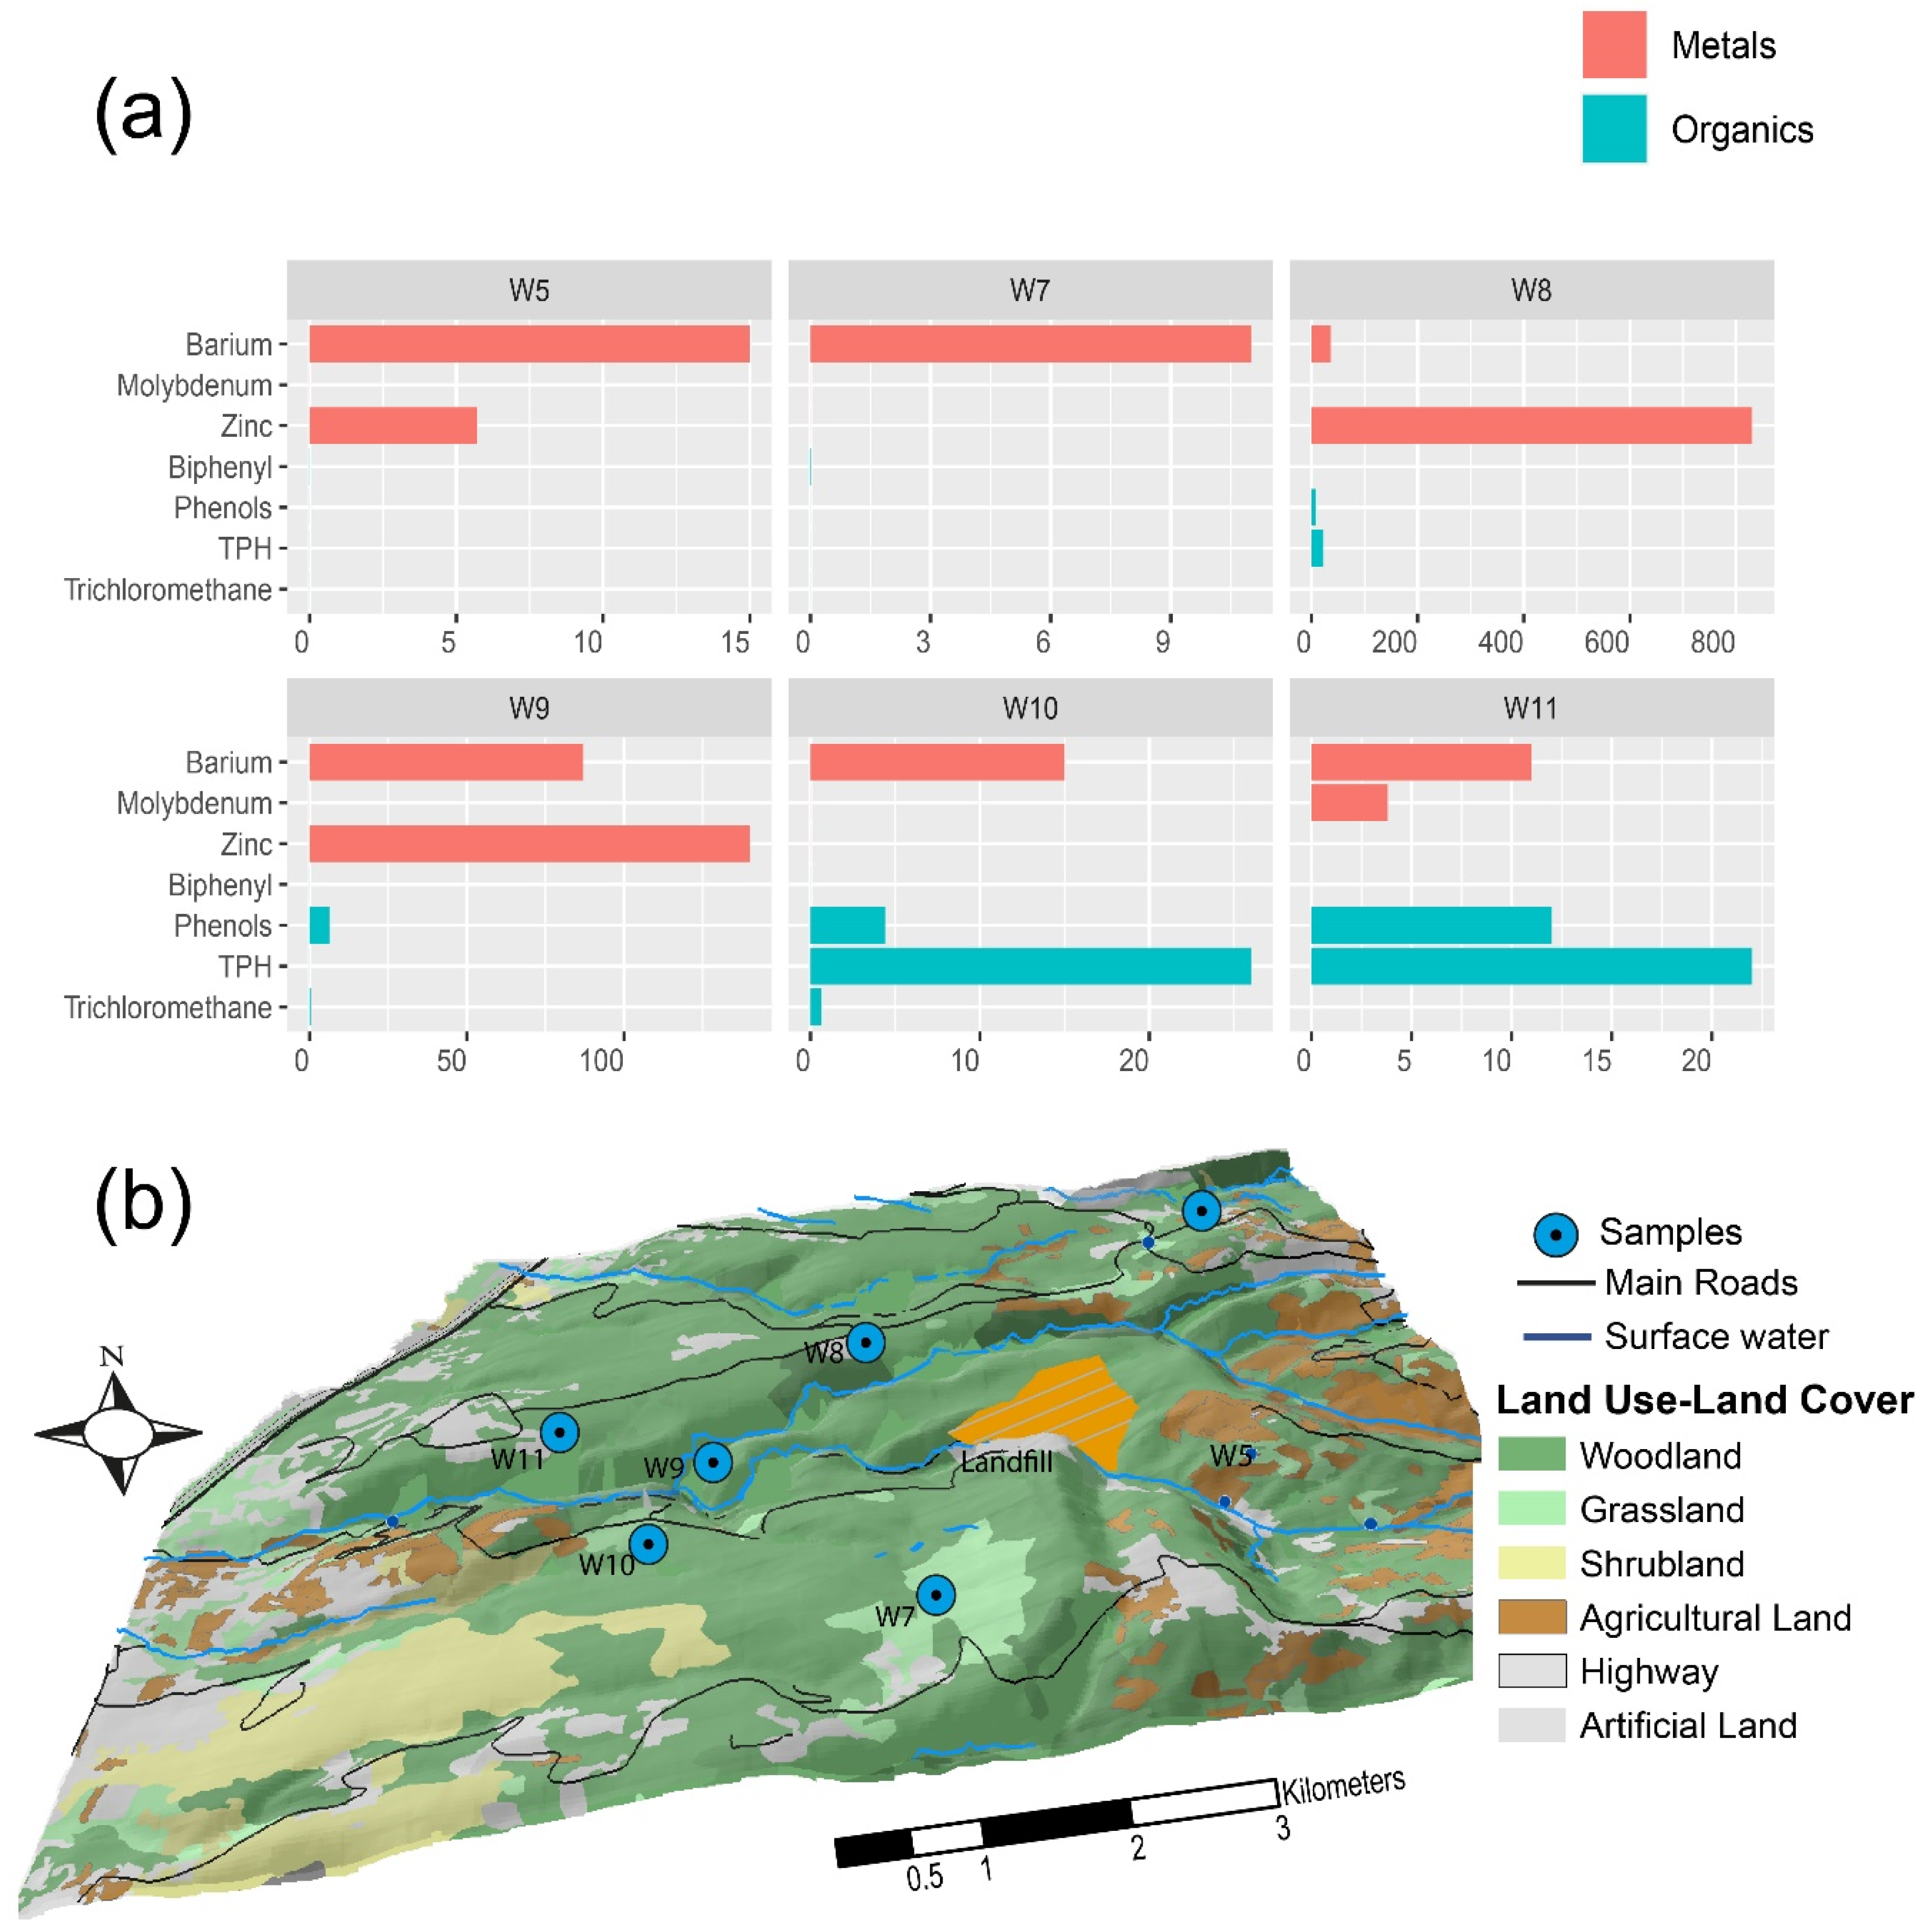
Figure 5a presents the results for the trace elements concentration (metals and organic compounds) in the C4-C5 aquifer. Zinc spikes in three wells downstream of the landfill. However, high values of zinc were also recorded in other wells upstream (W4A and W3). The zinc anomaly could be the result of corrosion of the casing of the sampled wells, some of which were older than 15 years (information from the Municipalities). Barium occurs at background levels. As for molybdenum, it is present in only one of the wells. Wells W8, W9, W10, and W11, all located downstream of the landfill, present trace concentrations of TPHs, phenols, and trichloromethane. Furthermore, TPH was found in association with phenol, suggesting a possible common origin. Studies suggest that trace concentrations of phenol can either be of natural origin or result from leachate infiltration in groundwater [52,60], as well as sewage infiltration and agricultural and industrial runoff [61,62]. Phenol was also detected in high concentrations in one sample upstream of the site (W4A 400 ug/L in November 2017), although the results were not confirmed in the second sample in the same well (W4B). Trichloromethane (chloroform) was detected in W9 and W10 at trace concentrations (0.39 and 0.66 ug/L respectively). Trichloromethane as well could be the result from the infiltration of landfill leachate as well as other sources, including industrial and agriculture runoff and sewage infiltration. In order to better understand possible interrelations between the detected trace elements and sources of contaminants in Figure 5b, the sources in the lower C4-C5 basin along with some of the land use-land cover for the area from CNRS, 2011 [63] are presented. The first observation is that W7, located in a prevalently woodland area, presents only barium. This observation rules out the natural sources for the origin of the phenol. On the other hand, the wells presenting phenol and TPH are in proximity with roads and seasonal streams. The combined presence of these trace elements might result from the mix between the seasonal stream, contaminated with sewage, and the local aquifer. This is in line with Figure 3, that shows that wells W10 and W11 have levels for chloride/sulfate ratios between the natural background and the sea water intrusion region of the plot.
Overall, considering the very low values detected and the limited size of the samples in space and time, the results do not clearly confirm the hypothesis of a contact between the landfill leachate of the Naameh landfill and the C4-C5 aquifer. At the same time, indication of wastewater infiltration in the lower area is suggested by the presence of E. coli in three out of five samples tested for bacteriology (Table S4: Results from water quality testing of wells in C4-C5 basin). It is highly likely that the contamination occurred through the subsurface infiltration from the seasonal streams, though contamination from other sources (leaks from the sewage lines along the road network and septic tanks) is not to be excluded.

4.3. Water Quality Index and Community Public Health

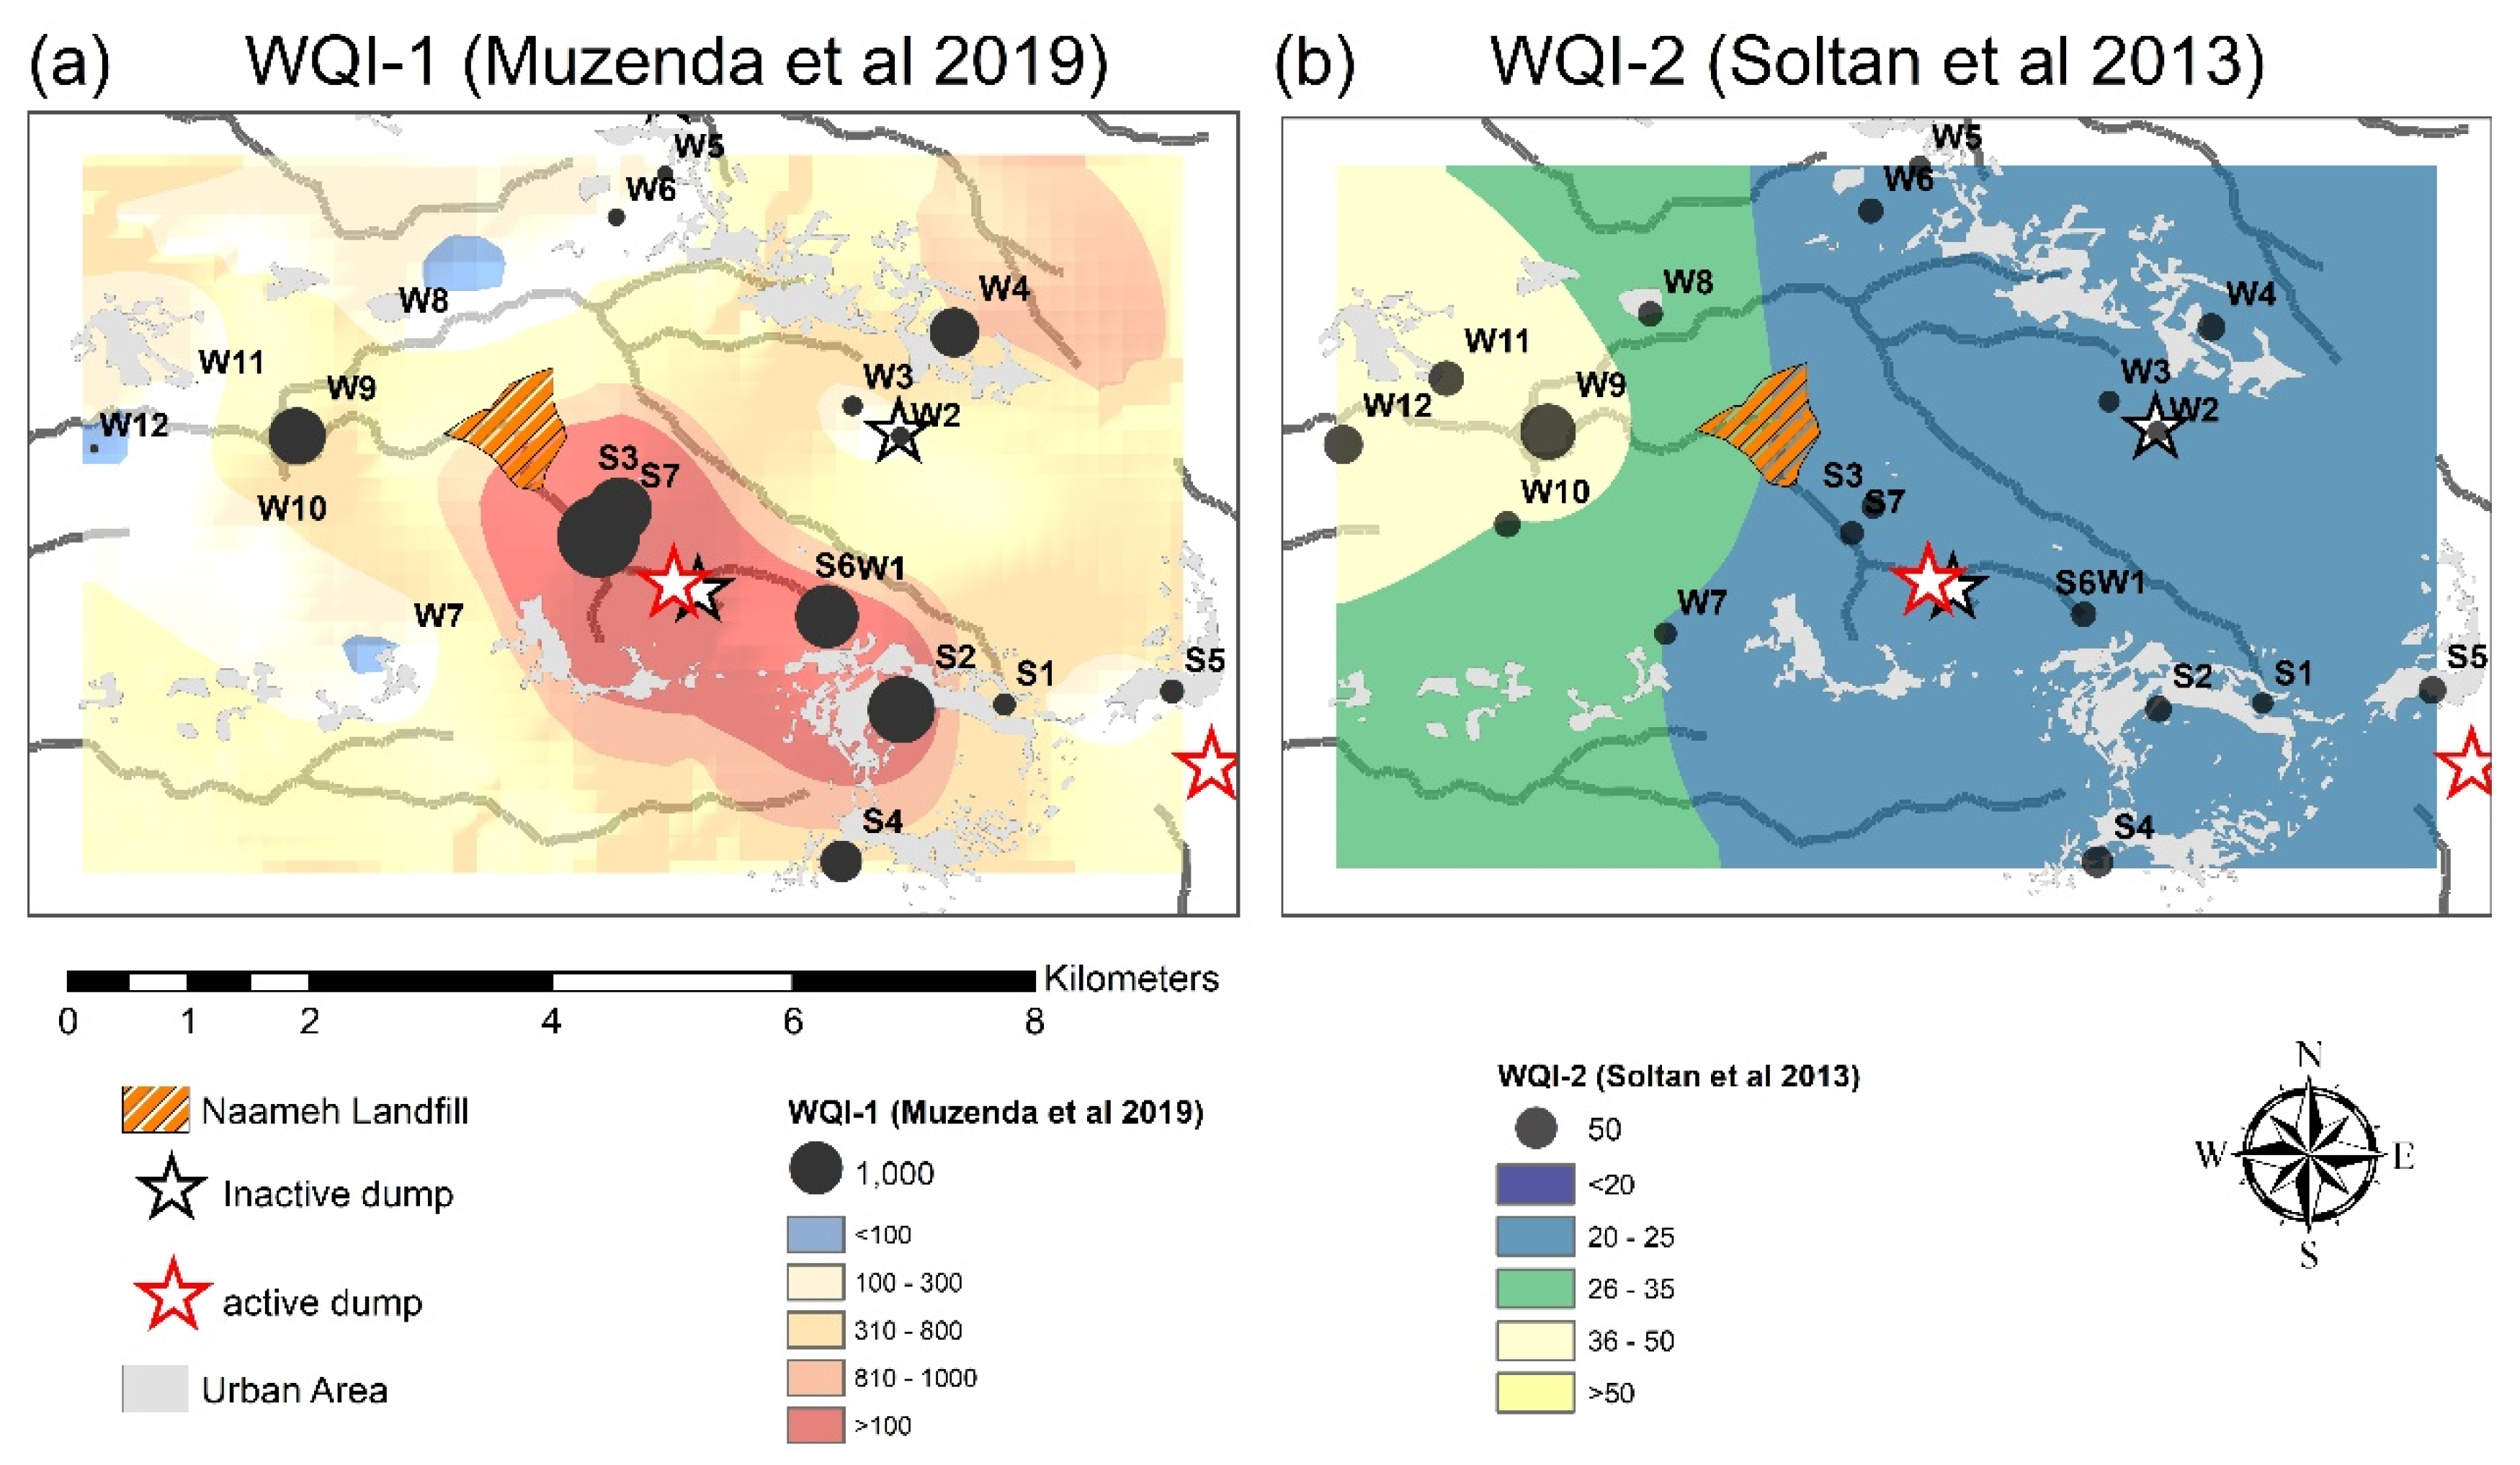
Concerning the water quality index analysis, WQI-1 reflects what was previously discussed in Section 4.1 and Section 4.2 as it indicates an extensive bacteriological contamination in the area, particularly in the upper C1-C3 basin, upstream of the Naameh landfill (Figure 6a). Nevertheless, WQI-2 (Figure 6b), which excludes the contribution of the bacteriological results, shows an overall good water quality across the region (WQI-2 < 100), with higher values in the coastal area (average 31, max 81). The higher WQI-2 values in the coastal region are the result of high values of chlorides, conductivity, and zinc observed in the C4-C5 wells. It can therefore be concluded that the physicochemical water quality in both the mountain range and the coastal area were, at the time of the observations, of an average good quality.
In parallel to this work, an observational epidemiological study was carried out in the area. Surveys were collected from 2720 citizens from the same six municipalities involved between November 2017 and January 2018. The participants were asked to self-report the frequency of occurrence of symptoms and diseases associated with solid waste malpractices (Table S8: Health Assessment Summary). The methodology to collect the health data was based on an air pollution model, described in [24]. The model simulated the exposure to NOx concentrations (used as representative of landfill gas emission) and the results were presented as percentages from the maximum modeled concentration at the Naameh landfill. In the exploratory analysis, a significative correlation between some of the symptoms and the landfill TAPM exposures were found (see supplementary information Table S8: Health assessment summary). The results reported in this work could provide a second possible explanation for part of the health ailments as some of the reported symptoms and diseases may have been caused by contact with water contaminated with wastewater (particularly skin rashes). As shown in Figure 7, Villages 1 and 2, served by different water sources with recorded bacteriological contamination (S1, S2, S6, W1), are also the ones with the highest exposure from the air pollution model. In other words, air pollutants from the landfill and water pollutants from wastewater may have contributed to the increase of skin rashes in the areas of Villages 1 and 2.
While this result is important, it should be stressed that tap water from the households was not tested and, therefore, the link with the health symptoms can only be inferred and should be taken as preliminary. Further research to understand and better define the correlation between waste disposal, water, and health shall be conducted to better unravel the causalities.
The findings on water quality from the C1-C3 and C4 basins provide an answer to the research questions raised by the local communities. While there is no major evidence of solid waste related contamination in the area, the presence of bacteriological contamination (total and fecal coliform) associated with E. coli indicates an intensive wastewater contamination.
Several objections may be raised on the process that led to the results reported in this work, amongst which are the following: (a) the sampling did not consider seasonal variation of water quality; degradation in the water quality is expected during the low flow season and (b) source appropriation for landfill leachate was not possible. While this study does not claim to carry out a complete model on contamination and transport in the groundwater resources in the study area, it provides an important snapshot of data for the status of water quality in one of the most important and controversial areas for water supply and solid waste disposal in Lebanon.

5. Conclusions

This study answers two questions raised by the six communities of the study area: (1) do the groundwater resources present evidence of solid waste contamination related to the Naameh landfill and to the local dumpsite in the area? (2) What are the other sources of contamination affecting the groundwater resources? From a broader perspective, the study assessed water quality degradation across different aquifers and sources, from a relatively small sample (18 sources, one sampling campaign). The analysis conducted included various physical, chemical, and microbiological parameters and sources of different levels of importance for the community (drinking, public water supply, and water trucking). Seven springs and three wells in the C1-C3 basin and 11 wells in the C4-C5 basin were tested for general chemical physical parameters (conductivity, chlorides, sulfates, nitrate, etc.), microbiology (total and fecal coliforms), metals (nickel, lead, arsenic, zinc, copper, etc.). The wells located in the aquifer underlying the landfill were tested for a large spectrum of organic compounds. For the C1-C3 basin, the result indicated a significant bacteriological contamination, along with relatively high values of nitrate and phosphates in local springs. The results for the C4-C5 aquifer showed higher levels of conductivity, chlorides, and zinc along with the occurrence of organic micropollutants in trace concentrations. The water quality index analysis revealed that, considering the bacteriological indicators, both aquifers have extremely deteriorated water quality (WQI > 100). When looking at the different sources, the springs recorded the poorest water quality (WQI > 1000 for several springs). On the other hand, WQI-2 that do not consider microbiology showed a generally good water quality, slightly deteriorating in the coastal wells downstream of the Naameh landfill.
In conclusion, we can state that at the time of the analysis, the hypothesis of a solid waste diffuse contamination to the groundwater sources in the area is not fully supported by the data. However, the presence of organic compounds at low concentration and the presence of zinc in some of the wells may be an indicator of contamination by leachates. On the other hand, a major bacteriological contamination, resulting from release of untreated wastewater in septic tank and surface water bodies, is a major source of pollution of the upper C1-C3 basin, where most of the municipalities are located. While the limited number of observations both in space distribution and time (limited to a high flow period between November and March) represent a limit to this research, the data presented in this work has provided an improved insight of the current status of the water quality in the study area. The findings can be used to formulate two recommendations. The first one consists of improvements in the wastewater management in the upper municipality, essential to decrease the release of untreated wastewater (a recommendation which has been partly taken into consideration from the local authorities, as the municipality in the area will be connected to the main sewer network linked to Al Ghadir treatment plant south of Beirut). The second one includes the continuous monitoring of the Naameh landfill and, specifically, the establishment of a monitoring network of selected wells to be regularly tested. Finally, the following set of recommendations could be provided for research groups conducting similar assessments. First, it is extremely important to engage the communities involved at all the stages of the project [65]. Second, results from the water quality indices depend on the parameters chosen. In this case, a major role has been played by bacteriological indicators; hence the importance of selecting the most appropriate water quality index according to the target contaminants in order not to disseminate confusing results. Third, new studies could build on the results provided in this manuscript and its supplementary material to enhance the resolution (spatial or temporal) of the observations.

Supplementary Materials

The following are available online at https://www.mdpi.com/2073-4441/12/5/1358/s1, Table S1: List of standards and methods for water testing, Table S2: Results from water quality testing of springs in C1-C3 basin, Table S3: Results from water quality testing of wells in C1-C3 basin, Table S4: Results from water quality testing of wells in C4-C5 basin, Table S5: Wi and K values for WQI-1, Table S6: Result from WQI-1 Analysis, Table S7: Result from WQI-2 Analysis, Table S8: Health assessment summary.

Author Contributions

Conceptualization, M.C., S.C., N.A.S., M.A.N. and M.A.-H.; methodology, N.A.S., M.A.N., M.C. and M.A.-H.; validation, M.A.N., H.T., S.Z., M.M. and M.K.; original draft preparation, S.C., M.C. and M.A.-H.; writing—review and editing, M.C., S.C., N.A.S., M.A.N., G.C., H.T., S.Z. , M.M., I.L., A.E.S., M.K. and M.A.-H.; visualization, M.C., A.E.S. and I.L.; project administration, G.C. and N.S.; funding acquisition, N.S., M.A.-H., M.A.N. and S.K. All authors have read and agreed to the published version of the manuscript.

Funding

This work was supported by a grant from the United States Agency for International Development (USAID) under grant number 605100.06.RFA2.005. The content is the sole responsibility of the authors and does not necessarily reflect the official views of USAID or the United States government.

Acknowledgments

We thank the local communities and local authorities of the six villages involved in the project for their continual cooperation, and we acknowledge their efforts to step out from the current waste crisis affecting Lebanon. A special thanks to Mounir Mokhtar, a geologist and one of the village members for helping out in mapping the local water sources.

Conflicts of Interest

The authors declare no conflict of interest. The funders had no role in the design of the study; in the collection, analyses, or interpretation of data; in the writing of the manuscript, or in the decision to publish the results.

Appendix A

WQI-1
Following [46] Muzenda et al. (2019), the WQI-1 is defined by the following equation:
WQI = antilog 10 i n w i   log 10 q i
where wi is the weight of the ith parameter, qi is the quality ranking of the ith parameter. Equations (2) and (3) define wi, while Equation (A4) defines qi:
w i = k v i
where vi is the maximum allowed value for the ith parameter, in our case according to [44] Lebanese Ministry of Health standard for drinking water, while k is a constant defined as follows:
k = 1 i n 1 v i
Finally, qi is defined as per Equation (A4)
q i = 100 × v a v s v i v s
where va is the water quality result, vs is the ideal water quality result (7 for pH and 0 for all other parameters)
WQI-2
Following [37} Soltan et al. (2013), the average water quality index i.e., WQI-2 is calculated by the following Equation (A5):
W Q I 2 = i = 1 n q i n
where qi is the quality rating for the ith parameter, defined as below (Equation (A6)):
q i = 100 × V i S i
where vi is the water quality result of the ith parameter and si is the water quality standard from Ministry of Health (1999) [44].

References

  1. Dietz, T.; Ostrom, E.; Stern, P.C. The struggle to govern the commons. Science 2003, 302, 1907–1912. [Google Scholar] [CrossRef] [PubMed] [Green Version]
  2. Resolution, A. RES/64/292. The human right to water and sanitation. In Proceedings of the Sixty-Fourth United Nations General Assembly, New York, NY, USA, 15 September 2009–14 September 2010. [Google Scholar]
  3. World Health Organization. Unicef, Progress on Drinking Water, Sanitation and Hygiene: 2017 Update and SDG Baselines; WHO: Geneva, Switzerland, 2017; pp. 9–10. [Google Scholar]
  4. Massoud, M.A.; Mokbel, M.; Alawieh, S. Reframing environmental problems: Lessons from the solid waste crisis in Lebanon. J. Mater. Cycles Waste Manag. 2019, 21, 1311–1320. [Google Scholar] [CrossRef]
  5. Leenders, R. Spoils of Truce: Corruption and State-Building in Postwar Lebanon; Cornell University Press: Ithaca, NY, USA, 2012. [Google Scholar]
  6. Khalaf, S. Lebanon Adrift: From Battleground to Playground; Saqi: 2012. Available online: https://books.google.com.lb/books?hl=en&lr=&id=EzwhBQAAQBAJ&oi=fnd&pg=PT3&dq=6.%09Khalaf,+S.+Lebanon+Adrift:+From+Battleground+to+Playground%3B+Saqi:+&ots=PM6JXi0M37&sig=pK7V-XL8pAdHYdgEZJ0Y-WtwGXQ&redir_esc=y#v=onepage&q=6.%09Khalaf%2C%20S.%20Lebanon%20Adrift%3A%20From%20Battleground%20to%20Playground%3B%20Saqi%3A&f=false (accessed on 20 April 2020).
  7. El Mufti, K. Official response to the Syrian refugee crisis in Lebanon, the disastrous policy of no-policy. Beirut: Civ. Soc. Knowl. Cent., Leban. Support 2014. [Google Scholar] [CrossRef]
  8. Bizri, A.R.; Fares, J.; Musharrafieh, U. Infectious diseases in the era of refugees: Hepatitis A outbreak in Lebanon. Avicenna J. Med. 2018, 8, 147. [Google Scholar] [CrossRef] [PubMed]
  9. Khalil, C.; Al Hageh, C.; Korfali, S.; Khnayzer, R.S. Municipal leachates health risks: Chemical and cytotoxicity assessment from regulated and unregulated municipal dumpsites in Lebanon. Chemosphere 2018, 208, 1–13. [Google Scholar] [CrossRef]
  10. Abbas, I.I.; Chaaban, J.K.; Al-Rabaa, A.-R.; Shaar, A.A. Solid Waste Management in Lebanon: Challenges and Recommendations. J. Environ. Waste Manag. 2017, 4, 53–63. [Google Scholar]
  11. Khawaja, B. ‘‘As If You're Inhaling Your Death": The Health Risks of Burning Waste in Lebanon; Human Rights Watch: New York, NY, USA, 2017. [Google Scholar]
  12. Massoud, M.; El-Fadel, M.; Scrimshaw, M.; Lester, J. Land Use Impact on the Spatial and Seasonal Variation of the Contaminant Loads to Abou Ali River and Its Coastal Zone in North Lebanon; Cornell University Library: Ithaca, NY, USA, 2004. [Google Scholar]
  13. Linzalone, N.; Bianchi, F. Studying risks of waste landfill sites on human health: Updates and perspectives. Epidemiol. Prev. 2005, 29, 51–53. [Google Scholar]
  14. Baalbaki, R.; Ahmad, S.H.; Kays, W.; Talhouk, S.N.; Saliba, N.A.; Al-Hindi, M. Citizen science in Lebanon—A case study for groundwater quality monitoring. R. Soc. Open Sci. 2019, 6, 181871. [Google Scholar] [CrossRef] [Green Version]
  15. Baalbaki, R.; El Hage, R.; Nassar, J.; Gerard, J.; Saliba, N.B.; Zaarour, R.; Saliba, N. Exposure to atmospheric PMs, PAHs, PCDD/Fs and metals near an open air waste burning site in Beirut. Leban. Sci. J. 2016, 17, 91–103. [Google Scholar]
  16. Karnib, A. Assessing population coverage of safely managed wastewater systems: A case study of Lebanon. J. Water Sanit. Hyg. Dev. 2016, 6, 313–319. [Google Scholar] [CrossRef]
  17. Doummar, J.; Aoun, M. Occurrence of selected domestic and hospital emerging micropollutants on a rural surface water basin linked to a groundwater karst catchment. Environ. Earth Sci. 2018, 77, 351. [Google Scholar] [CrossRef]
  18. Apollaro, C.; Fuoco, I.; Brozzo, G.; De Rosa, R. Release and fate of Cr (VI) in the ophiolitic aquifers of Italy: The role of Fe (III) as a potential oxidant of Cr (III) supported by reaction path modelling. Sci. Total Environ. 2019, 660, 1459–1471. [Google Scholar] [CrossRef] [PubMed]
  19. Critelli, T.; Vespasiano, G.; Apollaro, C.; Muto, F.; Marini, L.; De Rosa, R. Hydrogeochemical study of an ophiolitic aquifer: A case study of Lago (Southern Italy, Calabria). Environ. Earth Sci. 2015, 74, 533–543. [Google Scholar] [CrossRef]
  20. Singh, K.; Walter, T.; Whitmore, M. Hydrogeochemical changes and watershed degradation induced by hemlock loss in northeastern riparian forests. Work. Watersheds Coast. Syst. Res. Manag. 2019, 56. [Google Scholar]
  21. Thomas, L. Karst Hydrogeology, Hydrogeochemistry and Processes of Tufa Deposition in Carboniferous Limestone Springs of the Mells Valley, Somerset; Bath Spa University: Somerset, UK, 2007. [Google Scholar]
  22. Mauser, W.; Klepper, G.; Rice, M.; Schmalzbauer, B.S.; Hackmann, H.; Leemans, R.; Moore, H. Transdisciplinary global change research: The co-creation of knowledge for sustainability. Curr. Opin. Environ. Sustain. 2013, 5, 420–431. [Google Scholar] [CrossRef] [Green Version]
  23. Clark, W.C.; Van Kerkhoff, L.; Lebel, L.; Gallopin, G.C. Crafting usable knowledge for sustainable development. Proc. Natl. Acad. Sci. USA 2016, 113, 4570–4578. [Google Scholar] [CrossRef] [Green Version]
  24. Chammas, G.; Kayed, S.; Shami, A.A.; Kays, W.; Citton, M.; Kalot, M.; Marj, A.E.; Fakhr, M.; Yehya, N.A.; Talhouk, S.N. Transdisciplinary interventions for environmental sustainability. Waste Manag. 2020, 107, 159–171. [Google Scholar] [CrossRef]
  25. Massoud, M.A.; Al-Abady, A.; Jurdi, M.; Nuwayhid, I. The challenges of sustainable access to safe drinking water in rural areas of developing countries: Case of Zawtar El-Charkieh, Southern Lebanon. J. Environ. Health 2010, 72, 24–30. [Google Scholar]
  26. Khair, K.; Aker, N.; Haddad, F.; Jurdi, M.; Hachach, A. The environmental impacts of humans on groundwater in Lebanon. Water Air Soil Pollut. 1994, 78, 37–49. [Google Scholar] [CrossRef]
  27. Korfali, S.I.; Davies, B.E. Seasonal variations of trace metal chemical forms in bed sediments of a karstic river in Lebanon: Implications for self-purification. Environ. Geochem. Health 2005, 27, 385–395. [Google Scholar] [CrossRef]
  28. Jütting, J.; Mc Donnell, I. Mc Donnell I.a; Development Co-operation Report 2017, Overview: What will it take for data to enable development? 2017. Available online: https://www.oecd-ilibrary.org/development/development-co-operation-report-2017/overview-what-will-it-take-for-data-to-enable-development_dcr-2017-6-en;jsessionid=BPDJ3wKaPVQvwIOdKQYYuZyW.ip-10-240-5-164 (accessed on 20 April 2020).
  29. Bou-Zeid, E.; El-Fadel, M. Climate change and water resources in Lebanon and the Middle East. J. Water Resour. Plan. Manag. 2002, 128, 343–355. [Google Scholar] [CrossRef] [Green Version]
  30. Arkadan, A.-R.M. Climatic changes in lebanon, predicting uncertain precipitation events—Do climatic cycles exist. In Climatic Changes and Water Resources in the Middle East and North Africa; Springer: Berlin, Germany, 2008; pp. 59–74. [Google Scholar]
  31. Beydoun, Z.R. The Levantine countries: The geology of Syria and Lebanon (maritime regions). In the Ocean Basins and Margins; Springer: Berlin, Germany, 1977; pp. 319–353. [Google Scholar]
  32. Kayal, D.B.J.; Issam, K.; Farid, B.; Eric, T.; Levent, E.; Mehmet, M.; Fadi, N.; Wajdi, G.; Rachad, B.; David, A.; et al. Assessment of the Groundwater Resources of Lebanon; UNDP- Lebanon Ministry of Energy and Water: Beirut, Lebanon, 2014; Available online: https://www.lb.undp.org/content/lebanon/en/home/library/environment_energy/assessment-of-groundwater-resources-of-lebanon.html (accessed on 20 April 2020).
  33. Khadra, W.M.; Stuyfzand, P.J. Separating baseline conditions from anthropogenic impacts: Example of the Damour coastal aquifer (Lebanon). Hydrol. Sci. J. 2014, 59, 1872–1893. [Google Scholar] [CrossRef]
  34. Khadra, W.M. Hydrogeology of the Damour Upper Sannine-Maameltain aquifer-by Wisam Mahmoud Khadra; Master Thesis, American University of Beirut: Beirut, Lebanon, 2003. [Google Scholar]
  35. Awad, H.M. Geomorphology, stratigraphy and hydrogeology of the Doha-Damour area and hinterland. Master Thesis, American University of Beirut, Beirut, Lebanon, 1983. [Google Scholar]
  36. Khadra, W.M.; Stuyfzand, P.J.; van Breukelen, B.M. Hydrochemical effects of saltwater intrusion in a limestone and dolomitic limestone aquifer in Lebanon. Appl. Geochem. 2017, 79, 36–51. [Google Scholar] [CrossRef]
  37. Masciopinto, C. Management of aquifer recharge in Lebanon by removing seawater intrusion from coastal aquifers. J. Environ. Manag. 2013, 130, 306–312. [Google Scholar] [CrossRef]
  38. Stuyfzand, P.J. Hydrochemistry and Hydrology of the Coastal Dune Area of the Western Netherlands. Ph.D. Thesis, Vrije Universiteit Amsterdam, Amsterdam, The Netherlands, 25 May 1993. [Google Scholar]
  39. Ejlertsson, J.; Karlsson, A.; Lagerkvist, A.; Hjertberg, T.; Svensson, B.H. Effects of co-disposal of wastes containing organic pollutants with municipal solid waste—a landfill simulation reactor study. Adv. Environ. Res. 2003, 7, 949–960. [Google Scholar] [CrossRef]
  40. Durmusoglu, E.; Taspinar, F.; Karademir, A. Health risk assessment of BTEX emissions in the landfill environment. J. Hazard. Mater. 2010, 176, 870–877. [Google Scholar] [CrossRef]
  41. Grimvall, A.; Asplund, G.; Borén, H.; Jonsson, S. Origin of adsorbable organic halogens (AOX) in aquatic environments. In Organic Micropollutants in the Aquatic Environment; Springer: Berlin, Germany, 1991; pp. 458–464. [Google Scholar]
  42. Shomar, B. Sources of adsorbable organic halogens (AOX) in sludge of Gaza. Chemosphere 2007, 69, 1130–1135. [Google Scholar] [CrossRef]
  43. Müller, G. Sense or no-sense of the sum parameter for water soluble “adsorbable organic halogens”(AOX) and “absorbed organic halogens”(AOX-S18) for the assessment of organohalogens in sludges and sediments. Chemosphere 2003, 52, 371–379. [Google Scholar] [CrossRef]
  44. Lebanese Ministry of Health (MOH). Water Decree 1039, Standard 161:1999 (Drinking Water) & 162:1999 (Bottled Water); Official Gazette: Beirut, Lebanon, 1999; Available online: https://www.informea.org/en/legislation/decree-no-1039-adopting-standardizations-no-1611999-potable-water-and-no-1621999 (accessed on 28 April 2020).
  45. Edition, T. Guidelines for drinking-water quality. WHO Chron. 2008, 1, 334–415. [Google Scholar]
  46. Muzenda, F.; Masocha, M.; Misi, S.N. Groundwater quality assessment using a water quality index and GIS: A case of Ushewokunze Settlement, Harare, Zimbabwe. Phys. Chem. Earth Parts A/B/C 2019, 112, 134–140. [Google Scholar] [CrossRef]
  47. Soltan, M. Evaluation of ground water quality in dakhla oasis (Egyptian Western Desert). Environ. Monit. Assess. 1999, 57, 157–168. [Google Scholar] [CrossRef]
  48. Kopp, S. Using ArcGIS Spatial Analyst: GIS by ESRI; Environmental Systems Research Institute: Redlands, CA, USA, 2002. [Google Scholar]
  49. Wickham, H. ggplot2. Wiley Interdiscip. Rev. Comput. Stat. 2011, 3, 180–185. [Google Scholar] [CrossRef]
  50. Halwani, D.A.; Jurdi, M.; Salem, F.K.A.; Jaffa, M.A.; Amacha, N.; Habib, R.R.; Dhaini, H.R. Cadmium health risk assessment and anthropogenic sources of pollution in mount-lebanon springs. Expo. Health 2019. [Google Scholar] [CrossRef]
  51. Daou, C.; Salloum, M.; Legube, B.; Kassouf, A.; Ouaini, N. Characterization of spatial and temporal patterns in surface water quality: A case study of four major Lebanese rivers. Environ. Monit. Assess. 2018, 190, 485. [Google Scholar] [CrossRef] [PubMed]
  52. Christensen, T.H.; Kjeldsen, P.; Bjerg, P.L.; Jensen, D.L.; Christensen, J.B.; Baun, A.; Albrechtsen, H.-J.; Heron, G. Biogeochemistry of landfill leachate plumes. Appl. Geochem. 2001, 16, 659–718. [Google Scholar] [CrossRef]
  53. Lehmann, E.C. Landfill Research Focus; Nova Publishers: Hauppauge, NY, USA, 2007. [Google Scholar]
  54. Arnade, L.J. Seasonal correlation of well contamination and septic tank distance. Groundwater 1999, 37, 920–923. [Google Scholar] [CrossRef]
  55. Doyle, M.P.; Erickson, M.C. Closing the door on the fecal coliform assay. Microbe 2006, 1, 162–163. [Google Scholar] [CrossRef] [Green Version]
  56. Böhlke, J.-K. Groundwater recharge and agricultural contamination. Hydrogeol. J. 2002, 10, 153–179. [Google Scholar] [CrossRef]
  57. Kelly, W.R.; Panno, S.V.; Hackley, K.C.; Hwang, H.-H.; Martinsek, A.T.; Markus, M. Using chloride and other ions to trace sewage and road salt in the Illinois Waterway. Appl. Geochem. 2010, 25, 661–673. [Google Scholar] [CrossRef]
  58. Alcalá, F.J.; Custodio, E. Use of the Cl/Br ratio as tracer to identifity the origin of salinity in some Spanish coastal aquifers. In Proceedings of the 18th SWIM, Cartagena, Spain, 31 May–3 June 2004. [Google Scholar]
  59. Cartwright, I.; Weaver, T.R.; Fifield, L.K. Cl/Br ratios and environmental isotopes as indicators of recharge variability and groundwater flow: An example from the southeast Murray Basin, Australia. Chem. Geol. 2006, 231, 38–56. [Google Scholar] [CrossRef]
  60. Kurata, Y.; Ono, Y.; Ono, Y. Occurrence of phenols in leachates from municipal solid waste landfill sites in Japan. J. Mater. Cycles Waste Manag. 2008, 10, 144–152. [Google Scholar] [CrossRef]
  61. Anku, W.W.; Mamo, M.A.; Govender, P.P. Phenolic compounds in water: Sources, reactivity, toxicity and treatment methods. Phenolic Compd. Nat. Sour. Importance Appl. 2017, 420–443. [Google Scholar] [CrossRef] [Green Version]
  62. Soto-Hernández, M.; Tenango, M.P.; García-Mateos, R. Phenolic Compounds: Natural Sources, Importance and Applications; BoD–Books on Demand: Norderstedt, Germany, 2017. [Google Scholar]
  63. Faour, G. Topology of landuse at 1:20,000 Scale. In CNRS, N.C. f. R. S., Beirut, Lebanon, Ed. 2011. Available online: https://www.researchgate.net/publication/267625027_La_carte_de_l’occupation_du_sol_de_Liban/stats (accessed on 28 April 2020).
  64. Hurley, P.J.; Physick, W.L.; Luhar, A.K. TAPM: A practical approach to prognostic meteorological and air pollution modelling. Environ. Model. Softw. 2005, 20, 737–752. [Google Scholar] [CrossRef]
  65. Zurawsky, M.A.; Robertson, W.D.; Ptacek, C.J.; Schiff, S.L. Geochemical stability of phosphorus solids below septic system infiltration beds. J. Contam. Hydrol. 2004, 73, 129–143. [Google Scholar] [CrossRef] [PubMed]
Figure 1. Geological map and profile sketch of the study area, location of water sources, and solid waste hazards. Geology data from [31] Centre National de la Recherche Scientifique (CNRS) and hydrogeology from [32] United Nations Development Program – Ministry of Energy and Water (UNDP-MOEW, 2014) and [33] Khadra 2014.
Water 12 01358 g001
Figure 2. Results for the different hydrogeologic settings normalized by the natural background level (NBL) established by Khadra and Stuyfzand (2014) [33]. The y-axis therefore represents the number of folds that the results are higher or lower than the NBL.
Water 12 01358 g002
Figure 3. (a) Ternary plot for chlorides, sulfates, and nitrate for the sources surrounding the Naameh landfill, and comparison with some of the hydrogeochemical facies suggested by Khadra and Stuyfzand [33]. (b) Geology and sampling location.
Water 12 01358 g003
Figure 4. Diagram adopted from Kelly et al. (2010) [57], identifying sources for chloride/bromide ratio.fields vs. chloride concentration. Samples W11 and W9 fall between seawater and the basin brines.
Water 12 01358 g004
Figure 5. (a) Trace elements concentration in the wells of the C4-C5 aquifer around the Naameh landfill. Units are in ug/L. (b) Land use-land cover map of the area downstream of the Naameh landfill and sampling locations [63].
Water 12 01358 g005
Figure 6. Water quality indices (WQI-1 and WQI-2) across the area of study. The predicted water quality was determined using Kriging on the WQI respective values.
Water 12 01358 g006
Figure 7. Bacteriological results, air exposure from the air pollution model (TAPM) [64], showing high bacteriological contamination in the proximity of Village 1 and Village 2. S1, W12, W2, W3, W5, fecal coliforms < 1 CFU, W12 total coliforms < 1 CFU. TAPM exposures are presented as the percentages of modeled air pollutants concentration from the maximum modeled concentration of at the landfill source.
Water 12 01358 g007
Table 1. Results from water quality testing of a stream (R1) located in the proximity of a dumpster.
Analysis GroupAnalysisUnitSample R1MOH-MCL- Surface Water
Field dataConductivityuS/cm1576-
pH 7.46–9
Temperature°C20
General chemicalAmmoniamg/L5.810
Fluoridemg/L0.4525
Nitrate (NO3)mg/L117.390
Orthophosphatesmg/L1.515
Phosphorousmg/L0.0816
Sulfidesmg/L0.185<0.005
Sulfatesmg/L48.51000
Other chemicalTotal organic carbon (TOC)mg/L10075
Total suspended solidsmg/L67.5200
MetalsAluminumug/L310,000
Bariumug/L82000
Cobaltug/L30500
Manganeseug/L16801000
MicrobiologyE. coli >10,0002000
Fecal coliformsCFU/250 mL>10,0002000
Other bacteriaP/APresent-
SalmonellaeP/APresentAbsent
Cyanides, As, Cd, Cr, Cr6+, Cu, Fe, Hg, Pb, Sb, Sn, Zn, and VOCs are below detection limit.
Table 2. Results from water quality testing of wells and springs in C1-C3 basin. Natural background from [33] Khadra and Stuyfzand (2014), values for the mountain hydrosome 1.
Analysis GroupAnalysisUnitN of Tests—WellsAverage Wells +/− 95% CIN of Tests—SpringsAverage Springs +/- 95% CINatural BackgroundEPA/WHO MCLMOPH MCL
Field dataConductivityuS/cm3604.7 +/− 122.77619.3 +/− 50.5519-1500.00
pH -37.4 +/ 0.377.6 +/− 0.27.26–86–8
General chemicalTemperature°C217.4 +/ 3.8616.7 +/- 1.9---
Chloridesmg/L317.4 +/ 10.6730.6 +/− 7.424.1250200
Nitrate (NO3)mg/L31.6 +/ 3716.9 +/− 12.91.24545
Phosphorous mg/L30 +/ 070 +/− 00.1--
Orthophosphatesmg/L1NA60 +/− 0.1-0.031
Diphosphorus Pentoxidemg/L20 +/ 060 +/− 0.1---
Sulfatesmg/L10--12250250
MetalsBariumug/L313.3 +/− 8.276.4 +/− 2.48.420002000
Chromiumug/L30.2 +/− 0.370 +/− 0.10.6100
Seleniumug/L30.2 +/− 0.370 +/− 0.1<0.055010
Zincug/L3103.3 +/− 113.370 +/− 0.14.150005000
Petroleum hydrocarbonsTPH (Total)mg/L1NA60.7 +/− 1.4---
MicrobiologyE. coliP/A3Present (1/3)7Present (5/7)-AA
Fecal coliformsCFU/250 mL35.7 +/− 11.1727.7 +/− 25.5-<1 cfu<1 cfu
Total coliformsCFU/100 mL350.7 +/- 48.6767 +/− 31-<1 CFU<1 CFU
OtherP/A3Present (3/3)7Present (7/7)---
1 Ammonia, fluoride, nitrate equivalent, nitrite (NO2), nitrite as No2-N, P205, PO4, cyanides, DOC, TOC, total suspended solids, all other metals (Al, As, Be, Cd, Co, Cr6+, Cu, Fe, Hg, Mo, Ni, Pb, Sb, Sn, V), AOX, biphenyl, phenols, total PCBs, and VOCs are below detection limits.
Table 3. Results from water quality testing of wells in C4-C5 basin. Natural background from [33] Khadra and Stuyfzand (2014), values for the Coastal Hydrosome 1.
SubgroupAnalysisUnitN of Tests—WellsAverage Wells +/− 95% CINatural BackgroundEPA/WHO MCLMOPH MCL
Field dataConductivityuS/cm111189 +/− 616757-1500.00
pH 117.4 +/− 0.17.16-86-8
Temperature°C920.3 +/− 2.4 --
General chemicalBromidemg/L60.4 +/− 0.70.3--
Chloridesmg/L11115.5 +/− 127.982.1250200
Nitrate (NO3)mg/L118.3 +/− 3.65.54545
Nitrite (NO2)mg/L40 +/− 0-10.05
Sulfatesmg/L851.4 +/− 3471.9250250
MetalsArsenicug/L110.1 +/− 0.205050
Boronug/L616.7 +/- 32.742--
Bariumug/L1124.2 +/− 14.451.1200200
Chromiumug/L110.4 +/− 0.50.6100100
Copperug/L100.8 +/- 1.60.913001000
Mercuryug/L110 +/− 0025
Molybdenumug/L90.4 +/− 0.80.2--
Nickelug/L110.5 +/- 1.10.22010
Zincug/L11228.7 +/− 214.93.350005000
Miscellaneous organic compoundsBiphenylug/L70 +/− 0 --
Petroleum hydrocarbonsTPH (total)ug/L716.3 +/− 12.6 --
PhenolsPhenolug/L764.3 +/− 116.2 --
Volatile halogenated hydrocarbonsTrichloromethaneug/L70.2 +/− 0.2 100100
MicrobiologyE. coliP/A5Present (2/5) AA
Fecal coliforms CFU/250 mL57.2 +/− 9.5 <1 CFU<1 CFU
Total coliformsCFU/100 mL541.4 +/− 46.94 <1 CFU<1 CFU
Other (present or absent)P/A5Present (5/5) --
1 Ammonia, ortho-phosphates, P, P205, PO4, cyanides, total suspended solids, all other metals (Al, Be, Cd, Co, Cr6+, Mn, Pb, Sb, Se, Sn, V), cresols, chlorophenols, PAH, VOCs, chlorinated VOCs, and pesticides are below detection limit.
Table 4. Summary of the water quality index (WQI) analysis adopted from [46] Muzenda et al. (2019) (WQI-1) and [47] Soltan et al. (1999) (WQI2).
Hydro-Geological SettingWater SourceWQI-1 1WQI-2 2
Springs C1-C3S117716
S2159823
S3145518
S461730
S521224
S6138220
S7240418
Average Springs C1-C3112121
Wells C1-C3W1106619
W212916
W313615
Average Wells C1-C344417
Wells C4-C5W487424
W510217
W611420
W7-17
W8-21
W9114581
W10-22
W11136
W122844
Average Wells C4-C537731
1 WQI-1 is based on pH, chlorides, nitrate, phosphorous, barium, chromium, selenium, zinc, and total and fecal coliforms. 2 WQI-2 is based on pH, chlorides, nitrate, phosphorous, barium, chromium, selenium, and zinc.