Article

Anthropogenic Impact on Tropical Perennial River in South India: Snapshot of Carbon Dynamics and Bacterial Community Composition

by
Katrin Premke
1,*,
Gunasekaran Dharanivasan
2,3,
Kristin Steger
4,
Kai Nils Nitzsche
5,
Vijayan Jayavignesh
6,
Indumathi M Nambi
6 and
Sundaram Seshadri
3
1
Department of Chemical Analytics and Biogeochemistry, Leibniz Institute of Freshwater Ecology and Inland Fisheries (IGB), Müggelseedamm 310, 12587 Berlin, Germany
2
Department of Sensing, Information and Mechanization System, Institute of Agricultural Engineering, Agricultural Research Organization, Volcani Center, Rishon LeZion 7528809, Israel
3
Indigenous and Frontier Technology Research Centre (IFTR), Chennai 600061, India
4
Faculty of Environment and Natural Resources, Chair of Soil Ecology, University of Freiburg, 79085 Freiburg im Breisgau, Germany
5
Biogeochemistry Research Center, Japan Agency for Marine-Earth Science and Technology (JAMSTEC), 2-15 Natsushima-cho, Yokosuka 237-0061, Japan
6
Environmental and Water Resources Engineering Division, Department of Civil Engineering, Indian Institute of Technology Madras, Chennai 600036, India
*
Author to whom correspondence should be addressed.
Water 2020, 12(5), 1354; https://doi.org/10.3390/w12051354
Submission received: 10 March 2020 / Revised: 26 April 2020 / Accepted: 5 May 2020 / Published: 11 May 2020
(This article belongs to the Section Water Quality and Contamination)

Abstract

:
Riverine systems play an important role in the global carbon cycle, and they are considered hotspots for bacterial activities such as organic matter decomposition. However, our knowledge about these processes in tropical or subtropical regions is limited. The aim of this study was to investigate anthropogenically induced changes of water quality, the distribution of selected pharmaceuticals, and the effects of pollution on greenhouse gas concentrations and bacterial community composition along the 800 km long Cauvery river, the main river serving as a potable and irrigation water supply in Southern India. We found that in situ measured pCO2 and pCH4 concentrations were supersaturated relative to the atmosphere and ranged from 7.9 to 168.7 μmol L−1, and from 0.01 to 2.76 μmol L−1, respectively. Pharmaceuticals like triclosan, carbamazepine, ibuprofen, naproxen, propylparaben, and diclofenac exceeded warning limits along the Cauvery. Proteobacteria was the major phylum in all samples, ranging between 26.1% and 82.2% relative abundance, and it coincided with the accumulation of nutrients in the flowing water. Results emphasized the impact of industrialization and increased population density on changes in water quality, riverine carbon fluxes, and bacterial community structure.

1. Introduction

Rapid population increase, along with urbanization and climate change, are some of the main threats to globalization. As an increased population demands a larger food supply and requires more energy and water for agriculture, it unsurprisingly adds pressure on freshwater resources. Freshwater sources cover about 3% of the Earth’s surface, and many freshwater bodies are already under threat due to human activities and climate change [1,2,3,4]. Rivers are considered as the cradle of human civilization, and they are globally exploited by humans for agricultural, industrial, fishing, transportation, and recreational activities. Rivers in India are culturally and spiritually intertwined with people’s lives. Owing to their dynamic role in building an economy and, more importantly, to safeguard human health and possibly conserve the prevailing ecological structure, it is vital to conserve river-water quality. However, inland waters, particularly riverine ecosystems, are constantly polluted with, for example, heavy metals, pharmaceuticals, fertilizers, and wastewater from various sources, such as cities, domestic and industrial activities, and agriculture [5]. India is one of the world’s major producers and consumers of pharmaceutical products, yet only a little information exists on their status in Indian water bodies [6].
Inland waters play an important role in the global carbon cycle [7,8,9], and they receive organic carbon by surface runoff and subsurface flow. After entering a water body, organic carbon can be sedimented, transported downstream, or used by aquatic bacteria [10]. Bacteria mineralize biodegradable organic matter (OM) from terrestrial or autochthonous production resulting in carbon dioxide (CO2) or methane (CH4) supersaturation in waters, which has a large effect on the atmospheric heat budget [11,12,13]. Carbon degradation is strongly regulated by temperature and oxygen availability [14,15]. Hence, in countries with high temperatures, as found in tropic and subtropical regions, riverine OM is more susceptible to bacterial degradation. However, the role of rivers of tropical or subtropical regions in C cycling is scarcely reported, leaving global blind spots in riverine C emissions [16]. To date, studies on the C dynamics of tropical rivers are mainly represented by information from the Amazon basin of South America and a few African rivers. Owing to uncertainties in global estimates and the lack of detailed information from tropical rivers, there is a need for regional-level research [17].
In general, bacterial populations are highly dynamic, and their community patterns strongly differ on the basis of biotic and environmental parameters [18,19,20]. Hence, it is important to know more about bacterial communities as it provides information on OM decomposition and the circulation of essential elements in an aquatic environment. Pollutants in aquatic systems could develop and spread pharmaceutical resistance among bacterial populations, thereby modifying ecological structures and disturbing ecosystems [11,21,22,23]. Thus, the detailed monitoring of a river could improve our understanding of contaminations sources and factors affecting abiotic and biotic components and, in turn, bacterial community patterns.
The Cauvery River is one of the perennial rivers in Southern India. Its river basin has been continuously degraded during the past few decades due to increased human activities resulting in water quality deterioration and the endangering the ecology and biodiversity (India-WRIS, 2014; http://indiawris.gov.in/wris/#/). Water from the Cauvery River and its tributaries are widely used for drinking, irrigation, and fishing. Untreated wastewater reflects an additional risk of bacterial resistance in animals and humans (India-WRIS, 2014; http://indiawris.gov.in/wris/#/).
Although many studies on the Cauvery River explored the link between water-sediment quality and the distribution of heavy metals, information related to the distribution of pharmaceutical compounds and bacterial community structures is sparse [6,24]. Furthermore, there are no evident data from monitoring the entire river and describing its spatial characteristics on the basis of its water quality, carbon load, bacterial community structure, and concentrations of greenhouse gases (GHGs) such as pCO2 and pCH4 in the water. Hence, the present study focused on pollution monitoring along the Cauvery River, its effects on greenhouse gases (pCO2 and pCH4), and its bacterial community, and their inter-relation. This study emphasizes the effect of anthropogenic activities on aquatic ecosystems, their effect on humans, and the need for pollution control.

2. Materials and Methods

2.1. Sampling and Field Analyses

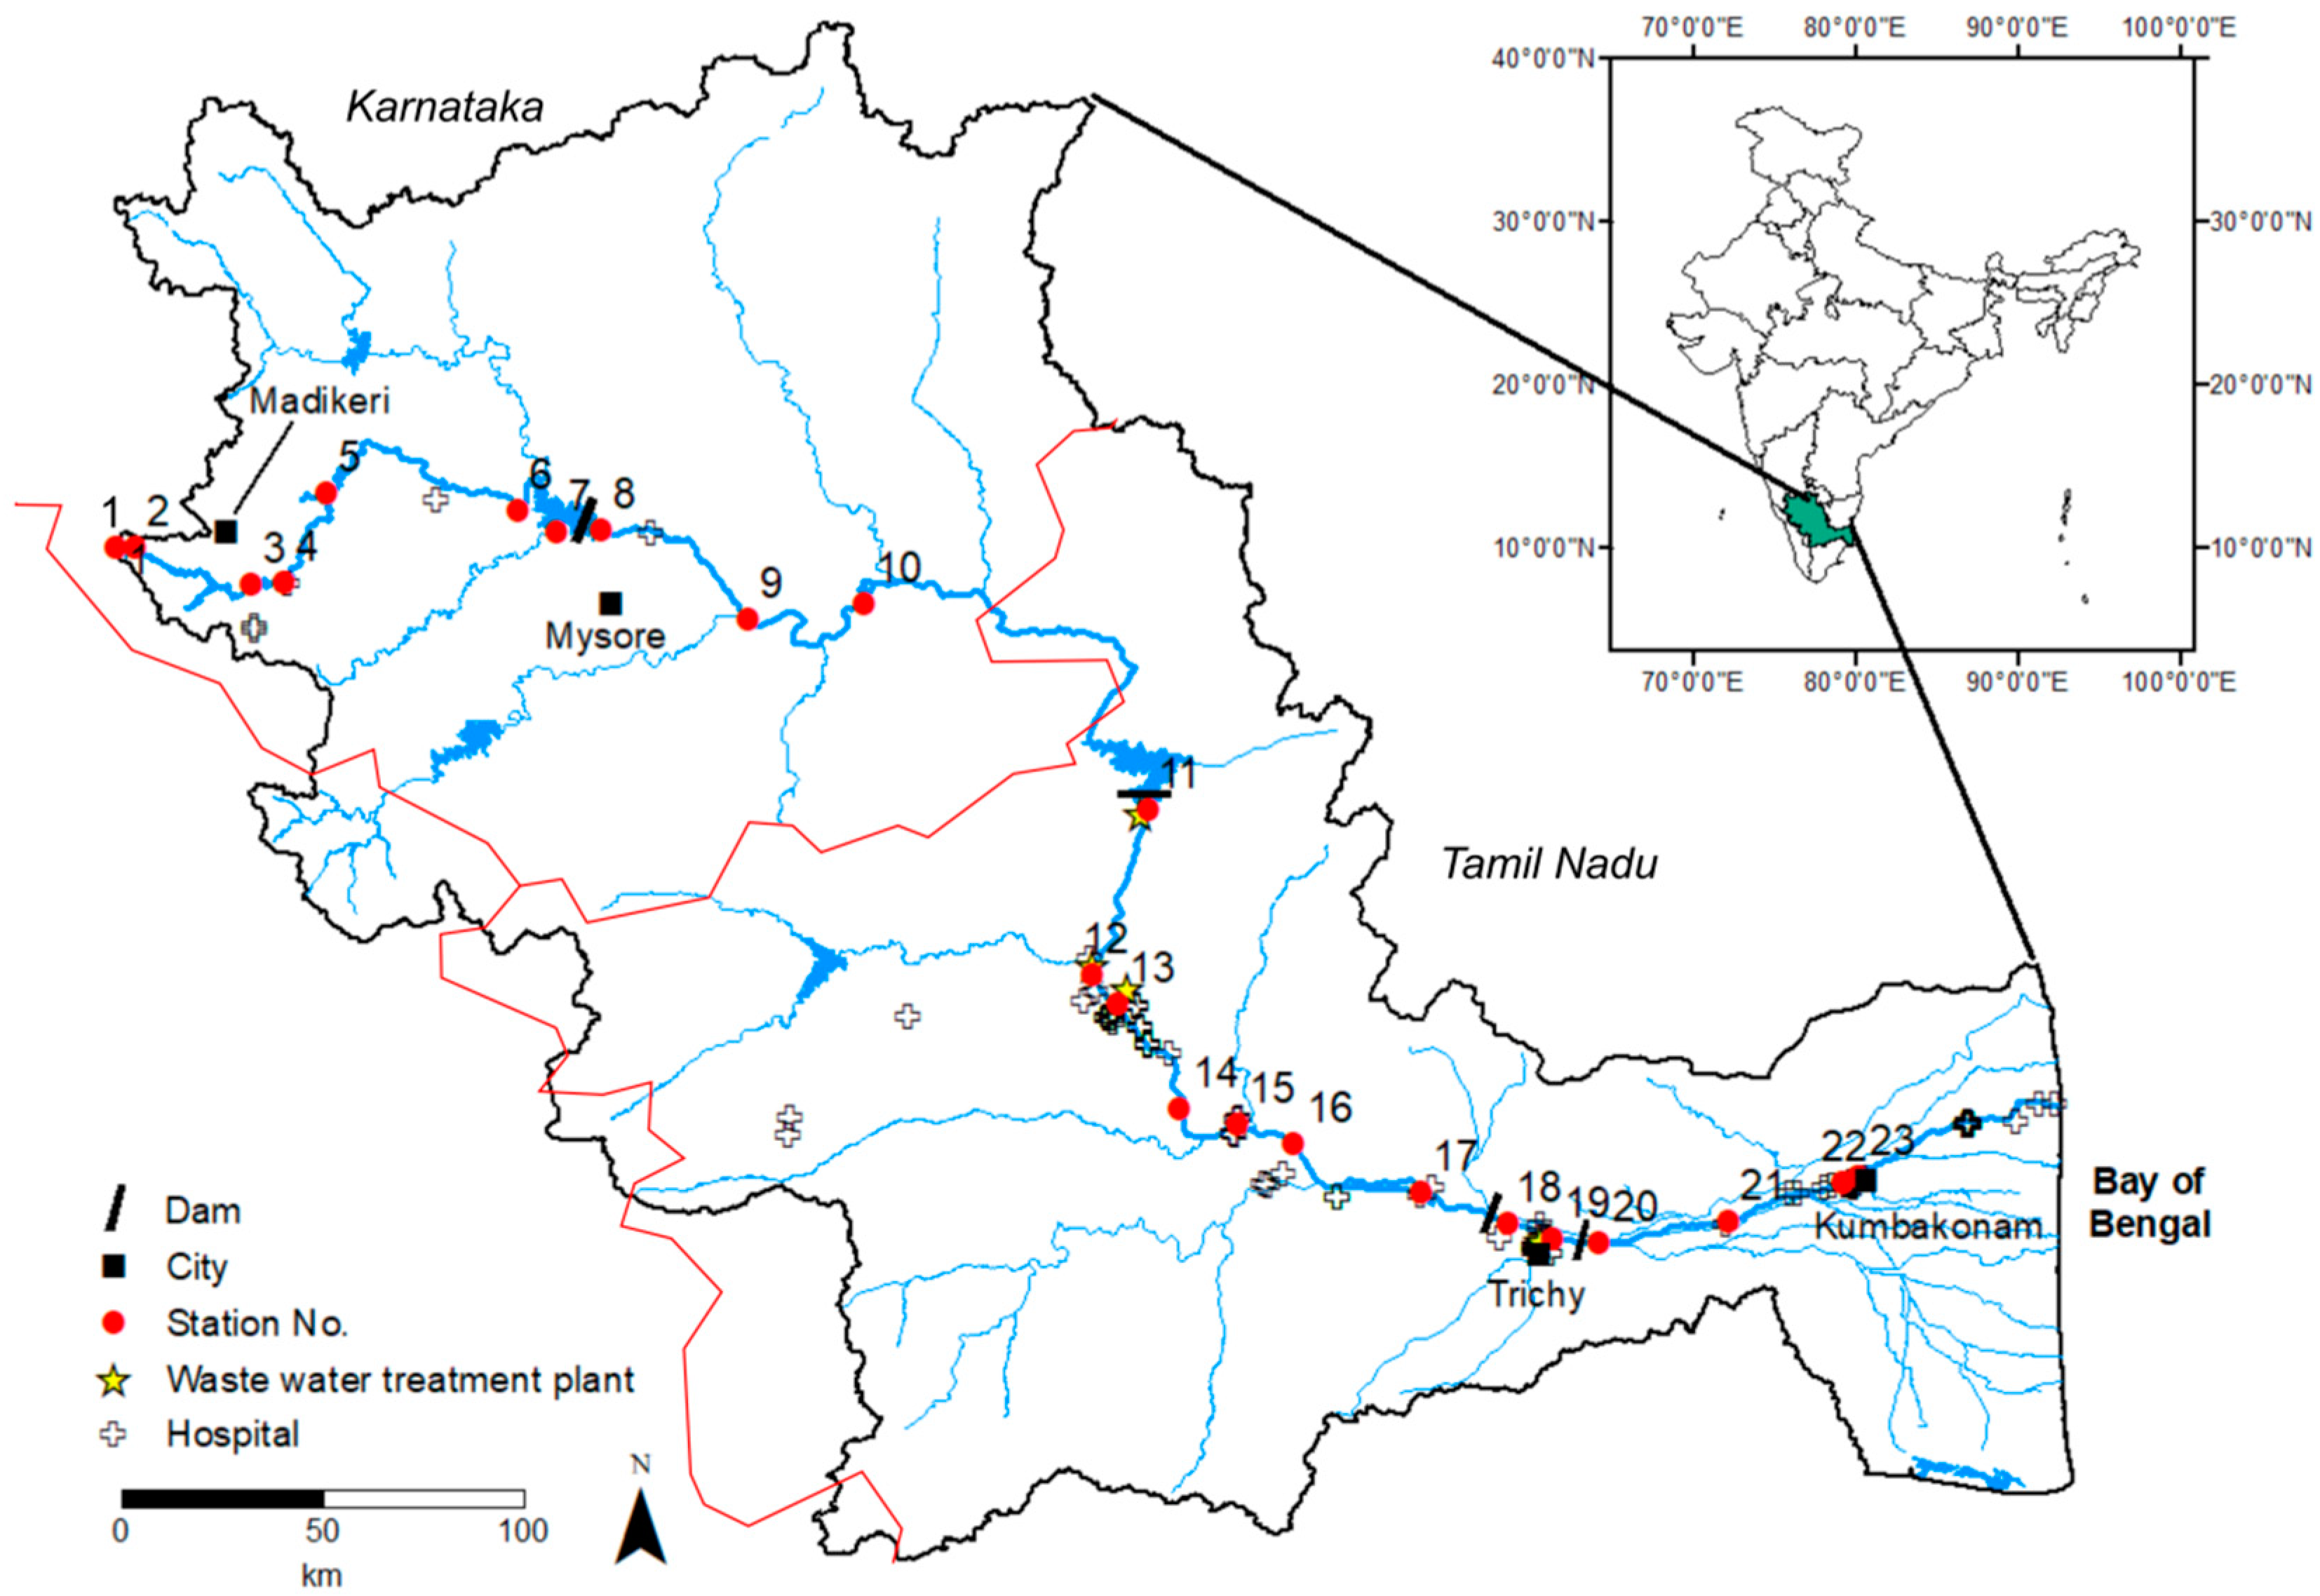
The Cauvery River originates at Tala Kaveri from the Coorg/Kodagu district of the state of Karnataka in the Western Ghats and flows eastward through the state of Tamil Nadu, India (Figure 1 and Figure 2). The river length is approximately 800 km and covers a drainage area of 81,155 km2. The river is divided into 36 distributaries before it finally drains into the Bay of Bengal (Figure 1) [25].
Major land use of the Cauvery River basin is for agriculture (66%) and forest cover (20%), where natural forests dominate the upstream part of the river, while agricultural use increases along the flow gradient. Numerous temples of religious and cultural significance, wildlife sanctuaries, waterfalls, and hill stations that attract tourists all year round exist along the course of the river. The climatic pattern along the river basin has been classified as summer, Southwestern Monsoon, Northeastern Monsoon, and winter. The basin has a tropical and subtropical climate, with a mean temperature variation between 20 and 31 °C. The basin receives its main rainfall during the Southwestern Monsoon (June–September), whereas the Northeastern Monsoon (October–December) favors the state of Tamil Nadu. The annual mean precipitation of the basins is approximately 1075 mm. The water level of the Cauvery River is further impacted by a strong issue of water partition dispute between the two states Tamil Nadu and Karnataka. This water-sharing agreement between the two states is based on riparian rights, which are not respected. Most likely, due to the weak and seasonal monsoon with increased water demand and the expansion of agricultural land and drinking water schemes. Consequently, water abstraction might not only impact the water level of the Cauvery River but might also impact the water quality of the river and its ecological functioning.
Sampling was carried out during the wet season, i.e., the post- (northeast) monsoon in January 2016. Along the Cauvery River basin, 23 sampling locations were selected from its origin, Tala Kaveri, until Kumbakonam (Tamil Nadu; Figure 1, Table 1). Stations were chosen on the basis of population density, land use, and ease of transportation to the laboratory. Sampling was conducted in the morning between 5 and 12 a.m., and sampling was carried out on the following dates: Station 1–5: 19 January 2016; station 6–10: 20 January 2016; station 11–17: 21 January 2016; station 18–23: 22 January 2016.
Samples were always collected 10 m into the river from its bank and from the running water 20 cm beneath the surface. Surface-water samples were analyzed for water quality such as total organic carbon (TOC), dissolved inorganic carbon (DIC), greenhouse gases (CO2 and CH4), and bacterial communities. Three independent water samples were taken from the river for DIC, CO2, and CH4 measurements. Samples for the measurement of gases and DIC were collected 10 cm below the water surface. After collection, samples were carried on dry ice to the laboratory, where they were directly measured after sampling.
Temperature, pH, electrical conductivity (EC), and dissolved oxygen (DO) were measured in situ with precalibrated YSI probes (YSI Inc., Yellow Springs, OH, USA). CO2 and CH4 were measured no later than 2 h after sampling by using the headspace extraction technique [26]. Briefly, water samples (20 mL) were collected in amber bottles without leaving headspace in gas-tight amber glass vials with a septum. During analysis, 5 mL of headspace was created with the ambient air, and vials were strongly shaken for 1 min. A gas-tight syringe was used to draw 500 µL gas samples from the headspace and injected into Los Gatos GHG analyzer (Los Gatos Research Inc., Mountain View, CA, USA) to measure dissolved gaseous CO2 and CH4. Sample collection for DIC was carried out in the same way as CO2, but phosphoric acid was amended in the sample before shaking to measure inorganic CO2. TOC was measured on the basis of standard methods (APHA, 2005) by using a Shimadzu TOC-V/TN (Kyoto, Japan) analyzer in the laboratory at the Indian Institute of Technology Madras.
Additionally, samples for nutrients measurements (total phosphorous and total nitrogen) were taken but could not be analyzed due to laboratory concerns. Consequently, we refer to already existing literature data, the Water Quality Index of the Cauvery River, and in situ observations for considering the impacts of nutrients.

2.2. Analysis of Pharmaceutical Compounds

A few sampling stations, Tala Kaveri (Station 1), Bhagamandala (Station 2), T. Narasipura (Station 9), Shivanasamudra (Station 10), and Mettur Dam (Station 11) were selected for certain pharmaceuticals: Ibuprofen, paracetamol, naproxen, triclosan, diclofenac, carbamazepine, mathylparaben, propylparaben, nonyl-phenol, 4-octyl-phenol, 2,4′-bisphenol A.
Water samples were collected using precleaned and preweighed dried glass bottles that were sealed tight after sample collection. In the laboratory, water samples were filtered using glass fiber filters, and the pH of the water was adjusted to 2 with 3.5 M HCl using a pH meter (Elico, National Scientific Suppliers, Chennai, India). The filtered water was then subject to solid-phase extraction (SPE, Oasis HLB, Waters, Bengaluru, India). SPE columns were conditioned using 3 mL of ethyl acetate:acetone (1:1 v), followed by 3 mL of methanol and by 3 mL of MilliQ water. This conditioning was performed to remove any impurities adsorbed on the SPE column during storage. 1000 mL of filtered water sample was processed through the SPE column at a constant flow rate of 5 mL min−1. The loaded SPE cartridges were washed with 5 mL of 5% methanol solution to flush out any excess water. The adsorbed compounds were then eluted using 10 mL of the 1:1 v ethyl acetate:acetone mixture. The eluent was collected in a 20 mL clean glass vial and concentrated to reduce the volume to 1 mL using a gentle stream of ultrapure nitrogen in a fume hood. The sample was then derivatized to render some of the compounds of interest more stable and facilitate their identification using GC-MS. Derivatization was performed by the addition of 35 μL of N-methyl-trimethyl silyl trifluoro acetamide (MSFTA) and heating at 65 °C for 30 min. The derivatized sample was then transferred into a 1.5 mL HPLC vial. The vial was sealed with parafilm and stored in a freezer until analysis using GC-MS.
Chemical analyses were performed with gas chromatography using QP 2010 Plus from Shimadzu equipped with a mass selective detector and a capillary column (HP-5MS with 0.32 mm (ID) and 0.1 µm film thickness; column length was 30 m). We used external standards containing known concentrations of individual compounds to assure the qualitative and quantitative analysis of these compounds. Quality-control measures were strictly followed to ensure the highest possible analysis of confidence. The overall extraction of these samples in water was used to compute extraction efficiencies. Concentration values were corrected for extraction efficiencies. The detection limits of the analytes are as follows: Ibuprofen—10 ng L−1, paracetamol—20 ng L−1, naproxen—20 ng L−1, triclosan—5 ng L−1, diclofenac—5 ng L−1, carbamazepine—5 ng L−1, methylparaben—2 ng L−1, propylparaben—2 ng L−1, nonyl-phenol—5 ng L−1, 4-octyl-phenol—5 ng L−1, 2,4′-bisphenol A—5 ng L−1.

2.3. Analysis of Bacterial Community Structure

Water samples for DNA extraction were only taken once per station without replicating. Total DNA was extracted after filtering 50 mL of water sample through 0.22 μm membrane filter following the manufacturer’s instructions (Mobio-Power water DNA isolation kit cat No: 14900-50-NF, Mobio Laboratories Inc., Carlsbad, CA, USA). DNA samples were quantified using a Nanodrop and Qubit DNA BR assay (Thermo Fisher Scientific, Washington, DE, USA). The isolated DNA was stored at −20 °C for analysis. The V3 and V4 regions of the 16S rRNA gene were targeted for library preparations. Samples were amplified using 16S rRNA gene universal primers (5′-ACTCCTACGGGAGGCAGCAG-3′, and 5′-GGACTACHVGGGTWTCTAAT-3′) with standard Illumina barcodes and adapters [27,28]. Amplicons were further purified using Ampure XP beads, and the barcoded libraries were validated by Agilent DNA 1000 Bioanalyzer, quantified using Qubit DNA BR reagent assay (Thermo Fisher Scientific, Washington, DC, USA). The quantified libraries were pooled and sequenced in Illumina Miseq using a 500 cycle kit with a read length of 2 × 250 bp. More than 70 percent of the sequencing data of the 2 × 250 bp run will be having a quality Phred score of more than 30.
Obtained raw sequences were processed using iOMICSTM (The Elastic Genomics Cloud Platform) for quality chimeric analysis, operational-taxonomic-unit (OTU) identification, taxonomic assignment, normalization, and identification of the main bacterial population. Briefly, the forward and reverse reads obtained from the Illumina platform were assembled, and the reads with Phred quality scores (≥20) were considered for further analysis. All chimeric sequences were detected using similarity-based cluster method Usearch using the Greengenes database (http://greengenes.secondgenome.com/). Out of the on average 100–120K reads generated for each sample, 85–90K reads passed the quality and chimera filtering and were clustered into 9050 OTUs. All sequences classified as eukaryote, mitochondria, chloroplast, and archaea were subsequently removed. Sequences were clustered into operational-taxonomic-units (OTUs) at a 97% similarity level using a “uclust” similarity-based sequence-clustering algorithm. Data were normalized using cumulative sum scaling (CSS) (mixOmics R package). In the following, we will refer to sequence-based estimates of bacterial community composition as ‘relative abundances′.

2.4. Statistical Analysis

We used the Shapiro-Wilk test to test for normally distributed data. We used Spearman rank-order correlation analyses to explore relationships between water quality parameters with DIC, TOC, pCO2, pCH4, and the distance of the sampling location from the source (DfS) as most parameters were non-normally distributed. Nonmetric multidimensional scaling (NMDS) and PCoA were used to evaluate the molecular dataset. Prior to analysis, Bray–Curtis distance matrices were calculated on the basis of normalized and square-root-transformed OTU abundances. All statistical analyses were performed with the R (version 3.6.3, R Foundation for Statistical Computing, Vienna, Austria, http://www.R-project.org/).

3. Results

3.1. General Characteristics and Spatial Variations of Water Chemistry

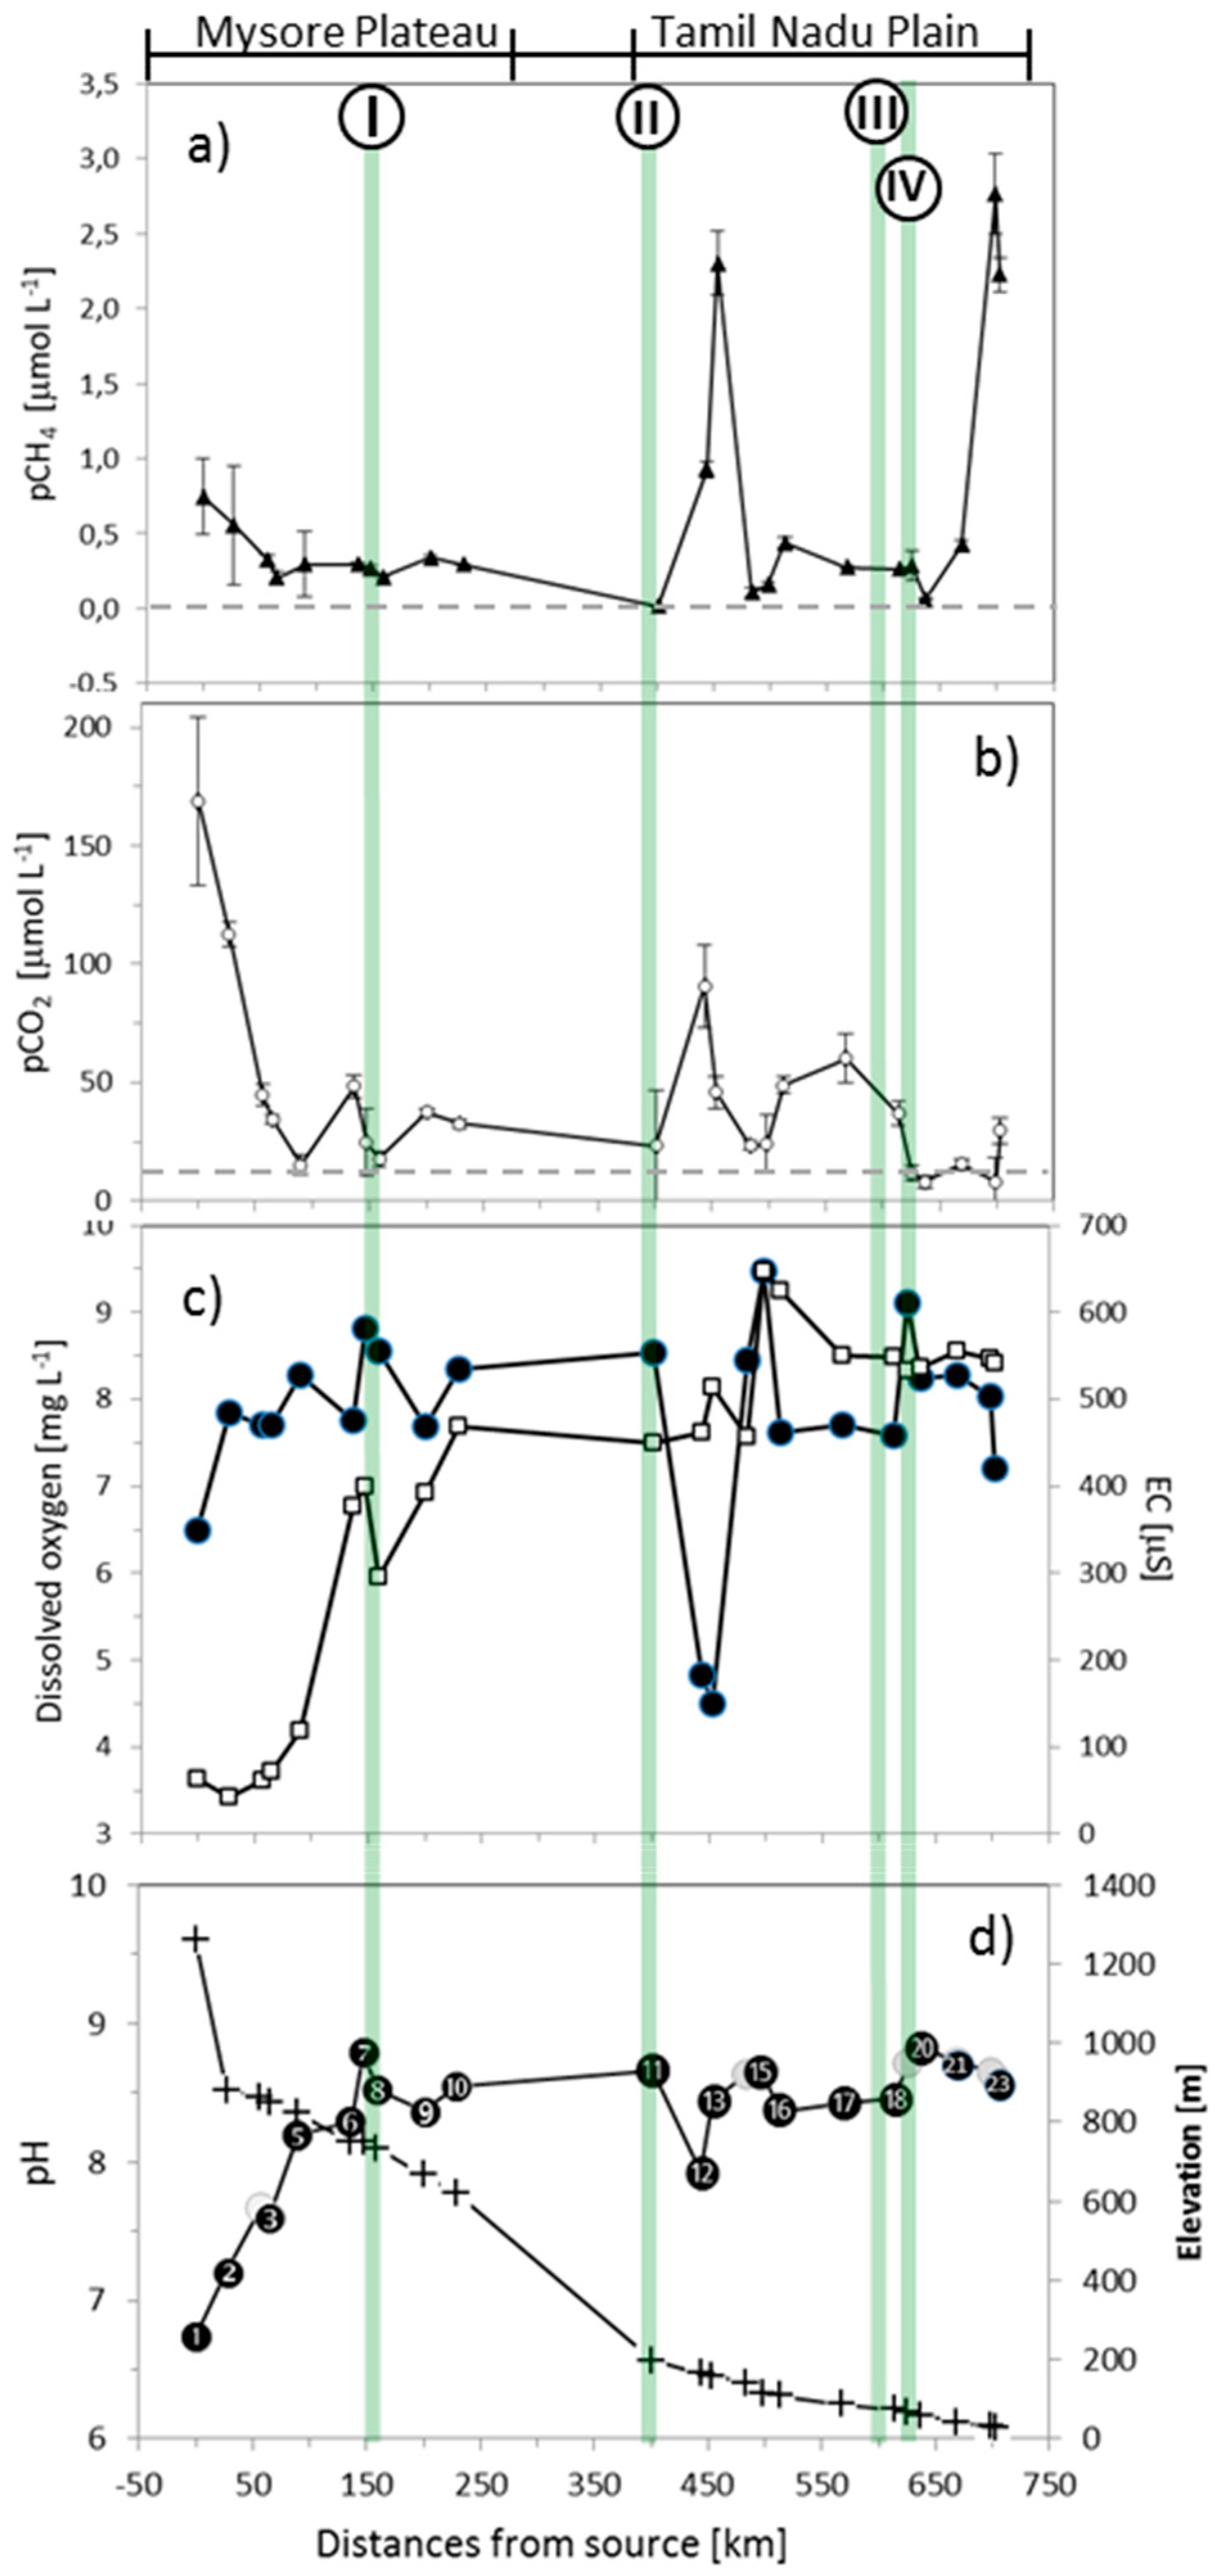
The pH varied between 6.7 (Station 1) and 8.8 (Station 20) and significantly increased with increasing distance from the source (r = 0.69**) (Figure 3, Table 2, Table S1). Around 78% of the stations had pH values larger than 8. Lower pH values (<8) were measured, especially before Station 5 and at Station 12.
Electric conductivity ranged from 42 µS cm−1 at Station 2 to 647 µS cm−1 at Station 15 in the Southeast (Figure 3, Table S4). Similar to pH, EC significantly increased with increasing distance from the source (r = 0.89**).
DO concentrations fluctuated during the entire river stretch and ranged from 4.5 to 9.5 mg L−1. The overall lowest DO concentration was recorded in large municipal towns 40 km after the Mettur Dam at Station 13, Pallipalayam (4.5 mg L−1), and Station 12, Bhavani (4.8 mg L−1, Figure 2), around 450 km from the river source. Water temperature measured during the current study varied between 20.7 and 30.3 °C, and water temperature significantly increased downstream (r = 0.91**).
DIC and TOC concentrations are reported in Table 1. DIC concentrations in water samples varied between 0.56 and 3.46 mmol L−1 at Stations 3 and 10, respectively. We found that DIC was slightly positively correlated with pH (r = 0.54**) (Table 2).

3.2. Spatial Pattern of pCO2 and pCH4 Concentrations Along the Gradient

The concentration of GHGs (CO2 and CH4) as pCO2 and pCH4 were determined (Figure 3). The river water was mostly supersaturated with CO2 and CH4 relative to the atmosphere (32.2 μmol L−1 as the median). pCO2 ranged from 7.9 μmol L−1 (Station 20) to 168.7 μmol L−1 (Station 1) and tended to decrease downstream (r = −0.47*).
Minimum pCH4 concentrations were recorded in Station 11 (0.01 μmol L−1), directly after water was discharged from the Mettur Dam back into the river, whereas a maximum concentration was measured at Station 22 (2.76 μmol L−1), in a more urban area. pCO2 concentrations showed significant negative correlations with pH (r = −0.76**), temperature (r = −0.47**), and DO (r = −0.68*). Furthermore, we found pCH4 was negatively correlated with DO (r = −0.63**).

3.3. Pharmaceuticals

The details of various pharmaceutical compounds, their classification, and their concentration were recorded at selected sampling stations (Figure 4). All selected compounds were below the detection limit (BDL) at Station 1. Furthermore, 2,4′-bisphenol A concentration was BDL at all sampling stations. Triclosan and diclofenac were detected only at Stations 2 (492 ng L−1) and 10 (1280 ng L−1), whereas carbamazepine (2779 ng L−1), ibuprofen (398 ng L−1), naproxen (1624 ng L−1), propylparaben (269 ng L−1) had the highest concentrations at Station 9. Nonyl-phenol (200 ng L−1) and 4-octyl-phenol (415 ng L−1) had their maximum concentrations at Station 2. All the above-mentioned pharmaceuticals emerged in places with high human impact (pilgrimage, touristic spots).

3.4. Changes in Bacterial Community

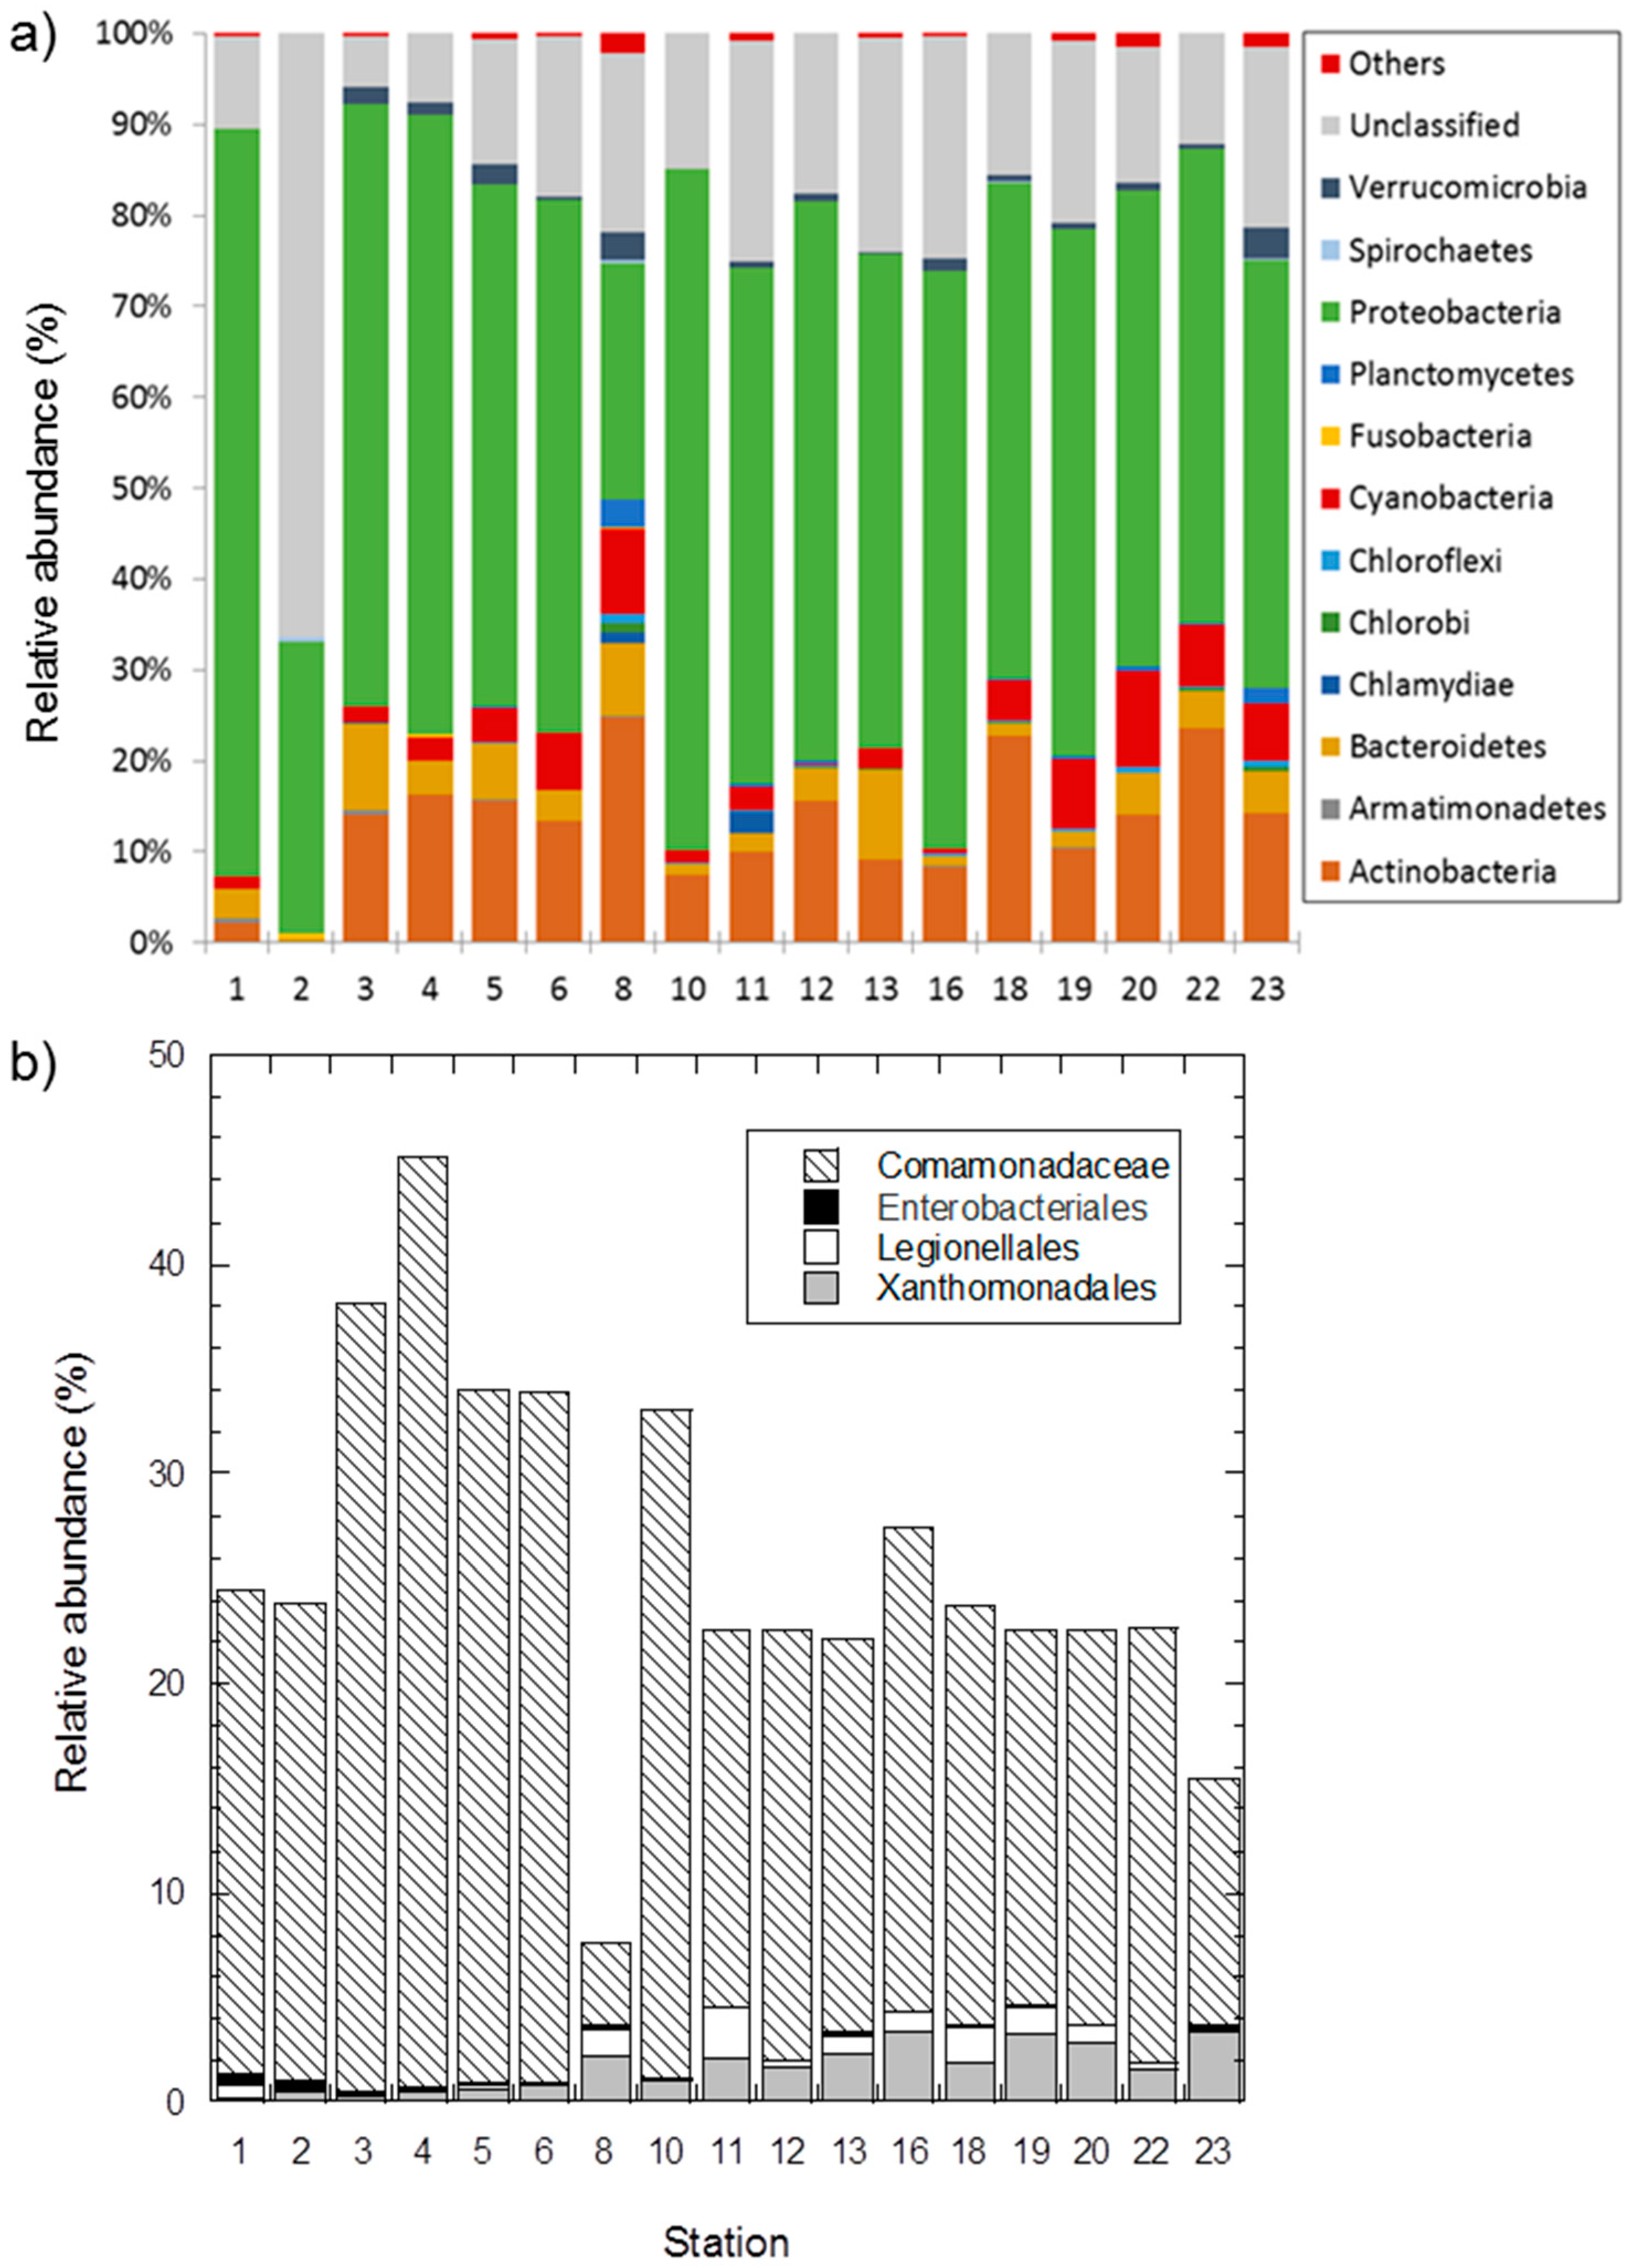
The analysis of bacterial community composition of water samples from 17 stations revealed 12 different phyla, with Proteobacteria as the major phylum in all samples (Figure 5a, Tables S2 and S3). The relative abundance of this diverse phylum ranged between 26.1% (Station 8) and 82.2% (Station 1) and had a median relative abundance of 57.6%. Within the phylum, the class of β-proteobacteria was dominating, followed by γ- and α-proteobacteria, with median relative abundances of 42.8%, 7.2%, and 2.3%, respectively (Table 3).
In general, Stations 2 and 8 revealed distinct bacterial-community compositions compared to the remaining stations: Station 8 showed the highest bacterial diversity, comprising all 12 bacterial phyla recorded in this study. Station 2 had the highest relative abundance of unclassified bacterial phyla (65%). Additionally, Station 8 had the lowest abundance of pathogens (Figure 5b).

4. Discussion

In this study, we presented indications that high anthropogenic activities cause spatial variability in CO2 and CH4 concentrations, and in bacterial community compositions along the Cauvery River, the main river for potable- and irrigation-water supply for the larger parts of three states in Southern India. Furthermore, the results confirmed that high population density (555 km−2 against a global mean of 59 km−2 [29]) and a mass gathering at distinct places due to tourism and pilgrimages (Table 1) result in changes of the riverine ecosystem and water quality.

4.1. Links between Greenhouse Gases and Water Quality, and their Connection to Urbanization

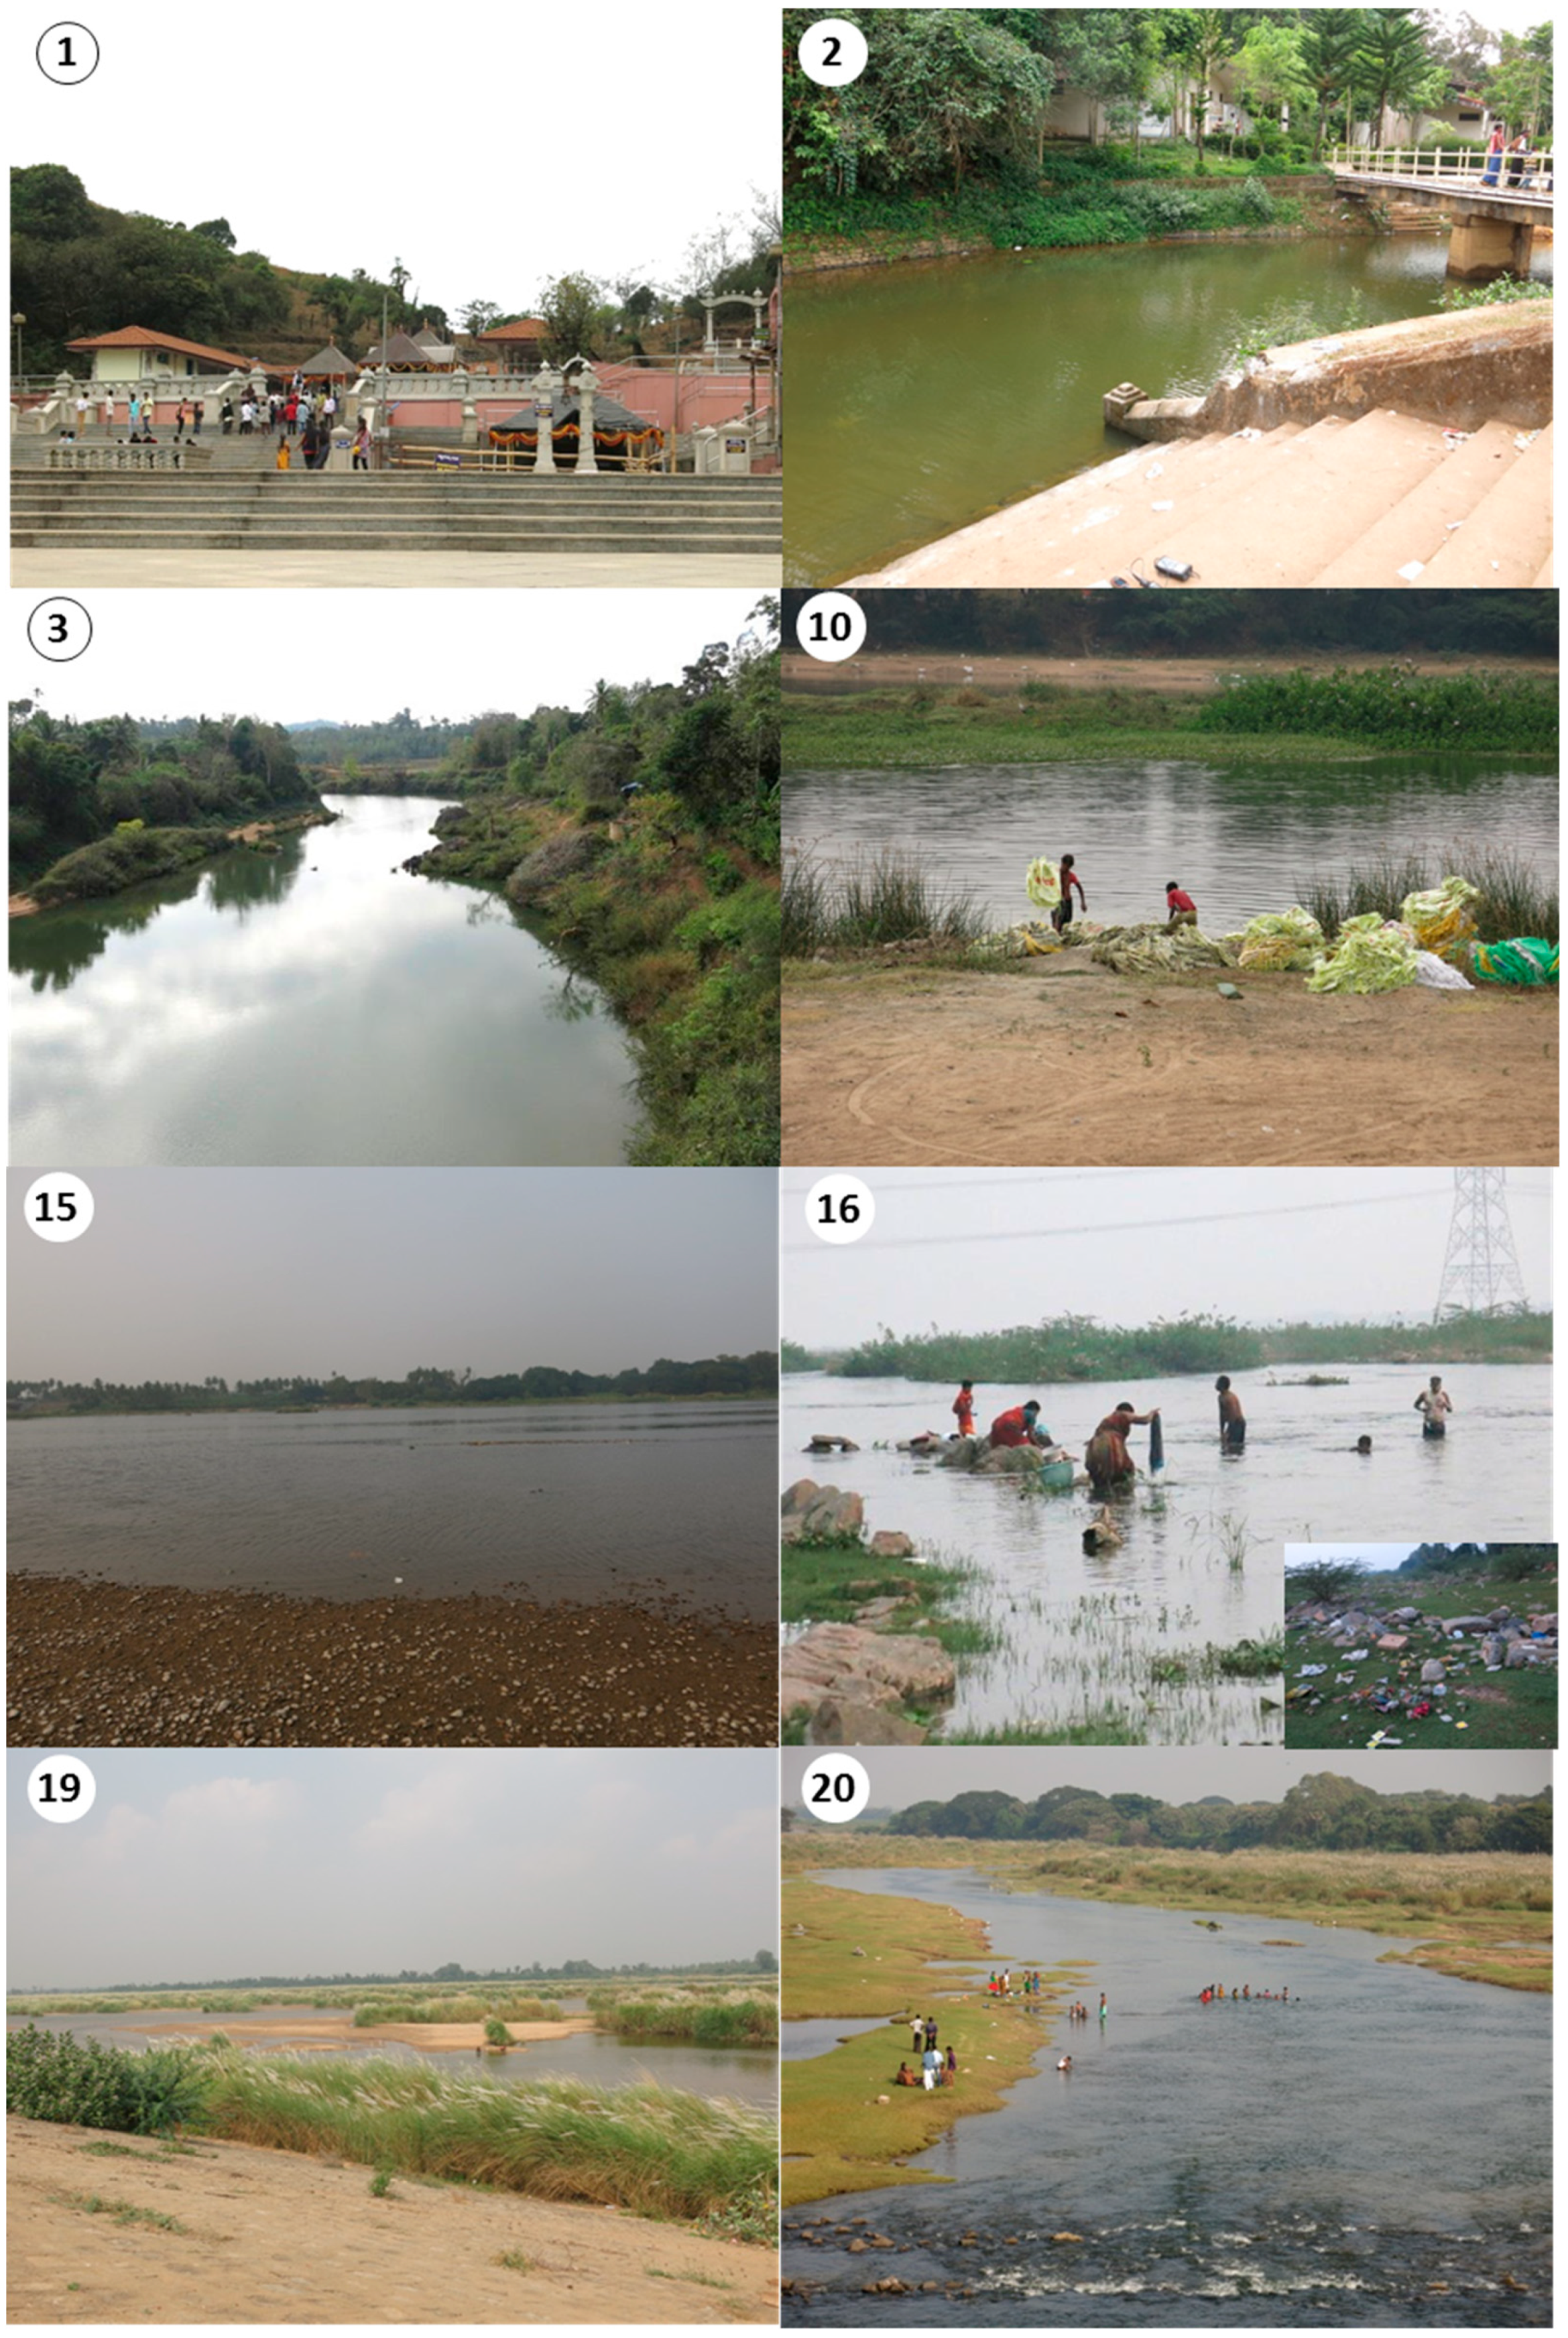
Greenhouse gas concentrations in the water, especially in Asian and African river networks, are very sparsely surveyed [16]. The lack of high-quality data and the poor spatial coverage of Indian rivers, especially on pCO2 and pCH4 [30], make it challenging to evaluate the contribution of Indian river systems to global carbon fluxes. The pCO2 concentrations in rivers and streams averaged at 1600 ppm (range of 132 to 11,770 ppm) on a global scale [10]. In this study, pCO2 concentrations were very high for a river system and fluctuated from 255 to 6735 ppm (in mean 1463 ppm), thus displaying large spatial heterogeneity. This supersaturation resulted in evasive GHG fluxes when compared to the atmosphere [7] along the entire stretch of the river. Depending on intensive urbanization (pilgrimage, big cities, dams, industry) and intensive use of the water, pCO2 supersaturation appeared to be controlled differently in space along the Cauvery River. Anthropogenic activities and industry and wastewater discharge can lead to high pulses of nutrients and additional organic matter that have an impact on aquatic metabolic processes and thus on dissolved CO2 production [31]. pCO2 was highest at the source of the Cauvery River, a place visited by pilgrims on a daily basis, and by thousands during Tula Sankramana, a festival that is held in October every year to celebrate the upsurge of the river from a small pond. High pCO2 concentrations at Station 2, just 27 km downstream, could have resulted from anthropogenic activities (e.g., washing, garbage disposal, household waste) during its course (Figure 2). To prove this hypothesis, we suggest future studies to sample shortly after the festival has been held (e.g., after 3, 7, or 14 days).
We attribute the negative correlation between pCO2 concentration with DO saturation (r = −0.68; Table 2) along the Cauvery River to the heterotrophic microbial respiration during the organic matter degradation. Since DO is mostly consumed through internal respiration processes [32,33]. A similar negative relationship was found in an Amazonian fluvial network [34] and in the Pearl River system in China [34,35]. However, the increase in pCO2 concentration in the river water could also be the result of the lateral transport of DIC originating from both weathering of carbonate minerals and soil respiration in the watershed through groundwater [36,37,38]. A decrease of DO concentration, resulting in high DO undersaturation and leading to high pCO2 and pCH4 concentrations were characteristic for Stations 12 and 13 downstream of the Mettur Dam, where water was partially stagnant along with the presence of Erode, a city with high population density and where a number of industries are situated.
Our results on pCH4 concentrations show that the Cauvery River water column was supersaturated with respect to the atmospheric equilibrium concentrations along the entire river stretch (Figure 3a). Overall, measured pCH4 concentrations fall towards the higher end or even exceed the range of CH4 concentration reported from other tropical rivers. In general, running waters are naturally oxic, with limited CH4 production. The main source of riverine CH4 is from the anaerobic bacterial decomposition of OM in areas with stagnant waters [39,40]. Additionally, floodplains and discharging soil and groundwater can also be sources of CH4 [41,42,43]. In the current study, stations with high urban areas and more stagnant waters (Stations 13, 22, and 23), registered higher CH4 and lower DO concentrations, respectively (Figure 3). A significant negative correlation between pCH4 with DO concentrations (r = −0.63) clearly showed the effect of population pressure and pollution on the riverine ecosystem. Our results are in good agreement with the study of Matousu et al. (2019), which also showed higher pCH4 concentrations in human-altered riverine habitats and in more stagnant river segments [44]. The correlation between DO and pCH4 concentrations is not as pronounced on the Tamil Nadu plain due to the low variability in values and the high outliers of CH4 concentrations at Stations 13, 22, and 23. In addition, elevation, climatic gradient, and benthic sediment mineralization rate may play a role in the different degrees of weathering along the Cauvery river [45].
Earlier studies showed that, especially along riverbanks, fast urbanization and industrialization have led to the discharge of partly or totally untreated wastewater and effluents into the Cauvery River [46]. Gowda et al. (2016) [47] found total nitrogen concentrations of 10 mg NO3 –N L−1, on average (4 to 18 mg L−1) and total phosphate concentrations of 3.5 mg PO4 –P L−1, on average (1 to 7 mg L−1) in the Mysore plateau of the Cauvery River. Gowda et al. (2016) attributed this poor water quality to anthropogenic activities. Krishna et al. (2016) [48] calculated a mean dissolved inorganic nitrogen of 1602 t N year−1, and phosphate of 8008 t P year−1. High nutrient concentrations have diminished the quality of the Cauvery River, and similar results on the ecosystem and human health due to poor water quality were shown for other rivers as well [49,50,51]. Moreover, anthropogenic disturbance changes the riverine processing of OM, which results in changes in DO concentrations, and the metabolism of pCO2 and pCH4 in the water.

4.2. Pharmaceuticals in the Cauvery River Compared to Global Rivers

Discharge from pharmaceutical industries into water bodies is considered a major source of pharmaceuticals, followed by agricultural waste and household sewage [52]. However, sewage treatment plants are considered to be an important source, despite the reduce pharmaceutical fluxes into the river compared to untreated sources. To the best of our knowledge, none of the stations that we investigated for pharmaceutical compounds had large pharmaceutical industries or sewage-treatment plants directly in its vicinity. Hence, wastewater generated from various sources, such as households, hospitals, public toilets, and agricultural runoff, could have been discharged into the river without any treatment.
The studied pharmaceuticals are part of different medicinal classes. Carbamazepine is an anticonvulsant drug used mostly for epilepsy, triclosan is a chemical disinfectant largely used in industry, and also in households, cosmetics, and toothpaste. Paraben is commonly used in preservatives used in health care and pharmaceutical products, and phenol is essential for the production of polycarbonates, detergents, herbicides, and pharmaceutical drugs. Ibuprofen and paracetamol are analgesics and antipyretic pharmaceuticals. Ibuprofen is also used for anti-inflammatory treatments. Non-steroidal anti-inflammatory drugs (NSAIDS) are used for rheumatic, analgesic, and antipyretic treatments (naproxen), and analgesic and anti-inflammatory applications (diclofenac). We also took samples for antibiotics for each station. Unfortunately, due to laboratory problems, the analyses failed. However, the antibiotic analysis should be included in the next approach of sampling campaign since they can strongly impact the microbial composition and thus ecosystem function.
Generally, our data confirmed previous findings on pharmaceutical riverine discharge and even exceeded concentrations observed by other studies. The concentrations of pharmaceuticals in our study are exceeding the warning limits of 100 ng L−1 (EU watch list of priority pollutants 2015). At T. Narasipura (Station 9), a place with high pilgrimage, a popular touristic spot, and a confluence of three rivers, anthropogenic pressure, and input from tributaries could have led to the highest ibuprofen (398 ng L−1), paracetamol (492 ng L−1), naproxen (1624 ng L−1), and carbamazepine (8337 ng L−1) concentrations found in the Cauvery River. These high concentrations of pharmaceuticals could be attributed to their easy availability [53]. Concentrations of the non-prescription pharmaceutical naproxen in the Cauvery River exceeded concentrations in the Han River (5.3–100 ng L−1) in South Korea, the Seine River estuary (<2.6–275 ng L−1) in France, and the Tiber River (200–264 ng L−1) in Italy [54,55,56].
A high concentration of ibuprofen (199 ng L−1) was also found in Bhagamandala (Station 2), which is frequented by people and is comparable to concentrations found earlier in the Cauvery River (195 ng L−1; Figure 4, Table S5) [57]. Higher ibuprofen concentrations were also found in the Alzette and Mess rivers (9 to 2383 ng L−1), the Mankuyng River (414 ng L−1) in South Korea [58], and in the Yamuna River in India (2300 ng L−1) [59].
Concentrations of paracetamol at Mettur Dam (938 ng L−1), also a highly touristic spot and a place where pharmaceuticals easily accumulate, were about half of the maximum concentration recorded in the Yamuna River, India [59], a river in California [60], and in the Umgeni River (16 µg L−1) South Africa [61]. However, the current value is over 14 times higher than the maximum concentration (65 ng L−1) recorded in the Mississippi River in the USA [62]. The high abundance of pharmaceuticals, even at places lacking large industry or wastewater-treatment plants, highlights the high need for more detailed investigations on the distribution of these contaminants and their impacts on the environment.

4.3. Possible Reasons for Bacterial Community Changes

We analyzed bacterial communities in order to understand microbial diversity and structure along the Cauvery River. The distinct bacterial-community compositions observed at Stations 2 and 8 compared to the remaining stations could be related to their environment. Station 2 receives water from a pristine forest ecosystem, and this station showed the lowest bacterial diversity, with 65% of unclassified bacterial sequences. Station 8 is the first major dam (Krishna Raja Sagara) in the Cauvery River, holding water received from the less polluted upper reaches. Thus, it is logical to assume this station registered the highest bacterial diversity comprising all bacterial phyla (Figure 5) with less pathogen abundance, indicating a less polluted station with a resilient bacterial-community structure.
Bacterial community structures are reported to vary in different ecosystems on the basis of nutrients, flow rate, pH, and temperature. They also differ according to sources of pollutants into the river [63,64]. As mentioned in earlier studies [65], Proteobacteria were reported as the dominant phyla in the river system. The Comamonadaceae family (Burkholderiales) within the β-Proteobacteria phylum are a fast-growing and nutrient-dependent group, and a typical freshwater group [66,67,68]. This bacterial family is often associated with nutrient pollution and found in overfertilized water bodies [69]. The inflow from arable lands and cities and towns represent a likely source of this family in the Cauvery River. Interestingly, Station 1 seems to be rather polluted with these bacteria, whereas Station 8 revealed low abundances of Comamonadaceae and other pathogens. However, the lower proportion at Station 8 might just as well be an artifact due to higher cell abundance and a more even community. Xanthomonadales, as an example in the class of γ-Proteobacteria, occurred from Station 8 onward in all stations downstream with between 1.0% and 3.4% relative abundance (Figure 5). This bacterial taxon affects agriculturally important plants, including bananas, citrus plants, rice, and coffee [70], and many species within the order are also human pathogens. The predominant occurrence of β-Proteobacteria is typical for freshwater systems and is in accordance with an earlier report on, e.g., the rivers of Dongjiang [71] and Songhua [72]. Although Burkholderiales are referred to as common flora in the riverine system, runoff from agriculture lands is also said to be its main source into the river [73]. Some genera from Burkholderiaceae were reported to have a symbiotic association with plants and were shown to degrade agricultural pesticides [74,75,76]. The over-use of agricultural pesticides is a common issue in India and can lead to the establishment of degrading bacteria in riverine systems like the Cauvery River.

5. Conclusions

The present study followed the anthropogenic impact along the Cauvery River from its origin to the river mouth, and the concomitant changes of water quality, the distribution of selected pharmaceutical residuals, and the effects of pollution on greenhouse gases and bacterial-community composition. The effect of anthropogenic activities was also seen in some investigated stations where households and touristic spots are a serious source of contamination of the Cauvery River, resulting in an increase in pCO2 concentrations. High pCO2 and pCH4 concentrations were also characteristic in regions with high population density and many industry and wastewater treatment plants. In future studies, we intend to target the effects of the four large dams on the physical, chemical, and biological functioning of the Cauvery River.
Dissolved pCO2 and pCH4 concentrations along the Cauvery River had large spatial heterogeneity and are potential GHG sources to the atmosphere along the entire stretch. Investigating carbon concentration and fluxes from rivers is an important component in the global carbon cycle, especially in tropical regions with permanently high temperatures. However, the intensification of human pressure on a river system like that of the Cauvery River requires more studies to identify and quantify the main drivers of carbon fluxes.
A range of pharmaceuticals was detected along the upper part of the Cauvery River, exceeding permissible limits. Environmental pollution by insufficient wastewater treatment, industry input, human households, and activities at the riverside are some of the world’s largest challenges. This could pose a major risk to human and aquatic life, such as fish, invertebrates, and microorganisms. On the basis of observations on the pathogenic, pharmaceutical, and bacterial load in the Cauvery River water, we strongly recommend to stop directly consuming the river’s water. An in-depth understanding of bacterial community composition and its ecosystem impact in rivers crossing urban and rural areas is still lacking, and it has been less explored than diversity in marine or lake ecosystems.
The data reveal that we should be more aware of pollution control, anthropogenic effects from pilgrimages, tourism, and industries upon aquatic ecosystems, and the rebound effect on human health. In our study, we were not able to obtain other crucial data such as flow velocity, turbidity, vertical evolution of water quality with depth, ecological functioning of the river, and the seasonal patterns as in dry season processes and pollution concentrations might be different. These complementary factors should be considered in future studies in order to understand ecosystem-level interactions, ecological risk, and implications for human health.

Supplementary Materials

The following are available online at https://www.mdpi.com/2073-4441/12/5/1354/s1, Table S1: Spearman rank order correlation analysis of measured variables at sampling stations and relative bacterial abundances (%). Table S2: OUT abundance of bacterial phyla at 17 stations along the Cauvery River. Table S3: Relative OUT abundance of bacterial phyla at 17 stations along the Cauvery River. Table S4: Chemical and geographical coordinates, distance elevation, place of importance, and temperature along the Cauvery River basin, India. Table S5: Pharmaceutical concentrations found in water at five different stations of the Cauvery River.

Author Contributions

Conceptualization, K.P. and S.S.; methodology, K.P., S.S. and V.J.; validation, K.P., S.S., V.J., and K.S.; formal analysis, K.S., V.J., and K.N.N.; investigation, K.P., S.S., V.J., and G.D.; resources, K.P. and S.S.; data curation, K.P., K.S., V.J., K.N.N.; writing—original-draft preparation, K.P.; writing—review and editing, K.P., S.S., K.S., K.N.N., V.J., G.D., and I.M.N.; project administration, K.P.; funding acquisition, K.P. All authors have read and agreed to the published version of the manuscript.

Funding

This research was supported by the Indo-German Centre for Sustainability (IGCS) funded by the German Academic Exchange Service (DAAD). We also acknowledge the Federal Ministry of Education and Research (BMBF) and the Indian Institute of Technology Madras, Chennai, for financial support. The publication of this article was funded by the Open Access Fund of the Leibniz Association.

Acknowledgments

The authors are very grateful to Jayakumar Renganathan, who joined and supported some parts of the fieldwork, and also offered inspiring and important input to the first draft of the manuscript. Moreover, we would like to thank Jenny Fabian for help with the statistical analysis and Senthil Kumar for molecular biology advice to revise the material and methods part. We also thank two anonymous reviewers for their helpful comments to improve the manuscript.

Conflicts of Interest

The authors declare no conflict of interest.

References

  1. Ramakrishnaiah, C.R.; Sadashivaiah, C.; Ranganna, G. Assessment of Water Quality Index for the Groundwater in Tumkur Taluk, Karnataka State, India. J. Chem. 2009, 6, 523–530. [Google Scholar] [CrossRef] [Green Version]
  2. Ridoutt, B.G.; Pfister, S. A revised approach to water footprinting to make transparent the impacts of consumption and production on global freshwater scarcity. Glob. Environ. Chang. Hum. Policy Dimens. 2010, 20, 113–120. [Google Scholar] [CrossRef]
  3. Gheewala, S.H.; Silalertruksa, T.; Nilsalab, P.; Mungkung, R.; Perret, S.R.; Chaiyawannakarn, N. Implications of the biofuels policy mandate in Thailand on water: The case of bioethanol. Bioresour. Technol. 2013, 150, 457–465. [Google Scholar] [CrossRef] [PubMed]
  4. Downing, J.A.; Prairie, Y.T.; Cole, J.J.; Duarte, C.M.; Tranvik, L.J.; Striegl, R.G.; McDowell, W.H.; Kortelainen, P.; Caraco, N.F.; Melack, J.M.; et al. The global abundance and size distribution of lakes, ponds, and impoundments. Limnol. Oceanogr. 2006, 51, 2388–2397. [Google Scholar] [CrossRef] [Green Version]
  5. Singh, P.; Yadava, M.G.; Ahmad, M.Z.; Mohapatra, P.P.; Laskar, A.H.; Doradla, S.; Saravanavel, J.; Kumanan, C.J. Fertile farmlands in Cauvery delta: Evolution through LGM. Curr. Sci. 2015, 108, 218–225. [Google Scholar]
  6. Balakrishna, K.; Rath, A.; Praveenkumarreddy, Y.; Guruge, K.S.; Subedi, B. A review of the occurrence of pharmaceuticals and personal cue products in Indian water bodies. Ecotoxicol. Environ. Saf. 2017, 137, 113–120. [Google Scholar] [CrossRef] [Green Version]
  7. Cole, J.J.; Prairie, Y.T.; Caraco, N.F.; McDowell, W.H.; Tranvik, L.J.; Striegl, R.G.; Duarte, C.M.; Kortelainen, P.; Downing, J.A.; Middelburg, J.J.; et al. Plumbing the global carbon cycle: Integrating inland waters into the terrestrial carbon budget. Ecosystems 2007, 10, 171–184. [Google Scholar] [CrossRef] [Green Version]
  8. Battin, T.J.; Luyssaert, S.; Kaplan, L.A.; Aufdenkampe, A.K.; Richter, A.; Tranvik, L.J. The boundless carbon cycle. Nat. Geosci. 2009, 2, 598–600. [Google Scholar] [CrossRef]
  9. Tranvik, L.J.; Downing, J.A.; Cotner, J.B.; Loiselle, S.A.; Striegl, R.G.; Ballatore, T.J.; Dillon, P.; Finlay, K.; Fortino, K.; Knoll, L.B.; et al. Lakes and reservoirs as regulators of carbon cycling and climate. Limnol. Oceanogr. 2009, 54, 2298–2314. [Google Scholar] [CrossRef] [Green Version]
  10. Raymond, P.A.; Hartmann, J.; Lauerwald, R.; Sobek, S.; McDonald, C.; Hoover, M.; Butman, D.; Striegl, R.; Mayorga, E.; Humborg, C.; et al. Global carbon dioxide emissions from inland waters. Nature 2013, 503, 355–359. [Google Scholar] [CrossRef] [Green Version]
  11. Wen, Y.R.; Schoups, G.; van de Giesen, N. Organic pollution of rivers: Combined threats of urbanization, livestock farming and global climate change. Sci. Rep. 2017, 7. [Google Scholar] [CrossRef] [Green Version]
  12. Bodmer, P.; Heinz, M.; Pusch, M.T.; Singer, G.; Premke, K. Carbon dynamics and their link to DOM quality across contrasting stream ecosystems. Sci. Total Environ. 2016, 553, 574–586. [Google Scholar] [CrossRef] [PubMed]
  13. Attermeyer, K.; Flury, S.; Jayakumar, R.; Fiener, P.; Steger, K.; Arya, V.; Wilken, F.; van Geldern, R.; Premke, K. Invasive floating macrophytes reduce greenhouse gas emissions from a small tropical lake. Sci. Rep. 2016, 6. [Google Scholar] [CrossRef] [PubMed]
  14. Gudasz, C.; Bastviken, D.; Steger, K.; Premke, K.; Sobek, S.; Tranvik, L.J. Temperature-controlled organic carbon mineralization in lake sediments. Nature 2010, 466, 478–481. [Google Scholar] [CrossRef] [PubMed]
  15. Sobek, S.; Durisch-Kaiser, E.; Zurbruegg, R.; Wongfun, N.; Wessels, M.; Pasche, N.; Wehrli, B. Organic carbon burial efficiency in lake sediments controlled by oxygen exposure time and sediment source. Limnol. Oceanogr. 2009, 54, 2243–2254. [Google Scholar] [CrossRef] [Green Version]
  16. Regnier, P.; Friedlingstein, P.; Ciais, P.; Mackenzie, F.T.; Gruber, N.; Janssens, I.A.; Laruelle, G.G.; Lauerwald, R.; Luyssaert, S.; Andersson, A.J.; et al. Anthropogenic perturbation of the carbon fluxes from land to ocean. Nat. Geosci. 2013, 6, 597–607. [Google Scholar] [CrossRef]
  17. Selvam, B.P.; Natchimuthu, S.; Arunachalam, L.; Bastviken, D. Methane and carbon dioxide emissions from inland waters in India—Implications for large scale greenhouse gas balances. Glob. Chang. Biol. 2014, 20, 3397–3407. [Google Scholar] [CrossRef] [Green Version]
  18. Sommer, U.; Gliwicz, Z.M.; Lampert, W.; Duncan, A. The Peg-model of Seasonal Succession of Planktonic Events in Fresh Waters. Archiv. Fur. Hydrobiol. 1986, 106, 433–471. [Google Scholar]
  19. Crump, B.C.; Kling, G.W.; Bahr, M.; Hobbie, J.E. Bacterioplankton community shifts in an arctic lake correlate with seasonal changes in organic matter source. Appl. Environ. Microbiol. 2003, 69, 2253–2268. [Google Scholar] [CrossRef] [Green Version]
  20. Ibekwe, A.M.; Leddy, M.B.; Bold, R.M.; Graves, A.K. Bacterial community composition in low-flowing river water with different sources of pollutants. FEMS Microbiol. Ecol. 2012, 79, 155–166. [Google Scholar] [CrossRef] [Green Version]
  21. Zhang, C.; Nie, S.; Liang, J.; Zeng, G.M.; Wu, H.P.; Hua, S.S.; Liu, J.Y.; Yuan, Y.J.; Xiao, H.B.; Deng, L.J.; et al. Effects of heavy metals and soil physicochemical properties on wetland soil microbial biomass and bacterial community structure. Sci. Total Environ. 2016, 557, 785–790. [Google Scholar] [CrossRef] [PubMed]
  22. Sirota, J.; Baiser, B.; Gotelli, N.J.; Ellison, A.M. Organic-matter loading determines regime shifts and alternative states in an aquatic ecosystem. Proc. Natl. Acad. Sci. USA 2013, 110, 7742–7747. [Google Scholar] [CrossRef] [PubMed] [Green Version]
  23. Baquero, F.; Martinez, J.L.; Canton, R. Antibiotics and antibiotic resistance in water environments. Curr. Opin. Biotechnol. 2008, 19, 260–265. [Google Scholar] [CrossRef]
  24. Skariyachan, S.; Mahajanakatti, A.B.; Grandhi, N.J.; Prasanna, A.; Sen, B.; Sharma, N.; Vasist, K.S.; Narayanappa, R. Environmental monitoring of bacterial contamination and antibiotic resistance patterns of the fecal coliforms isolated from Cauvery River, a major drinking water source in Karnataka, India. Environ. Monit. Assess. 2015, 187. [Google Scholar] [CrossRef] [PubMed]
  25. Krishnaswamy, J.; Baruah, A.; Wickramasinghe, N.; Srinivas, V. Beyond the Tsunami: Trends and Patterns in Hydrology and Water Quality in Coastal Ecosystems and Upstream Catchments in Tamil Nadu, India; UNDP/UNTRS, Chennai and ATREE: Bangalore, India, 2008; p. 74. [Google Scholar]
  26. Drozd, J.; Novak, J. Headspace gas-analysis by gas-chromatography. J. Chromatogr. 1979, 165, 141–165. [Google Scholar] [CrossRef]
  27. Klindworth, A.; Pruesse, E.; Schweer, T.; Peplles, J.; Quast, C. Evaluation of general 16S ribosomal RNA gene PCR primers for classical and next-generation sequencing-based diversity studies. Nucleic Acids Res. 2013, 41, 1. [Google Scholar] [CrossRef] [PubMed]
  28. Primerlink. Available online: https://support.illumina.com/documents/documentation/chemistry_documentation/16s/16s-metagenomic-library-prep-guide-15044223-b.pdf (accessed on 18 March 2016).
  29. Verma, D.; Srivastava, S.P.; Bhanumati, P.; Kumar Maurya, S.R.; Jain, K.; Kumar, S.; Panwar, S.R.; Sokhi, K.; Ravi Kumar, S.R. Selected Socio-Economic Statistics, India; Social Statistics Division, Central Statistics Office, Ministry of Statistics and Programme Implementation: New Delhi, India, 2017; p. 15.
  30. Li, S.Y.; Bush, R.T. Revision of methane and carbon dioxide emissions from inland waters in India. Glob. Chang. Biol. 2015, 21, 6–8. [Google Scholar] [CrossRef]
  31. Halbedel, S.; Koschorreck, M. Regulation of CO2 emissions from temperate streams and reservoirs. Biogeosciences 2013, 10, 7539–7551. [Google Scholar] [CrossRef] [Green Version]
  32. Rantakari, M.; Kortelainen, P. Interannual variation and climatic regulation of the CO2 emission from large boreal lakes. Glob. Chang. Biol. 2005, 11, 1368–1380. [Google Scholar] [CrossRef]
  33. Roehm, C.L.; Prairie, Y.T.; del Giorgio, P.A. The pCO (2) dynamics in lakes in the boreal region of northern Quebec, Canada. Glob. Biogeochem. Cycles 2009, 23. [Google Scholar] [CrossRef]
  34. Rasera, M.; Krusche, A.V.; Richey, J.E.; Ballester, M.V.R.; Victoria, R.L. Spatial and temporal variability of pCO (2) and CO2 efflux in seven Amazonian Rivers. Biogeochemistry 2013, 116, 241–259. [Google Scholar] [CrossRef]
  35. Zhai, W.D.; Dai, M.H.; Cai, W.J.; Wang, Y.C.; Wang, Z.H. High partial pressure of CO2 and its maintaining mechanism in a subtropical estuary: The Pearl River estuary, China. Mar. Chem. 2005, 93, 21–32. [Google Scholar] [CrossRef]
  36. Weyhenmeyer, G.A.; Kosten, S.; Wallin, M.B.; Tranvik, L.J.; Jeppesen, E.; Roland, F. Significant fraction of CO2 emissions from boreal lakes derived from hydrologic inorganic carbon inputs. Nat. Geosci. 2015, 8, 933–936. [Google Scholar] [CrossRef]
  37. Hotchkiss, E.R.; Hall, R.O.; Sponseller, R.A.; Butman, D.; Klaminder, J.; Laudon, H.; Rosvall, M.; Karlsson, J. Sources of and processes controlling CO2 emissions change with the size of streams and rivers. Nat. Geosci. 2015, 8, 696–699. [Google Scholar] [CrossRef]
  38. Marce, R.; Obrador, B.; Morgui, J.-A.; Lluis Riera, J.; Lopez, P.; Armengol, J. Carbonate weathering as a driver of CO2 supersaturation in lakes. Nat. Geosci. 2015, 8, 107–111. [Google Scholar] [CrossRef]
  39. Reeburgh, W.S. Oceanic methane biogeochemistry. Chem. Rev. 2007, 107, 486–513. [Google Scholar] [CrossRef] [Green Version]
  40. Ferry, J.G. How to Make a Living by Exhaling Methane. Annu. Rev. Microbiol. 2010, 64, 453–473. [Google Scholar] [CrossRef]
  41. McGinnis, D.F.; Bilsley, N.; Schmidt, M.; Fietzek, P.; Bodmer, P.; Premke, K.; Lorke, A.; Flury, S. Deconstructing Methane Emissions from a Small Northern European River: Hydrodynamics and Temperature as Key Drivers. Environ. Sci. Technol. 2016, 50, 11680–11687. [Google Scholar] [CrossRef]
  42. Richey, J.E.; Devol, A.H.; Wofsy, S.C.; Victoria, R.; Riberio, M.N.G. Biogenic gases and the oxidation and reduction of carbon in Amazon River and floodplain waters. Limnol. Oceanogr. 1988, 33, 551–561. [Google Scholar] [CrossRef]
  43. Jones, J.B.; Mulholland, P.J. Influence of drainage basin topography and elevation on carbon dioxide and methane supersaturation of stream water. Biogeochemistry 1998, 40, 57–72. [Google Scholar] [CrossRef]
  44. Matousu, A.; Rulik, M.; Tuser, M.; Bednarik, A.; Simek, K.; Bussmann, I. Methane dynamics in a large river: A case study of the Elbe River. Aquat. Sci. 2019, 81. [Google Scholar] [CrossRef]
  45. Pattanaik, J.K.; Balakrishnan, S.; Bhutani, R.; Singh, P. Estimation of weathering rates and CO2 drawdown based on solute load: Significance of granulites and gneisses dominated weathering in the Kaveri River basin, Southern India. Geochim. Cosmochim. Acta 2013, 121, 611–636. [Google Scholar] [CrossRef]
  46. Kulandaivel, A.R.K.; Kumar, P.E.; Perumaland, V.; Magudeswaran, P.N. Water Quality Index of River Cauvery at Erode Region, Tamilnadu, India. Nat. Environ. Pollut. Technol. 2009, 8, 343–346. [Google Scholar]
  47. Gowda, A.; Srikantaswamy, S.; Rajasekhara Reddy, K.; Abhilash, M.R.; Shiva Kumar, D.; Jagadish, K. Impact of Anthropological Activities on the Water Quality of Cauvery River, Karnataka, India. Int. J. Res. Sci. Innov. 2016, 3, 6–15. [Google Scholar]
  48. Krishna, M.S.; Prasad, M.H.K.; Rao, D.B.; Viswanadham, R.; Sarma, V.; Reddy, N.P.C. Export of dissolved inorganic nutrients to the northern Indian Ocean from the Indian monsoonal rivers during discharge period. Geochim. Cosmochim. Acta 2016, 172, 430–443. [Google Scholar] [CrossRef]
  49. Beshiru, A.; Okareh, O.T.; Chigor, V.N.; Igbinosa, E.O. Assessment of water quality of rivers that serve as water sources for drinking and domestic functions in rural and pre-urban communities in Edo North, Nigeria. Environ. Monit. Assess. 2018, 190, 12. [Google Scholar] [CrossRef]
  50. Odey, M.O.; Ibor, O.R.; Andem, A.B.; Ettah, I.; Chukwuka, A.V. Drinking water quality and risk implications for community health: A case study of shallow water wells and boreholes in three major communities in Northern Cross-River, Southern Nigeria. Hum. Ecol. Risk Assess. 2018, 24, 427–444. [Google Scholar] [CrossRef]
  51. Dahunsi, S.O.; Owamah, H.I.; Ayandiran, T.A.; Oranusi, S.U. Drinking Water Quality and Public Health of Selected Towns in South Western Nigeria. Water Qual. Expo. Health 2014, 6, 143–153. [Google Scholar] [CrossRef] [Green Version]
  52. Li, W.C. Occurrence, sources, and fate of pharmaceuticals in aquatic environment and soil. Environ. Pollut. 2014, 187, 193–201. [Google Scholar] [CrossRef]
  53. Panda, A.; Pradhan, S.; Mohapatra, G.; Mohapatra, J. Drug-related problems associated with self-medication and medication guided by prescription: A pharmacy-based survey. Indian J. Pharmacol. 2016, 48, 515–521. [Google Scholar] [CrossRef] [Green Version]
  54. Yoon, Y.; Ryu, J.; Oh, J.; Choi, B.G.; Snyder, S.A. Occurrence of endocrine disrupting compounds, pharmaceuticals, and personal care products in the Han River (Seoul, South Korea). Sci. Total Environ. 2010, 408, 636–643. [Google Scholar] [CrossRef] [PubMed]
  55. Togola, A.; Budzinski, H. Analytical development for analysis of pharmaceuticals in water samples by SPE and GC-MS. Anal. Bioanal. Chem. 2007, 388, 627–635. [Google Scholar] [CrossRef]
  56. Patrolecco, L.; Ademollo, N.; Grenni, P.; Tolomei, A.; Caracciolo, A.B.; Capri, S. Simultaneous determination of human pharmaceuticals in water samples by solid phase extraction and HPLC with UV-fluorescence detection. Microchem. J. 2013, 107, 165–171. [Google Scholar] [CrossRef]
  57. Shanmugam, G.; Sampath, S.; Selvaraj, K.K.; Larsson, D.G.J.; Ramaswamy, B.R. Non-steroidal anti-inflammatory drugs in Indian rivers. Environ. Sci. Pollut. Res. 2014, 21, 921–931. [Google Scholar] [CrossRef] [PubMed]
  58. Kim, J.W.; Jang, H.S.; Kim, J.G.; Ishibashi, H.; Hirano, M.; Nasu, K.; Ichikawa, N.; Takao, Y.; Shinohara, R.; Arizono, K. Occurrence of Pharmaceutical and Personal Care Products (PPCPs) in Surface Water from Mankyung River, South Korea. J. Health Sci. 2009, 55, 249–258. [Google Scholar] [CrossRef] [Green Version]
  59. Mutiyar, P.K.; Gupta, S.K.; Mittal, A.K. Fate of pharmaceutical active compounds (PhACs) from River Yamuna, India: An ecotoxicological risk assessment approach. Ecotoxicol. Environ. Saf. 2018, 150, 297–304. [Google Scholar] [CrossRef]
  60. Fram, M.S.; Belitz, K. Occurrence and concentrations of pharmaceutical compounds in groundwater used for public drinking-water supply in California. Sci. Total Environ. 2011, 409, 3409–3417. [Google Scholar] [CrossRef] [Green Version]
  61. Agunbiade, F.O.; Moodley, B. Pharmaceuticals as emerging organic contaminants in Umgeni River water system, KwaZulu-Natal, South Africa. Environ. Monit. Assess. 2014, 186, 7273–7291. [Google Scholar] [CrossRef]
  62. Ebele, A.J.; Abdallahab, M.A.-E.; Harrad, S. Pharmaceuticals and personal care products (PPCPs) in the freshwater aquatic environment. Emerg. Contam. 2017, 3, 1–16. [Google Scholar] [CrossRef]
  63. Ma, L.L.; Mao, G.N.; Liu, J.; Gao, G.H.; Zou, C.L.; Bartlam, M.G.; Wang, Y.Y. Spatial-Temporal Changes of Bacterioplankton Community along an Exhorheic River. Front. Microbiol. 2016, 7. [Google Scholar] [CrossRef] [Green Version]
  64. Zhang, M.L.; Yu, N.; Chen, L.Q.; Jiang, C.H.; Tao, Y.J.; Zhang, T.; Chen, J.; Xue, D. Structure and seasonal dynamics of bacterial communities in three urban rivers in China. Aquat. Sci. 2012, 74, 113–120. [Google Scholar] [CrossRef]
  65. Carney, R.L.; Mitrovic, S.M.; Jeffries, T.; Westhorpe, D.; Curlevski, N.; Seymour, J.R. River bacterioplankton community responses to a high inflow event. Aquat. Microb. Ecol. 2015, 75, 187–205. [Google Scholar] [CrossRef]
  66. Glockner, F.O.; Zaichikov, E.; Belkova, N.; Denissova, L.; Pernthaler, J.; Pernthaler, A.; Amann, R. Comparative 16S rRNA analysis of lake bacterioplankton reveals globally distributed phylogenetic clusters including an abundant group of actinobacteria. Appl. Environ. Microbiol. 2000, 66, 5053–5065. [Google Scholar] [CrossRef] [PubMed] [Green Version]
  67. Zwart, G.; Crump, B.C.; Agterveld, M.; Hagen, F.; Han, S.K. Typical freshwater bacteria: An analysis of available 16S rRNA gene sequences from plankton of lakes and rivers. Aquat. Microb. Ecol. 2002, 28, 141–155. [Google Scholar] [CrossRef] [Green Version]
  68. Zwart, G.; Hiorns, W.D.; Methe, B.A.; Van Agterveld, M.P.; Huismans, R.; Nold, S.C.; Zehr, J.P.; Laanbroek, H.J. Nearly identical 16S rRNA sequences recovered from lakes in North America and Europe indicate the existence of clades of globally distributed freshwater bacteria. Syst. Appl. Microbiol. 1998, 21, 546–556. [Google Scholar] [CrossRef] [Green Version]
  69. Roberto, A.A.; Van Gray, J.B.; Leff, L.G. Sediment bacteria in an urban stream: Spatiotemporal patterns in community composition. Water Res. 2018, 134, 353–369. [Google Scholar] [CrossRef]
  70. Ryan, R.P.; Vorholter, F.J.; Potnis, N.; Jones, J.B.; Van Sluys, M.A.; Bogdanove, A.J.; Dow, J.M. Pathogenomics of Xanthomonas: Understanding bacterium-plant interactions. Nat. Rev. Microbiol. 2011, 9, 344–355. [Google Scholar] [CrossRef]
  71. Liu, Z.; Hunag, S.; Sun, G.; Xu, Z.; Xu, M. Phytoplanktonic diversity, composition and distribution of bacterioplankton community in the Dongjiang River, China. FEMS Microbiol. Ecol. 2012, 80, 30–44. [Google Scholar] [CrossRef] [Green Version]
  72. Li, D.; Yang, M.; Li, Z.L.; Qi, R.; He, J.Z.; Liu, H.J. Change of bacterial communities in sediments along Songhua River in Northeastern China after a nitrobenzene pollution event. FEMS Microbiol. Ecol. 2008, 65, 494–503. [Google Scholar] [CrossRef] [PubMed]
  73. Lopes, F.A.C.; Catao, E.C.P.; Santana, R.H.; Cabral, A.D.; Paranhos, R.; Rangel, T.P.; de Rezende, C.E.; Edwards, R.A.; Thompson, C.C.; Thompson, F.L.; et al. Microbial Community Profile and Water Quality in a Protected Area of the Caatinga Biome. PLoS ONE 2016, 11. [Google Scholar] [CrossRef] [Green Version]
  74. Fang, H.; Cai, L.; Yang, Y.; Ju, F.; Li, X.D.; Yu, Y.L.; Zhang, T. Metagenomic analysis reveals potential biodegradation pathways of persistent pesticides in freshwater and marine sediments. Sci. Total Environ. 2014, 470, 983–992. [Google Scholar] [CrossRef] [PubMed]
  75. Hahn, M.W.; Lang, E.; Brandt, U.; Lunsdorf, H.; Wu, Q.L.; Stackebrandt, E. Polynucleobacter cosmopolitanus sp nov., free-living planktonic bacteria inhabiting freshwater lakes and rivers. Int. J. Syst. Evol. Microbiol. 2010, 60, 166–173. [Google Scholar] [CrossRef] [PubMed]
  76. Hahn, M.W.; Lang, E.; Brandt, U.; Wu, Q.L.; Scheuerl, T. Emended description of the genus Polynucleobacter and the species Polynucleobacter necessarius and proposal of two subspecies, P. necessarius subsp. necessarius subsp nov and P. necessarius subsp asymbioticus subsp nov. Int. J. Syst. Evol. Microbiol. 2009, 59, 2002–2009. [Google Scholar] [CrossRef] [PubMed] [Green Version]
Figure 1. Map of study sites in Karnataka and Tamil Nadu, India, surface-water sampling locations (red circle), and station numbers along the river course. Station names are given in Table 1. Station 1 is the source; Station 23 at river delta. Pharmaceuticals were taken at the following stations only: 2, 9, 10, and 11. Only critical, large waste water treatment plant WWTPs are shown.
Water 12 01354 g001
Figure 2. The Cauvery River and its different geomorphology, structure, and human use along the river: The numbers in the pictures present station numbers. Stations 1 (Tala Kaveri, source of the Cauvery River), 2 (Bhagamandala), 3 (Kondangeri), 10 (Shivana-samudra), 15 (Parmathy Velur), 16 (Mohanur), 19 (Trichy), and 20 (Grand Anaicut (Cauvery River discharge)) illustrate differences in regulation, vegetation, sediment character, width, depth, and human impact. Station 1 is a place of highly frequented pilgrimage; at Station 10, people clean their industry bags; at Station 16, people wash clothes; Station 20 is used for recreational purposes.
Water 12 01354 g002
Figure 3. Spatial distribution of (a) pCH4 (triangle); (b) pCO2 (white circle); (c) dissolved oxygen (DO, black circle) and electrical conductivity (EC, open squares); and (d) pH and elevation along the Cauvery River from the source to the river mouth. White numbers in black circles indicate station numbers in the pH line, line with crosses indicates elevation above the mean sea level along the entire river. The river stretch is divided into two large plateaus on the basis of topography, Mysore Plateau and Tamil Nadu Plain; the latter extends after Mettur Dam. The four vertical green lines characterize four large dams built in the Cauvery River: I: Krishnarajasagara, II: Mettur, III: Mukkombu, and IV: Grand Anaicut. The dashed horizontal line represents the mean value for the atmospheric equilibrium of CO2 (12.1 μmol L−1) and of CH4 (0.0026 μmol L−1). Standard deviations are given for pCO2 and pCH4.
Water 12 01354 g003
Figure 4. Most abundant pharmaceuticals found in water at five different stations of the Cauvery River. (a) Carbamazepine, triclosan, propyl paraben (preservatives), and phenol are essential for the production of polycarbonates, detergents, herbicides, and pharmaceutical drugs; (b) Pharmaceuticals used as an analgesic, antipyretic (Ibuprofen, Paracetamol), anti-inflammatory (Ibuprofen), and non-steroidal anti-inflammatory drugs (NSAIDS) for rheumatic, analgesic, and antipyretic treatments (Naproxen) and analgesic and anti-inflammatory application (Diclofenac). Pharmaceuticals of station 1 were below the detection limit and, therefore, not included in the figure.
Water 12 01354 g004
Figure 5. (a) Relative abundance of bacterial phyla at 17 stations along the Cauvery River. Others comprised rare phyla with less than 0.5% of the total bacterial community in a given sample; (b) relative abundance of potential pathogen bacterial in 17 stations along the Cauvery River (beta-proteobacteria: Comamonadaceae; gamma-proteobacteria: Enterobacteriales, Legionellales, Xanthomonadales).
Water 12 01354 g005
Table 1. Number, name, district, state (to which each station belongs), geographical coordinates (latitude and longitude), distance (of other stations from Station 1, point of origin), elevation (in m a.s.l.), place of importance, temperature (°C), dissolved inorganic carbon concentration (DIC, mmol L−1), and total organic carbon concentration (TOC, mg L−1) of each station along the Cauvery River basin, India, during winter (January 2016). TN = Tamil Nadu; KA = Karnataka; St-No = station number; DfS = Distance from Source (in km); NA = Not available.
Station No.Station NameStateCoordinatesDfS (km)El (m)Place of ImportanceT (°C)DIC (μmol L−1)TOC (mg L−1)
LatitudeLongitude
1Tala KaveriKA12.42906575.77885101260Source, Pilgrimage, Touristic spot22.5671.9 ± 184.615.7
2BhagamandalaKA12.38440675.53370327881Pilgrimage20.7706.49 ± 94.111.1
3KondangeriKA12.30257675.79315957863Small village23.7565.69 ± 160.310.8
4SiddapuraKA12.30552475.86861765849Taluk head quarters23.71052.29 ± 80.58.8
5KaniveKA12.50836975.96223390822Small village241161.79 ± 21729.0
6YedathoreKA12.46803576.391969137749Small village24.12948.59 ± 131.611.9
7HonnavalliKA12.41889376.480502148751Taluk head quarters25.12891.09 ± 249.110.7
8KRS DamKA12.42488476.581608159734Reservoir, touristic spot24.32255.29 ± 193.410.8
9T. NarasipuraKA12.22521576.908996200666Pilgrimage, Touristic spot, confluence of 3 rivers25.62885.6 ± 108.917.2
10Shivana-samudraKA12.26044777.170415229619Touristic spot25.734629 ± 120.813.6
11Mettur DamTN11.79718277.807326401198Reservoir, touristic spot26.11347.49 ± 205.316.7
12BhavaniTN11.43178977.682326444165Municipal town27.81245.4 ± 250.811.4
13PallipalayamTN1.13650377.740134454159Municipal town281127.69 ± 100.610.6
14UnjalurTN11.12892577.879335484142Panchayat town28.41216.69 ± 654.35.9
15Paramathy VelurTN11.09479978.006123498116Town29.5918.89 ± 180.713.1
16MohanurTN11.05245878.135368513110Panchayat town28.61083.49 ± 365.711.0
17KulithalaiTN10.94618178.41933756888Town26.91260.09 ± 849.77.5
18JeeyapuramTN10.87391478.61368861474Village28.71541.59 ± 17912.8
19TrichyTN10.84027778.71436962566District head quarters29.62970.89 ± 1468.8
20Grand AnaicutTN10.8315847.88205263760Reservoir & touristic spot28.6913399 ± 270.917.9
21ThiruvaiyaruTN10.87910679.10973165243Panchayat town30.31672.2 ± 116.312.2
22Melacavery, KumbakonamTN10.966.26479.365.66568231Municipal town28.61422.5 ± 82.46.2
23Chettimandapam, KumbakonamTN10.979.20879.400.20168628Municipal town28.22009.6 ± 3798.6
Table 2. Spearman’s rank correlation coefficients between the measured variables at sampling stations along the Cauvery River basin during January 2016. Distance refers to the distance from the source.
ParameterDistancepHTempDOECTOCDICpCO2pCH4
Distance1
pH0.67 **1
Temp0.91 **0.72 **1
DO0.050.62 **0.181
EC0.89 **0.60 **0.91 **0.051
TOC−0.27–0.07–0.180.04–0.141
DIC0.350.54 **0.280.330.22–0.001
pCO2−0.47 *–0.76 **–0.47 **–0.68 **–0.26–0.03–0.391
pCH40.03−0.38−0.08–0.63 **0.01–0.18–0.110.401
** Correlation was significant at 0.01 level (two-tailed). * Correlation was significant at 0.05 level (two-tailed).
Table 3. Relative abundances (%) of different classes of Proteobacteria for stations (S) 1 through 23 along the Cauvery River.
PhylaProteobacteria
ClassS1S2S3S4S5S6S8S10S11S12S13S16S18S19S20S22S23Median
Alpha9.50.52.30.52.213.50.43.92.33.13.41.72.53.71.63.12.3
Beta70.229.662.366.552.254.315.649.636.942.835.940.445.13840.54734.742.8
Gamma2.31.511.12.73.34.624.515.5161518.87.4177.23.17.87.2
Delta0.20.50.700.301.9000.10.20.300.50.7010.2