Article

Pressure Regulation vs. Water Aging in Water Distribution Networks

by
Menelaos Patelis
,
Vasilis Kanakoudis
* and
Anastasia Kravvari
Civil Engineering Department, University of Thessaly, 38221 Volos, Greece
*
Author to whom correspondence should be addressed.
Water 2020, 12(5), 1323; https://doi.org/10.3390/w12051323
Submission received: 22 February 2020 / Revised: 26 April 2020 / Accepted: 1 May 2020 / Published: 7 May 2020
(This article belongs to the Special Issue Insights on the Water–Energy–Food Nexus)

Abstract

:
In this paper, the effects of pressure regulation in a water distribution network (WDN) are being examined. Quality is hammered the most when pressure is reduced in a WDN and this occurs due to the increase in the age of water flowing inside the network pipes (water age is actually the total time the water remains inside the pipes before reaching the customer’s tap). Kos town WDN is used as the case study network. Kos town is the capital of the homonymous Greek island, among the most famous and popular of the Greek islands. The specific WDN is quite typical but very interesting, as it is extended along the seafront. The network’s hydraulic simulation model was developed through the WaterCad V8i software. As Kos experiences too high-water demand peaks and lows during summer and winter time, respectively, its WDN has already been thoroughly studied, in order to regulate the pressure and reduce its annual water loss rates. Nevertheless, these scenarios have never been examined regarding the impact on water quality. In the current study, the division of the WDN in District Metered Areas (DMAs) and the use of a Pressure Reducing Valve (PRV) in the entering node of each DMA are being evaluated in terms of water age. Additionally, a swift optimization process takes place to produce different DMAs’ borders, based on the criteria of minimum nodal water age, instead of optimal pressure. Different scenarios were tested on the calibrated and validated hydraulic model of Kos town WDN.

1. Introduction

Dividing a water distribution network (WDN) into District Metered Areas (DMAs), along with the use of Pressure Reduction Valves (PRVs) at the entering node of each DMA, are the most common first steps towards pressure management in a WDN [1,2,3,4,5,6]. As the operating pressure in a WDN decreases, a part of the water demand (denoted as Pressure Dependent Demand (PDD)), along with the real losses, decrease too, leading to reduced System Input Volume (SIV) (i.e., the water volume entering the WDN) [7,8,9,10,11,12]. Studies have already proved that pressure control has a positive impact on the network’s economic life (reduced real losses due to reduced leaks result in reduced actual breaks) and general need of action for the water utilities, as presented in some papers [13,14,15,16,17]. Many optimization techniques (Genetic Algorithms; Hybrid Algorithms; Geometric Partitioning; Gaussian Mixture Models; etc.) have been developed to assist in pressure management through the optimal formation of DMAs and the minimization of the number of PRVs and isolation valves used [18,19,20,21,22,23,24,25,26]. The results showed that the SIV may be reduced by as much as 30%–40% along with the rest of the benefits (e.g., reduced failure rates). Therefore, pressure management (PM) is very popular among the water managers to such a degree that a significant part of them is being considered as a panacea. Is it actually like that? What is the catch?
Although pressure management may be considered as a powerful “weapon” in the everlasting battle against real losses, there is though one possible side-effect that seem to be underestimated, neglected or even unnoticed by the majority of researchers and water managers, and needs to be carefully studied. This side-effect has to do with the water age (i.e., the total time the water remains inside the pipes before reaching the customer’s tap) that can be significantly increased following the successful implementation of a PM strategy [23,24]. Water is expected to age faster inside a WDN after forming DMAs, as more pipes lead to dead ends. The decrease in pipe break rates also increases the age of the water flowing inside the pipes, as the water is not being refreshed/renewed since the leaks are being either regularly “plugged” or prevented. On the other hand, leaks may allow pathogens to intrude inside the network, depending on the operational pressure of the network. This is another parameter that should be considered during the implementation of a PM strategy. Additionally, recently installed pipes along with effective pressure control may also drive water to be stagnant in rural areas during the night, as well as in industrial areas when the water demand is minimized during low production periods. Unfortunately, to date, PM optimization methods did not consider water age as a parameter or a restriction during the DMAs’ optimization or WDN’s hydraulic simulation process. To date, only a few studies dealt with the water aging factor in a WDN [23,24,25,26,27,28,29,30,31,32,33,34]. There are not though any thorough analyses combining the water aging and the chlorination rates. Previous studies have considered the correlation of pressure and water age [32,33], but none have extensively studied the possible impacts of PM measures implemented on the water age (WA). The current study, utilizing the existing calibrated hydraulic simulation model of Kos town WDN [35,36], tests already developed PM scenarios [6,13,34] introducing as optimization factors (and constraints) both the water age and the residual chlorine [37].

2. Case Study Network

Kos Town, birthplace of Hippocrates, father of modern medicine, is the capital of the homonymous Greek Island (the fourth most popular summer destination in Greece), in the Aegean Sea. Thus, although its population during winter is about 20,000 people, it grows to over 60,000 in summer. DEYAK is the local municipal water utility responsible for the day-to-day operation of the entire water supply chain (from the water resources up to the customers’ taps and back to the environment through the wastewater treatment plant). Kos Town WDΝ is widely spread, covering a huge area (Figure 1a). It also supplies water to more than 120 major touristic resorts, each having daily water needs of almost 200 m3. The total daily water demand reaches its peak (12,579 m3) during summer, while is limited to less than half (5927 m3) in winter. Several of the touristic resorts (fully or partially) cover their own summer water needs using licensed private wells. Private water use is registered through 13,000 water meters.
Kos Town was originally a coherent urban area, expanded according to a solid plan since the Italian occupation. The town, back then, was served by a well-designed water supply network. After the war, tourism and the general development of Kos Island led to an extended urbanization, with no provision to construct/expand the necessary water services infrastructure. The extension of the town limits was served by the ad hoc construction of radial type antennas, which had, as a starting point, the original core of the existing WDΝ. Since the 1980s, when the local water utility was founded, targeted efforts were made to correct existing deficiencies by constructing: (a) a central reinforcing loop pipe surrounding the city from the south; (b) two feeding pipelines Ø350 heading to Psalidi and to Lampi settlements; (c) high regional feeding pipeline Ø200 from Platani to Paradisi settlements; (d) extension of the Italian water storage (T1) to increase its capacity; (e) the new two-chamber water storage tank (T2) at Sfageia with a total capacity of 2550 m3; (f) the output pipe Ø550 from the Sfageia tank to the Main South Loop, whose size is reduced at halfway to Ø200; and (g) an automated system for drilling management(Figure 1b).
Kos town WDN is being supplied by 22 drillings pumping water from Vorinas aquifer/spring. Eight of them supply the Sfageia water tank (capacity of 2550 m3; altitude +52 m); five supply the Yperkeimeni water tank (capacity of 500 m3; altitude +72 m)and nine supply the Italian tank along with its later extensions (Greek tanks), (capacity of 1800 m3; altitude +51.70 m). Water from Vorinas spring ends up at a charging well and from there is pumped all the way up to the Yperkeimeni water tank. Its overflows then feed the Italian water tank. Based on the location of the available water tanks, three pressure zones are formed in Kos Town WDN: (a) a limited higher zone with an average operating pressure of 280 kPa; (b) a medium zone at the south (altitude ranging from +30 to +50) with an average operating pressure of 350 kPa and (c) a low zone (covering 95% of the total water demand) with an average operating pressure of 420 kPa; (Figure 1b)
The entire water pipe network has a total length of 64,117 meters, including the water supply mains (15,836.9 m), the water distribution pipes (25,710.9 m) and the customers’ service pipes (22,569.2 m). These pipes are made of PVC (30,412 m), asbestos-cement (20,452 m), cast iron (12,178 m) and steel (1075 m).
Kos town WDN was chosen as a case study not only for its particular topographical characteristics but due to the fact that it is quite old and the intensity of its use varies a lot throughout the year, mainly between its winter low and its summer peak [35,36,38]. The above characteristics demand the pressure control to be optimized in order to control water losses and maximize the available System Input Volume (SIV) for the summer’s peak water demand [38].

3. Hydraulic Model Simulation

The Kos town WDN hydraulic simulation model was developed (in WaterCad software environment) and calibrated in previous studies considering the exact position of the customers’ water meters (using a portable GPS) in order to accurately allocate the water demand at the nodes of the model [34,35]. The water demand in each node was divided into two components (i.e., pressure-dependent demand and volume-dependent demand) in order to consider its variability based on the actual operating pressure at each node. The real (physical) water losses were also allocated at the nodes of the model as a “competitive” use, highly depending on the actual operating pressure at each node. Thus, a reliable calibrated hydraulic simulation model was fully developed where the operating pressure (along with other parameters of the WDN, like the SIV, the flow in the water mains, the chlorine residual) was monitored using the already installed SCADA system. As already mentioned, the WDN is quite old, experiencing high pipe break rates as a result of the excessive pressure necessary to serve the several hotels (more than 120) lying across the sea front, forming an almost linear hydraulic barrier. The local water utility (DEYAK) had no other rational choice than to find a way to efficiently regulate this pressure, protecting the WDN from collapsing, ensuring that all these hotels will be supplied with water in an adequate pressure. Forming DMAs was considered the first step towards this goal. Bearing in mind that the Kos town WDN has a physical border (the sea front), the task of the current study was to optimize the formation of the DMAs considering as design parameters not only the operating pressure (minimization) but also the water age and the chlorine residual. Three virtual scenarios were formed and studied:
  • Scenario No1 (no DMAs_no PRVs): the base scenario with no DMAs formed and no PRVs installed;
  • Scenario No2 (with DMAs_no PRVs): DMAs are formed based on well-known specific criteria (size, population served, topography, physical barriers etc.) [1] in the network by closing some pipes (pipe status = closed) in order to separate the entire network in several sub-areas. No PRVs were installed;
  • Scenario No3 (with DMAs_with PRVs): a PRV is added in the entering node of each DMA to reduce the average pressure in it as much as possible. The reduction accomplished depends on the actual location (i.e., distance from the entering node) of the critical node in each DMA (i.e., the node with the lowest pressure) as, by law, the Water Utility has to supply water at a pressure of at least 200 kPa (same as 2 atm) measured at the level of the customer’s water meter.
These three scenarios are successive steps of an integrated pressure management policy planned to be adopted by the local water utility in order to regulate the operating pressure. The main concern was the impact of these successive steps on the water age and the chlorine residual in the network. Thus, the main idea was to virtually check the gradual implementation of this pressure management policy, planned to be adopted by the local water utility before its actual implementation. At first, the network operates without any DMAs being formed and no PRVs installed. Then, a minimum level of PM is performed by forming DMAs without any PRVs being installed too. The ultimate level of PM takes place when PRVs are installed in an optimal way, based also on the actual field restrictions. In every scenario, the water age and the chlorine residual are being calculated. Kos town water utility chlorinates the water (as obliged by the national legislation), as a method of disinfection. The concentration of the disinfectant in the outlet of the raw water treatment plant is 5 mg/L.

3.1. Water Age Definition

Water Age (WA), a parameter widely used in the hydraulic analysis of a WDN model, measures (represents) the time the water needs to reach each junction (node) of model (network) starting from the water tank, considering that the node is where the actual water consumption takes place. Depending on the level of demand and losses (both are pressure dependent) allocated at each node, WA also integrates the time the water “waits” to be consumed. WA is a well-recognized indicator of the quality of the water flowing inside the WDN. As the WA grows, the quality of the supplied water deteriorates, a statement presented by other researchers as well [32]. Although the WA is indirectly assessed through the WDN’s hydraulic model [23,34], it is proven that, as water travels through the pipes, it undergoes various chemical transformations, negatively affecting its quality. Several of these transformations depend on the velocity of the water flow, the pipes’ material in combination with the “aggressiveness’ of the water (i.e., low PH), the substances being carried along with the water, etc. Nodes reach their age depending on the flow of water through them but also depending on the age of the water reaching them. Finally, WA grows bigger as water stays inside the reservoirs/water tanks or travels through the water aqueducts.

3.2. First Step Analysis and Results

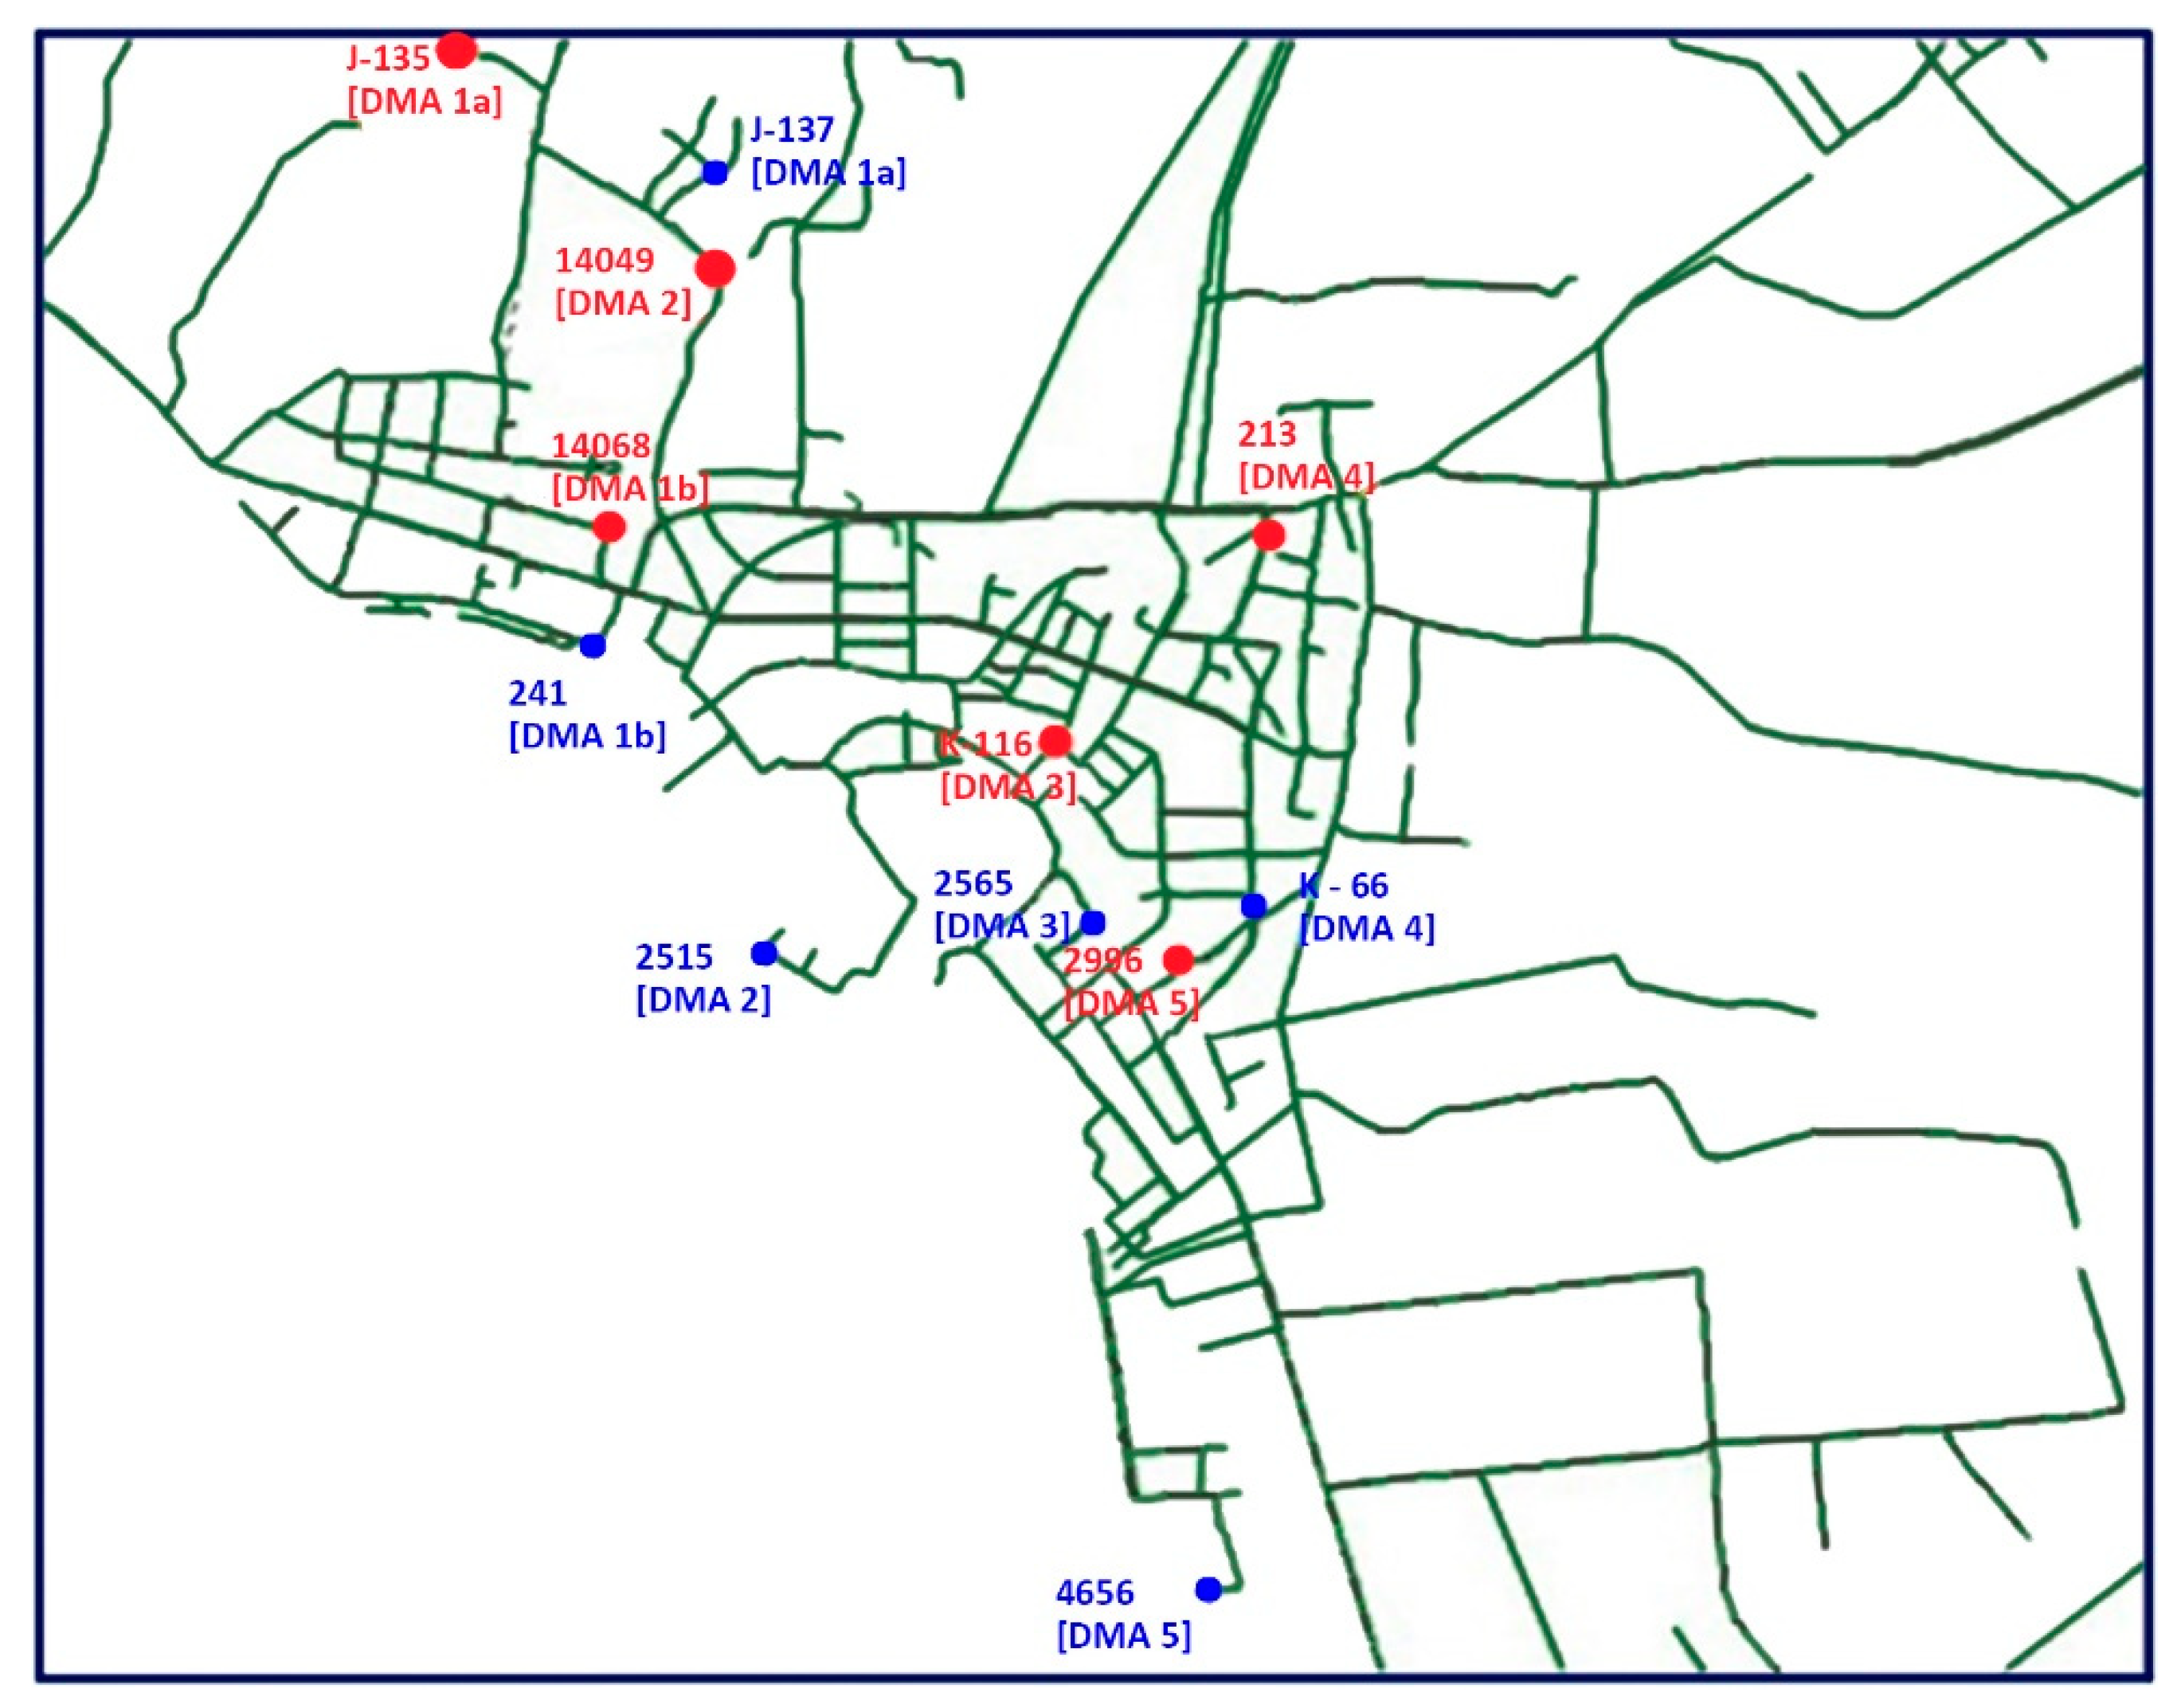
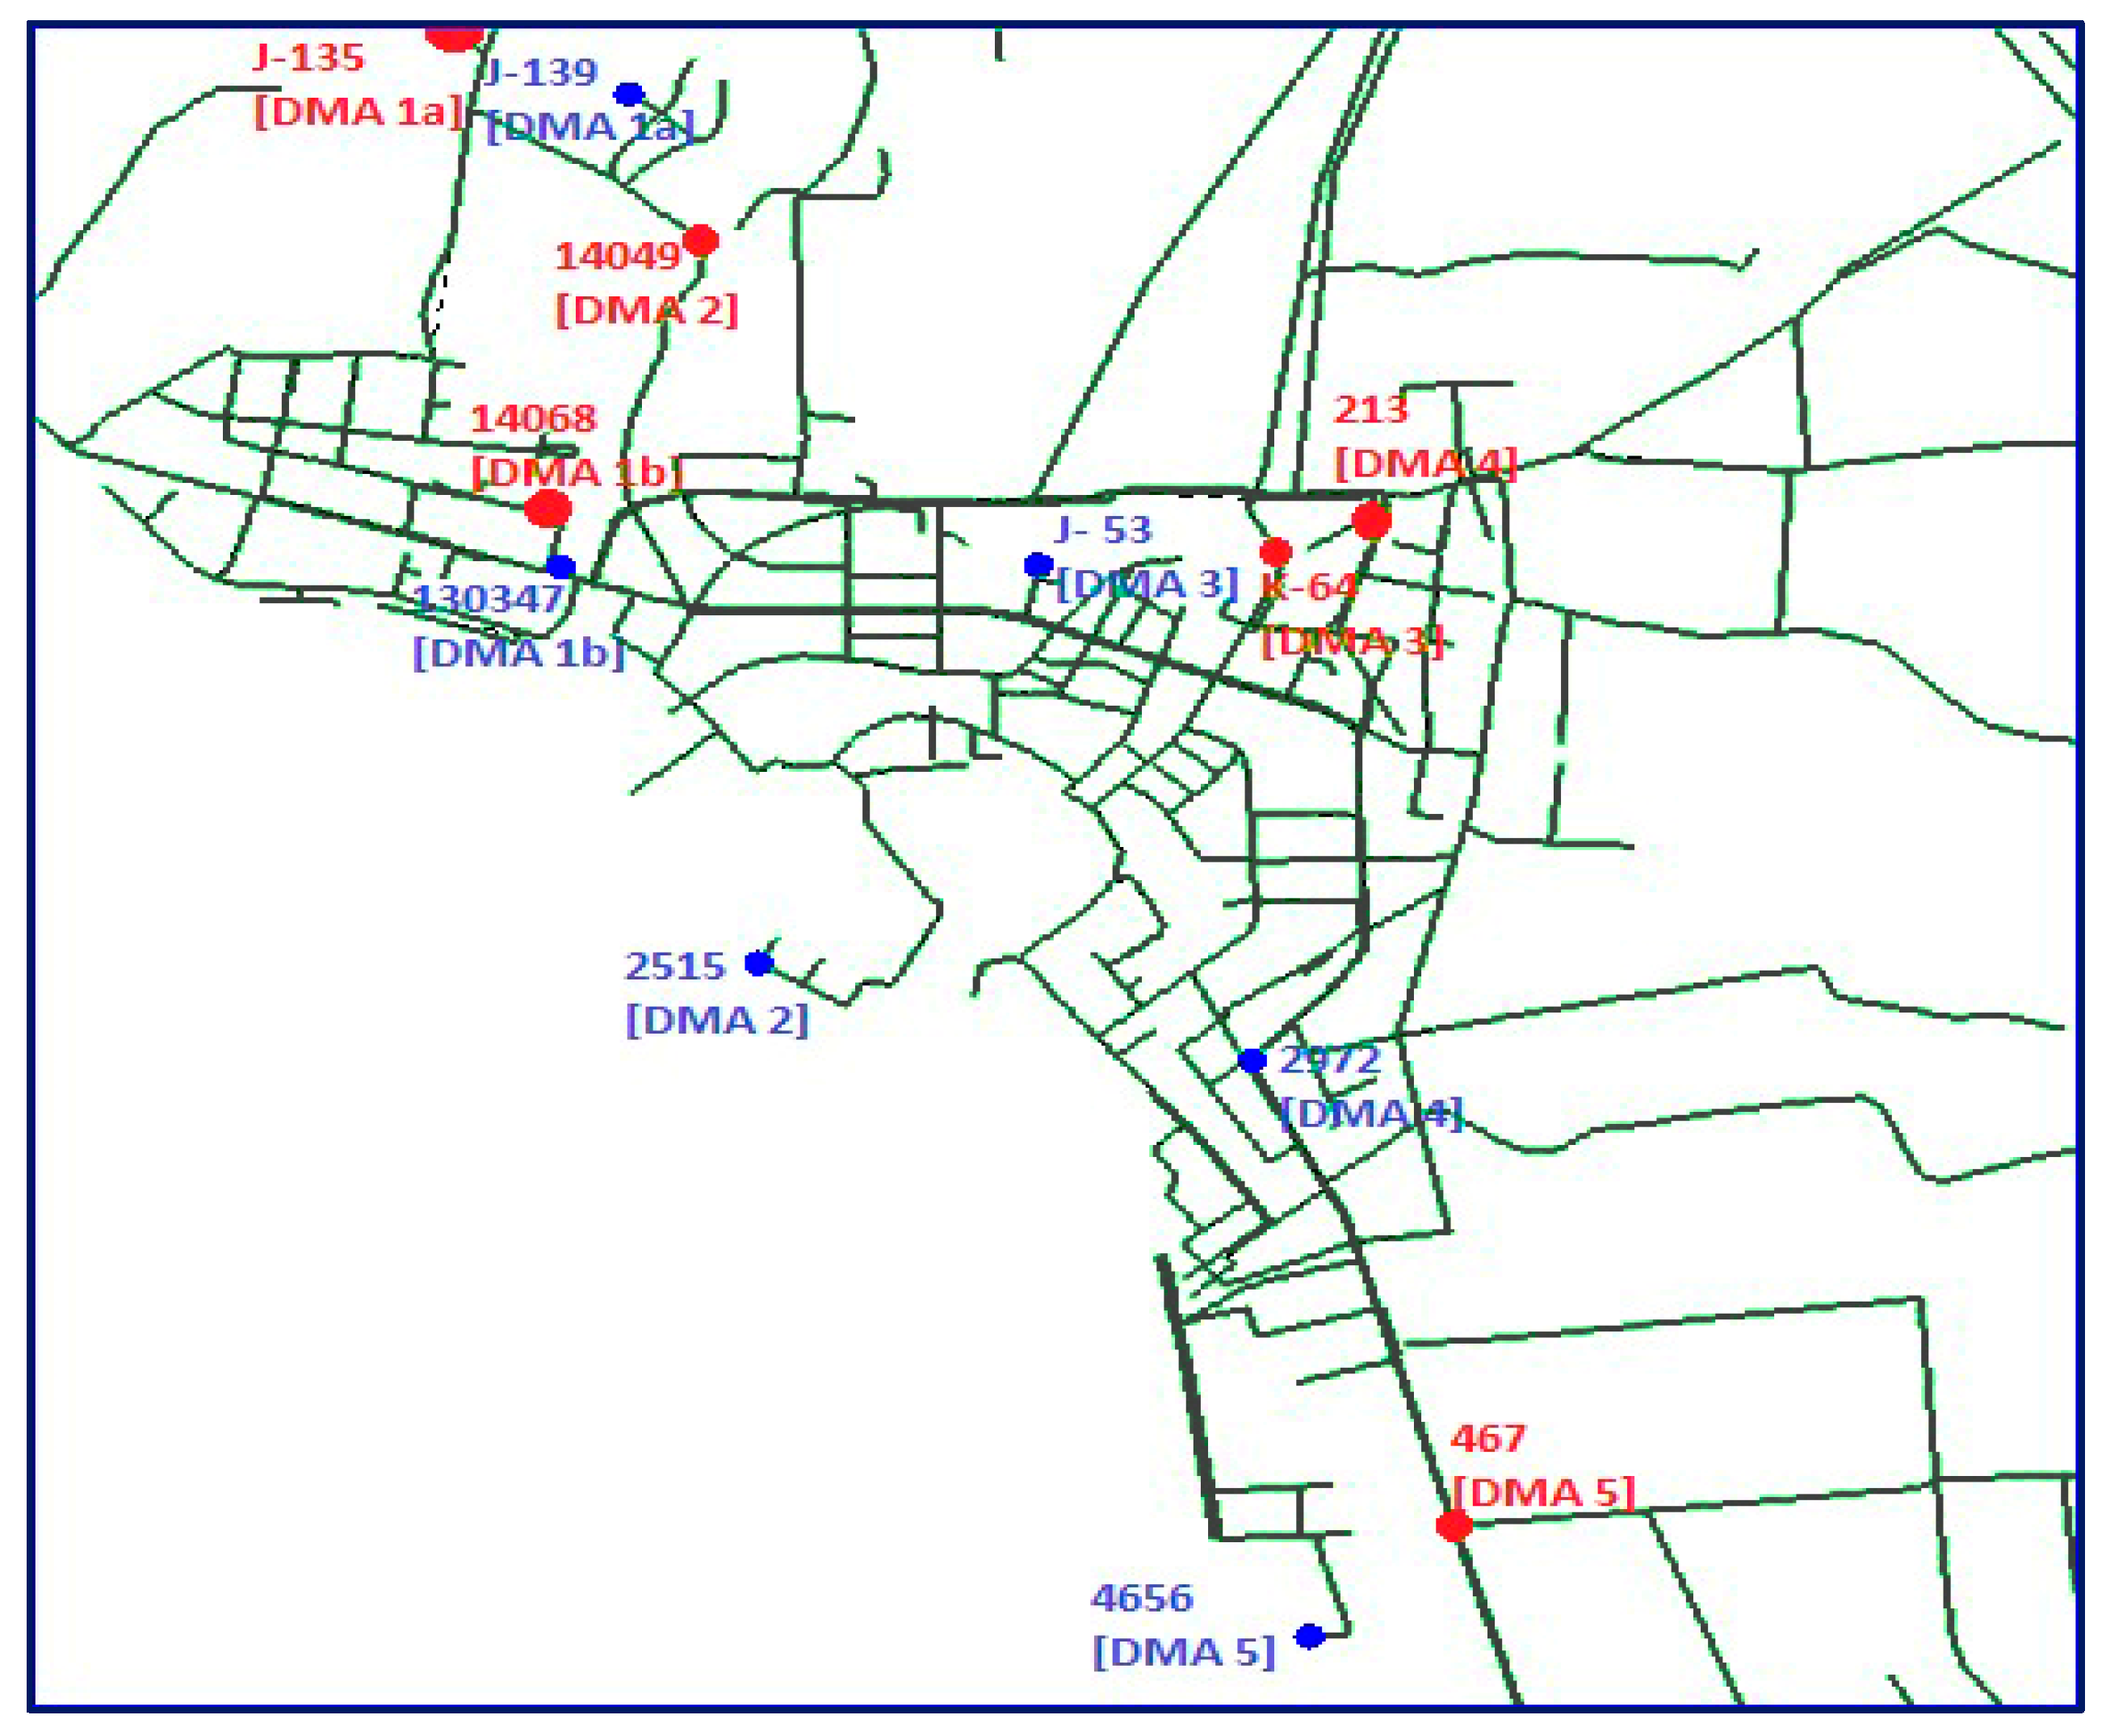
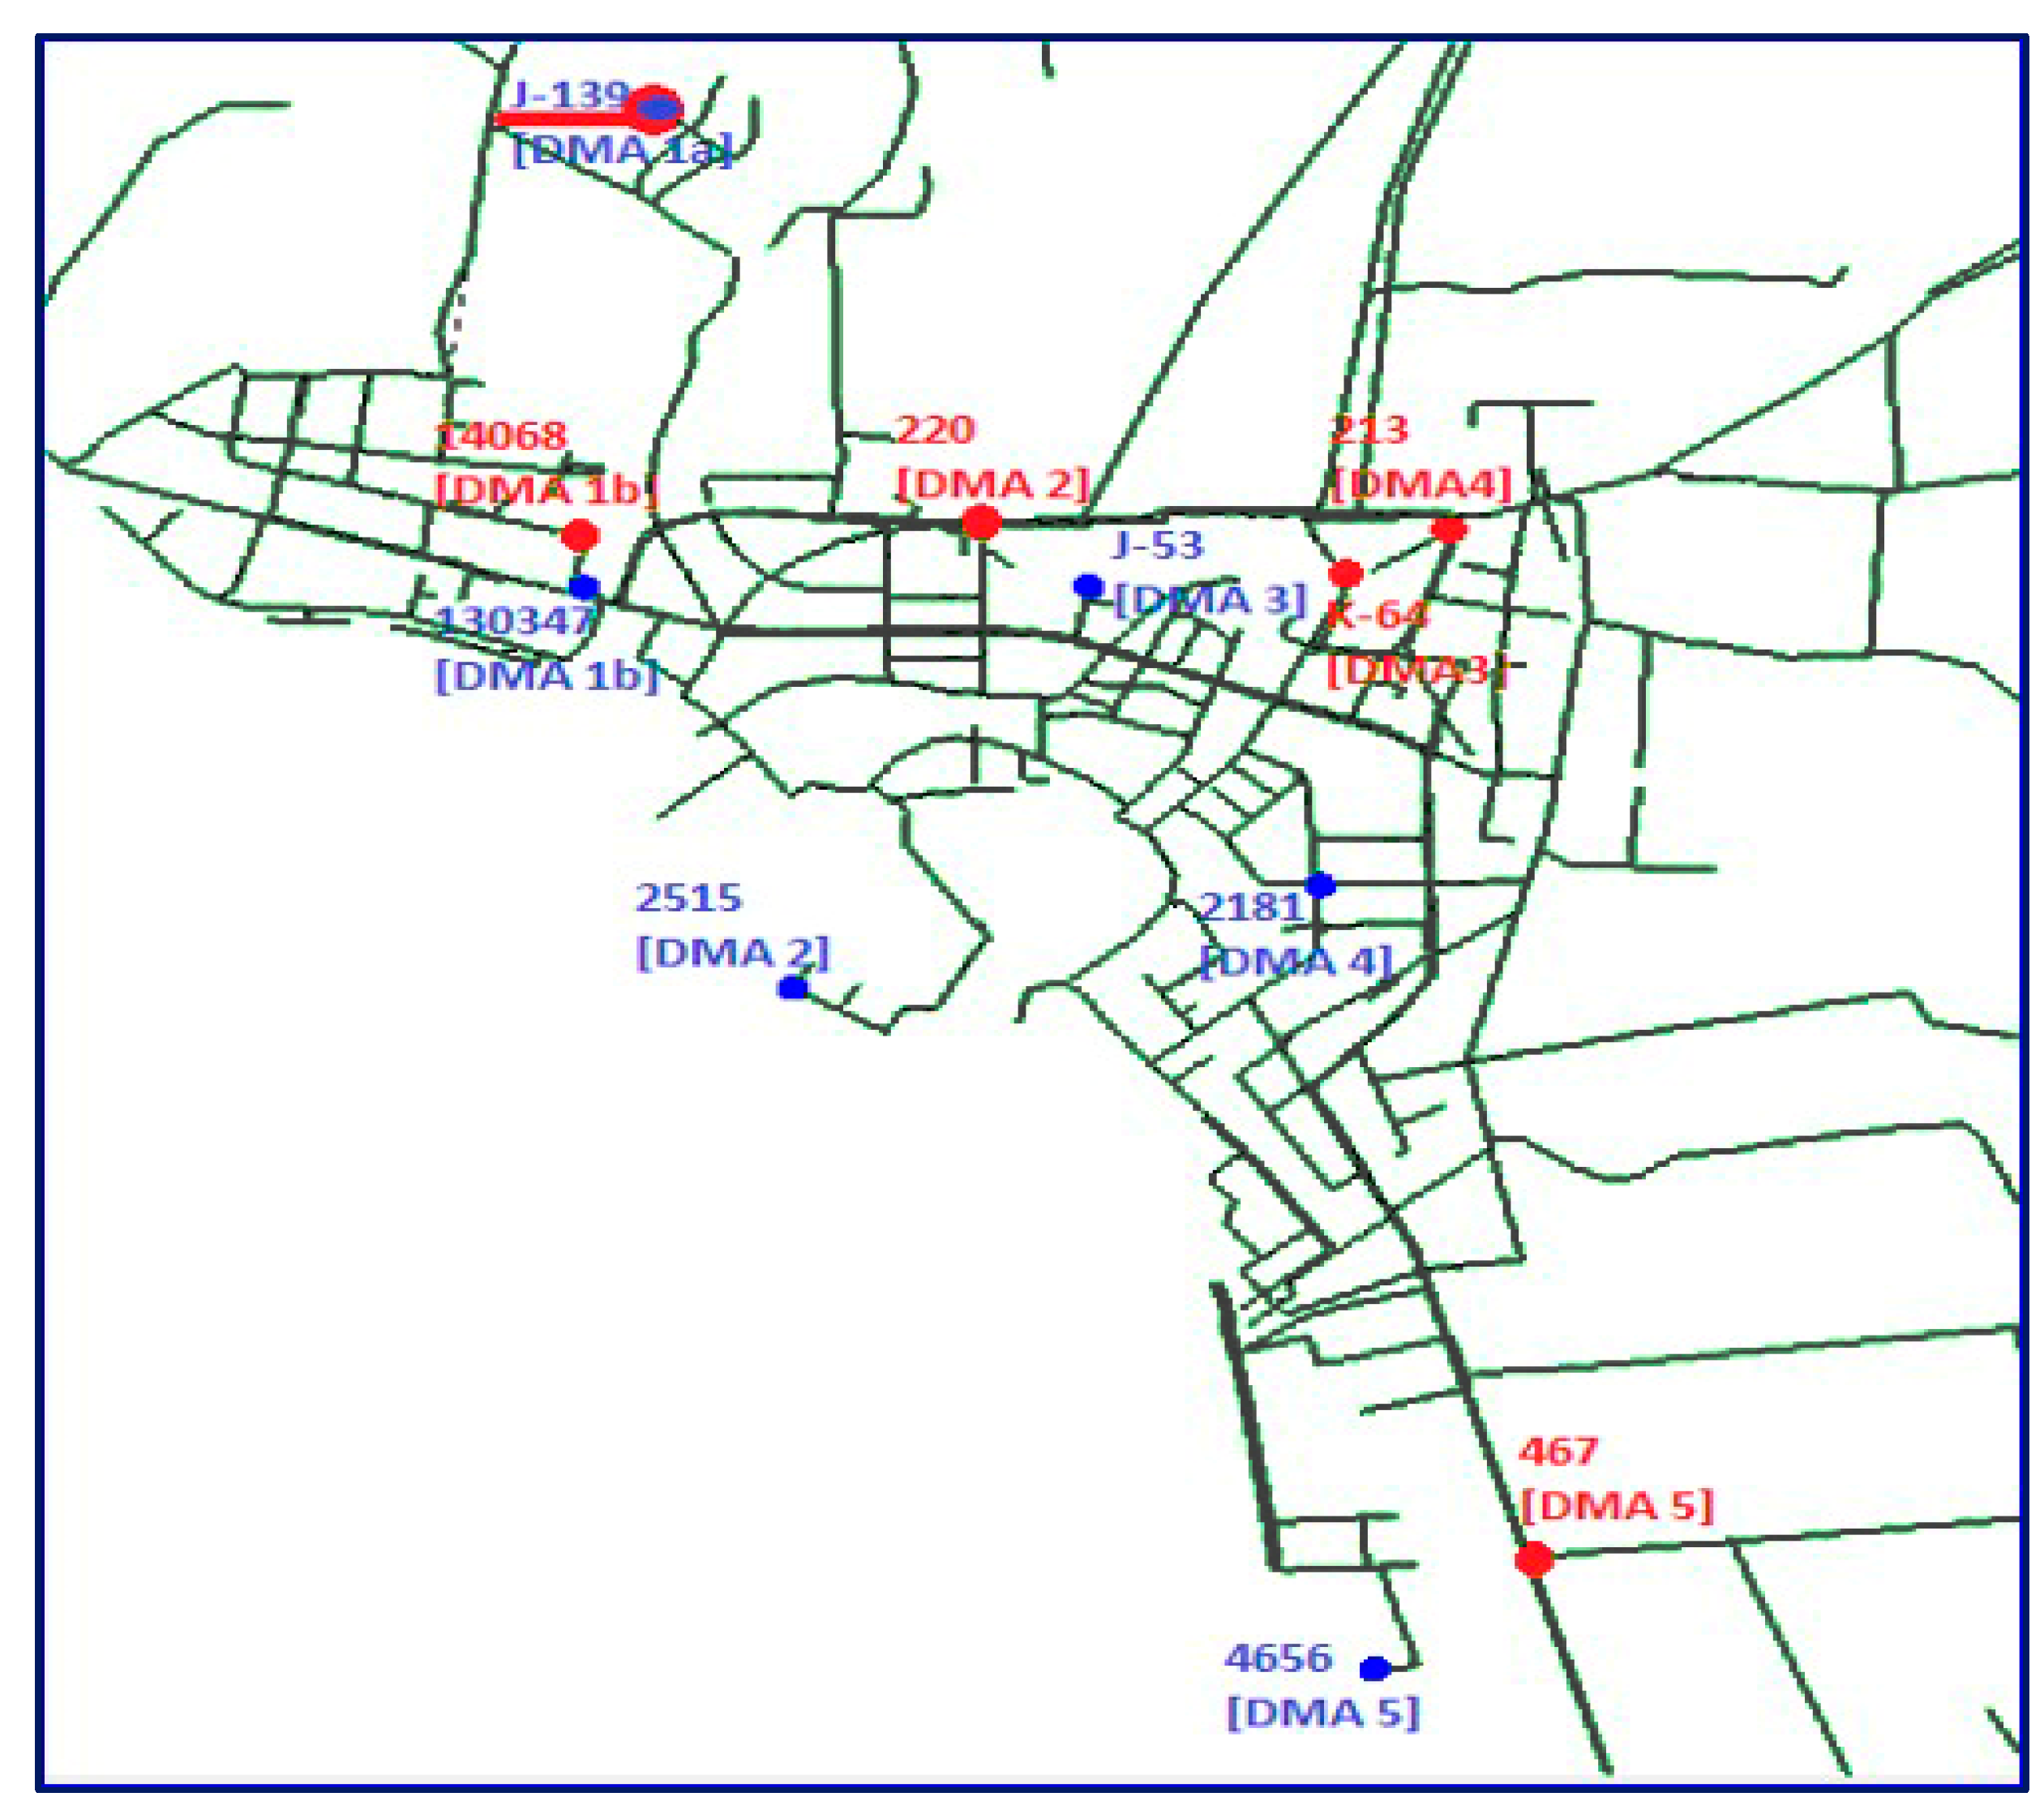
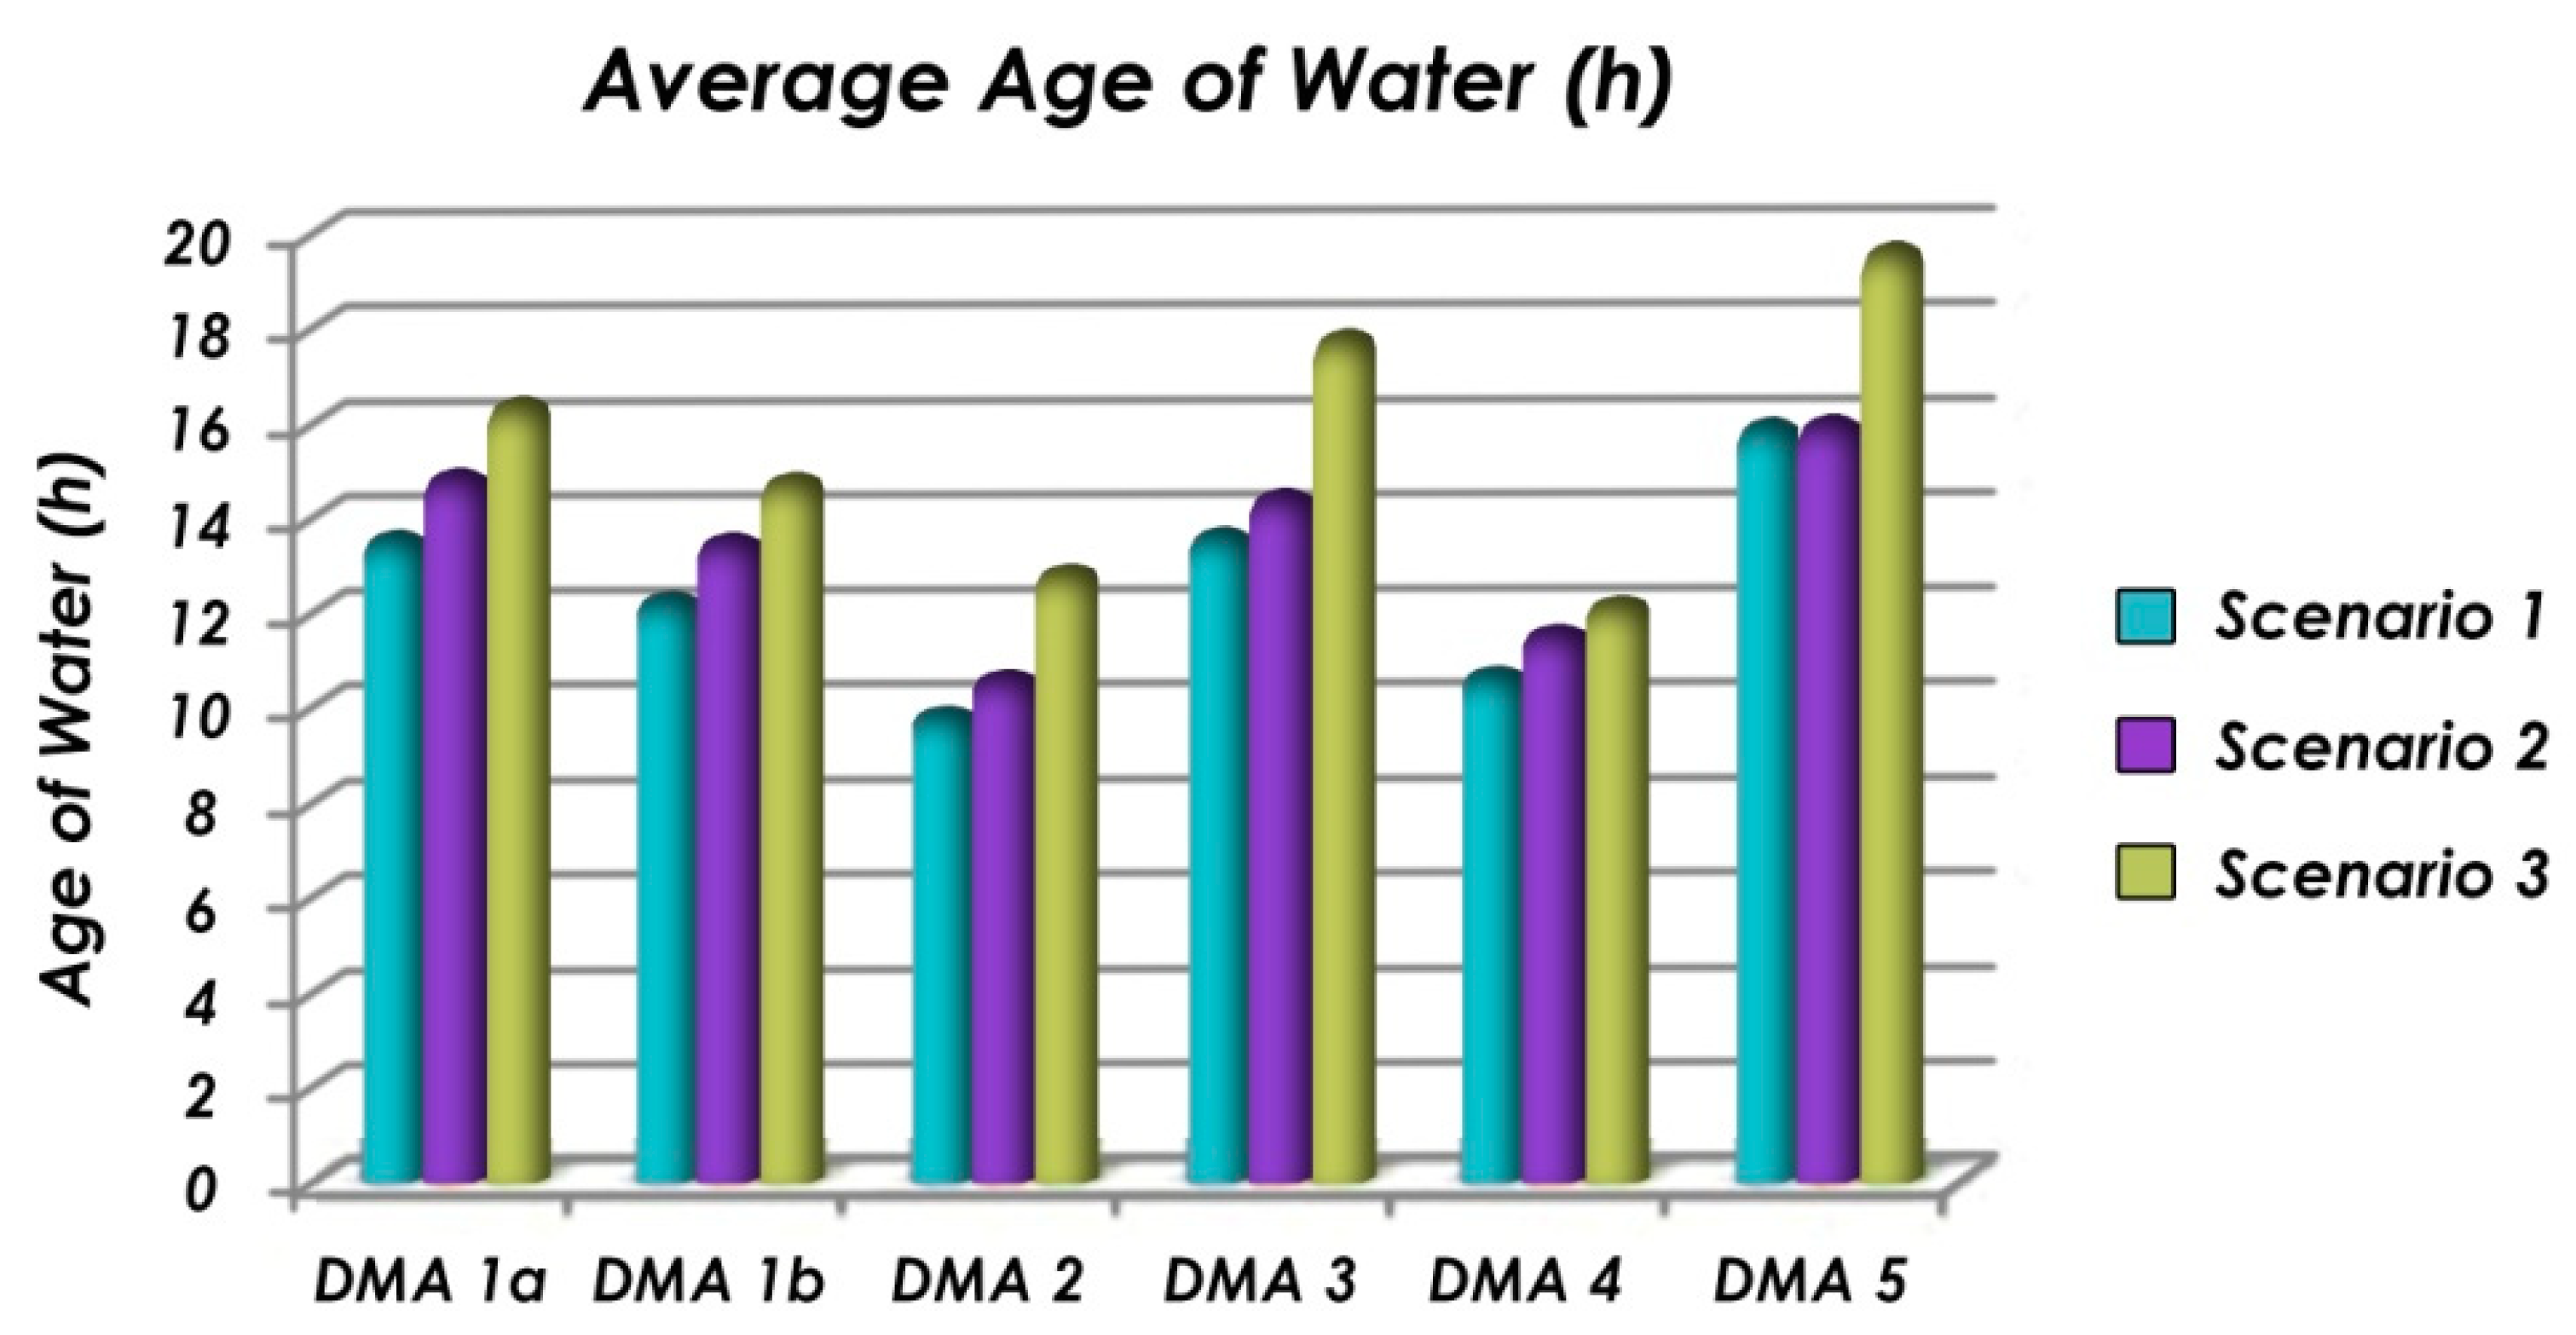
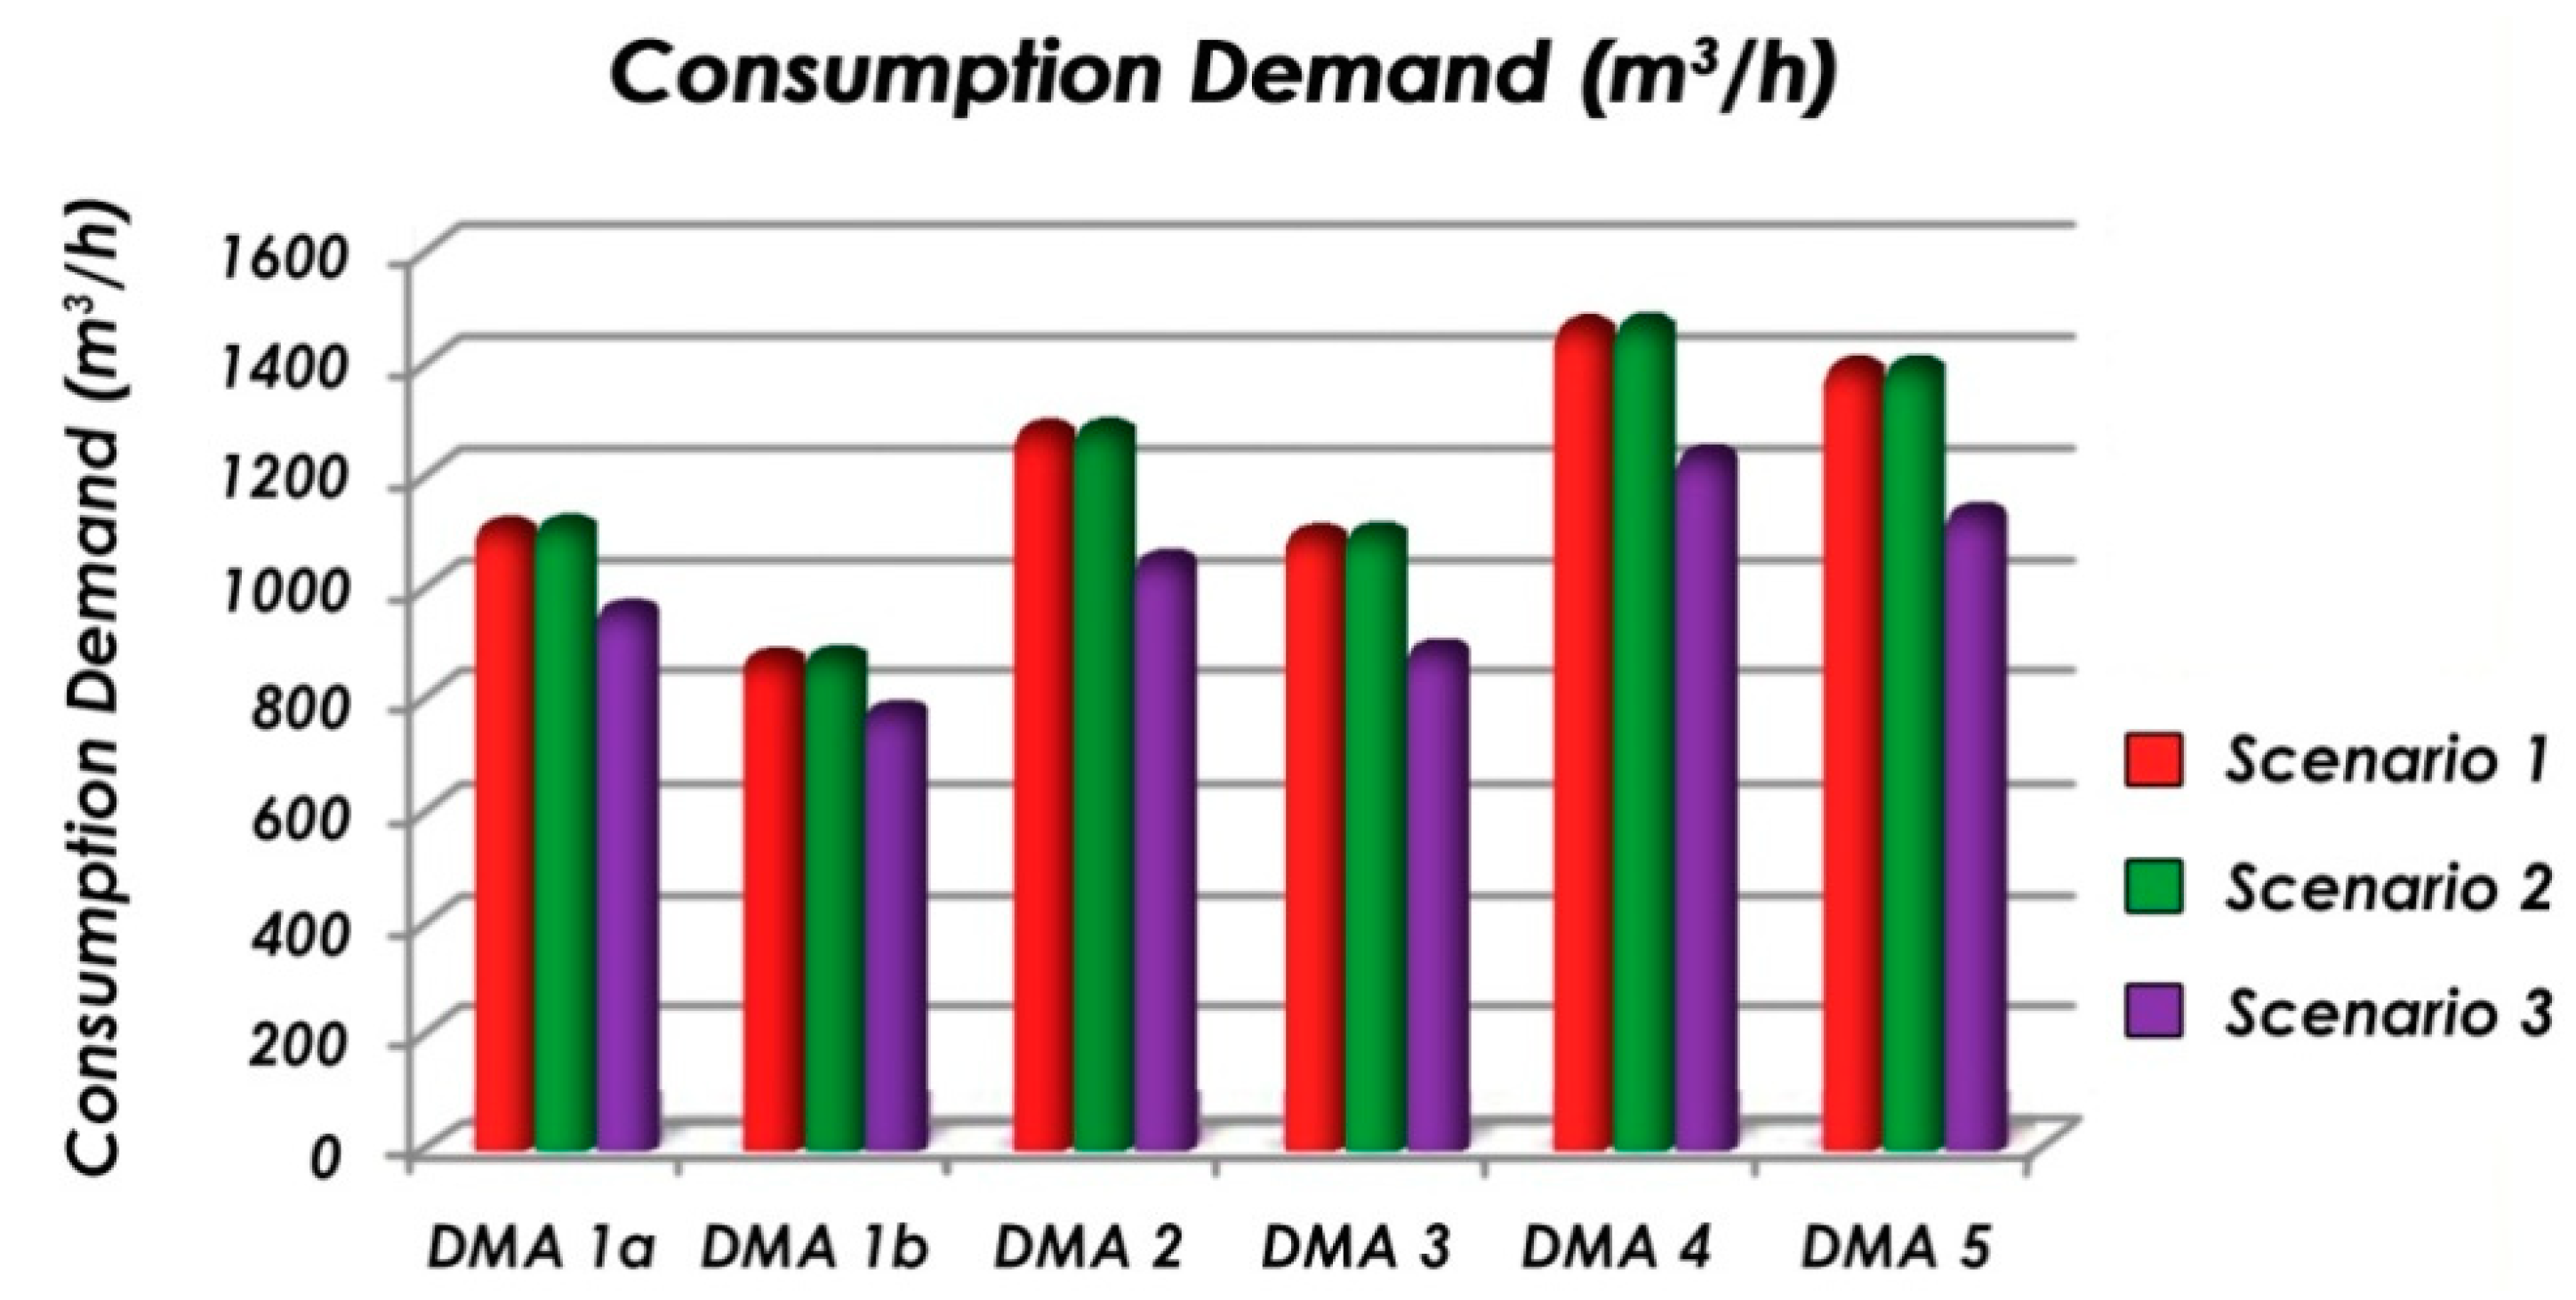
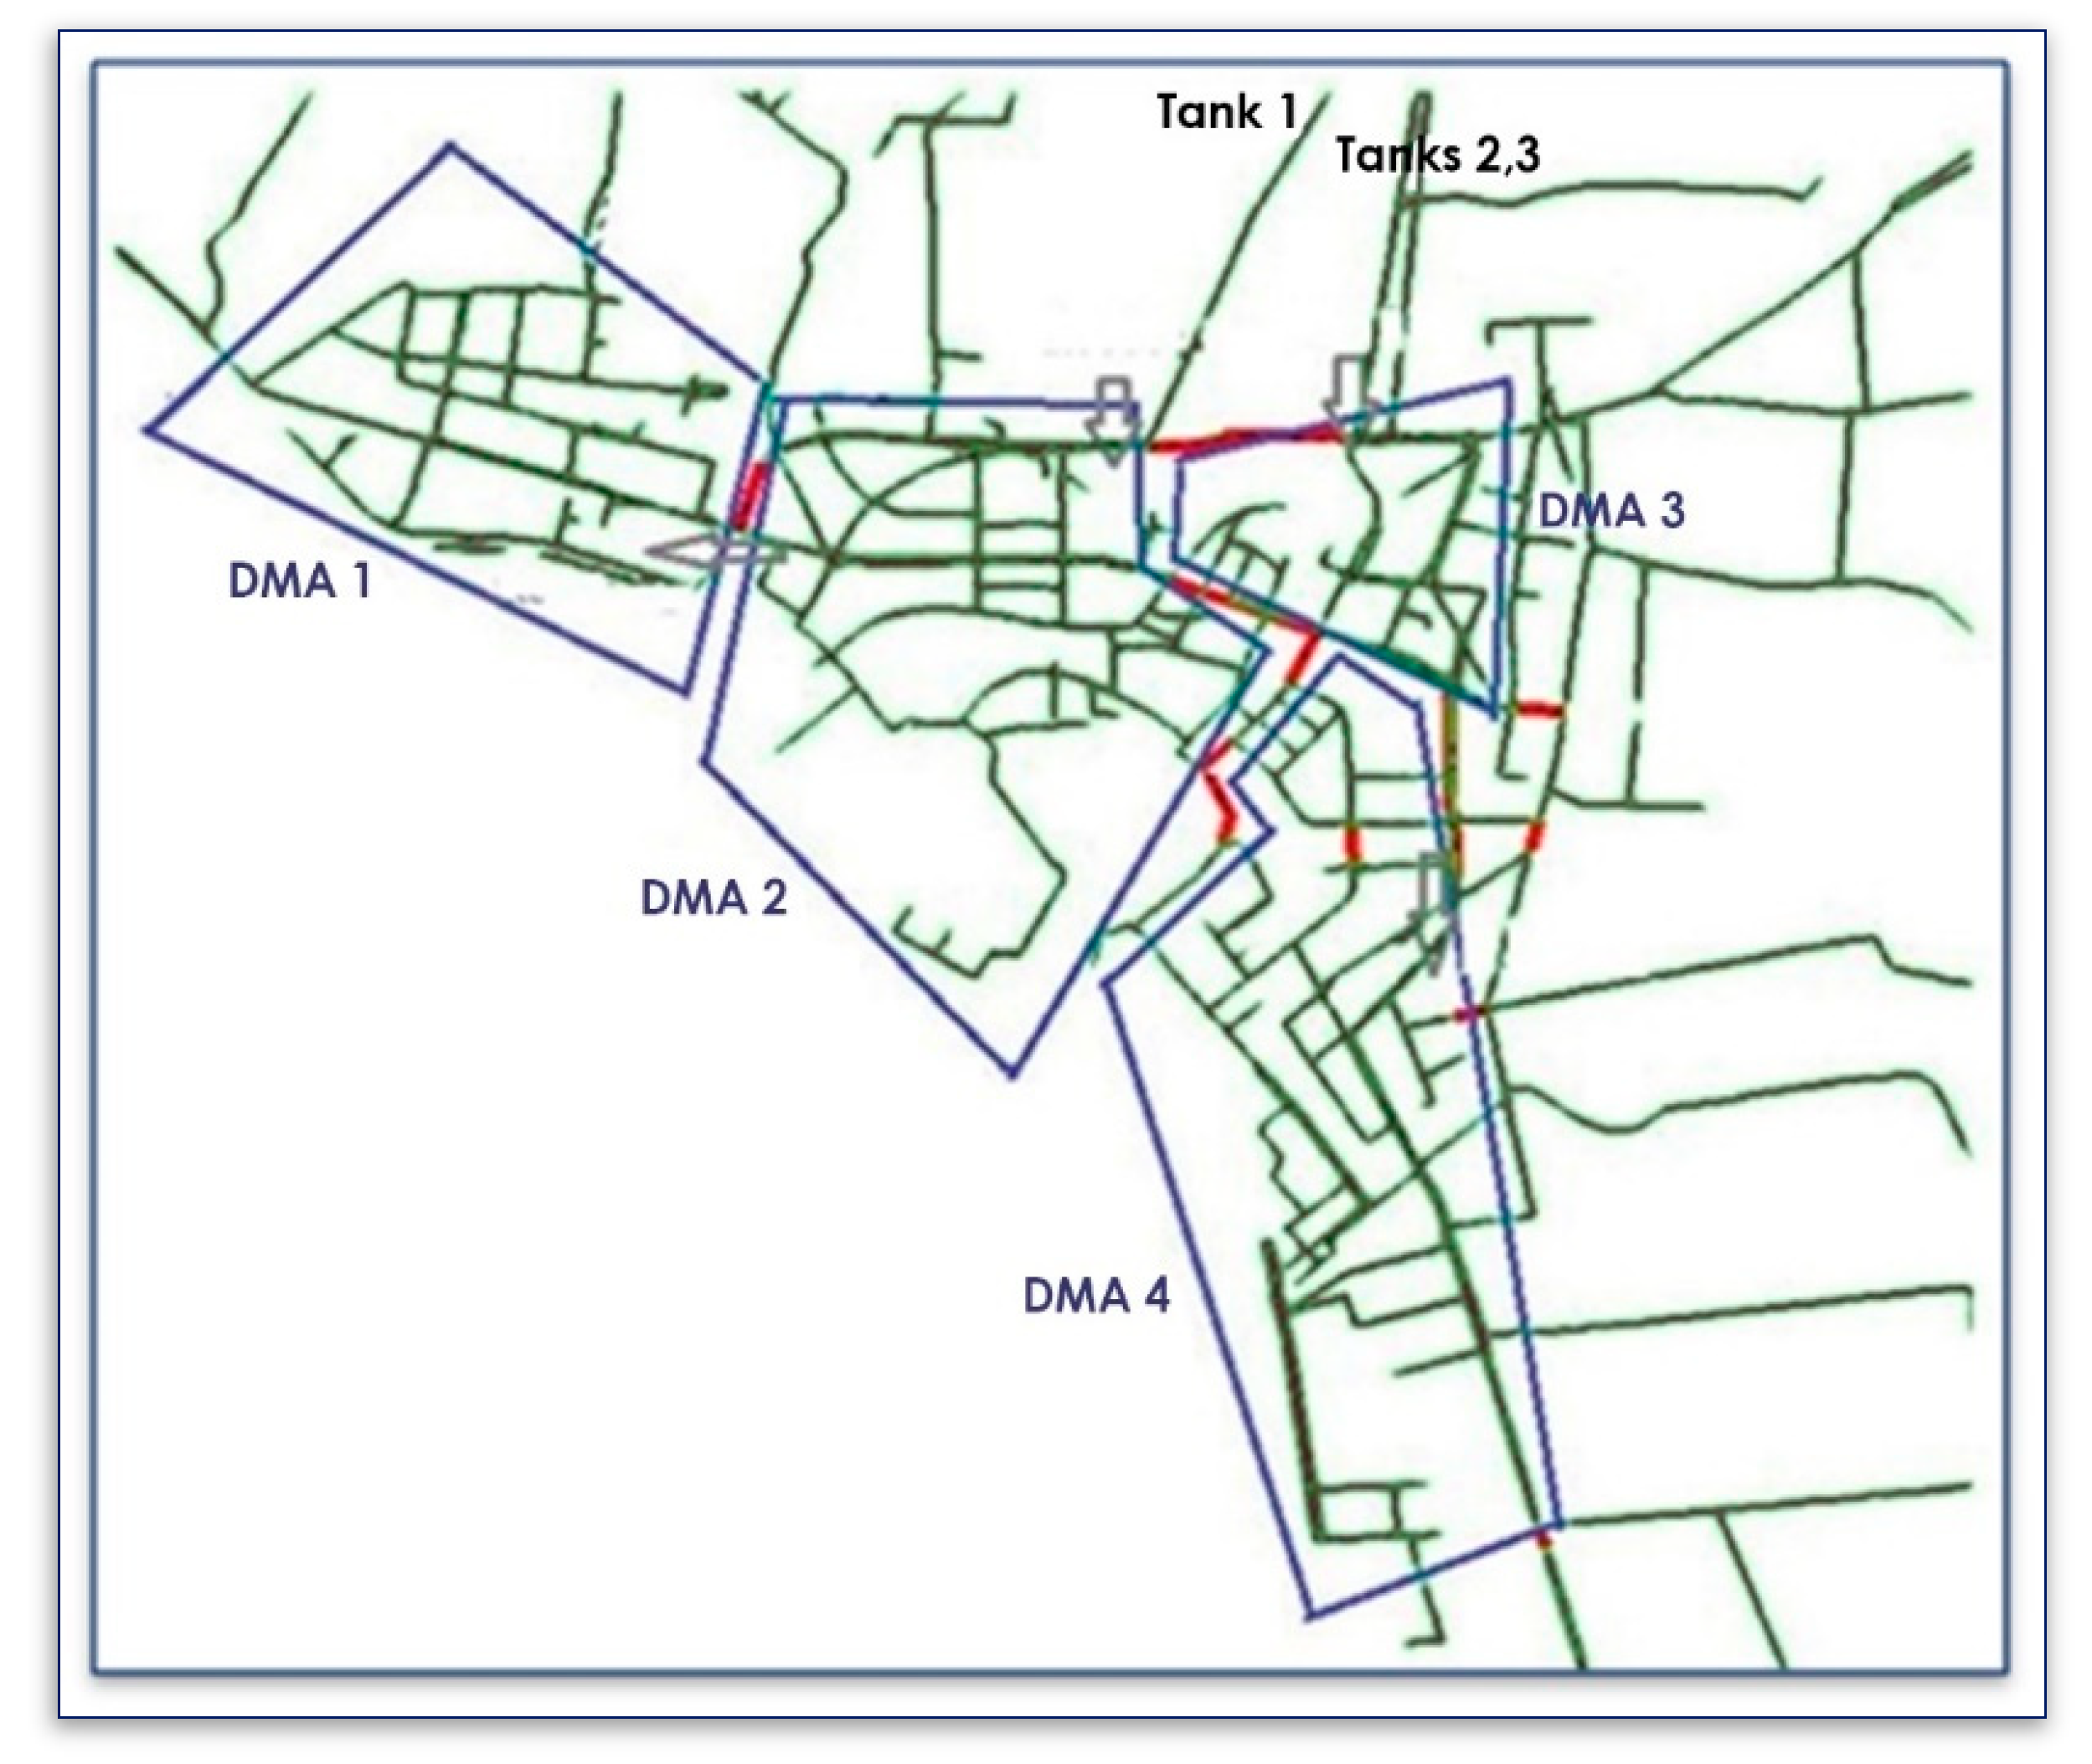
The period of analysis for each simulation (i.e., each one of the three scenarios mentioned above) was equal to 48 h, as each scenario provided enough data to reach safe conclusions. The first thing to be checked was how critical the situation became in every DMA in terms of WA growth. Initially, the DMAs that were formed based on the already developed PM scenarios [35,36], were selected (Figure 2). Each one of these DMAs was formed based on the optimal pressure achieved in its critical node (i.e., the one with the lowest pressure, that is usually the most distant one from the DMA’s entrance). For each scenario, the critical node (marked blue) per DMA, in terms of its WA, was identified (Table 1, Table 2 and Table 3; Figure 3, Figure 4 and Figure 5). Comparing the results of the three scenarios simulated, it was found that the critical nodes (WA-based) were not always the same for each DMA. In Scenario No3 (with DMAs_with PRVs), a remarkable reduction in the mean pressure inside each DMA was achieved, which, on the one hand, was the desired goal but, on the other hand, WA grew. In DMAs 1a,b, 2 and 3, the water-age-based critical nodes (J-139, 130347, 2515 and J-53, respectively, in scenario 1) are not the same for all three scenarios. It must be noticed that the critical nodes identified based on the water pressure (marked red) differ from those identified based on the water age (marked blue). Although Scenario No2 (with DMAs_no PRVs) did not result in a significant water age growth, things were different for Scenario No3 (with DMAs_with PRVs). More specifically, in Scenario No2, the mean pressure was not reduced a lot, the water age was slightly increased, the SIV was not significantly altered and the number of dead ends was increased by only seven. On the other hand, in Scenario No3, water age was significantly increased (as expected) as the water pressure was highly reduced, resulting in a significant reduction in both the actual water demand and the water losses (pressure-dependent). Thus, water inside the network pipes was not adequately refreshed. The installation of PRVs offers an efficient management of the WDN as the pressure is being effectively managed (gets down to 200 kPa in the critical nodes meeting the threshold set by the Greek legislation) [39] and is ideal for the proper operation of the WDN and reduction in losses. However, nodes with very low pressures are considered critical and undesirable. Table 4 and Figure 6 and Figure 7 present the water age (hours) per DMA and the total water demand (m3) for all three scenarios and a 48-h analysis.
The results proved that although significant pressure reduction can be achieved when PRVs are installed, the results on water age are not that favorable. More specifically, the mean water age for Scenario No2 was 13.44 h, while for Scenario No3, after installing the PRVs, it raised up to 15.54 h. The decrease in the water demand due to the pressure reduction and the model’s dependency on pressure, has a significant impact on the operation of the WDN. As the total water volume that is either consumed or lost is reduced, the water age increased, and thus the water quality deteriorated. In more detail, the total water demand at the nodes after the installation of the PRVs decreased by about 1176 m3 over a period of 48 h.

3.3. Water Age Reduction after Regulation of the PRVs

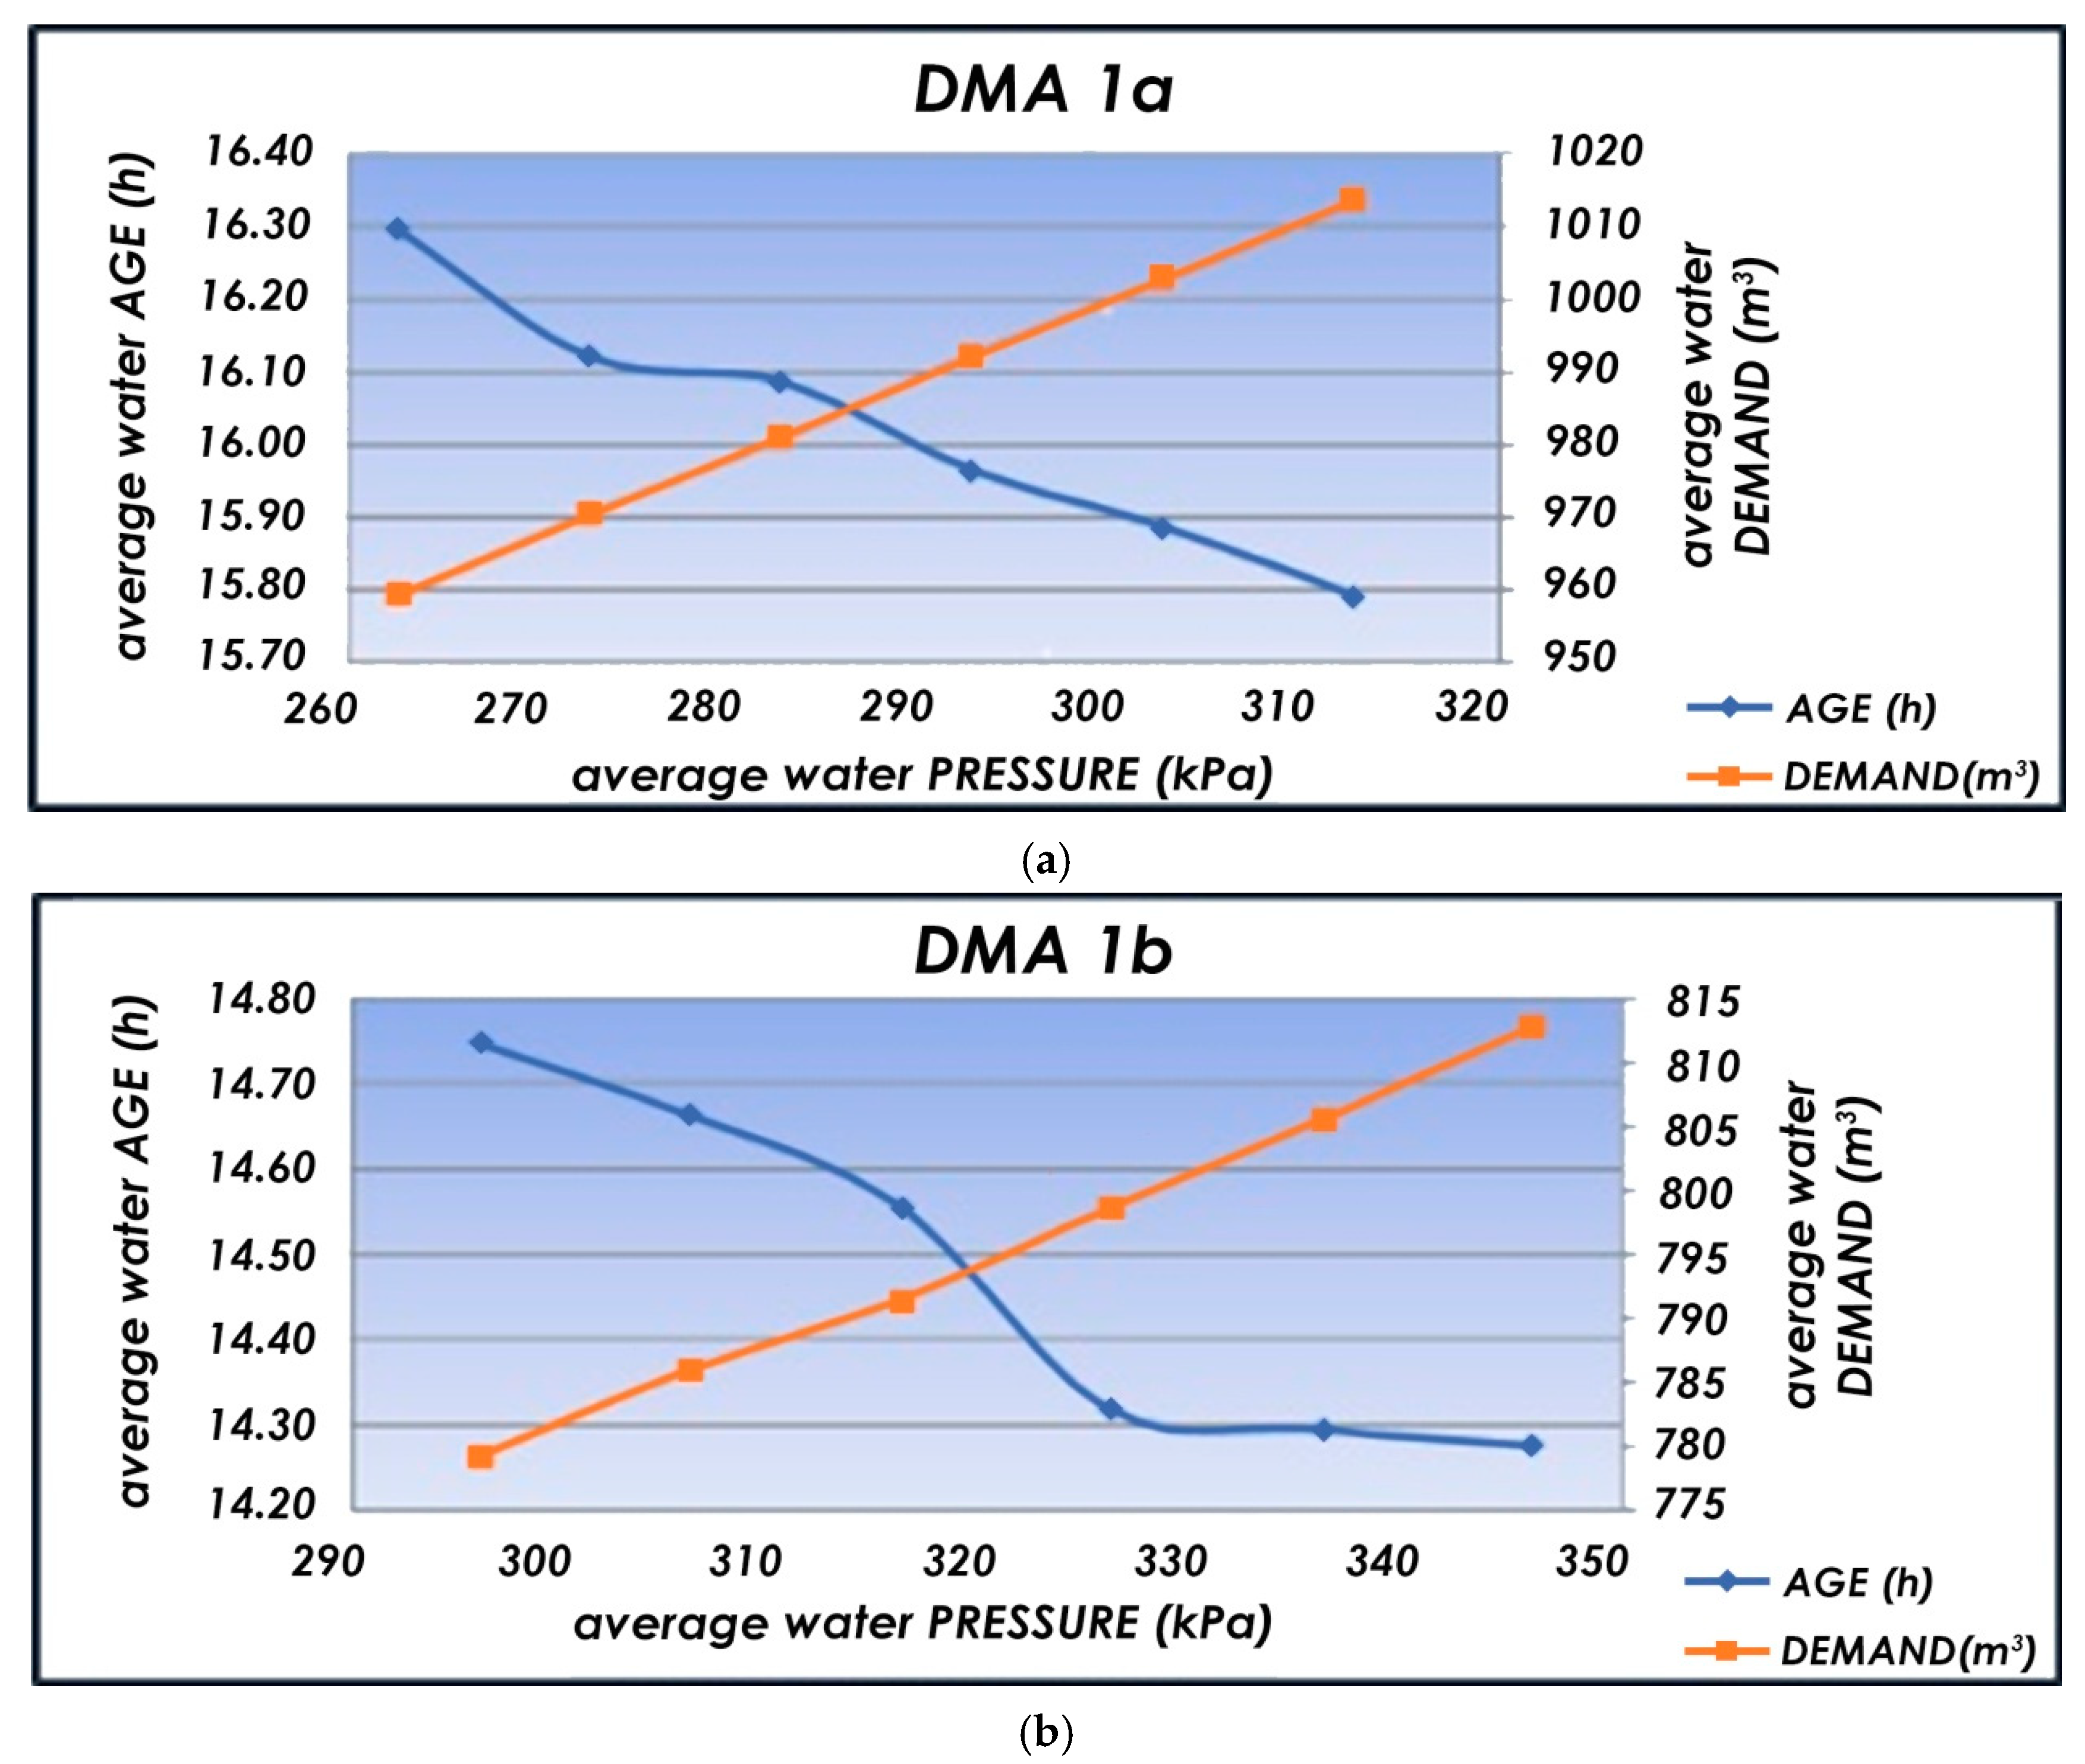
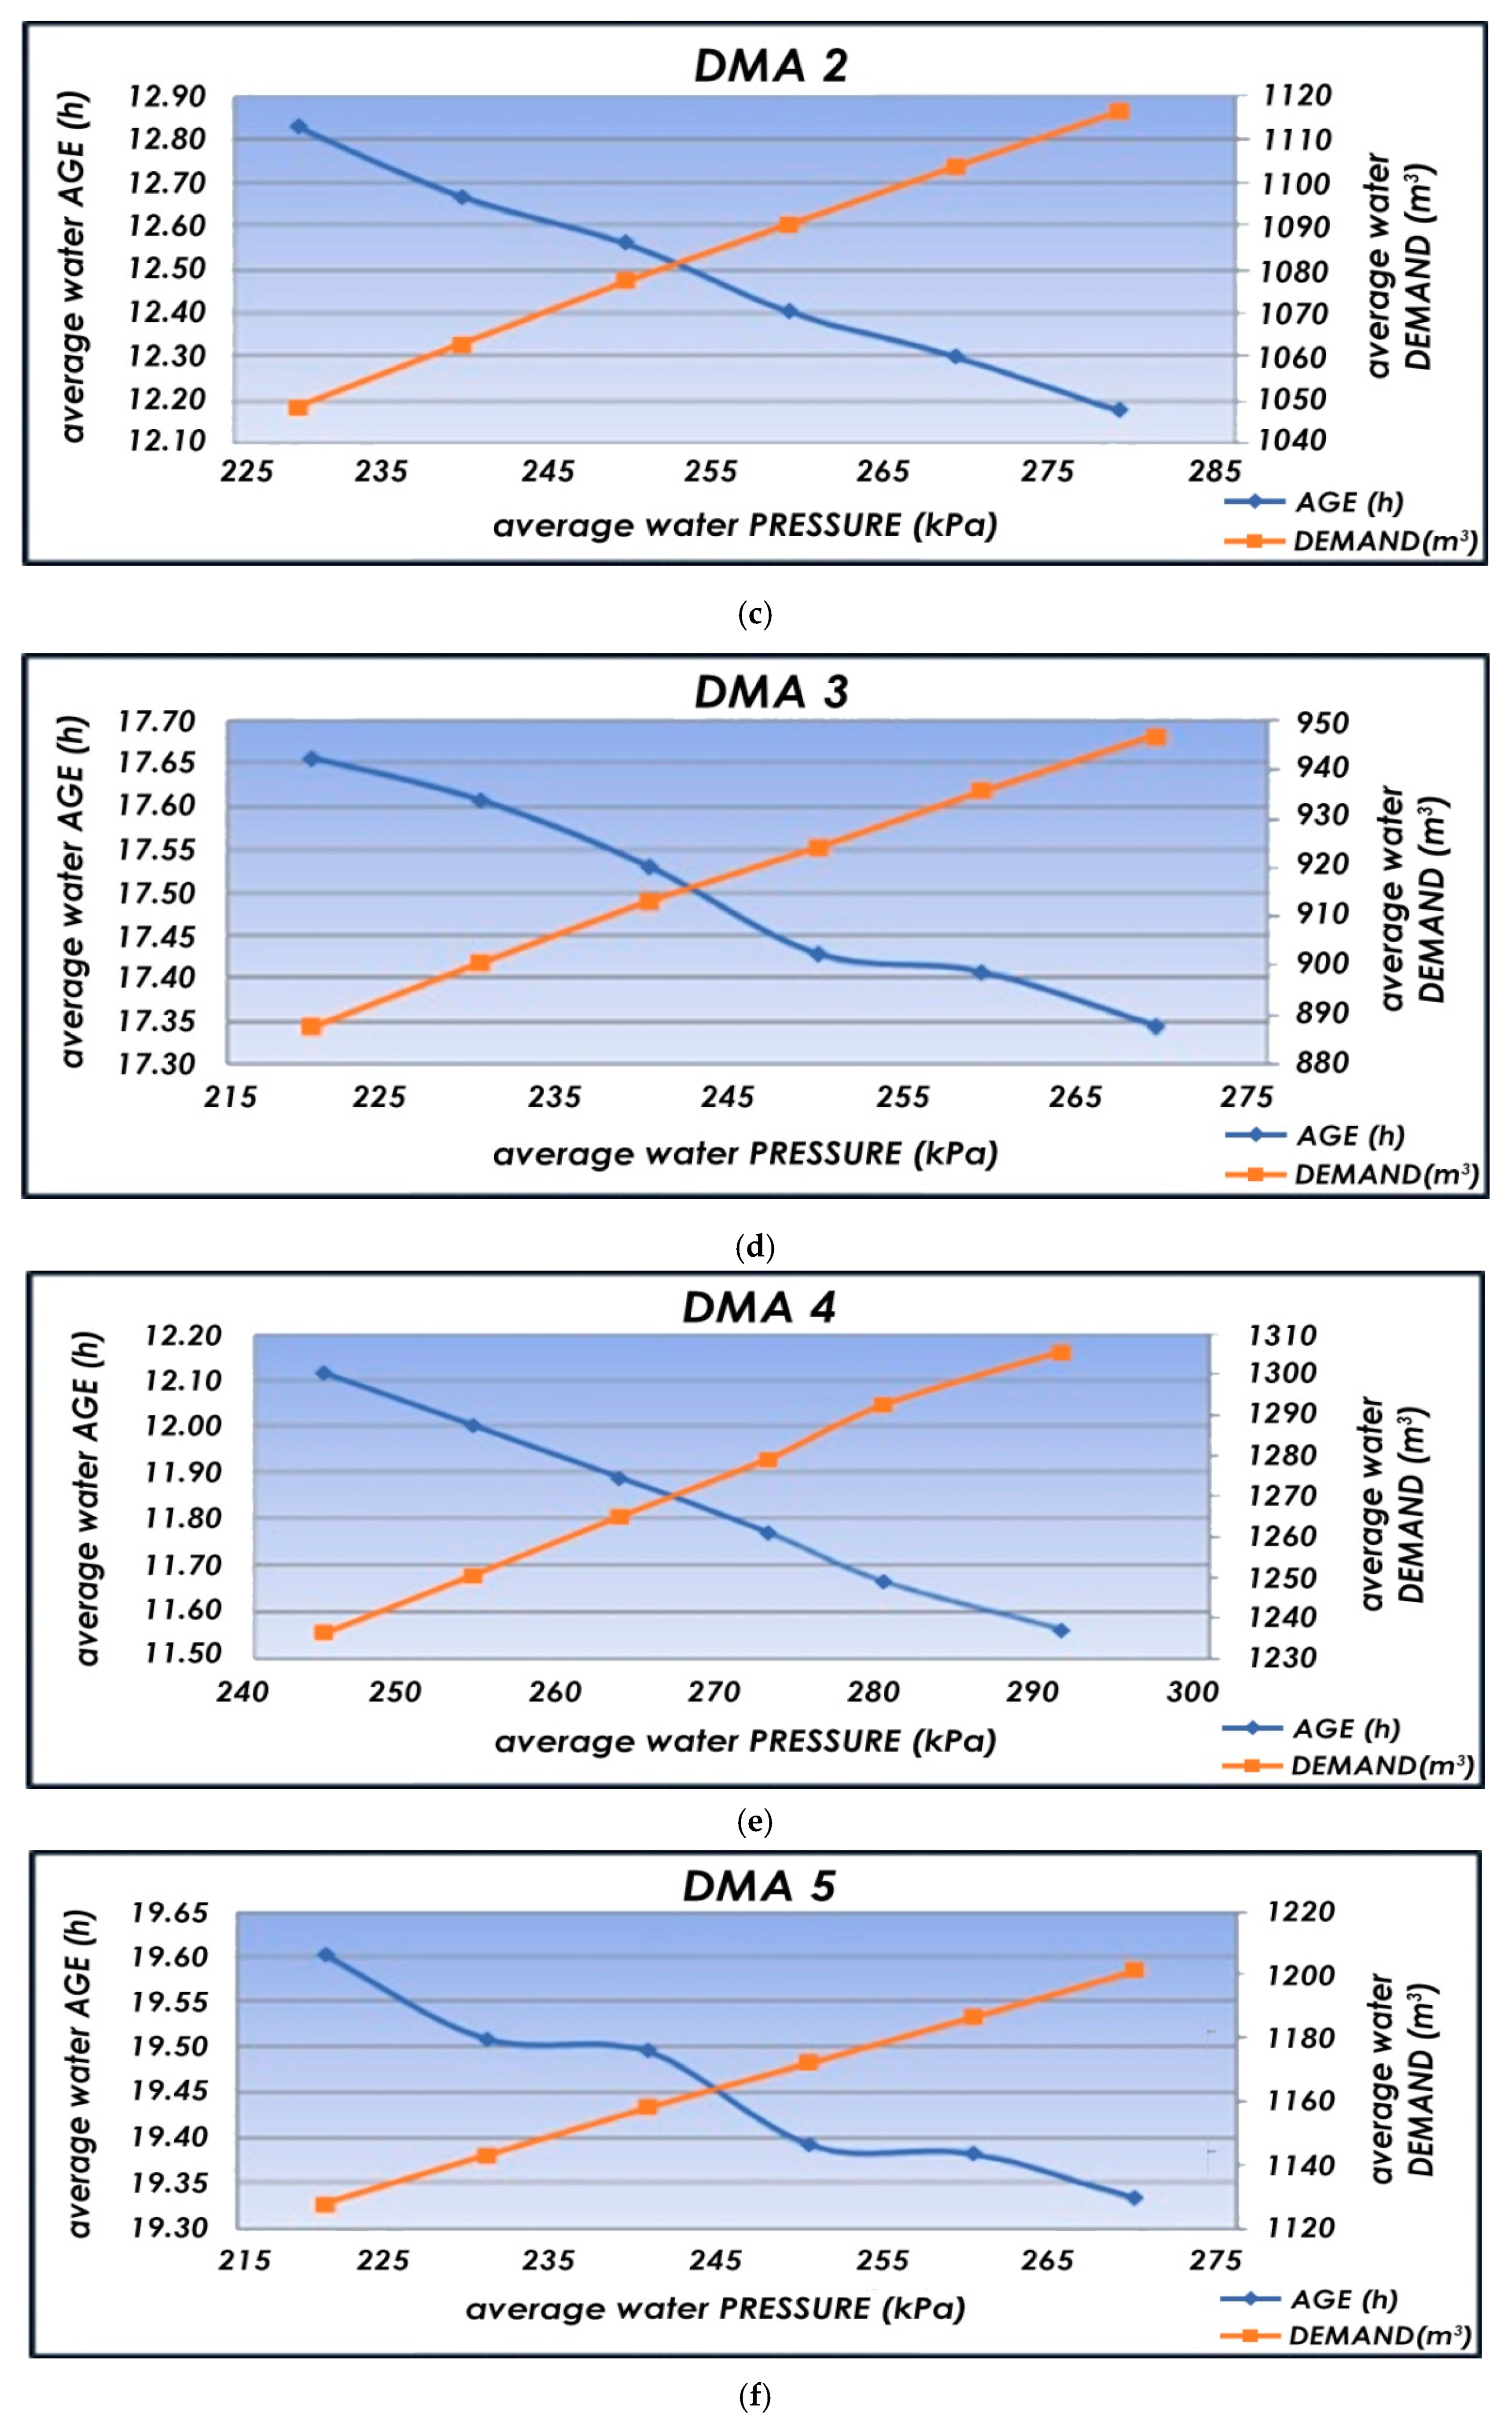
WA is proven to grow as pressure is reduced, resulting in a decreased System Input Volume (SIV), so the hydraulic model is approached differently. Therefore, trials were set to strike a balance between the reduction in the pressure (even if it does not reach the ultimate optimum level) and the increase in the water age. For each DMA, the downstream pressures of the PRVs (Scenario No3) have been modeled to lower the pressure at every node as close to 200 kPa as possible (Table 5). These values of the downstream pressures after the PRVs, are set in a certain inclining pattern using a 10 kPa step, thus forming six new cases (a–f) (Table 5). In this way, the reaction of the water age was monitored for every pressure level increased by 10, 20, 30, 40, 50 kPa, respectively, compared to the initial values of the PRVs’ downstream pressure. Each time the pressure increases, the same happens with the SIV, while the WA seems to decrease. Figure 8 presents the trends of the average water age and pressure, defining the balancing point for each DMA and for each one of the six new cases (a–f).
Reviewing the results from the implementation of the six new scenarios (cases a–f) regarding the regulation of the downstream pressure after the PRVs installed in the entering node of each DMA, the best solution lies between Case c and Case d. Each time the downstream pressure increases, the pressure regulation within the DMA becomes lighter, the SIV increases and the WA decreases. The balancing (crossing) point in each one of the Figure 8a–f stands for the desirable status where water pressure is adequately lowered, and water age is kept low enough too.

3.4. Proposed Formation of DMAs Based on Minimization of the Water Age

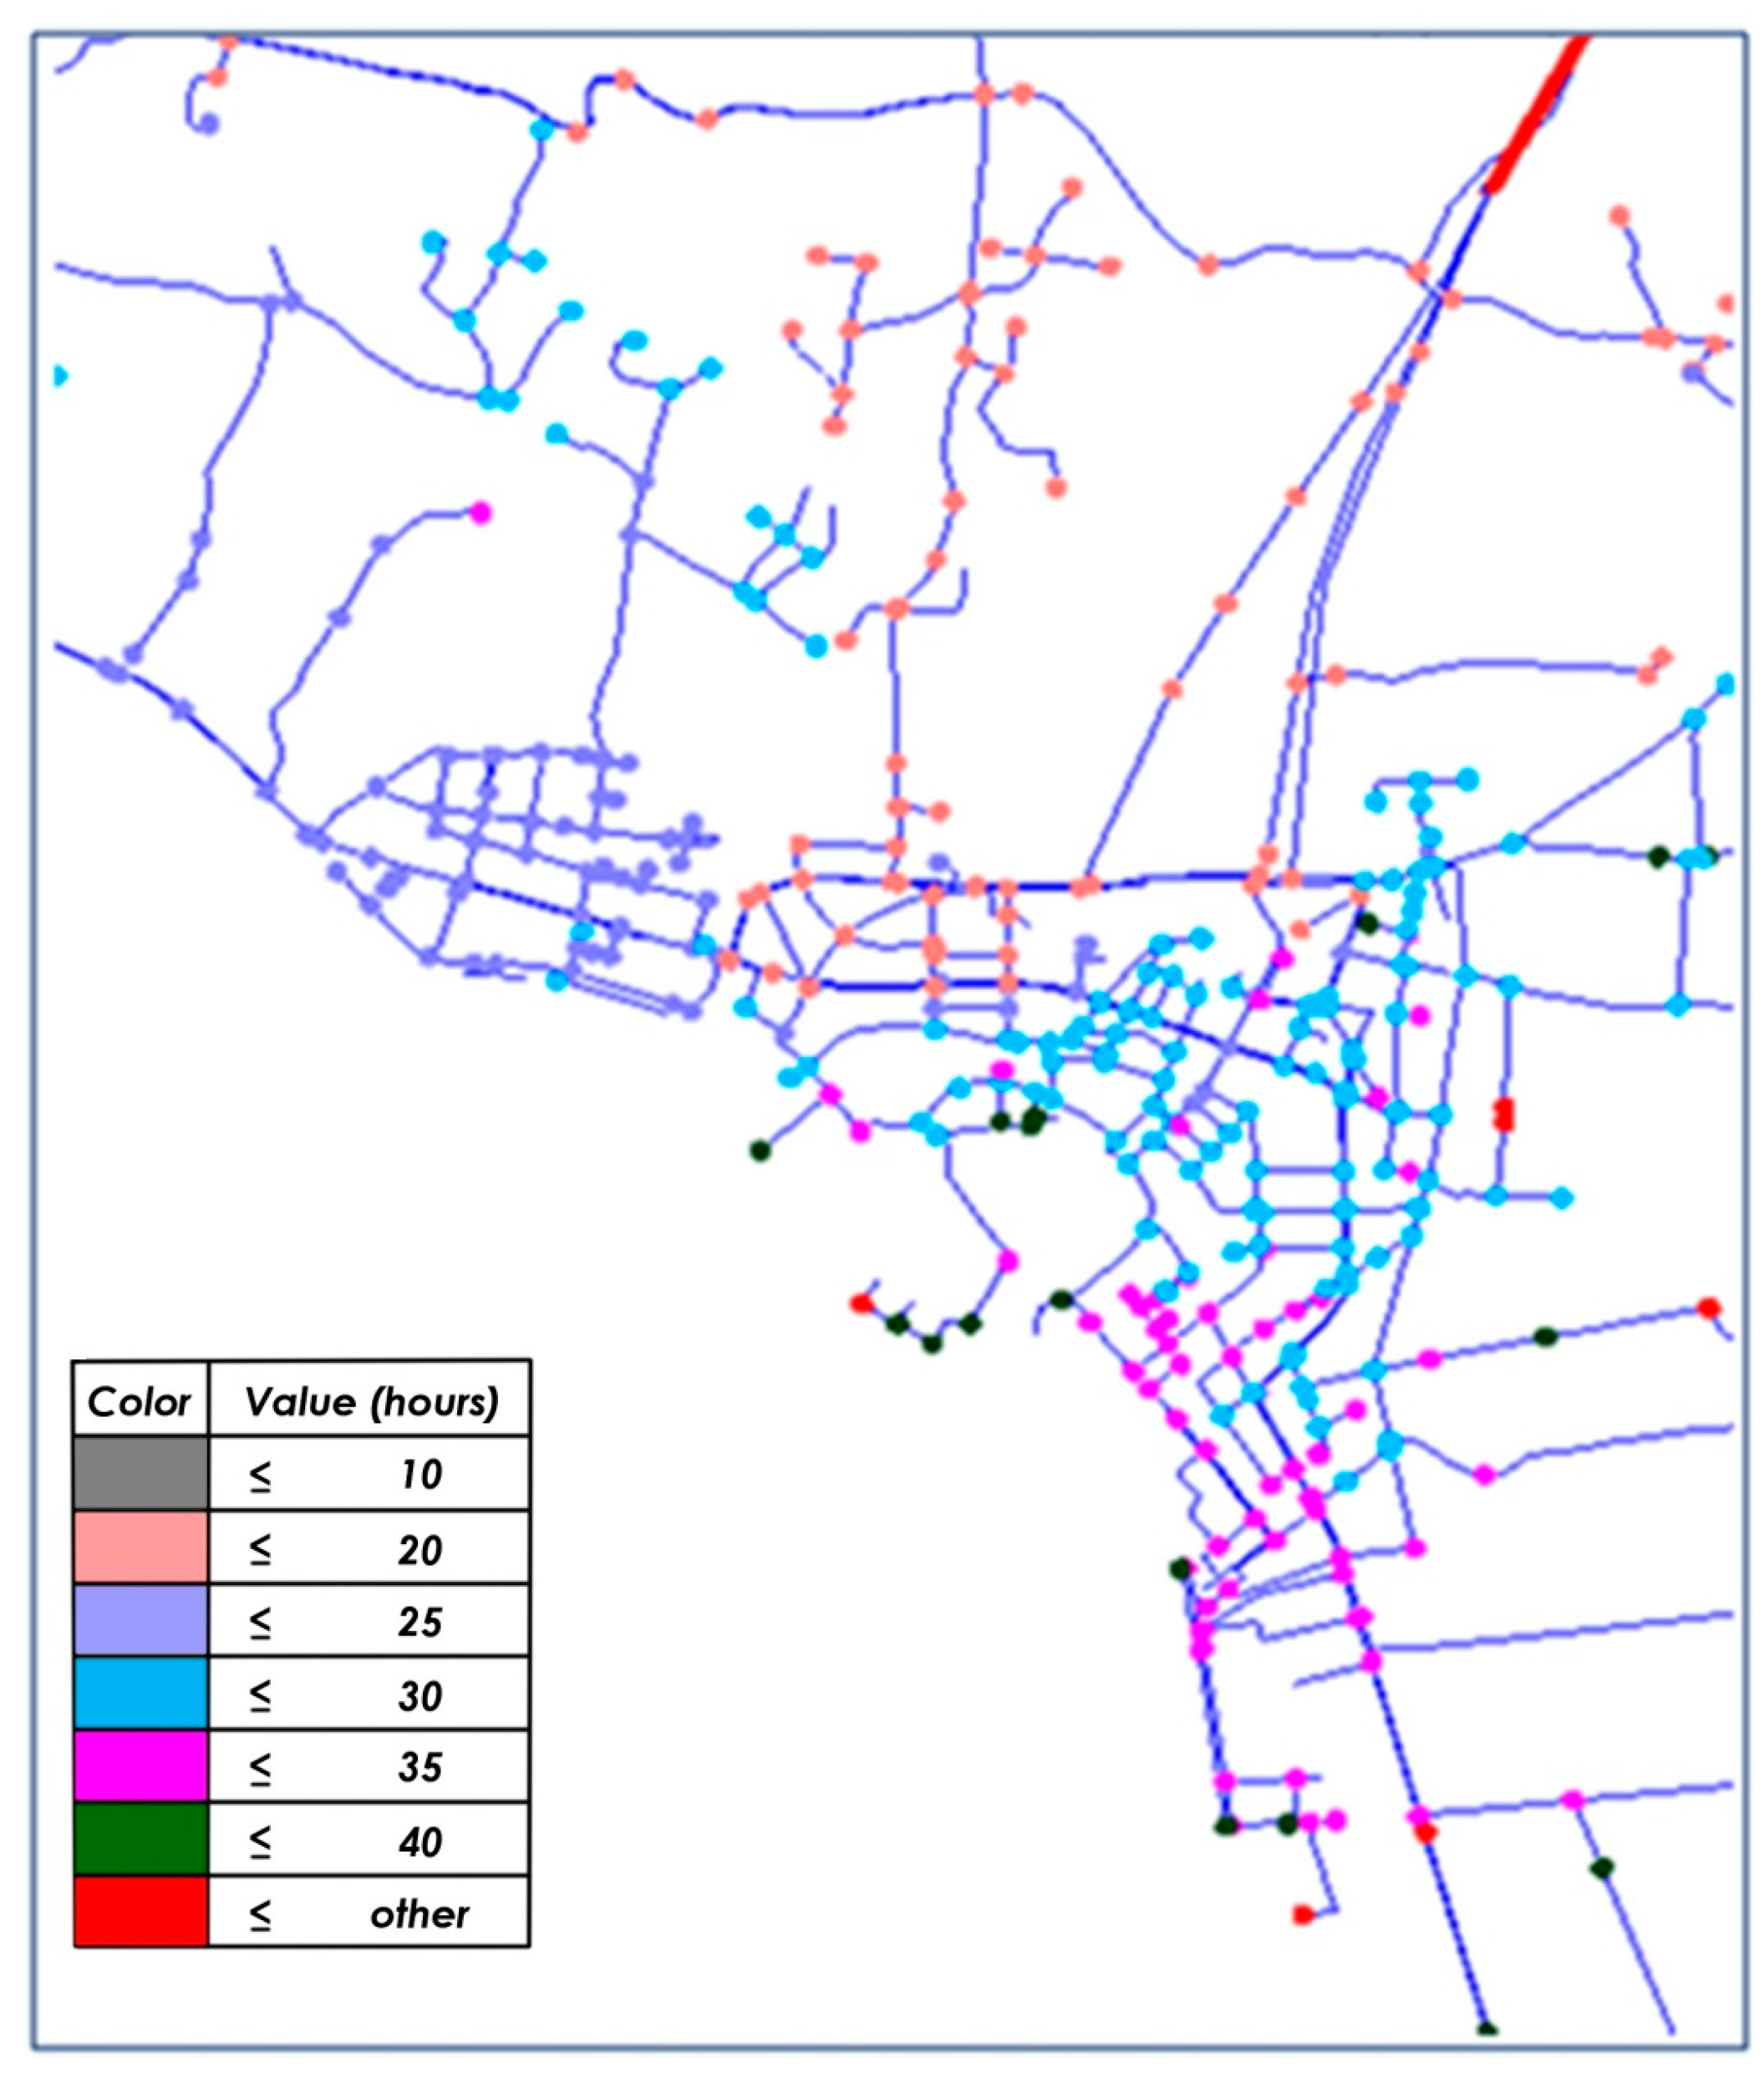
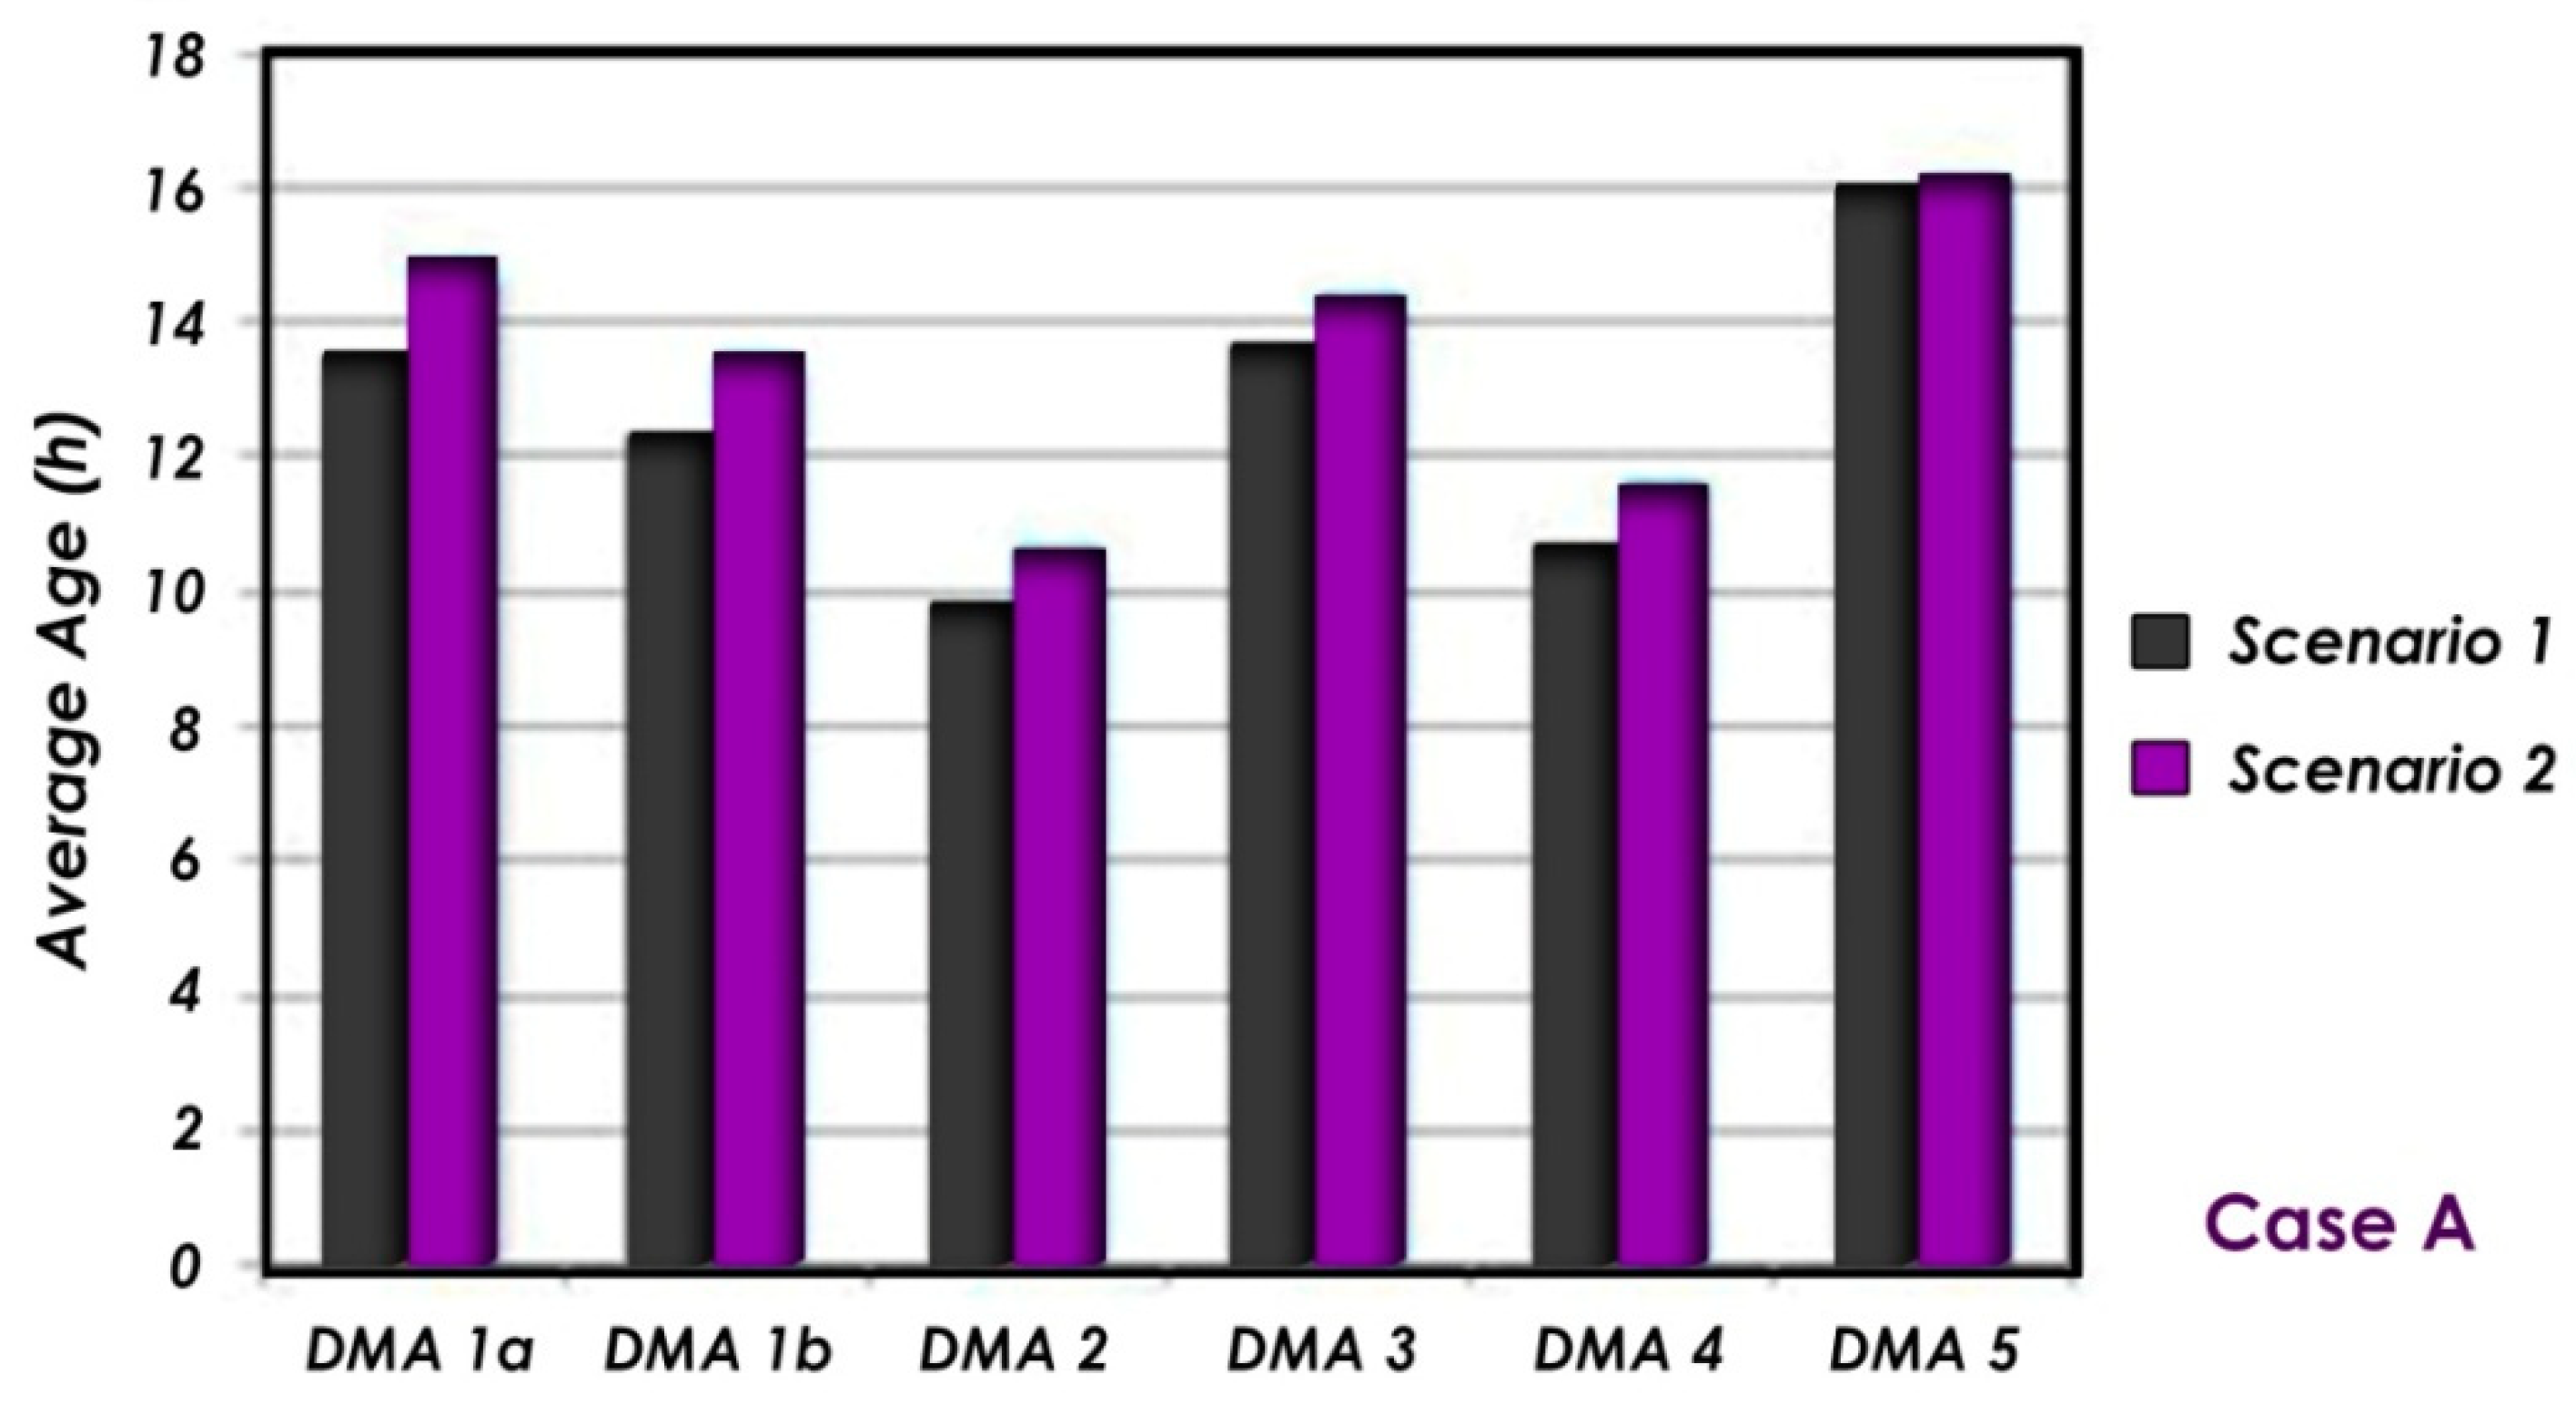
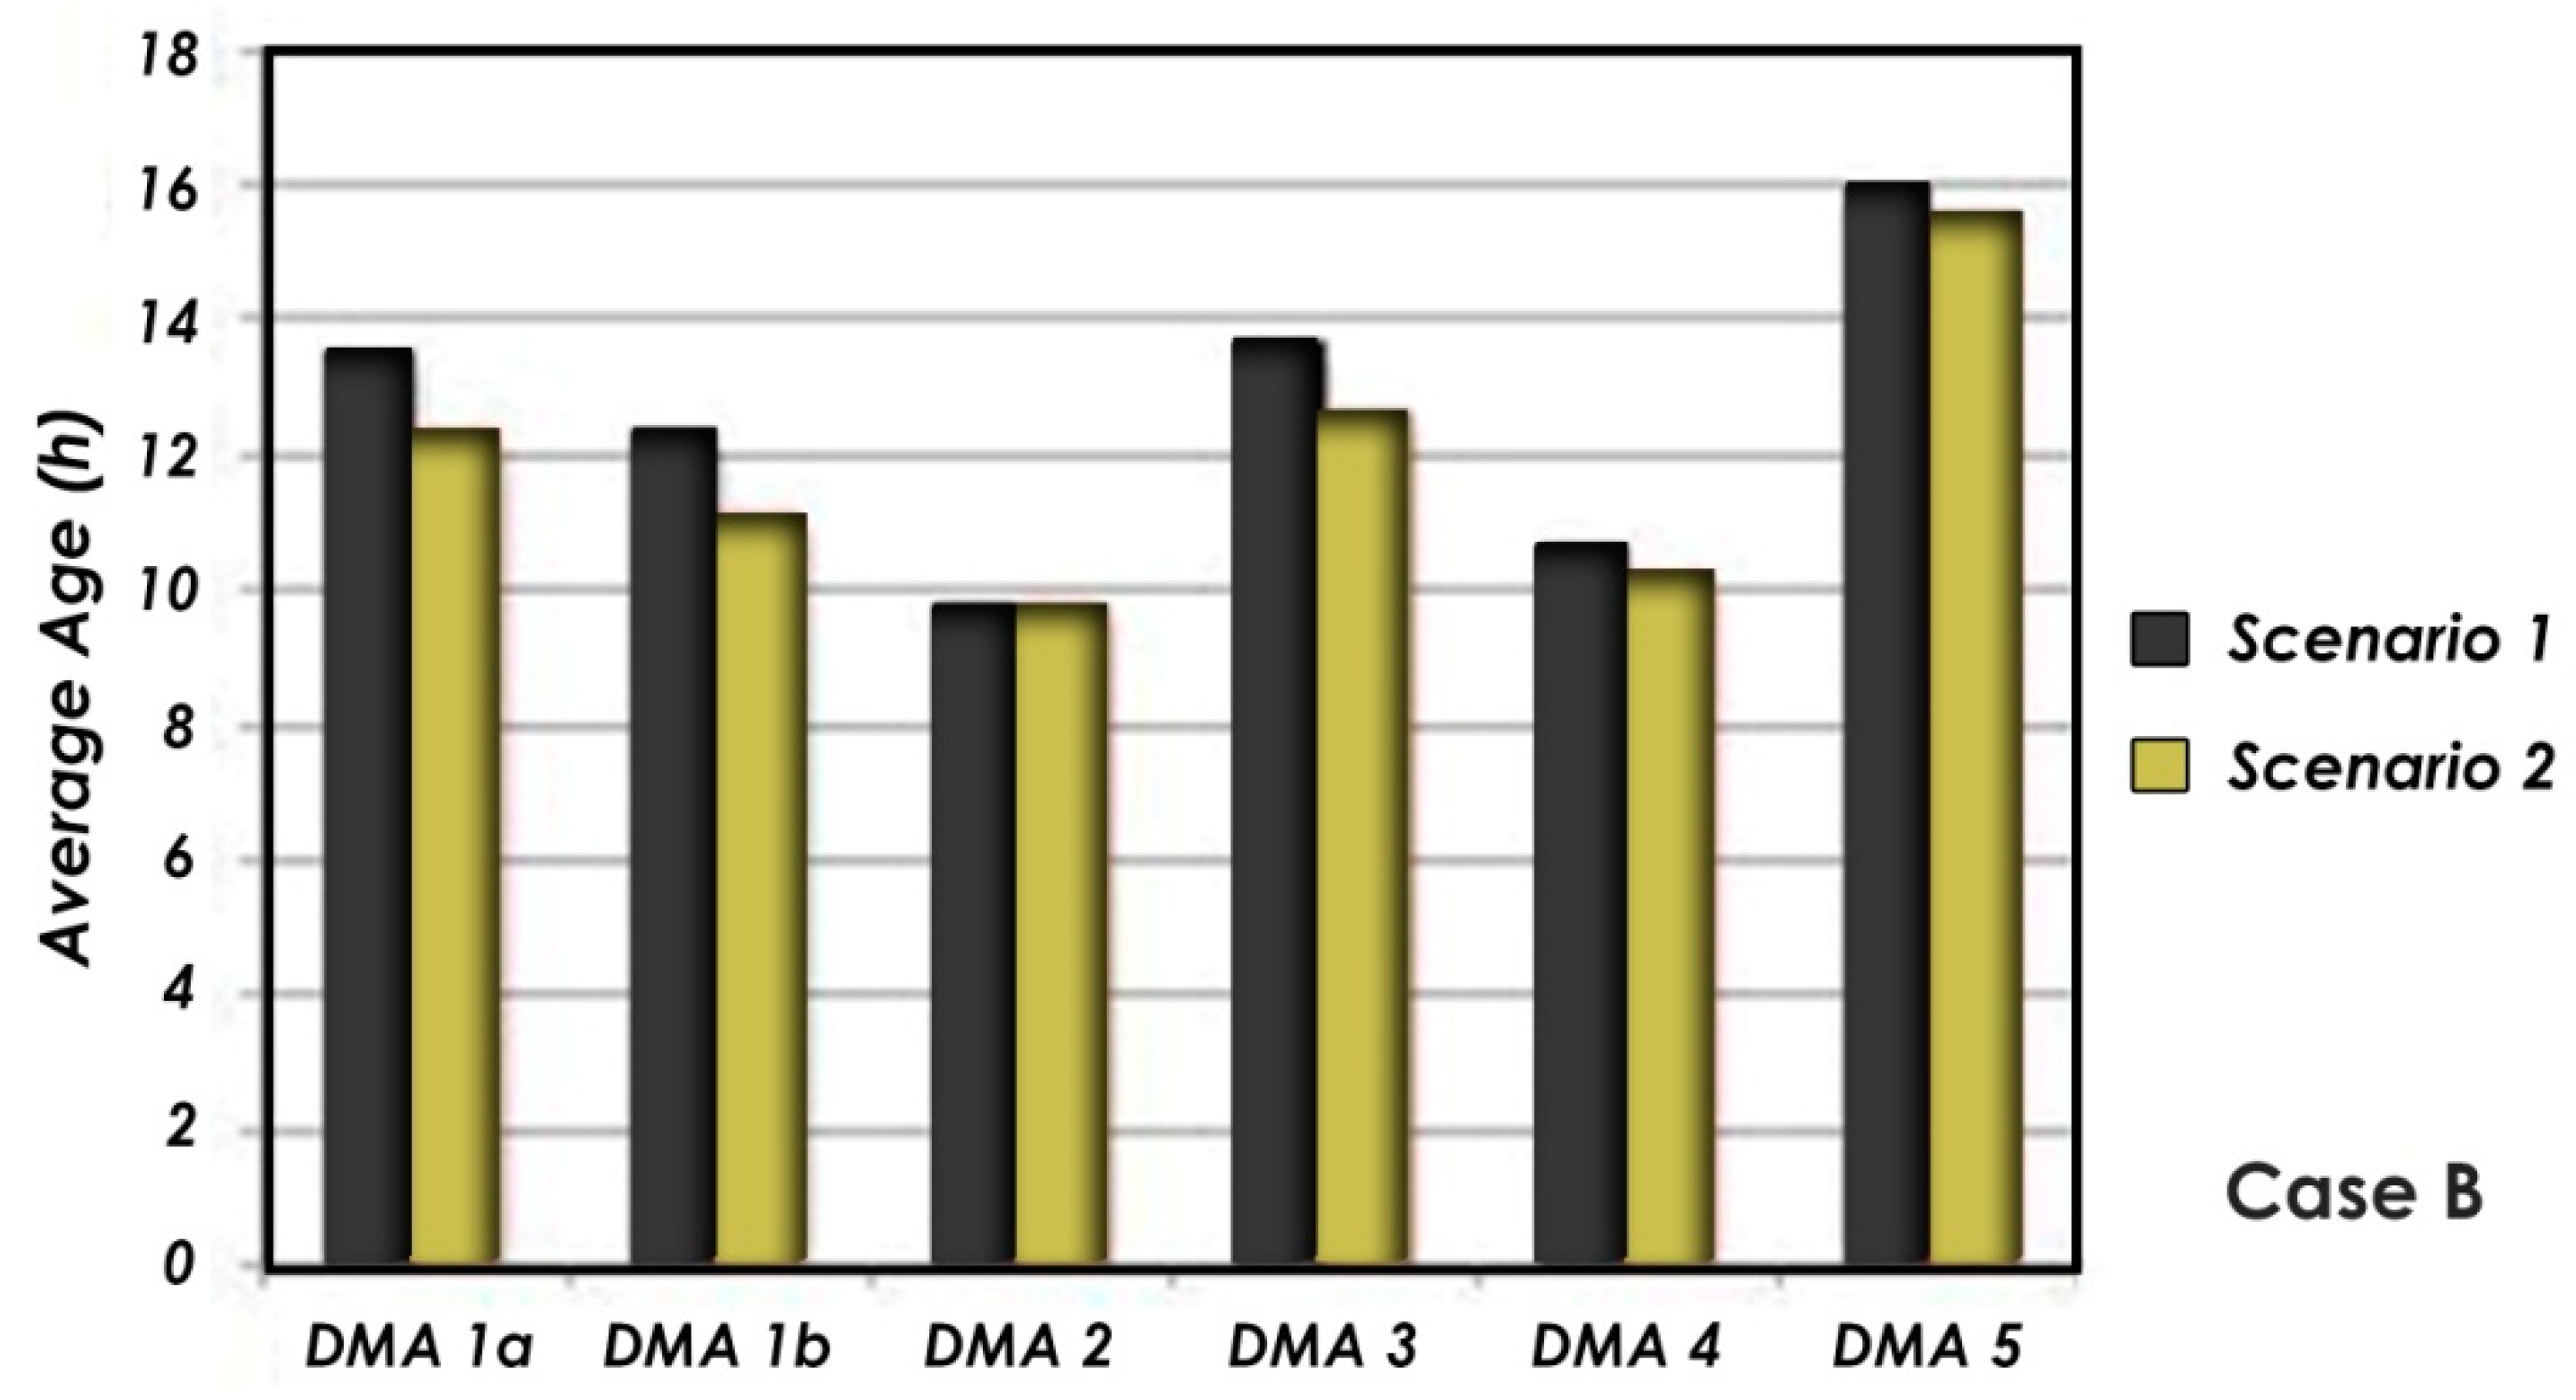
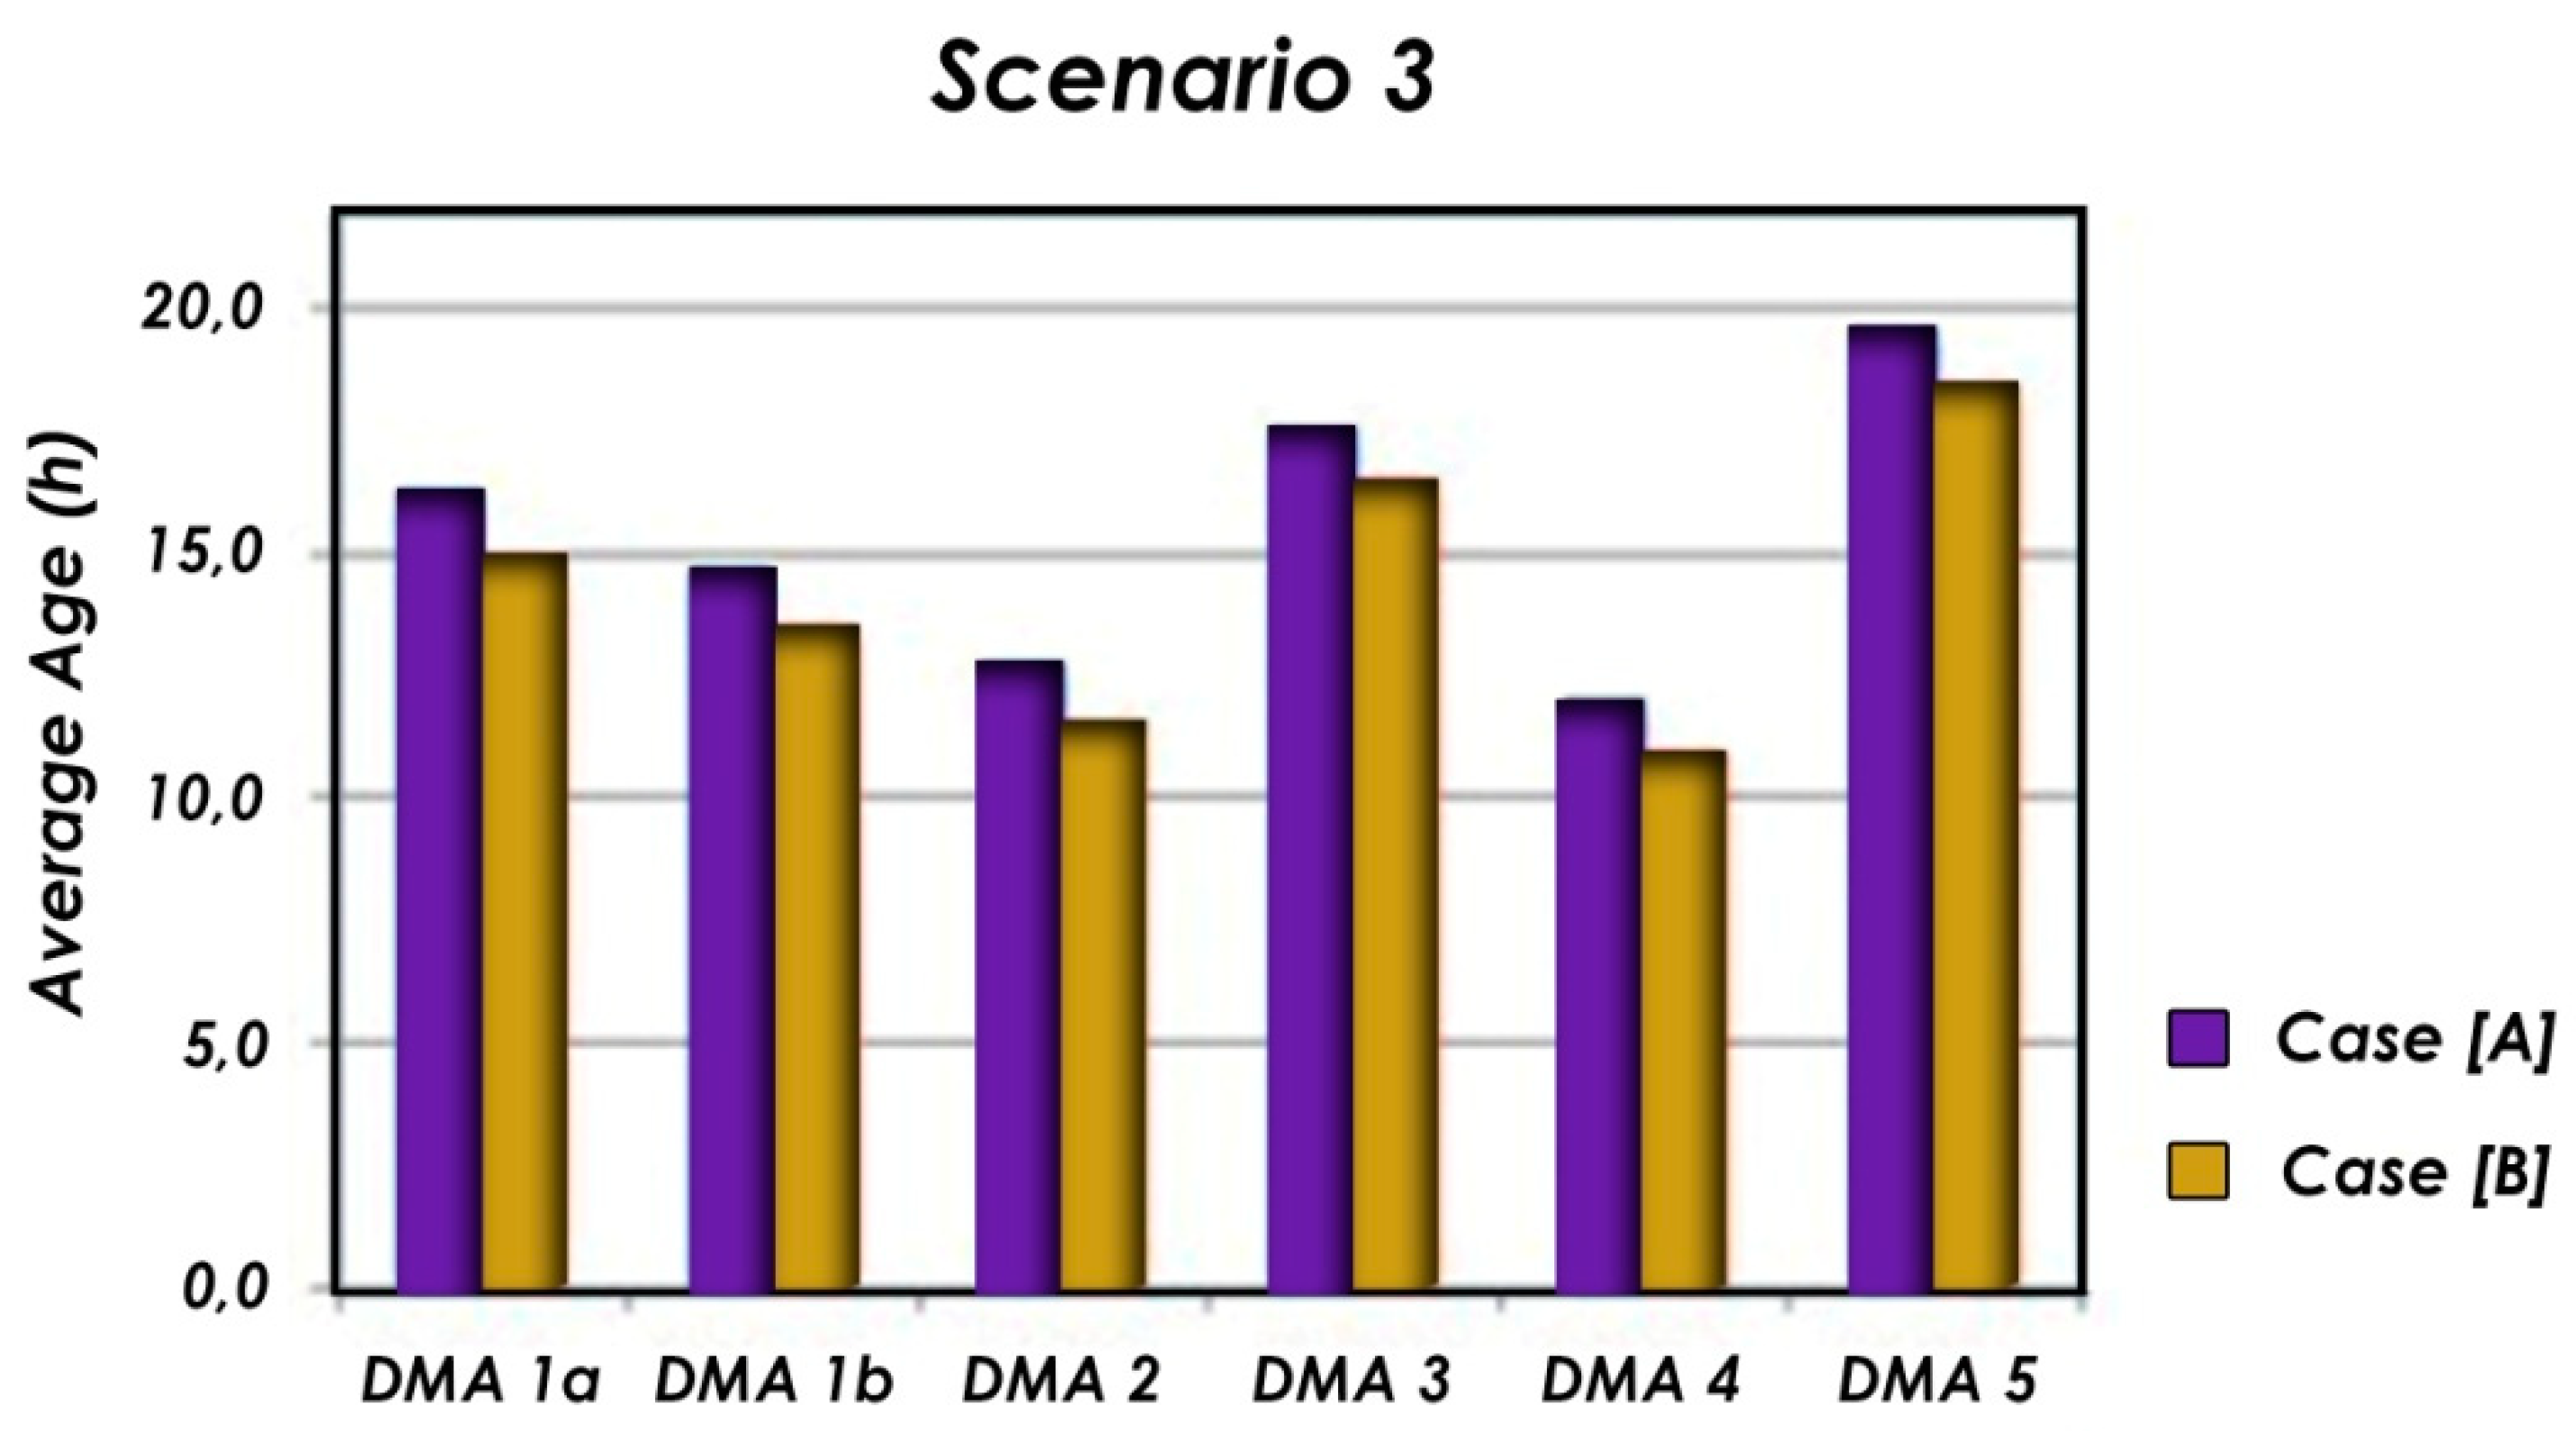
The present study took place on an existing DMAs’ formation which was based on the optimization of pressure. This formation was quite effective in terms of pressure reduction but had not been checked regarding its impact on the age of the water. As previously mentioned, pressure reduction results in reduced actual water use and water losses volumes (pressure dependent). Thus, water inside the network pipes is not adequately refreshed. Therefore, there are two competitive criteria to be considered during the optimal formation of DMAs in a WDN. This is a complex problem where, although the ultimate goal is to reduce the water pressure (and thus the water loss volumes), it can also include the need for water age reduction if certain goals have been achieved regarding the operating pressure in certain nodes of the WDN. Following this guide, a new formation of DMAs resulted, based on a simple idea of avoiding the creation of new dead ends (apart from the unavoidable ending pipes) and closing bigger diameter pipes inside the WDN. The main aim was to force water to bypass any closed pipe and use smaller diameter ones in order to meet the water needs in each node. In smaller diameters, water travels faster, resulting in higher refreshing ratios. All nodes receive the needed water volumes in a pressure of at least 200 kPa. This process resulted in dividing the WDN into four DMAs (Figure 9). The results of nodal water age are presented (Figure 10). This scenario is named B. The resulted nodal water ages are compared to the ones of the previous scenarios (Figure 11, Figure 12 and Figure 13).
The results for Scenario B showed that the water age was improved, as it was reduced by 4%–10%. As expected, this reduction was linked to an increase in pressure that ranged only from 1% to 4%. Despite the previous scenarios, now the water pressure in each DMA after the installation of the PRVs (Scenario No3) ranged from 220 to 290 kPa, resulting in reduced total water loss volume for Scenario B. Finally, a reduction in the system’s average water age (difference up to 2 h after 48 h of analysis) is positive regarding the quality of the service, as the minimum of 0.2 mg per liter of the disinfectant is adequate. The less the water ages, the more the disinfectant is sufficient.

4. Conclusions

The present study used the hydraulic model of Kos town WDN, capital of the homonymous Greek island that is a famous summer destination. This WDN was initially divided in DMAs, optimally formed to achieve the most effective pressure regulation, to reduce the water pressure throughout the entire network as much as possible, installing the necessary PRVs in the entering points of each DMA in the most cost-effective way. The PRV in every DMA was optimally set up to provide the minimum downstream pressure in order to supply the critical node with the desired water at a pressure of just 200 kPa (Greek Legislation lowest acceptable water supply level). This was the base criterion used. This step by step process of DMA formation and installation of the necessary PRVs formed three scenarios (no DMAs; with DMAs-no PRVs; with DMAs-with PRVs) that were virtually tested (utilizing the WDN’s hydraulic model) in order to prove the efficiency of the Pressure Management strategy adopted and gradually implemented by the local water utility [3,13]. In the current study, the above three scenarios were tested regarding their impact on the age of the water that flows inside the network pipes. This was a new criterion. The results proved to be exactly the opposite of the ones that came out of the pressure-driven WDN management. The age of water was growing as the pressure of water decreased, as the latter resulted in reduced actual water use and water loss volumes (both are pressure-dependent). Pressure management is vital in many cases as it preserves Earth’s most valuable asset, i.e., the water. Nevertheless, the age of the water flowing inside the pipes of a WDN must be monitored too, to safeguard its basic character, to keep it fresh. By increasing the PRV’s downstream pressure in each DMA, allowing water to come through with more pressure, the age of the water started to decline, and the water quality raised. Using both criteria (pressure vs. age) a balancing set up (regarding the PRV’s downstream pressure) was achieved for each DMA in Kos WDNs’ model. Moving a little further, a different approach in DMAs’ formation process allowed better results in water age. Aiming to circulate water and avoid dead ends in the network, a new formation of DMAs was proposed. Their number was also decreased. The hydraulic simulation that followed proved that combining the optimum formation of DMAs based on the water age criterion and implementing PRVs afterwards can have a similar effect on pressure regulation without the negative impacts on water quality. The presented results aim to raise awareness to managers of water utilities and PM technical personnel. Water age should always be considered before drafting, planning and implementing a PM strategy. The novelty of this study has to do with the attempt to compare the two aspects. The topic of water aging in water distribution networks due to pressure regulation is new and interesting. Although, unfortunately, this aspect is usually neglected, in some cases it can be important. The main concern of the present article is to raise the responsibility factor of PM towards Water Age and to present the value of such an approach. The optimal design of DMAs to keep Water Age to a minimum and PM to a maximum level is a great multiparameter problem expected to attract the interest of international research. Along with the above, studies can be carried out to determine if quality deterioration of the system’s pipelines affect water quality and age, as well as if quality water sources and reclaimed water can help to minimize water age [37].

Author Contributions

V.K. provided the guidelines and the tools for the study; M.P. and A.K. conceived and designed the scenarios studied; A.K. analyzed the data; M.P. and A.K. drafted the initial version of the paper; V.K. reviewed, enriched and finalized the paper. All authors have read and agreed to the published version of the manuscript.

Funding

This research received no external funding.

Conflicts of Interest

The authors declare no conflicts of interest.

References

  1. Charalambous, B. Experience in DMA redesign at water board of Lemesos, Cyprus. In Proceedings of the IWA Specialized Conference Leakage, Halifax, NS, Canada, 12–14 September 2005. [Google Scholar]
  2. MacDonald, G.; Yates, C. DMA design and implementation, an American context. In Proceedings of the IWA Specialized Conference Leakage, Halifax, NS, Canada, 12–14 September 2005. [Google Scholar]
  3. Rogers, D. Reducing leakage in Jakarta, Indonesia. In Proceedings of the IWA Specialized Conference Leakage, Halifax, NS, Canada, 12–14 September 2005. [Google Scholar]
  4. Araujo, L.; Ramos, H.; Coelho, S. Pressure Control for Leakage minimization in Water Distribution Systems Management. Water Resour. Manag. 2006, 1, 133–149. [Google Scholar] [CrossRef]
  5. Kanakoudis, V.; Muhammetoglu, H. Urban water pipe networks management towards NRW reduction: Two case studies from Greece & Turkey. CLEAN Soil Air Water 2014, 2, 880–892. [Google Scholar]
  6. Kanakoudis, V.; Gonelas, K. Applying pressure management to reduce water losses in two Greek cities’ Water Distribution Systems: Expectations, problems, results and revisions. Procedia Eng. 2014, 89, 318–325. [Google Scholar] [CrossRef] [Green Version]
  7. Savic, D.; Ferrari, G. Economic Performance of DMAs in Water Distribution Systems. Procedia Eng. 2015, 189–195. [Google Scholar]
  8. Kanakoudis, V.; Gonelas, K. The joint effect of water price changes and pressure management, at the economic annual real losses level, on the system input volume of a water distribution system. Water Sci. Technol. Water Suppl. 2015, 15, 1069–1078. [Google Scholar] [CrossRef]
  9. Wright, R.; Abraham, E.; Parpas, P.; Stoianov, I. Control of water distribution networks with dynamic DMA topology using strictly feasible sequential convex programming. Water Resour. Res. 2015, 51, 9925–9941. [Google Scholar] [CrossRef] [Green Version]
  10. Kanakoudis, V.; Gonelas, K. The optimal balance point between NRW reduction measures, full water costing and water pricing in water distribution systems. Alternative scenarios forecasting Κozani’s WDS optimal balance point. Procedia Eng. 2015, 119, 1278–1287. [Google Scholar] [CrossRef] [Green Version]
  11. Vicente, J.; Garrote, L.; Sánchez, R.; Santillán, D. Pressure Management in Water Distribution Systems Current Status, Proposals, and Future Trends. Water Resour. Plann. Manag. 2016, 142, 4015061. [Google Scholar] [CrossRef]
  12. Kanakoudis, V.; Gonelas, K. Non-revenue water reduction through pressure management in Kozani’s water distribution network: From theory to practice. Desalin. Water Treat. 2016, 57, 11436–11446. [Google Scholar] [CrossRef]
  13. Kanakoudis, V.; Gonelas, K. Assessing the results of a virtual pressure management project applied in Kos Town water distribution network. Desalin. Water Treat. 2016, 57, 11472–11483. [Google Scholar] [CrossRef]
  14. Gonelas, K.; Kanakoudis, V. Reaching Economic Leakage Level through Pressure Management. Water Sci. Technol. Water Suppl. 2016, 16, 756–765. [Google Scholar] [CrossRef]
  15. Kanakoudis, V.; Gonelas, K. Analysis and calculation of the short and long run economic leakage level in a water distribution system. Water Util. 2016, 12, 57–66. [Google Scholar]
  16. Kanakoudis, V.; Tsitsifli, S.; Demetriou, D. Applying an integrated methodology toward non-revenue water reduction: The case of Nicosia, Cyprus. Desalin. Water Treat. 2016, 57, 11447–11461. [Google Scholar] [CrossRef]
  17. Patelis, M.; Kanakoudis, V.; Gonelas, K. Combining pressure management and energy recovery benefits in a water distribution system installing PATs. Water Supply Res. Technol. AQUA 2017, 66, 520–527. [Google Scholar] [CrossRef] [Green Version]
  18. Korkana, P.; Kanakoudis, V.; Patelis, M.; Gonelas, K. Forming district metered areas in a water distribution network using genetic algorithms. Procedia Eng. 2016, 162, 511–520. [Google Scholar] [CrossRef] [Green Version]
  19. Korkana, P.; Kanakoudis, V.; Makrysopoulos, A.; Patelis, M.; Gonelas, K. Developing an optimization algorithm to form district metered areas in a water distribution system. Procedia Eng. 2016, 162, 530–536. [Google Scholar] [CrossRef] [Green Version]
  20. Gonelas, K.; Chondronasios, A.; Kanakoudis, V.; Patelis, M.; Korkana, P. Forming DMAs in a water distribution network considering the operating pressure and the chlorine residual concentration as the design parameters. Hydroinformatics 2017, 19, 900–910. [Google Scholar] [CrossRef] [Green Version]
  21. Chatzivasili, S.; Papadimitriou, K.; Kanakoudis, V.; Patelis, M. Optimizing the formation of DMAs in a water distribution network applying Geometric Partitioning (GP) and Gaussian Mixture Models (GMMs). Proceedings 2018, 2, 601. [Google Scholar] [CrossRef] [Green Version]
  22. Chatzivasili, S.; Papadimitriou, K.; Kanakoudis, V. Optimizing the formation of DMAs in a water distribution network through advanced modelling. Water 2019, 11, 278. [Google Scholar] [CrossRef] [Green Version]
  23. Chondronasios, A.; Gonelas, K.; Kanakoudis, V.; Patelis, M.; Korkana, P. Optimizing DMAs’ formation in a water pipe network: The water aging and the operating pressure factors. Hydroinformatics 2017, 19, 890–899. [Google Scholar] [CrossRef] [Green Version]
  24. Shamsaei, H.; Jaafar, O.; Basri, N. Disadvantage pressure changes on the decline of water quality in water distribution systems. Engineering 2013, 5, 97–105. [Google Scholar] [CrossRef] [Green Version]
  25. Dan Barr, P.E. Dealing with high water age in a water distribution system. In Ohio AWWA Southeast District Fall Meeting; 2013; Available online: https://www.slideserve.com/pier/dealing-with-high-water-age-in-a-water-distribution-system (accessed on 2 February 2020).
  26. AWWA. Effects of Water Age on Distribution System Water Quality, Office of Water (4601M) Prepared for U.S.; Environmental Protection Agency: Washington, DC, USA, 2002. Available online: https://www.epa.gov/sites/production/files/2015-09/documents/2007_05_18_disinfection_tcr_whitepaper_tcr_waterdistribution.pdf (accessed on 2 January 2020).
  27. The National Academic Press. Drinking Water Distribution Systems: Assessing and Reducing Risks, Chapter 5: Hydraulic Integrity; National Research Council: Washington DC, USA, 2006; Available online: https://doi.org/10.17226/11728 (accessed on 2 January 2020).
  28. Robinson, L.; Edwards, J.; Willnow, L. Computer Modeling of Water Distribution Systems; Manual M32; AWWA: Denver, CO, USA, 2012. [Google Scholar]
  29. Cruickshank, R. Hydraulic Models Shed Light on Water Age. Opflow 2010, 36, 18–21. [Google Scholar] [CrossRef]
  30. EPA. Water Quality in Small Community Distribution Systems—A Reference Guide for Operators; EPA: Cincinnati, OH, USA, 2008.
  31. Rowling, J. Introduction to Water Distribution: A Basic/Intermediate Course for Water System Operators (Principles and Practices of Water Supply Operations, V. 3); AWWA: Denver, CO, USA, 1986. [Google Scholar]
  32. Fu, G.; Kapelan, Z.; Kasprzyk, J.R.; Reed, P. Optimal design of water distribution systems using many-objective visual analytics. J. Water Resour. Plan. Manag. 2013, 139, 624–633. [Google Scholar] [CrossRef] [Green Version]
  33. Ghorbanian, V.; Karney, B.W.; Guo, Y. Minimum pressure criterion in water distribution systems: Challenges and consequences. In Proceedings of the World Environmental and Water Resources Congress 2015, Austin, TX, USA, 17–21 May 2015; pp. 777–791. [Google Scholar]
  34. Kravvari, A.; Kanakoudis, V.; Patelis, M. The impact of pressure management techniques on the water age in an urban pipe network-The case of Kos city network. Proceedings 2018, 2, 699. [Google Scholar] [CrossRef] [Green Version]
  35. Kanakoudis, V.; Gonelas, K. Properly allocating the urban waters meters’ readings to the nodes of a waterpipe network simulation model in a developing water utility. Desalin. Water Treat. 2015, 54, 2190–2203. [Google Scholar] [CrossRef]
  36. Kanakoudis, V.; Gonelas, K. Accurate water demand spatial allocation for water networks modeling using a new approach. Urban Water 2015, 12, 362–379. [Google Scholar] [CrossRef]
  37. Rak, J.; Pietrucha-Urbanik, K. An approach to determine risk indices for drinking water—Study investigation. Sustainability 2019, 11, 3189. [Google Scholar] [CrossRef] [Green Version]
  38. Kanakoudis, V.; Tsitsifli, S. Using the Bimonthly WB of a Non-Fully Monitored Water Distribution Network with Seasonal Water Demand Peaks to define its Actual NRW Level: The case of Kos Town, Greece. Urban Water 2014, 11, 348–360. [Google Scholar] [CrossRef]
  39. TOTEE 2411/1986. Infrastructures in Buildings and Plots of Land, Delivery of Cold-Hot Water. Governmental Gazette 834B/16-11-1988. 1988. Available online: http://portal.tee.gr/portal/page/portal/SCIENTIFIC_WORK/tech_odigies_totee/totee_2411_86.pdf (accessed on 2 February 2020). (In Greek).
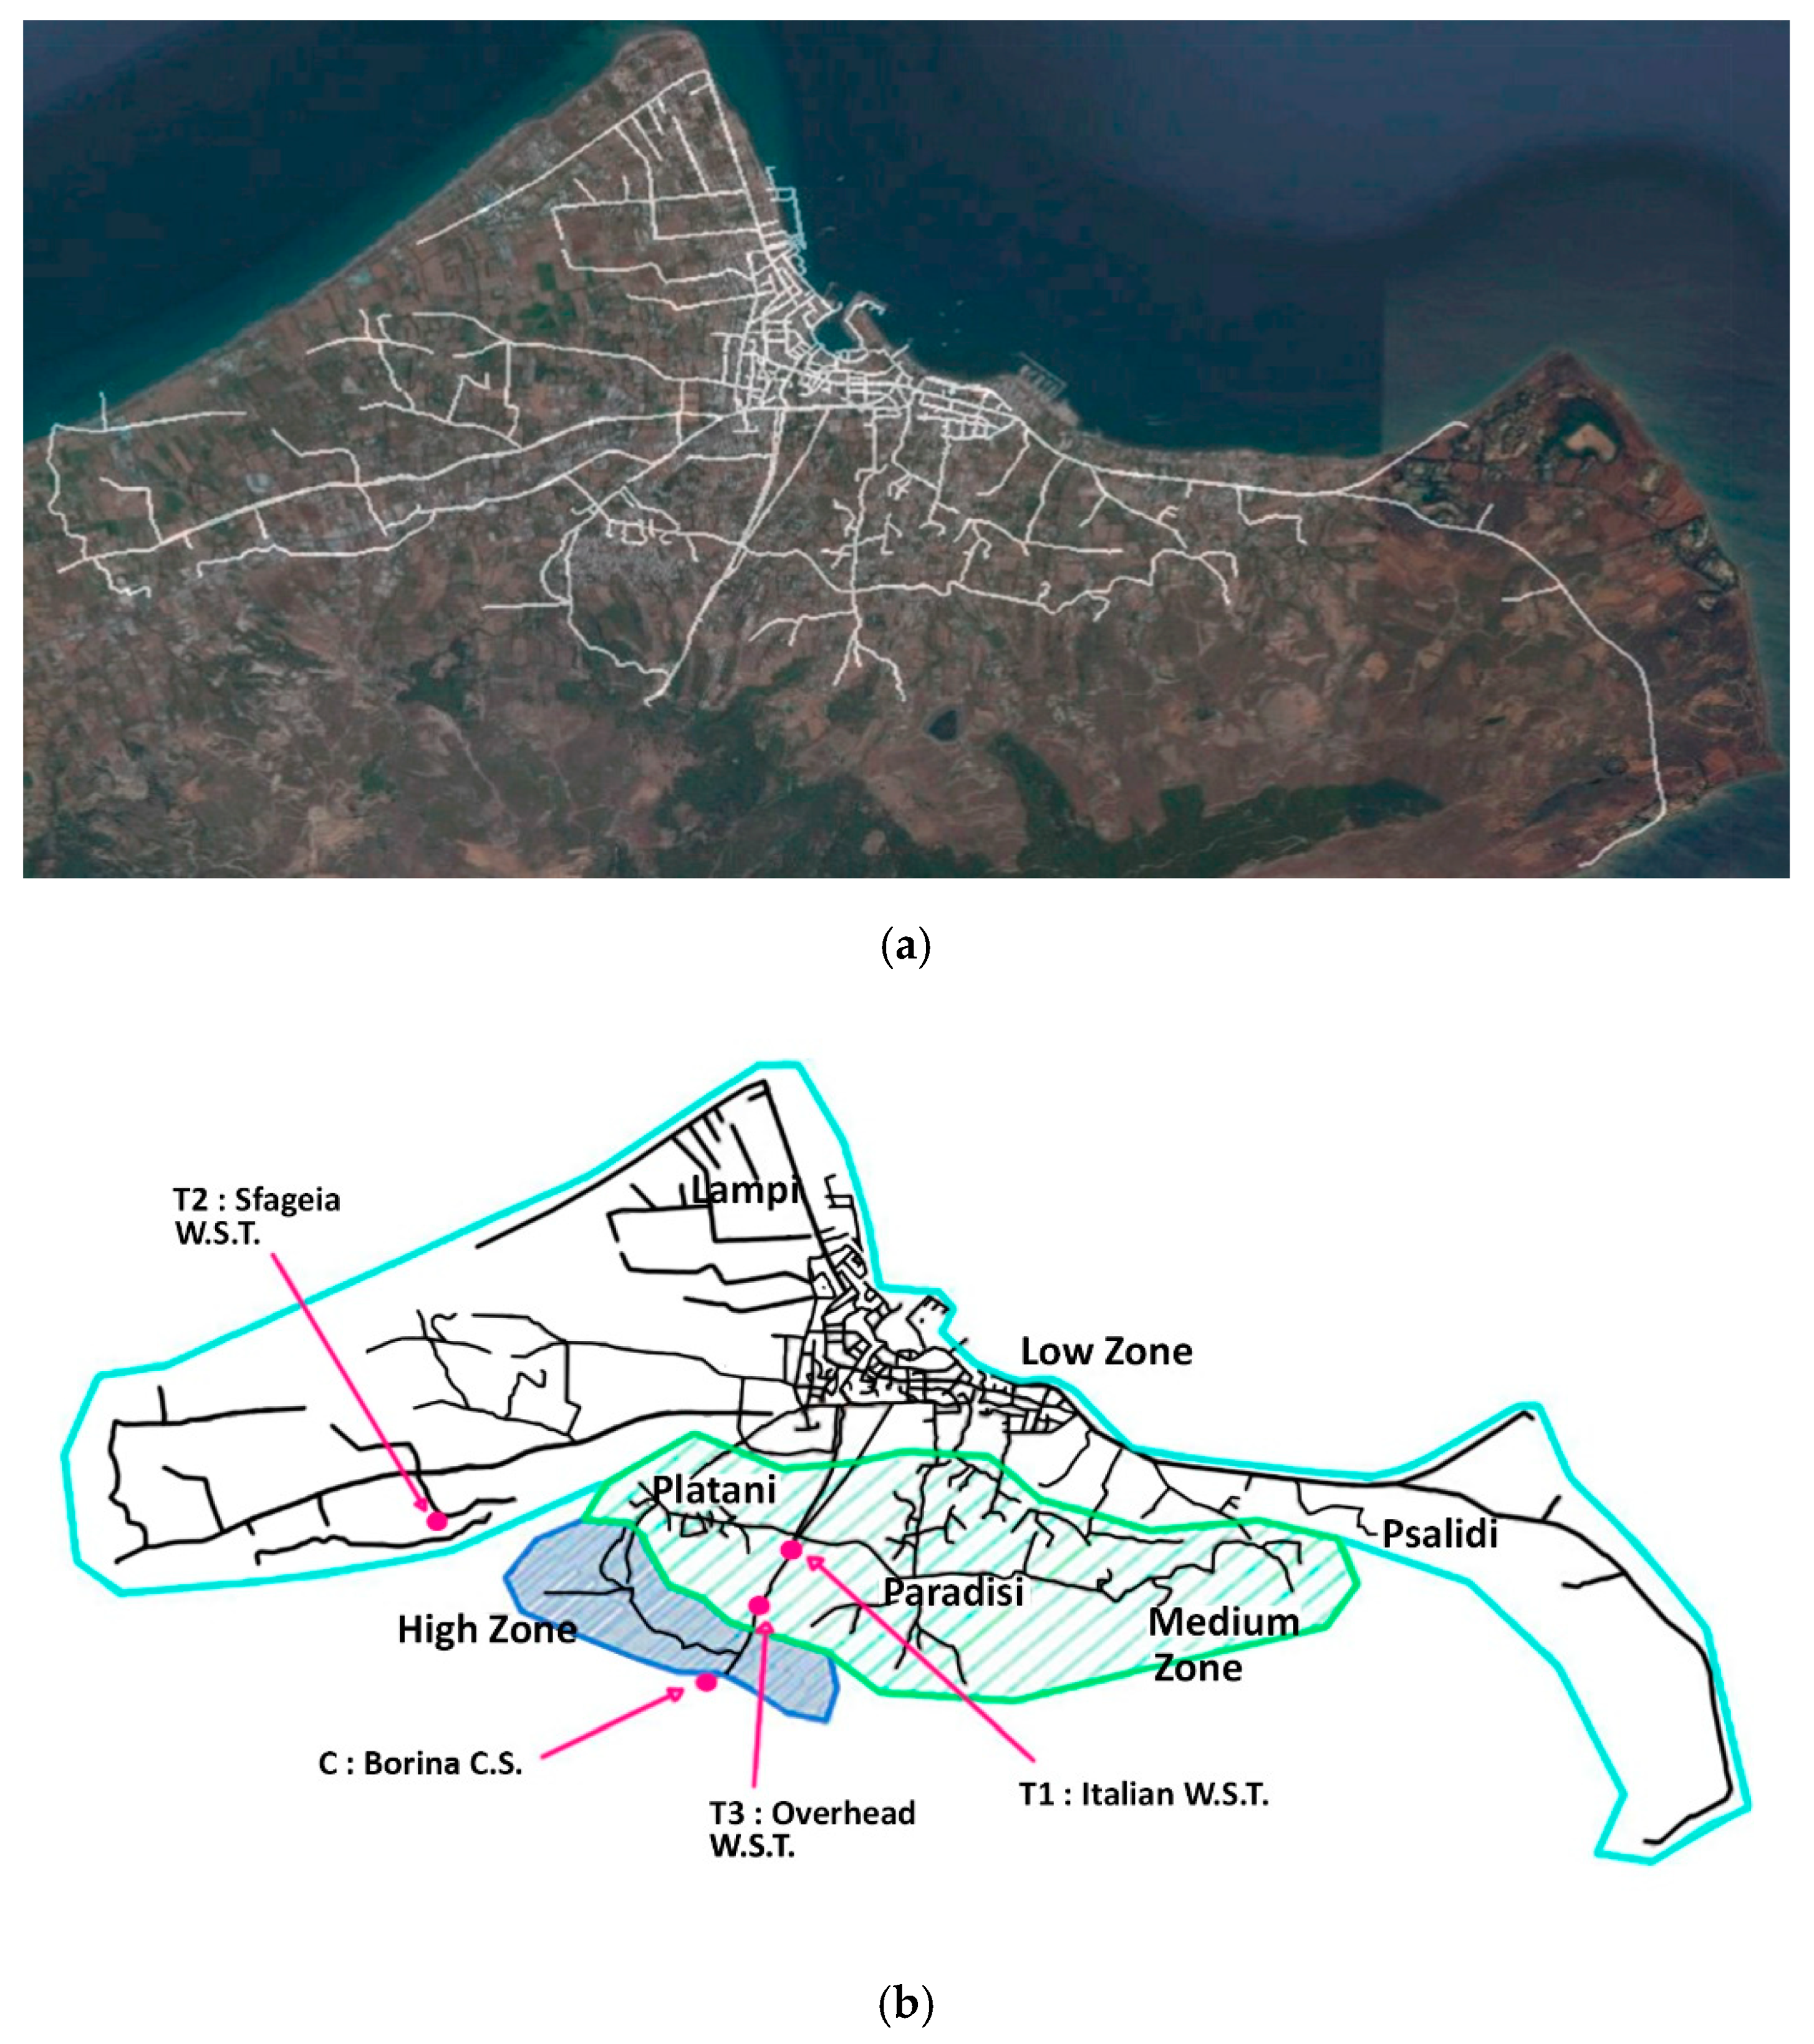
Figure 1. Distribution network of Kos town in Goggle Earth (a); and in CAD format (b).
Water 12 01323 g001
Figure 2. District Metered Areas (DMAs) formation based on the optimal pressure at the critical node of each DMA.
Water 12 01323 g002
Figure 3. Scenario No1_Pressure critical nodes (red) vs. Age critical nodes (blue).
Water 12 01323 g003
Figure 4. Scenario No2_Pressure critical nodes (red) vs. Age critical nodes (blue).
Water 12 01323 g004
Figure 5. Scenario No3_Pressure critical nodes (red) vs. Age critical nodes (blue).
Water 12 01323 g005
Figure 6. Average age of water in each DMA for the three scenarios studied.
Water 12 01323 g006
Figure 7. Water demand in each DMA for the three scenarios studied.
Water 12 01323 g007
Figure 8. Average pressure, average age and demand for each DMA and for each one of the six new cases (af).
Water 12 01323 g008aWater 12 01323 g008b
Figure 9. New formation of DMAs (Scenario B).
Water 12 01323 g009
Figure 10. Nodal water age after 48 h of analysis.
Water 12 01323 g010
Figure 11. Average Age of water for Scenario 1 and 2 in case A.
Water 12 01323 g011
Figure 12. Average Age of water for Scenario 1 and 2 in case B.
Water 12 01323 g012
Figure 13. Water Age for scenarios A and B.
Water 12 01323 g013
Table 1. Scenario No1 (Initial Settings. No DMAs_No Pressure Reducing Values (PRVs)): (a) Critical nodes per DMA based on the water pressure. Respective water age and water demand values; (b) Critical nodes per DMA based on the water age. Respective water pressure and demand values.
Scenario No1: noDMAs_no PRVs
Critical Nodes Per DMA Based on the Water Pressure
Pressure (kPa)Age (h)Demand (m3/h)
DMAsCritical NodeMean value per DMAMean value at critical nodeMean value per DMAMean value at critical nodeMAX value at critical nodeMAX value at critical node
DMA 1aJ-135460.09401.9313.4915.5922.1620.26
DMA 1b14068494.02473.8812.2711.9116.8640.48
DMA 214049484.01457.199.7612.9718.0337.14
DMA 3K-116482.94489.7713.6213.7821.677.06
DMA 4213474.05430.6710.659.6612.5069.24
DMA 52996500.15492.5715.8813.2420.8532.1
Critical Nodes Per DMA Based on the Water Age
DMA 1aJ-137460.09407.8113.4916.3123.1310.1
DMA 1b241494.02494.0612.2713.2724.315.22
DMA 22515484.01503.879.7621.7733.651.76
DMA 32565482.94494.6813.6215.6722.966.82
DMA 4K-66474.05487.6810.6517.1722.3316.92
DMA 54656500.15497.1415.8820.6533.93.32
Table 2. Scenario No2 (withDMAs_no PRVs): (a) Critical nodes per DMA based on the water pressure. Respective water age and water demand values; (b) Critical nodes per DMA based on the water age. Respective water pressure and demand values.
Scenario No2: with DMAs_no PRVs
Critical Nodes Per DMA Based on the Water Pressure
Pressure (kPa)Age (h)Demand (m3/h)
DMAsCritical NodeMean value per DMAMean value at critical nodeMean value per DMAMean value at critical nodeMAX value at critical nodeMAX value at critical node
DMA 1aJ-135450.01391.7514.8215.9125.2620.26
DMA 1b14068482.91463.7813.4512.0720.0940.48
DMA 214049457.24430.5710.5612.9918.7837.14
DMA 3K-64470.95451.5814.1314.3622.1310.08
DMA 4213465.53422.1111.5110.5112.7469.24
DMA 5467480.40466.7515.9016.1024.5343.92
Critical Nodes Per DMA Based on the Water Age
DMA 1aJ-137460.09407.8114.8215.4725.6910.1
DMA 1b241494.02494.0613.4516.3727.5015.22
DMA 22515484.01503.8710.5622.7534.921.76
DMA 32565482.94494.6814.3615.6926.116.82
DMA 4K-66474.05487.6811.5114.0723.8516.92
DMA 54656500.15497.1415.9020.7633.543.32
Table 3. Scenario No3 (with DMAs_with PRVs): (a) Critical nodes per DMA based on the water pressure. Respective water age and water demand values; (b) Critical nodes per DMA based on the water age. Respective water pressure and demand values.
Scenario No3: with DMAs_with PRVs
Critical Nodes Per DMA Based on the Water Pressure
Pressure (kPa)Age (h)Demand (m3/h)
DMAsCritical NodeMean value per DMAMean value at critical nodeMean value per DMAMean value at critical nodeMAX value at critical nodeMAX value at critical node
DMA 1aJ-139262.58200.3816.2919.4327.338.16
DMA 1b14068296.02276.7414.7414.1720.8634.1
DMA 2220228.92201.2212.829.3511.6319.5
DMA 3K-64219.76203.4417.6517.8323.967.86
DMA 4213244.45208.8412.1111.0712.9655.16
DMA 5467220.24212.3919.6020.0027.1133.64
Critical Nodes Per DMA Based on the Water Age
DMA 1aJ-139262.58200.3816.2919.4327.338.16
DMA 1b130347296.02305.4114.7420.7129.562.84
DMA 22515228.92248.5712.8225.3535.661.38
DMA 3J-53219.76209.5417.6519.7327.9219.54
DMA 42181244.45251.8712.1112.1431.5820.32
DMA 54656220.24212.8719.6025.5139.112.56
Table 4. Water age and water demand values per DMA and for the entire water distribution network (WDN) for each one of the three scenarios studied.
Scenario No1: no DMAs_no PRVs
DMA1aDMA1bDMA2DMA3DMA4DMA5
Max water age (h)23.1324.3233.6622.9622.3333.94
Average max water age (h)18.9817.4512.1521.3614.3224.49
Average water age (h)13.4912.289.7713.6210.6615.89
Average water age for the entire WDN (h)12.62
Water demand (48 h) (m3)1105.50872.931280.421092.151467.651395.11
Total water demand for the entire WDN (m3)7213.76
Scenario No2: with DMAs_no PRVs
DMA1aDMA1bDMA2DMA3DMA4DMA5
Max water age (h)25.7027.5134.9326.1223.8533.55
Average max water age (h)22.0420.5214.7522.7016.5824.98
Average water age (h)14.8213.4610.5614.3711.5115.90
Average water age for the entire WDN (h)13.44
Water demand (48 h) (m3)1105.50872.931280.421092.151467.651395.11
Total water demand for the entire WDN (m3)7213.76
Scenario No3: with DMAs_with PRVs
DMA1aDMA1bDMA2DMA3DMA4DMA5
Max water age (h)27.3329.5735.6627.9331.5839.11
Average max water age (h)23.3121.3617.4123.3818.9026.99
Average water age (h)16.2914.7512.8317.6612.1119.60
Average water age for the entire WDN (h)15.54
Water demand (48 h) (m3)959.22779.171048.4887.491236.131127.53
Total water demand for the entire WDN (m3)6037.94
Note 1: nodes with linear dependence between water age and calculation time were excluded from the water age analysis. Note 2: definitions (a) Max water age per DMA is the max water age observed in the nodes of each DMA; (b) Average max water age is the mean value of the max values of the nodal water ages values observed for each DMA; (c) Average water age is the mean value of the nodal water age values observed for each DMA; (d) Average water age for the entire WDN is the mean value of the nodal water age values observed for the entire WDN.
Table 5. Initial Pressure Reducing Valves (PRVs) Pressure Settings.
Case a (Base Values)Case bCase cCase dCase eCase f
PRV labelPressure (kPa)Pressure (kPa)Pressure (kPa)Pressure (kPa)Pressure (kPa)Pressure (kPa)
PRV-1350Scenario a (base scenario) + 10 kPa Scenario a (base scenario) + 20 kPa Scenario a (base scenario) + 30 kPa Scenario a (base scenario) + 40 kPa Scenario a (base scenario) + 50 kPa
PRV-2232
PRV-3205
PRV-4213.5
PRV-5226
PRV-6227
PRV-7300
PRV-8227
PRV-9350
PRV-10225
PRV-11289.5
PRV-12299.5