Article

Assessing the Water-Stress Baselines by Thermal Imaging for Irrigation Management in Almond Plantations under Water Scarcity Conditions

by
Saray Gutiérrez-Gordillo
1,*,
Iván Francisco García-Tejero
1,
Víctor Hugo Durán Zuazo
2,
Amelia García Escalera
1,
Fernando Ferrera Gil
1,
José Juan Amores-Agüera
1,
Belén Cárceles Rodríguez
2 and
Virginia Hernández-Santana
3
1
Instituto Andaluz de Investigación y Formación Agraria y Pesquera (IFAPA), Centro “Las Torres-Tomejil”, Carretera Sevilla-Cazalla Km 12.2, 41200 Alcalá del Río (Sevilla), Spain
2
Instituto Andaluz de Investigación y Formación Agraria y Pesquera (IFAPA), Centro “Camino de Purchil”, Camino de Purchil s/n, 18004 Granada, Spain
3
Instituto de Recursos Naturales y Agrobiología de Sevilla, Consejo Superior de Investigaciones Científicas, Avda. Reina Mercedes 10, 41012 Sevilla, Spain
*
Author to whom correspondence should be addressed.
Water 2020, 12(5), 1298; https://doi.org/10.3390/w12051298
Submission received: 5 March 2020 / Revised: 29 April 2020 / Accepted: 1 May 2020 / Published: 4 May 2020
(This article belongs to the Special Issue Crop Monitoring Strategies for Precise Irrigation Management)

Abstract

:
This work examines the use of thermal imaging to determine the crop water status in young almond trees under sustained deficit irrigation strategies (SDIs). The research was carried out during two seasons (2018–2019) in three cultivars (Prunus dulcis Mill., cvs. Guara, Lauranne, and Marta) subjected to three irrigation treatments: a full irrigation treatment (FI) at 100% of irrigation requirements (IR), and two SDIs that received 75% and 65% of the IR, respectively. Crop water monitoring was done by measurements of canopy temperature, leaf water potential (Ψleaf), and stomatal conductance. Thermal readings were used to define the non-water-stress baselines (NWSB) and water-stress baselines (WSB) for each treatment and cultivar. According to our findings, Ψleaf was the most responsive parameter to reflect differences in almond water status. In addition, NWSB and WSB allowed the determination of the crop water-stress index (CWSI) and the increment of canopy temperature (ITC) for each SDI treatment, obtaining threshold values of CWSI (0.12–0.15) and ITC (~1 °C) that would ensure maximum water savings by minimizing the effects on yield. The findings highlight the importance of determining the different NWSB and WSB for different almond cultivars and its potential use for proper irrigation scheduling.

1. Introduction

Irrigation performs an essential role in agriculture. As such, the increase in total irrigated area, coupled with scarce water resources, has encouraged the implementation of irrigation strategies that optimize the water-use efficiency. Specifically, in areas such as southern Spain, this supply is crucial for the proper development of woody crops, when the maximum evapotranspiration rates coincide with the rainfall absence. Considering the current scenarios of climatic change and water scarcity, the adaptation and sustainable strategies to boost the proper water management in irrigated crops is vital [1]. Among them, deficit irrigation (DI) has been implemented to enhance the yield, reducing the irrigation supplies and maximizing the crop productivity [2]. According to this, the implementation of DI in many arid and semi-arid irrigated areas has been addressed, especially in representative Mediterranean woody species, namely olive [3], mango [4], walnut [5], citrus [6], or pistachio [7], among others.
Almond (Prunus dulcis Mill.) is considered as drought-tolerant crop, and for the case of Spain it has been traditionally cultivated in rainfed and marginal areas; although, recently, its presence in irrigated areas has progressively increased [8]. Because of the representativeness of this crop in arid and semi-arid regions, many authors have already studied its yield response to DI strategies, obtaining significant improvements in terms of water savings without substantial losses in almond yield [9,10,11]. In addition, different experiments have corroborated that the optimum period to apply moderate-to-severe water restrictions coincides with stage IV (kernel-filling period) [12,13], and hence, most of them have been developed introducing different water withholdings during this period.
Moreover, the success of applying a proper irrigation schedule based on DI strategies requires crop water monitoring by means of plant-based measurements, defining thresholds to maintain water restrictions during phenological development without compromising the final production [14]. Traditionally, this assessment has been done by punctual measurements of stem or leaf water potential (Ψleaf) or stomatal conductance (gs), with high representation of the crop water status but a low convenience and practical usage [15], hampering the taking of decisions for irrigation scheduling [16]. Alternatively, canopy temperature (TC) and the related thermal indexes have been recognized as proper indicators of crop water status [17,18], because of their relationship with crop transpiration rates [19]; hence, techniques that are less time-consuming, such as thermography, have been widely accepted [20,21,22,23]. Thus, when water restrictions are applied, the plant responds by closing the stomata (reducing gs and transpiration), minimizing the water losses by the leaf and, therefore, increasing the leaf temperature.
Additionally, thermal imaging provides information of the whole canopy, and hence this technique offers the possibility of developing fast spatio-temporal measurements and water status monitoring on a whole-plant basis [24]. However, in accordance with Jones [25] and Jones and Vaughan [26], there are many climatic variables, such as radiation, atmospheric temperature, vapor pressure deficit (VPD), relative humidity, wind, or air convection, that may influence the leaf temperature; thus, not only the water status effects. Therefore, to avoid the effects of these environmental variables, thermal indexes to monitor crop water stress have been defined to normalize the absolute canopy temperature (Tc) readings, such as the crop water-stress index (CWSI), the thermal index to relative stomatal conductance (IG), or the difference between the canopy and air temperature (ΔTcanopy-air) [25,27]. In the case of CWSI or IG, reference values for well-watered and non-transpiring TC are required, which provide theorical lower and upper TC values for the current environmental conditions. This fact substantially hampers the applicability of these indexes, which normally are obtained by means of artificial measurements of reference materials or leaves that have been previously exposed to modified conditions, which is rather complex and time-consuming [22,23]. To prevent these constraints, the difference between the air and canopy temperature (ΔTcanopy-air) is widely used as a simpler thermal index, offering interesting results for crop-water monitoring and irrigation scheduling [28]. Even so, ΔTcanopy-air can substantially change because of other environmental conditions. In order to solve this situation, non-water-stress baselines (NWSB) and water-stress baselines (WSB) are defined. These linear functions relates the values of ΔTcanopy-air with the VPD registered during the TC readings [22] for fully irrigated and DI strategies, respectively. Moreover, these WSBs can be defined for different levels of water restrictions, establishing a correspondence between a hypothetical WSB and the potential yield losses induced by the water stress imposed.
In addition, when these baselines are obtained under fully irrigated conditions, these can be used to determine the lower and upper limits for the CWSI estimation, as was suggested by Idso et al. [29], enabling the irrigation scheduling and taking decisions.
Furthermore, the NWSB permits to compute the increment of TC (ITC), which is the difference between the ΔTcanopy-air obtained for a hypothetical irrigation strategy and its corresponding NWSB value, using the VPD of that particular day [14]. In this line, one step further towards to DI programming would be to obtain the most appropriate WSB, which would correspond to that obtained for the treatment, and ensure the maximum water saving and minimum yield loss. Moreover, this WSB would allow defining the threshold ITC, providing the advisable value for the maximum deviation from the NWSB.
Taking these points into consideration, the objectives of this study were (i) to determine the NWSB for three studied almond cultivars during the kernel-filling period; (ii) to define the WSB for two different water-stress levels; and (iii) to establish a protocol to manage the irrigation scheduling by means of these functions and its relation with the yield.

2. Materials and Methods

2.1. Experimental Site

The experiment was conducted during the kernel-filling and postharvest period (June to September) in two consecutive years (2018 and 2019), in a commercial almond (P. dulcis Mill. cvs. Guara, Marta, and Lauranne) orchard, grafted onto GN15 rootstock, and located in the Guadalquivir river basin (SW Spain, 37°30′27.4” N, 5°55′48.7” W). Trees were planted in 2013, spaced 8 m × 6 m, and drip irrigated using two pipelines with emitters of 2.3 L × h−1, spaced at 0.75 m intervals. Canopy volumes were very similar within each cultivar, without differences between irrigation treatments. Thus, for Marta, canopy volumes ranged between 64 and 65 m3; Guara trees, between 65 and 66 m3; and Lauranne, trees between 72 and 74 m3.
The soil was a silty loam, a typical Fluvisol, more than 2 m deep, with organic matter <1.5%. Roots were located predominately in the first 50 cm of the soil, corresponding to the intended wetting depth. Soil water content values at field capacity (−0.33 MPa) and permanent wilting point (−1.5 MPa) were close to 0.40 and 0.15 m3 × m−3, respectively.
The climatic classification of the study area was attenuated meso-Mediterranean with a hot-summer Mediterranean climate (csa) in the Köppen climate classification [30], with an annual ET0 rate of 1400 mm, an average temperature of 18 °C, and accumulated rainfall of 540 mm (average data corresponding to the last 15 years (2004–2019); obtained from the Andalusian Weather information Network).

2.2. Irrigation Treatments

Three irrigation treatments were designed as follows: (i) a fully irrigated treatment (FI), which received 100% of the irrigation requirements (IR) during the whole irrigation period; (ii) a sustained deficit irrigation (SDI75) treatment, which received 75% of the IR; and (iii) a sustained deficit irrigation (SDI65), which received 65% of the IR.
In both seasons, irrigation was applied from the middle of March to the end of October, and these doses were calculated according to the methodology proposed by Allen et al. [31] (Equations (1) and (2)); obtaining the values of reference evapotranspiration (ET0) by using a weather station installed in the same experimental orchard (Davis Advance Pro2, Davis Instruments, Valencia, Spain).
ET C =   K C × K r × ET 0
IR   ( mm ) = ( ET C Rainfall )
where ETC is the crop evapotranspiration; KC is the single-crop coefficient; Kr is the crop reduction coefficient, which depends on the percentage of shaded area cast by the tree canopy; ET0 is the reference evapotranspiration; and IR is the irrigation requirements.
The local monthly KC and Kr used during the experimental period are shown in Table 1, as was determined by García-Tejero [32]. Additionally, the IR was reduced for SDI75 and SDI65 by multiplying it by 0.75 and 0.65, respectively.

2.3. Plant Measurements

During the kernel-filling period (162–225 days of the year (DOY) in 2018; and 162–217 DOY in 2019), crop water monitoring was done throughout the measurements of the leaf water potential (Ψleaf), stomatal conductance, water vapor (gs), and canopy temperature (TC); all these readings were taken between 12:00 and 13:30 GTM, and with a periodicity of 7–10 days.
The gs was measured using a porometer SC-1 (Decagon Devices, INC, WA, USA) in two leaves per tree (monitoring 8 trees per irrigation treatment) fully developed, and completely exposed to the sun, with the aim of monitoring the maximum values of gs and detecting the most detectable differences among the irrigation treatments. The selected leaves were at 1.5 m of height, approximately, and were SE facing. On the other hand, the Ψleaf was measured using a pressure chamber (Soil Moisture Equipment Corp., Sta. Barbara, CA, USA), monitoring two leaves per tree, located on the north side of the tree and being totally mature, fresh and shaded, with the aim of minimizing the measurements variability. Selected leaves were at 1.5 m of height, approximately, and NW facing.
Considering the results obtained by García-Tejero et al. [33], who reported that the best moment for assessing the TC was between 11:30 and 14:30, and in the sunny side of canopy, thermal images were taken following this procedure: using a ThermaCam (Flir SC660, Flir System, USA, 7–13 µm, 640 × 480 pixels) and an emissivity (٤) of 0.96 (Figure 1). Readings were developed at the sunny side of the canopy, placing the camera at a 4 m distance from the monitored tree, approximately. Afterwards, images were analyzed using the Flir Research Pro Software (Flir System, USA), which allows to select different zones of the images (in our case; 4 different sunny areas per image were selected); each pixel corresponding to an effective temperature value [19].
Once the images were obtained, TC was calculated for each treatment, cultivar, and monitoring day, and after this, the thermal index ΔTcanopy-air was calculated. Taking into consideration the ΔTcanopy-air values and the VPD registered during the data acquisition, the NWSB and WSB were defined according to Equation (3); these functions corresponding to trees that were subjected to different irrigation doses, and allow to estimate the optimum values of ΔTcanopy-air for each treatment depending on the VPD values [29].
Δ T canopy air = b + a × VPD
where b and a are the intercept point and slope of the linear function.
Additionally, taking as reference the NWSB obtained for each cultivar, the CWSI along the monitoring period for each DI treatment was estimated, according to Equations (4) and (5):
CWSI = Δ T canopy air Δ T wet Δ T dry Δ T wet
where ΔTcanopy-air corresponds to the canopy readings obtained in each treatment and cultivar; ΔTwet is the lower limit calculated from the NWSB equation in each cultivar; and ΔTdry is the upper limit obtained according to the methodology proposed by Idso et al. (1981).
Δ T dry = b + a [ e s ( T air ) e s ( T air + b ) ]
where a and b are the slope and the interception point for the NWSB; es (Tair) is the saturated vapor pressure at air temperature; and es (Tair + b) is the saturated vapor pressure at the sum of the air temperature and interception point.

2.4. Experimental Design and Statistical Analysis

The experimental design was of randomized blocks, with four replications per irrigation treatment and cultivar. Each replication had 12 trees (3 rows and 4 trees per row); the two central trees for each replication were monitored. Thus, eight trees per irrigation strategy treatment were used. Statistical analysis was done by using the Sigma Plot statistical software (version 12.5, Systat Software, Inc., San Jose, CA, USA). For each measurement day, an exploratory and descriptive analysis of the data (TC, Ψleaf, and gs) was developed, applying a Levene’s test to check the variance homogeneity of the variables studied. Significant differences among irrigation treatments (p ≤ 0.05) were identified by applying a one-way ANOVA, and a Tukey’s test to identify the significant differences. Additionally, there were defined the NWSB and WSB for each irrigation treatment and cultivar, analysing the differences by applying an ANCOVA to evaluate the differences in the interception points and slopes, and obtaining the threshold values of the CWSI and ITC for each cultivar that ensure minimum yield loss and the highest water saving. For this, at the end of each season, the effects on kernel yield in relation to irrigation treatments were analyzed by applying a one-way ANOVA, and a Tukey’s test to identify the significant differences.

3. Results

3.1. Climate Condition and Irrigation Water Amount Applied

Table 2 shows the climatic conditions during the two studied seasons. During the irrigation period (from April to October), the cumulative rainfall was 326 and 85 mm for 2018 and 2019, respectively. In relation to ETC, similar values for 2018 and 2019 (~880 and 840 mm respectively) were registered. This fact, together with the high differences in terms of rainfall, promoted that the irrigation doses applied in the studied treatments were much greater in the second experimental season. In this sense, FI, SDI75, and SDI65 received 4974, 3713, and 3342 m3·ha−1, respectively, in 2018; and 7700, 5744 and 5159 m3·ha−1, respectively, in 2019.

3.2. Physiological Response to Irrigation Treatments

Table 3 displays the physiological response found for Ψleaf, gs, and TC during 2018. The main significant differences among the irrigation treatments were detected for Ψleaf. In this sense, cv. Marta showed differences at 190, 197, 211, 218, and 225 DOY. For the case of cv. Guara, these differences were detected at 166 and 225 DOY. Finally, regarding cv. Lauranne, significant differences were observed at 190, 197, and 211 DOY. For the remaining variables, only punctual days showed significant differences.
A similar pattern was observed during the second experimental season as shown in Table 4, the Ψleaf being the physiological parameter that displayed the most perceptible effects in response to the different irrigation treatments.
In this regard, for the case of cv. Marta, these differences during the monitoring period were at 175, 183, 189, 196, 203, 210, and 217 DOY. In the same vein, cv. Guara registered significant differences for Ψleaf at 162, 175, 183, 189, 196, 203, 210, and 217 DOY. Finally, as was determined for the previous cultivars, cv. Lauranne recorded significant differences throughout the irrigation period for Ψleaf at 175, 183, 189, 196, 203, and 217 DOY.

3.3. Water-Stress Baselines for Each Cultivar and Irrigation Treatment, and Their Interactions

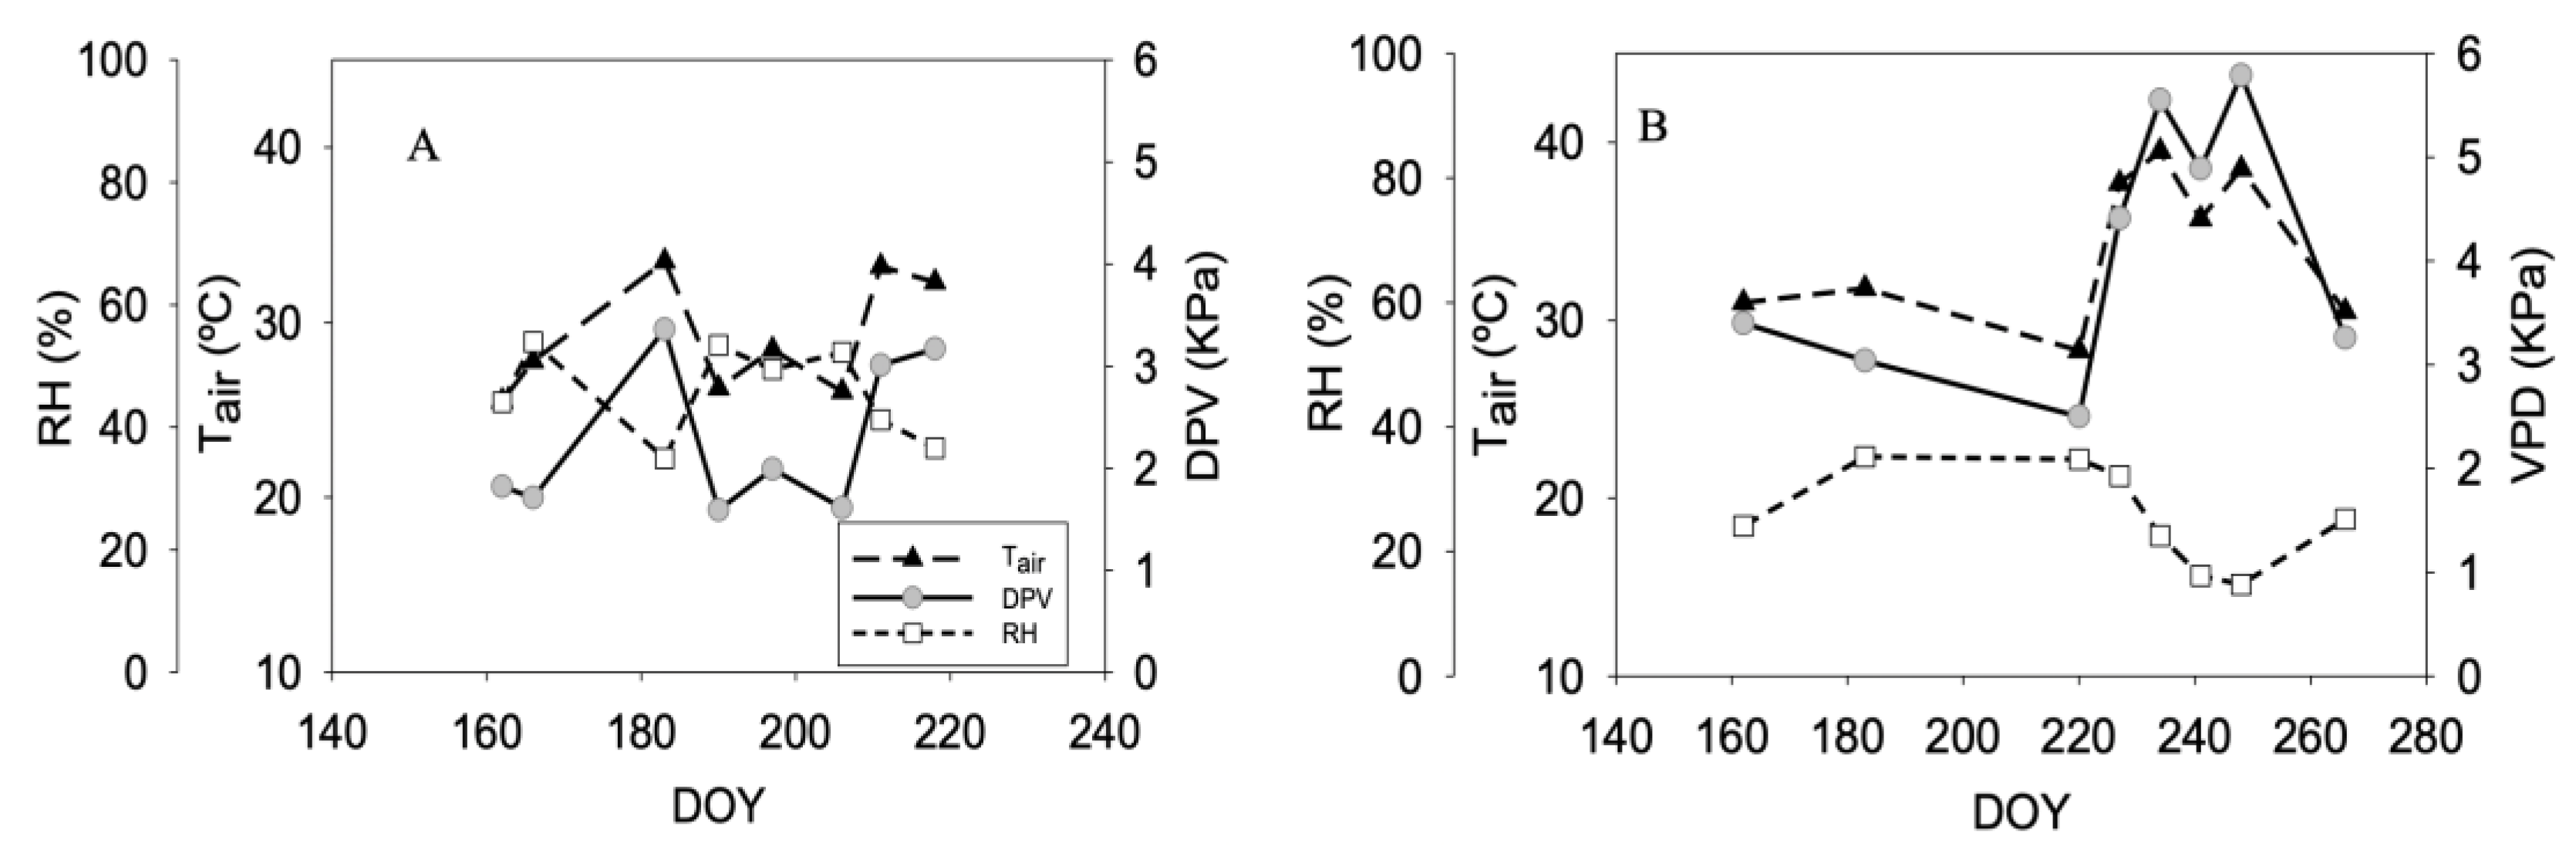
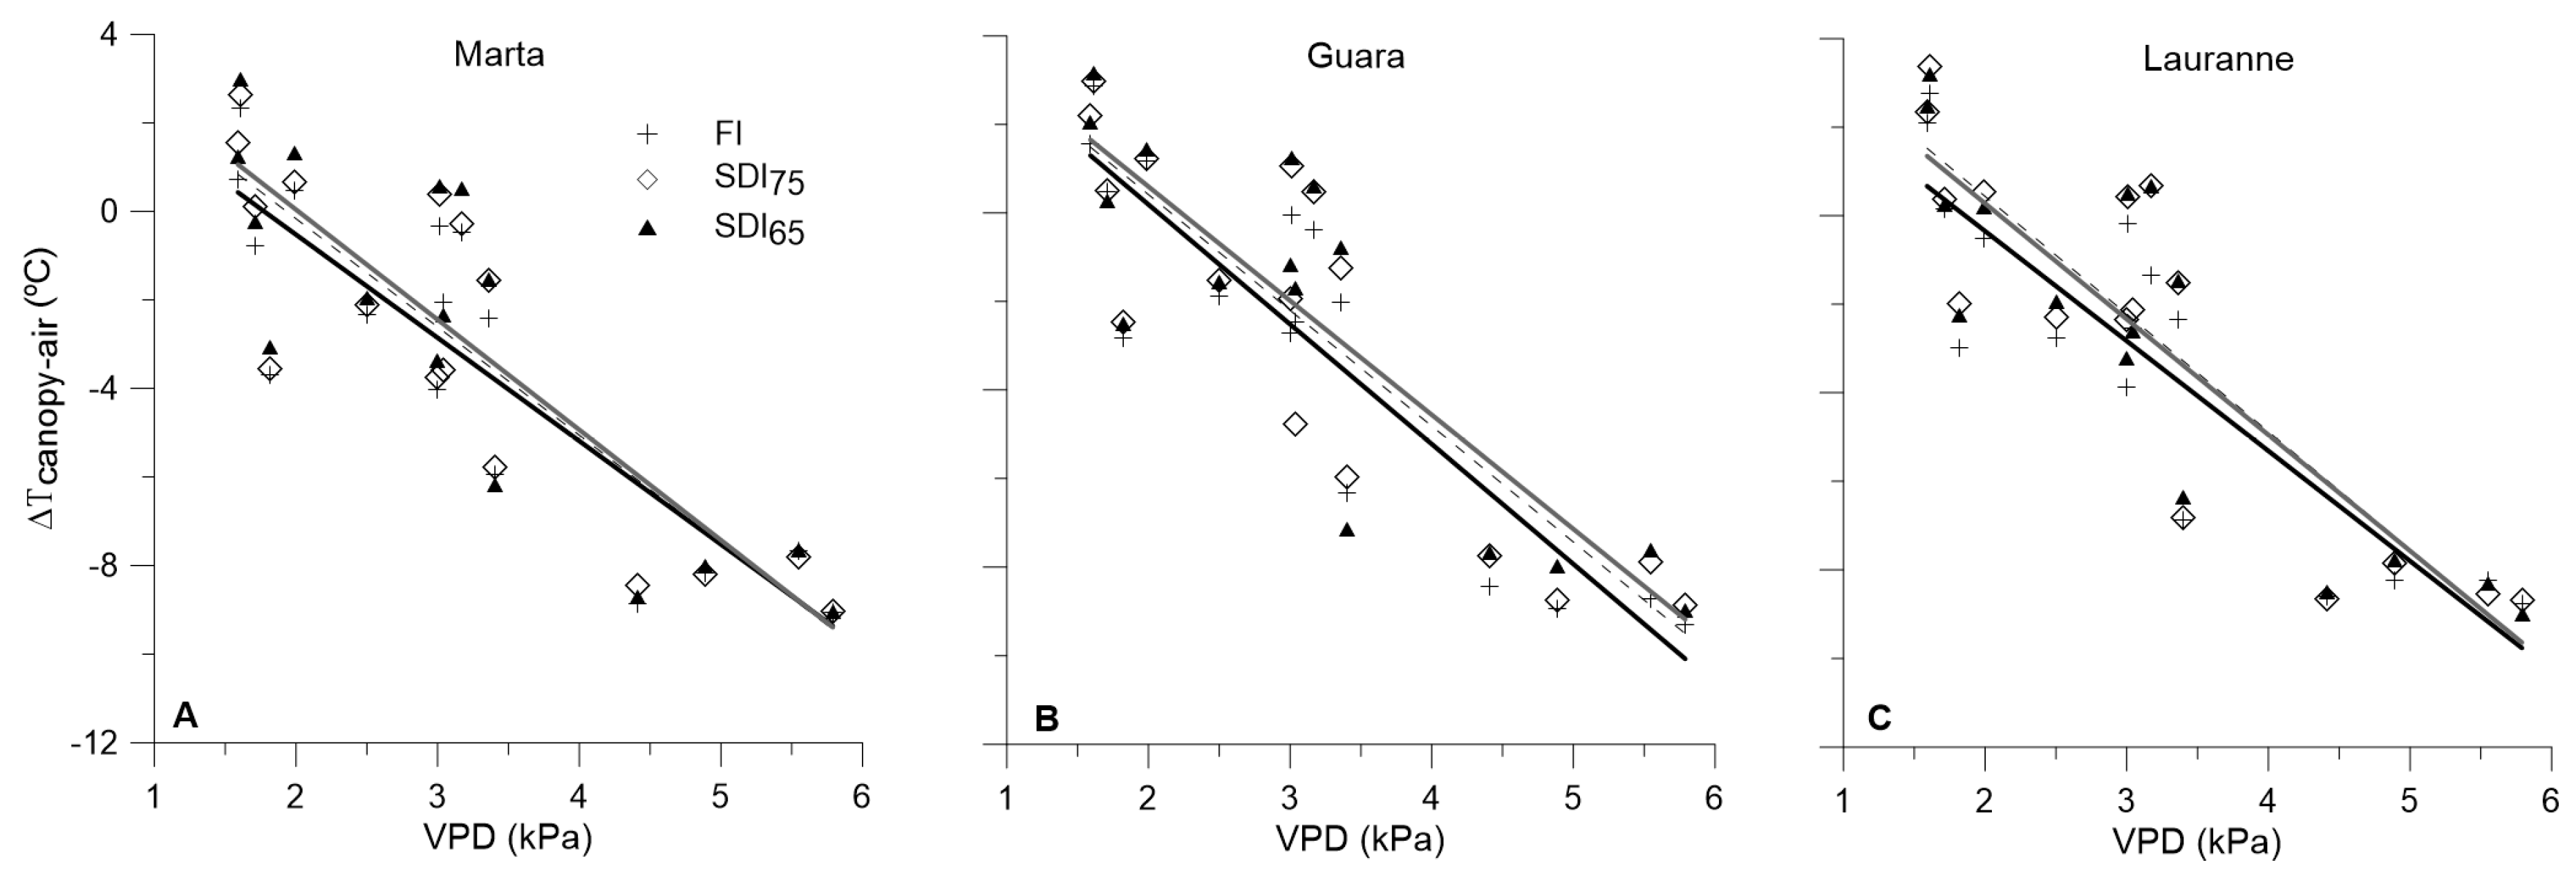
Taking as reference the Tair values registered during the data acquisition (Figure 2), the ΔTcanopy-air was calculated, and afterwards, the relationships with measured VPD were defined for each treatment and cultivar, considering the whole dataset obtained in both experimental seasons (Figure 3, Table 5).
As shown in Table 5, within each cultivar, the ANCOVA did not manifest differences in terms of the slope and the interception point for any of the studied cultivars. This absence of differences is in accordance with the previous results noted in relation to TC and gs, parameters without differences during the monitoring period. Moreover, this difference could be associated with the inherent variability of the experiment, especially, in TC readings. In this agreement, within each treatment it was observed Tc variations of ±0.5, ±0.9, and ±1.5 °C in the FI, SDI75, and SDI65, respectively. This variability was also higher the more remarkable the imposed water stress was. Moreover, a higher variability was found in cv. Guara while cvs. Marta and Lauranne showed lower and similar variability trends.
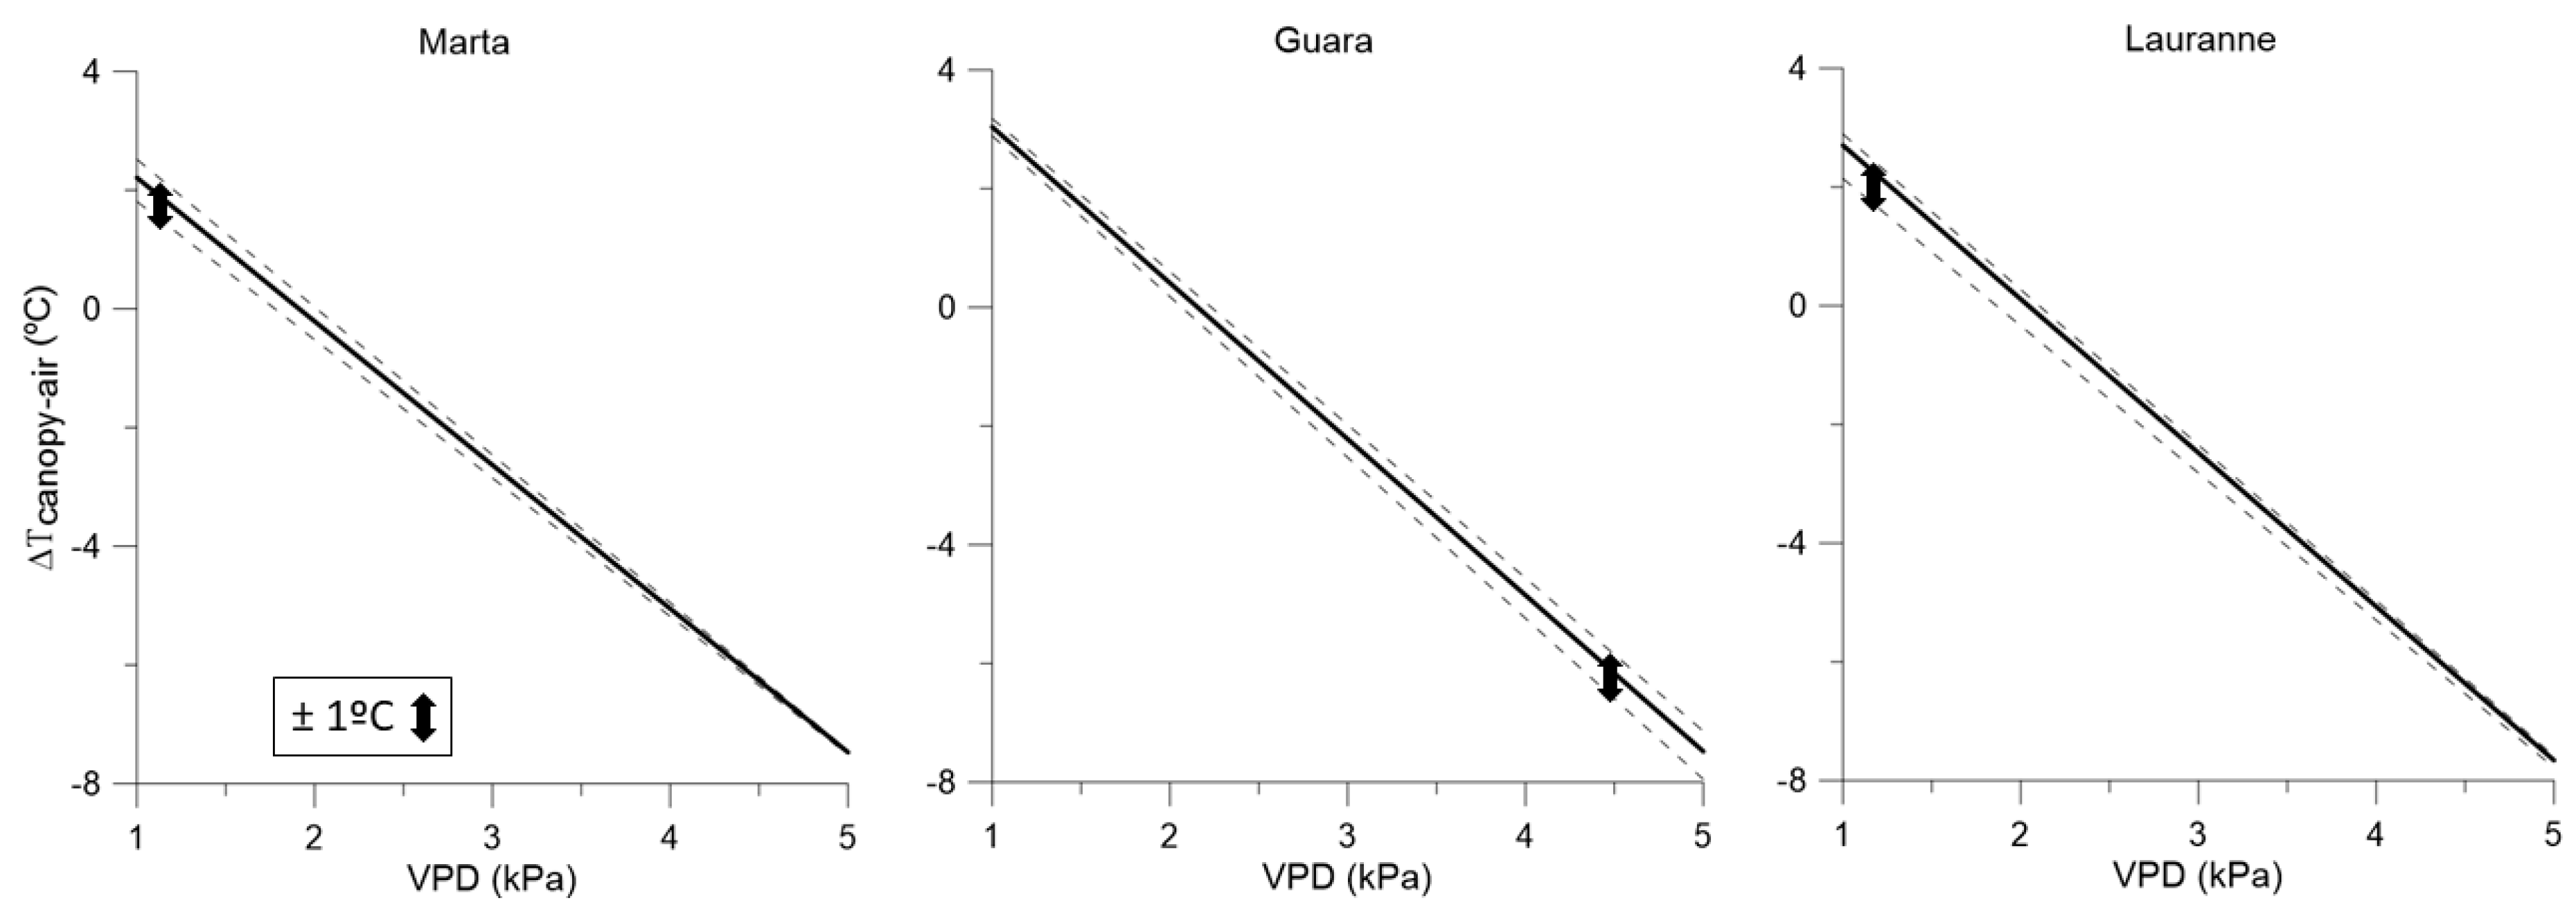
Considering this absence of differences between the irrigation treatments, there was defined a single WSB for each cultivar with the whole dataset (Table 6). These reference water-stress baselines (rWSB) would allow knowing an optimum ΔTcanopy-air, establishing the lower and upper limits from the NWSB and WSB previously defined for the FI and SDI treatments (Figure 4).
According to our findings, the maximum ITC reported for each cultivar was ~1.0 °C (Figure 4); that is, the highest differences between the FI and SDI65 strategies would report increases beyond the lower limit around a degree in the sunny side of the almond canopy. Moreover, this deviation would be different depending on the cultivar. For the case of cvs. Marta and Lauranne, the maximum ITC were detected in the lower ranges of the VPD that contrasts with cv. Guara.
Finally, taking into consideration the NWSB and WSB for each treatment and cultivar, and with the aim of establishing a useful threshold limit that ensures the maximum water savings, the CWSI on a monthly basis was estimated (Figure 5). It is noticeable the progressive increase along the kernel-filling period, especially in cvs. Marta and Lauranne, displaying a progressive rise because of the water-stress accumulation. Moreover, in cv. Guara and cv. Marta, the SDI65 reported a CWSI higher than those obtained in cv. Lauranne, where in the latter the SDI75 registered similar values of the CWSI. For cv. Guara, the maximum CWSI was reached under SDI65, with values close to 0.14. Similar results were found for cv. Lauranne (~0.15), whereas in cv. Marta these values were somewhat lower, roughly 0.12.

3.4. Linking the Yield with Water-Stress Baselines Defined for Each Cultivar and Irrigation Treatment

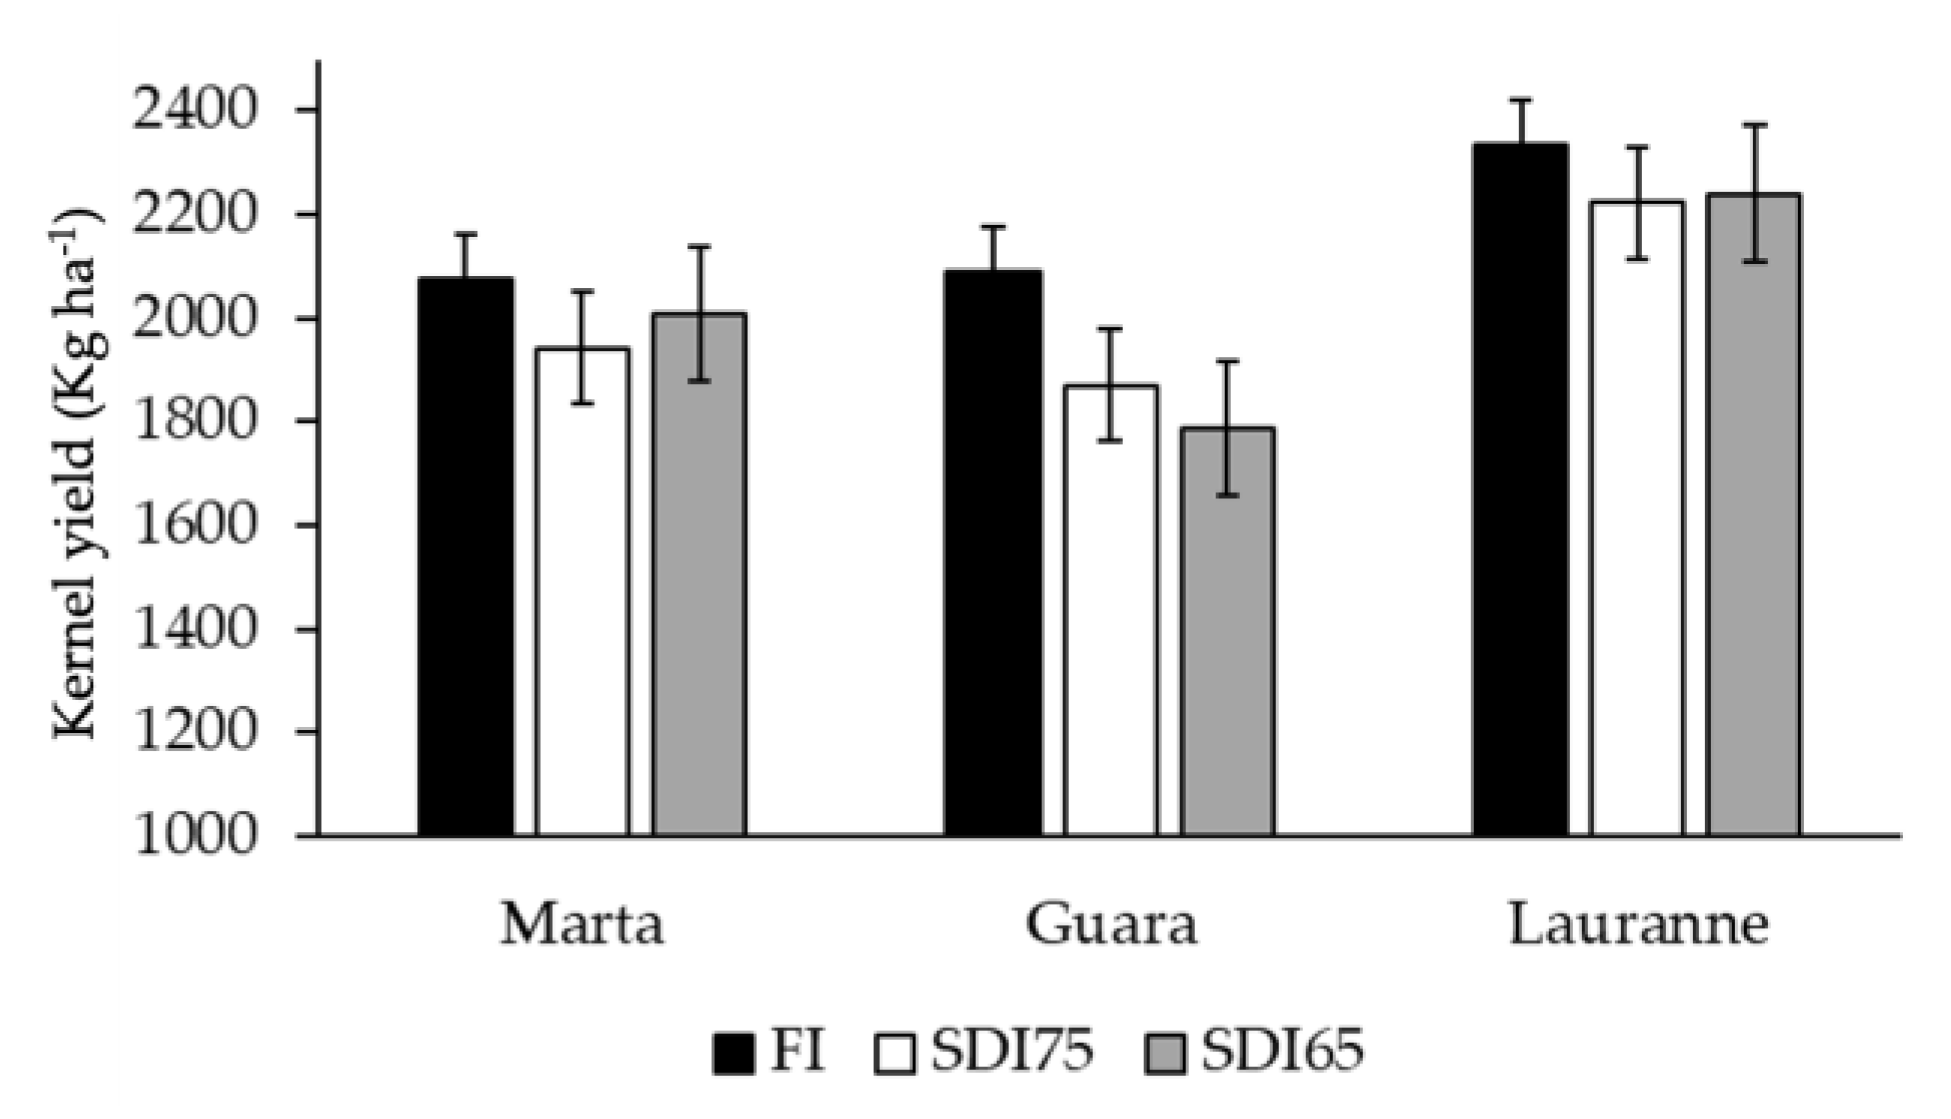
After estimating the different WSBs, the final yield was analyzed for each irrigation treatment and cultivar (Figure 6). This fact is necessary to define the threshold values of ΔTcanopy-air and CWSI to minimize the yield losses and maximize the water savings (in case of obtaining significant differences between irrigation treatments). On average, for cvs. Marta and Lauranne, no differences were observed, evidencing that water withholding close to 35% of the irrigation requirements would not promote yield losses, at least during two consecutive seasons. Something different was determined for cv. Guara. In this case, in spite of not finding significant differences, there was a trend between the yield loss and water stress imposed; that is, the obtained values for SDI75 and SDI65 were notably lower than those observed under FI, with yield reductions of 11% and 15%; respectively.

4. Discussion

The focus of this paper was to assess the use of thermal data as indicator of crop water status instead of discontinuous measurements, such as Ψleaf or gs, which are highly time-consuming with a huge number of measurements that are needed for taking decisions.
Considering the results showed in this work, the Ψleaf was the parameter that showed the highest differences between treatments in the two-year experiment, relative to gs and TC (Table 3 and Table 4). It is remarkable that the decreasing pattern in Ψleaf was not followed by gs, likely because of the lower capacity of almond trees to regulate their stomata under mild water-stress situations [3,34]. These findings were in agreement with other works [35,36], showing that under mild stress, almond decreases Ψleaf significantly more than gs, which remains fairly constant until severe water stress. As gs tightly controls plant transpiration, this, in turn, determines to a great extent the leaf temperature. The lack of significant differences in gs among the irrigation treatments and for none of the cultivars support why there were also no differences between TC and WSBL. In addition, plant transpiration, in which gs determines photosynthesis, in conjunction with turgor, is liable for growth and yield. Accordingly, fruit yield did not show relevant differences among the irrigation treatments for cvs. Marta and Lauranne, although these were more evident for cv. Guara. In accordance with our data and to previous works, it seems that to detect a higher response of gs to water stress it would be necessary to impose more severe water-stress conditions; then the stomatal response would be mainly governed by the crop water status [10,22].
The use of thermal data as indicator of crop water status has been implemented in different works to solve the drawback that Ψleaf or gs carried out with their development [27,36]. In order to define the most proper strategy, many authors have discussed the best time to capture the images, the tree area or the time range to take the images. In this sense, González-Dugo et al. [37] concluded that, for the case of citrus trees, the best moment to capture the thermal images would be between 11:20 and 12:00. They also observed that the maximum differences between the control and stressed trees ranged between 1.5 and 2.5 °C. Their results agree with those obtained in this experiment, in which the maximum difference between the FI and SDI treatments is ±1 °C (Figure 4). In the same line, García-Tejero et al. [33] in an experiment with almond (cv. Guara) concluded that the best moment to capture thermal images was between 11:30 and 14:00 in the sunny exposed side of the tree, when the maximum differences of TC between the FI and DI treatments were reached. Therefore, these differences were always from 0.5 to 1.5 °C when a water restriction close to 50% of the irrigation requirements was imposed, similar to findings that was obtained in the present work.
Despite Tc not always having a direct relationship with Ψleaf or gs, due to the large environmental variability, the use of different thermal indexes that normalize this parameter to the meteorological conditions make this tool suitable to determine the crop water status [24]. In this study the use of the index ΔTcanopy-air allowed to establish the NWSB and WSB for three almond cultivars, adjusting these values with those of the VPD registered. In this context, Bellvert et al. [38] outlined that different WSB can be obtained, and their main differences could be associated with their intercept point; these differences being associated to variation in the crop water status [19,20] or the crop phenological stage. Similarly, García-Tejero et al. [28], for mature almond trees, reported differences in the interception point between different WSBs within a cultivar subjected to different irrigation doses. These results agree with that found in this work (Figure 3, Table 5). In this line, although the ANCOVA did not evidence significant differences in the slope and interception point among the irrigation doses imposed in each cultivar, we observed maximum differences between the NWSB and WSB close to 1.0 °C, comparable to findings by García-Tejero et al. [28] or García-Tejero et al. [33]. The main differences among these results and those reported by the authors would be mainly in the slope of the functions calculated for the studied cultivars. Thus, González-Dugo et al. [37] or García-Tejero et al. [28] reported similar slopes for mature almond trees, cv. Guara, which were growing under similar climatic conditions. In our case, the obtained slopes were substantially different; this being an important fact to be considered in future works. Thus, this fact could be due to the tree age and this work being defined in young trees, whereas the previous works were developed in mature almond trees, in which the transpiration capacity could have substantially changed.
Authors such as Romero-Trigueros et al. [39] largely discussed the advantages of this type of functions when these are applied in isohydric crops, with a higher capacity of stomatal regulation when they are subjected to water withholding. This is not the case for almond, with a downregulation of stomatal conductance, resulting in similar TC values for trees subjected to different irrigation doses. Considering that no differences were found among the irrigation treatments, the rWSB defined for each cultivar would be a suitable option for irrigation scheduling under moderate scenarios of water scarcity, knowing that there were no differences in productive terms with water around 2000 m3 × ha−1 (Figure 6).
Finally, in spite of to the absence of significant differences in yield for the three studied cultivars, cv. Guara was affected with a progressive depletion in relation to the water stress imposed. Confronting these results with the maximum ITC registered, cv. Guara was the unique in which ITC increased for major values of VPD, and it could demonstrate a higher sensitivity to the SDI strategy than the remaining cultivars, especially when atmospheric demand is higher. Likewise, the absence of differences in terms of yield has been widely stated by several authors [10,40,41,42] and, therefore, this reaction ratifies the advantages of this agronomic practices for almond cultivation in arid and semi-arid environments.

5. Conclusions

From the research that has been performed in this paper, it is possible to conclude that the ΔTcanopy-air and its related thermal indexes (CWSI and ITC) are precise indicators of the crop water status in young almond trees. In detail, the use of ΔTcanopy-air to establish the NWSB and WSBs for different cultivars and water-stress levels would offer an optimum tool for irrigation management differentiated by cultivar and water restrictions. On the other hand, considering the three cultivars studied, cv. Guara offered a higher sensitivity to water stress, as in yield reductions in terms of its physiological response. Following the proposed methodology of this study, using thermal data, it would be possible to materialize other WSB for different cultivars and tree ages for alternative irrigation programming, especially when DI is used. However, taking into consideration that there were no differences found in yield between the water-stressed and non-stressed treatments, future essays imposing more severe water stress should be considered, in order to ensure obtaining the maximum threshold value (in terms of the CWSI or ITc) that would not significantly impact yield, explicitly under long-term irrigation periods.

Author Contributions

Writing: S.G.-G.; I.F.G.-T. and V.H.D.Z; conception or design: S.G.-G. and I.F.G.-T.; acquisition, analysis, and interpretation of data: S.G.-G., I.F.G.-T., A.G.E., J.J.A.-A. and F.F.G.; critical revision of the manuscript for important intellectual content: S.G.-G, I.F.G.-T., B.C.R., V.H.D.Z. and V.H.-S.; statistical analysis: S.G.-G. and I.F.G.-T.; reagents/materials/analysis tools contribution: S.G.-G., I.F.G.-T., A.G.E. and F.F.G. All authors have read and agreed to the published version of the manuscript.

Funding

Part of this work was sponsored by the research project “Impact of climate change and adaptation measures (INNOVA-Climate)” (AVA.AVA2019.051), Research and Technological Innovation Projects for period 2019–2021 Andalusia moves with Europe.

Acknowledgments

The author S. Gutiérrez-Gordillo has a contract co-financed by National Institute of Agrarian and Food Research and technology (FPI-INIA 2016) and European Social Fund (ESF) “The European Social Fund invests in your future.” The authors particularly thank Paco Campos and Juan Luis Viveros from Nutalia SL Comp. for their capable research assistance.

Conflicts of Interest

The authors declare no conflict of interest.

References

  1. Iglesias, A.; Mougou, R.; Moneo, M.; Quiroga, S. Towards adaptation of agriculture to climate change in the Mediterranean. Reg. Environ. Chang. 2011, 11, 159–166. [Google Scholar] [CrossRef]
  2. Fereres, E.; Soriano, M.A. Deficit irrigation for reducing agricultural water use. J. Exp. Bot. 2007, 58, 147–159. [Google Scholar] [CrossRef] [PubMed] [Green Version]
  3. Fernández, J.E. Understanding olive adaptation to abiotic stresses as a tool to increase crop performance. Environ. Exp. Bot. 2014, 103, 158–179. [Google Scholar] [CrossRef] [Green Version]
  4. Durán Zuazo, V.H.; Rodríguez Pleguezuelo, C.R.; Franco Tarifa, D. Impact of sustained-deficit irrigation on tree growth, mineral nutrition, fruit yield and quality of mango in Spain. Fruits 2011, 66, 257–268. [Google Scholar] [CrossRef]
  5. Buchner, R.P.; Fulton, A.E.; Gilles, C.K.; Prichard, T.L.; Lampinen, B.D.; Shackel, K.A.; Metcalf, S.G.; Little, C.C.; Schwankl, L.J. Effects of regulated deficit irrigation on walnut grafted on “Northern California Black” or “Paradox” rootstock. Acta Hortic. 2008, 792, 141–146. [Google Scholar] [CrossRef]
  6. García-Tejero, I.; Romero-Vicente, R.; Jiménez-Bocanegra, J.A.; Martínez-García, G.; Durán Zuazo, V.H.; Muriel-Fernández, J.L. Response of citrus trees to deficit irrigation during different phenological periods in relation to yield, fruit quality, and water productivity. Agric. Water Manag. 2010, 97, 689–699. [Google Scholar] [CrossRef]
  7. Memmi, H.; Gijón, M.C.; Couceiro, J.F.; Pérez-López, D. Water stress thresholds for regulated deficit irrigation in pistachio trees: Rootstock influence and effects on yield quality. Agric. Water Manag. 2016, 164, 58–72. [Google Scholar] [CrossRef] [Green Version]
  8. Caracterización del sector de la almendra en Andalucía. Secretaría General de Agricultura y Alimentación. Junta de Andalucía. 2016, 34. Available online: https://www.juntadeandalucia.es/export/drupaljda/estudios_informes/16/12/Caracterizaci%C3%B3n%20del%20sector%20de%20la%20almendra_0.pdf (accessed on 5 April 2020).
  9. Egea, G.; González-Real, M.M.; Baille, A.; Nortes, P.A.; Sánchez-Bel, P.; Domingo, R. The effects of contrasted deficit irrigation strategies on the fruit growth and kernel quality of mature almond trees. Irrig. Sci. 2009, 36, 1–8. [Google Scholar] [CrossRef]
  10. Romero, P.; Botia, P.; Garcia, F. Effects of regulated deficit irrigation under subsurface drip irrigation conditions on vegetative development and yield of mature almond trees. Plant Soil 2004, 260, 169–181. [Google Scholar] [CrossRef]
  11. Espadafor, M.; Orgaz, F.; Testi, L.; Lorite, I.J.; González-Dugo, V.; Fereres, E. Responses of transpiration and transpiration efficiency of almond trees to moderate water deficits. Sci. Hortic. (Amsterdam) 2017, 225, 6–14. [Google Scholar] [CrossRef]
  12. Nortes, P.A.; Gonzalez-Real, M.M.; Egea, G.; Baille, A. Seasonal effects of deficit irrigation on leaf photosynthetic traits of fruiting and non-fruiting shoots in almond trees. Tree Physiol. 2009, 29, 375–388. [Google Scholar] [CrossRef] [PubMed] [Green Version]
  13. Girona, J.; Mata, M.; Marsal, J. Regulated deficit irrigation during the kernel-filling period and optimal irrigation rates in almond. Agric. Water Manag. 2005, 75, 152–167. [Google Scholar] [CrossRef]
  14. Rojo, F.; Kizer, E.; Upadhyaya, S.; Ozmen, S.; Ko-Madden, C.; Zhang, Q. A Leaf Monitoring System for Continuous Measurement of Plant Water Status to Assist in Precision Irrigation in Grape and Almond crops. IFAC-PapersOnLine 2016, 49, 209–215. [Google Scholar] [CrossRef]
  15. Dhillon, R.; Rojo, F.; Roach, J.; Upadhyaya, S.; Delwiche, M. A Continuous Leaf Monitoring System for Precision Irrigation Management in Orchard Crops. Tarım Makinaları Bilim. Derg. 2014, 10, 267–272. [Google Scholar]
  16. Fernández, J.E. Plant-based methods for irrigation scheduling of woody crops. Horticulturae 2017, 3, 35. [Google Scholar] [CrossRef] [Green Version]
  17. Jackson, R.D.; Idso, S.B.; Reginato, R.J.; Pinter, P.J. Canopy temperature as a crop water stress indicator. Water Resour. Res. 1981, 17, 1133–1138. [Google Scholar] [CrossRef]
  18. Idso, S.B. Non-water-stressed baselines: A key to measuring and interpreting plant water stress. Agric. Meteorol. 1982, 27, 59–70. [Google Scholar] [CrossRef]
  19. Jones, H.G. Irrigation scheduling: Advantages and pitfalls of plant-based methods. J. Exp. Bot. 2004, 55, 2427–2436. [Google Scholar] [CrossRef] [Green Version]
  20. Jiménez-Bello, M.A.; Ballester, C.; Castel, J.R.; Intrigliolo, D.S. Development and validation of an automatic thermal imaging process for assessing plant water status. Agric. Water Manag. 2011, 98, 1497–1504. [Google Scholar] [CrossRef] [Green Version]
  21. Egea, G.; Padilla-Díaz, C.M.; Martinez-Guanter, J.; Fernández, J.E.; Pérez-Ruiz, M. Assessing a crop water stress index derived from aerial thermal imaging and infrared thermometry in super-high density olive orchards. Agric. Water Manag. 2017, 187, 210–221. [Google Scholar] [CrossRef] [Green Version]
  22. García-Tejero, I.F.; Gutiérrez Gordillo, S.; Souza, L.; Cuadros-Tavira, S.; Durán Zuazo, V.H. Fostering sustainable water use in almond (Prunus dulcis Mill.) orchards in a semiarid Mediterranean environment. Arch. Agron. Soil Sci. 2019, 65, 164–181. [Google Scholar] [CrossRef]
  23. Pou, A.; Diago, M.P.; Medrano, H.; Baluja, J.; Tardaguila, J. Validation of thermal indices for water status identification in grapevine. Agric. Water Manag. 2014, 134, 60–72. [Google Scholar] [CrossRef]
  24. Poirier-Pocovi, M.; Volder, A.; Bailey, B.N. Modeling of reference temperatures for calculating crop water stress indices from infrared thermography. Agric. Water Manag. 2020, 233, 106070. [Google Scholar] [CrossRef]
  25. Jones, H.G.; Serraj, R.; Loveys, B.R.; Xiong, L.; Wheaton, A.; Price, A.H. Thermal infrared imaging of crop canopies for the remote diagnosis and quantification of plant responses to water stress in the field. Funct. Plant Biol. 2009, 36, 978–989. [Google Scholar] [CrossRef] [Green Version]
  26. Jones, H.G.; Vaughan, R. Remote Sensing of Vegetation: Principles, Techniques and Applications. Soil Use Manag. 2012, 28, 134. [Google Scholar] [CrossRef]
  27. García-Tejero, I.F.; Hernández, A.; Padilla-Díaz, C.M.; Diaz-Espejo, A.; Fernández, J.E. Assessing plant water status in a hedgerow olive orchard from thermography at plant level. Agric. Water Manag. 2017, 188, 50–60. [Google Scholar] [CrossRef] [Green Version]
  28. García-Tejero, I.F.; Gutiérrez-Gordillo, S.; Ortega-Arévalo, C.; Iglesias-Contreras, M.; Moreno, J.M.; Souza-Ferreira, L.; Durán Zuazo, V.H. Thermal imaging to monitor the crop-water status in almonds by using the non-water stress baselines. Sci. Hortic. 2018, 238, 91–97. [Google Scholar] [CrossRef]
  29. Idso, S.B.; Jackson, R.D.; Pinter, P.J.; Reginato, R.J.; Hatfield, J.L. Normalizing the stress-degree-day parameter for environmental variability. Agric. Meteorol. 1981, 24, 45–55. [Google Scholar] [CrossRef]
  30. Peel, M.C.; Finlayson, B.L.; McMahon, T.A. Updated world map of the Köppen-Geiger climate classification. Hydrol. Earth Syst. Sci. 2007, 11, 1633–1644. [Google Scholar] [CrossRef] [Green Version]
  31. Allen, R.G.; Pereira, L.S.; Raes, D.; Smith, M. Crop Evapotranspiration—Guidelines for Computing Crop Water Requirements-Irrigation and Drainage Paper 56; Food and Agriculture Organization (FAO): Rome, Italy, 1998; Available online: http://www.fao.org/docrep/x0490e/x0490e00.htm (accessed on 12 February 2020).
  32. García-Tejero, I.F.; Hernandez, A.; Rodriguez, V.M.; Ponce, J.R.; Ramos, V.; Muriel, J.L.; Durán Zuazo, V.H. Estimating Almond Crop Coefficients and Physiological Response to Water Stress in Semiarid Environments (SW Spain). J. Agric. Sci. Technol. 2015, 17, 1255–1266. [Google Scholar]
  33. García-Tejero, I.F.; Rubio, A.E.; Viñuela, I.; Hernández, A.; Gutiérrez-Gordillo, S.; Rodríguez-Pleguezuelo, C.R.; Durán Zuazo, V.H. Thermal imaging at plant level to assess the crop-water status in almond trees (cv. Guara) under deficit irrigation strategies. Agric. Water Manag. 2018, 208. [Google Scholar] [CrossRef]
  34. Fu, X.; Meinzer, F.C. Metrics and proxies for stringency of regulation of plant water status (iso/anisohydry): A global data set reveals coordination and trade-offs among water transport traits. Tree Physiol. 2018, 39, 122–134. [Google Scholar] [CrossRef] [PubMed]
  35. Hernandez-Santana, V.; Rodriguez-Dominguez, C.M.; Fernández, J.E.; Diaz-Espejo, A. Role of leaf hydraulic conductance in the regulation of stomatal conductance in almond and olive in response to water stress. Tree Physiol. 2016, 36, 725–735. [Google Scholar] [CrossRef] [PubMed] [Green Version]
  36. Rodriguez-Dominguez, C.M.; Buckley, T.N.; Egea, G.; de Cires, A.; Hernandez-Santana, V.; Martorell, S.; Diaz-Espejo, A. Most stomatal closure in woody species under moderate drought can be explained by stomatal responses to leaf turgor. Plant Cell Environ. 2016, 39, 2014–2026. [Google Scholar] [CrossRef]
  37. González-Dugo, V.; Zarco-Tejada, P.J.; Fereres, E. Applicability and limitations of using the crop water stress index as an indicator of water deficits in citrus orchards. Agric. For. Meteorol. 2014, 198–199, 94–104. [Google Scholar] [CrossRef]
  38. Bellvert, J.; Zarco-Tejada, P.J.; Girona, J.; Fereres, E. Mapping crop water stress index in a ‘Pinot-noir’ vineyard: Comparing ground measurements with thermal remote sensing imagery from an unmanned aerial vehicle. Precis. Agric. 2014, 15, 361–376. [Google Scholar] [CrossRef]
  39. Romero-Trigueros, C.; Bayona Gambín, J.M.; Nortes Tortosa, P.A.; Alarcón Cabañero, J.J.; Nicolás, E.N. Determination of Crop Water Stress index by infrared thermometry in grapefruit trees irrigated with saline reclaimed water combined with deficit irrigation. Remote Sens. 2019, 11, 757. [Google Scholar] [CrossRef] [Green Version]
  40. Egea, G.; Nortes, P.A.; Domingo, R.; Baille, A.; Pérez-Pastor, A.; González-Real, M.M. Almond agronomic response to long-term deficit irrigation applied since orchard establishment. Irrig. Sci. 2013, 31, 445–454. [Google Scholar] [CrossRef]
  41. López-López, M.; Espadador, M.; Testi, L.; Lorite, I.J.; Orgaz, F.; Fereres, E. Water use of irrigated almond trees when subjected to water deficits. Agric. Water Manag. 2018, 195, 84–93. [Google Scholar] [CrossRef]
  42. Monks, D.P.; Taylor, C.; Sommer, K.; Treeby, M.T. Deficit irrigation of almond trees did not decrease yield. Acta Hortic. 2017, 1150, 251–260. [Google Scholar] [CrossRef]
Figure 1. Thermal images at the sunny side of the studied almond canopies. FI, fully irrigated treatment; SDI75, sustained deficit irrigation treatment at 75% of the irrigation requirements; SDI65, sustained deficit irrigation treatment at 65% of the irrigation requirements; G, Guara; M, Marta; L, Lauranne.
Water 12 01298 g001
Figure 2. Meteorological conditions during the data collection in 2018 (A) and 2019 (B). Tair, air temperature; RH, relative humidity; VPD, vapor pressure deficit; DOY, day of the year.
Water 12 01298 g002
Figure 3. Water-stress baselines for cvs. Marta (A), Guara (B), and Lauranne (C). Black continuous, discontinuous and grey lines are the regressions functions that represent the non-water-stress baseline for fully irrigated (FI), and the water-stress baselines for sustained deficit irrigation at 75% of the crop irrigation requirements (SDI75) and sustained deficit irrigation at 65% of the crop irrigation requirements (SDI65), respectively.
Water 12 01298 g003
Figure 4. Reference water-stress baselines (rWSB, continuous lines) for cvs. Marta (A), Guara (B) and Lauranne (C). The upper and lower discontinuous lines correspond to the water stress and non-water stress baselines functions defined under sustained deficit irrigation at 65% of the irrigation requirements and fully irrigated conditions, respectively. Black arrows indicate the maximum increment of canopy temperature, with the aim of establishing the threshold limits for irrigation scheduling in the studied almond cultivars.
Water 12 01298 g004
Figure 5. The crop water-stress index (CWSI) on a monthly basis for the water-stressed treatments (SDI) and studied cultivars. SDI75, irrigated at 75% of the irrigation requirements; SDI65, irrigated at 65% of the irrigation requirements. Vertical bars are standard deviation.
Water 12 01298 g005
Figure 6. Average kernel yield for the studied almond cultivars during the study. FI, fully irrigated at 100% of irrigation requirements; SDI75, irrigated at 75% of the irrigation requirements; SDI65, irrigated at 65% of the irrigation requirements. Vertical bars are standard deviation.
Water 12 01298 g006
Table 1. Local crop reduction and crop coefficient values used in the experiment.
CoefficientsMarchAprilMayJuneJulyAugustSeptemberOctober
KC0.40.60.91.11.21.10.80.7
Kr0.40.70.80.90.90.80.80.7
Table 2. Monthly average values of the weather parameters for the irrigation period during the study.
ParametersAprilMayJuneJulyAugustSeptemberOctober
2018
Tmax22.025.630.533.737.733.626.3
Tmin9.512.115.215.918.718.313.1
Tav15.218.222.524.427.624.919.0
RHmax967.3936.593.696.187.989.795.3
RHmin44.137.333.327.520.730.741.0
RHav75.671.362.460.951.961.971.8
Rad17.321.924.927.023.519.613.9
R97.2103.05.40.00.621.498.4
ET096.6125.5150.8172.1168.8125.4198.1
ETc57.9113.0165.9206.5185.6100.349.9
2019
Tmax22.230.431.334.536.532.427.6
Tmin7.212.217.517.917.916.311.7
Tav19.821.522.725.826.923.818.9
RHmax97.885.283.284.077.281.990.7
RHmin39.823.323.425.318.727.632.9
RHav72.252.351.455.445.954.463.2
Rad1.92.12.12.90.80.90.7
R71.20.00.00.00.03.410.4
ET0111.0198.0202.9238.7170.1121.076.4
ETc61.6126.2151.3209.8140.192.854.8
R, rainfall (mm); Tmax, maximum air temperature (°C); Tmin, minimum air temperature (°C); Tav, average air temperature (°C); RHmax, maximum relative humidity (%); RHmin, minimum relative humidity (%); RHav, average relative humidity (%); Rad, solar radiation (W·m−2); R, rainfall (mm); ET0, reference evapotranspiration (mm); ETc, crop evapotranspiration (mm).
Table 3. Temporal evolution of the physiological variables measured throughout 2018.
DOYTreatMartaGuaraLauranne
Ψleaf (MPa)gs (mmol m−2 s−1)Tc (°C)Ψleaf (MPa)gs (mmol m−2 s−1)Tc (°C)Ψleaf (MPa)gs (mmol m−2 s−1)Tc (°C)
162FI−0.92a154.50a21.80a−0.92a143.48a22.68a−0.97a129.08a22.50a
SDI75−0.82a153.17a21.94a−0.95a117.80a23.04a−0.98a125.30a23.51a
SDI65−0.88a127.90b22.39a−1.04a174.48a22.95a−0.93a130.25a23.21a
166FI−1.06a144.27a27.02a−0.93a180.65a28.29a−1.05a187.85a27.94a
SDI75−1.13a160.50a27.90a−1.21b175.07a28.30a−1.08a179.68a28.18a
SDI65−1.11a173.93a27.53a−1.22b191.10a28.03a−1.05a180.88a28.00a
190FI−1.35a76.28a31.09a−1.58a99.21a31.49a−1.54a112.00a31.14a
SDI75−1.44b84.09a31.94a−1.50a99.83a32.26a−1.70b102.88a31.97a
SDI65−1.40ab79.24a31.91a−1.67a109.66a32.67a−1.72b110.64a31.99a
197FI−1.16a77.14a26.96a−1.44a79.79a27.81a−1.40a93.25a28.34a
SDI75−1.27b72.86a27.80a−1.45a84.64a28.45a−1.50b89.73a28.58a
SDI65−1.31b78.03a27.44a−1.42a84.13a28.25a−1.55b89.35a28.68a
206FI−1.01a84.41a28.93a−1.38a107.59a29.63a−1.38a126.57a27.92b
SDI75−1.09a90.90a29.12a−1.36a107.90a29.68a−1.21a128.36a29.00a
SDI65−1.06a89.11a29.73a−1.40a107.34a29.85a−1.38a129.50a29.12a
211FI−1.15a110.80a28.39a−1.49a120.86a28.91a−1.36a126.43a28.80a
SDI75−1.31b99.64a28.69a−1.57a110.65b29.04a−1.42b133.20a29.43a
SDI65−1.38b96.58a28.99a−1.53a98.80b29.16a−1.44b129.07a29.21a
218FI−1.87a138.02a32.85a−2.17a154.36a33.15b−1.84a189.04a33.01a
SDI75−1.82a134.86a33.58a−2.12a166.15a34.28a−2.05a181.77a33.62a
SDI65−1.68a140.90a33.7a−2.18a150.73a34.40a−1.71a172.70a33.66a
225FI−1.74a129.10a31.83a−1.76a138.99a31.93a−1.88a166.89a30.95b
SDI75−1.79a116.47a32.02a−2.29b139.86a32.78a−2.10a165.27a32.97a
SDI65−2.03b122.47a32.77a−2.01b129.44a32.87a−1.92a163.96a32.92a
Treat, treatment; gs, stomatal conductance; Ψleaf, leaf water potential; TC, canopy temperature; FI, fully irrigated treatment; SDI75, sustained deficit irrigation at 75% of the crop irrigation requirements; SDI65, sustained deficit irrigation at 65% of the crop irrigation requirements; DOY, day of the year. Different letters represent significant differences (p < 0.05) among treatments within each cultivar.
Table 4. Temporal evolution of the physiological variables measured throughout 2019.
DOYTreatMartaGuaraLauranne
Ψleaf (MPa)gs (mmol m−2 s−1)Tc (°C)Ψleaf (MPa)gs (mmol m−2 s−1)Tc (°C)Ψleaf (MPa)gs (mmol m−2 s−1)Tc (°C)
162FI−1.47a279.70a29.65a−1.46a314.73a30.24a−1.41a271.48a30.91a
SDI75−1.52a298.97a29.94a−1.75b280.65a31.91a−1.58a266.93a30.73a
SDI65−1.60a308.45a30.54a−2.11b274.88a30.47a−1.49a275.62a30.10a
175FI−1.42a274.55a29.74a−1.75a222.67a29.34b−1.43a205.53a29.25a
SDI75−1.54b298.87a28.23a−2.04b215.02a27.02a−1.87b206.88a29.67a
SDI65−1.52b278.13a29.41a−1.77a213.72a30.06c−1.83b192.12a29.15a
183FI−1.36a197.80a25.95a−1.61a199.80a26.41a−1.50a217.97a25.53a
SDI75−1.52b190.88a26.18a−1.80b195.37a26.79a−1.80b203.43a26.01a
SDI65−1.54b192.73a26.29a−2.03b209.57a26.69a−1.64b206.38a26.31a
189FI−1.36a197.80a25.95b−1.61a199.80a26.41a−1.50a217.97a25.53a
SDI75−1.52b190.88a26.18a−1.80b195.37a26.79a−1.80b203.43a26.01a
SDI65−1.54b192.73a26.29a−2.03b209.57a26.69a−1.64b206.38a26.31ab
196FI−1.08a175.82a28.83a−1.4a165.17a29.26a−1.31a163.80a29.10a
SDI75−1.29b173.17a29.25a−1.74b174.03a29.96a−1.57b164.20a29.06a
SDI65−1.28b172.30a28.95a−1.71b175.37a30.00a−1.53b158.13a29.15a
203FI−1.67a152.37a31.83a−1.88a163.55a30.79b−1.69a161.07a31.26a
SDI75−1.69a144.55a31.69a−2.01b145.10a31.63a−1.90b157.03a30.95a
SDI65−1.87b155.22a31.79a−2.11b155.72a31.83a−1.89b170.28a31.16a
210FI−1.19a165.10a27.53a−1.38a177.73a26.78a−1.44a174.07a27.45a
SDI75−1.26a168.58a27.51a−1.55b187.20a26.97a−1.57a185.95a27.85a
SDI65−1.35b177.20a27.65a−1.50b182.55a27.67a−1.49a188.20a27.89a
217FI−1.55a180.50a29.44a−1.73a179.65a29.20a−1.72a191.52a29.73a
SDI75−1.80b167.98a29.47a−1.95b194.50a29.65a−1.97b184.35a29.81a
SDI65−1.72b176.20a29.41a−1.90b195.53a29.49a−1.95b185.43a29.45a
Treat, treatment; gs, stomatal conductance; Ψleaf, leaf water potential; TC, canopy temperature; FI, fully irrigated treatment; SDI75, sustained deficit irrigation at 75% of the crop irrigation requirements; SDI65, sustained deficit irrigation at 65% of the crop irrigation requirements; DOY, day of the year. Different letters represent significant differences (p < 0.05) among treatments within each cultivar.
Table 5. Fitted parameters for the non-water-stress baselines and water-stress baselines for the almond cultivars and irrigation treatments.
Baselinecv. Guaracv. Martacv. Lauranne
SlopeInterceptR2SlopeInterceptR2SlopeInterceptR2
NWSB−2.71a5.60a0.82−2.33a4.14a0.75−2.48a4.62a0.78
WSB75−2.62a5.65a0.76−2.45a4.73a0.75−2.66a5.75a0.77
WSB65−2.58a5.76a0.74−2.49a5.01a0.74−2.62a5.51a0.77
NWSB, non-water-stress baseline defined according to the registered values in full irrigated treatment; WSB75, water-stress baseline according to the registered values in the sustained deficit irrigation at 75% of the crop irrigation requirements; WSB65, water-stress baseline according to the registered values in the sustained deficit irrigation at 65% of the crop irrigation requirements. Equal letters within each column are not significantly different (p < 0.05).
Table 6. Fitted parameters for the reference water-stress baselines (rWSB) for each cultivar.
CultivarsSlopeInterceptR2
Marta−2.424.630.74
Guara−2.635.670.77
Lauranne−2.595.290.74