Article

Effects of Distinct Revegetation Methods on Growth and Microbial Properties of Vallisneria natans

1
Department of Environmental Science and Engineering, Fudan University, Shanghai 200433, China
2
Center for Ecological Research (CER), Kyoto University, Otsu, Shiga 5202113, Japan
*
Authors to whom correspondence should be addressed.
Water 2020, 12(5), 1294; https://doi.org/10.3390/w12051294
Submission received: 8 March 2020 / Revised: 27 April 2020 / Accepted: 28 April 2020 / Published: 2 May 2020
(This article belongs to the Section Water Quality and Contamination)

Abstract

:
This study investigated the effects of the mud-sinking (MS) method, agar gel-sinking (AS) method and agar gel-sinking with artificial aquatic mat (ASA) method on the growth, physiological characteristics, water purification capacity, and associated microbial community of the different organs of Vallisneria natans (V. natans). Results showed that the growth of agar-based growth (group AS and ASA) were more effective than the mud-wrapped method (group MS), exhibiting longer length, higher fresh weight and biomass of agar-based V. natans with the artificial aquatic mat (group ASA) being higher than those of other groups. MS caused a stress response in the oxidative system, which then inhibited photosynthesis. Results of water quality measurements showed that the three planting methods positively affected water purification without significant differences (p > 0.05). Besides, there was no significant difference (p > 0.05) between the microbial communities in terms of the roots and those found in rhizosphere soils in the MS group with high throughput sequencing. Meanwhile, the addition of agar in the AS and ASA groups increased the diversity of rhizosphere soil microbial communities and reduced the diversity of root microbial communities. Microbial community compositions in the rhizosphere soil and root differed significantly (p < 0.05). High throughput sequencing and scanning electron microscopy (SEM) also revealed that the biofilm on the surfaces were different, with Proteobacteria and Cyanophyta consistently dominating. This study provides new insights on the more effective revegetation methods of V. natans, researched the environmental impact of the addition of agar, and provides some theoretical support for the revegetation of submerged macrophytes under ecological restoration.

1. Introduction

For eutrophic lakes, pollution from external inputs affected the normal succession of plant communities, severely affecting the vegetation and causing degradation of the lake’s ecosystem. In most cases, gradually transformation is observed from grass-dominated to grass-algae dominated communities, further shifting to algae-dominated environments [1,2], primarily due to eutrophication. Nutrient accumulation in the lake stimulates phytoplankton blooms, the biomass of which significantly reduces light penetration, decreasing dissolved oxygen concentration, which then limit the growth of the submerged plants. Mortality and subsequent decomposition of the submerged plants will then cause secondary pollution and further aggravate the deterioration of the water quality. As a result, the biodiversity of lakes decreases rapidly, and the community structure becomes a single-species dominated community [3,4,5], which has very poor stability. Studies have shown that for lakes with less pollution, and aquatic plants not seriously degraded, artificial intervention to remove external stress showed that the macrophyte communities can be restored to some extent [6,7]. However, changes in external conditions (e.g., temperature, dissolved oxygen content), seem to again stimulate phytoplankton comeback, with a large number of outbreaks re-emerging as the dominant community in eutrophic lakes [8,9,10]. Therefore, ecological restoration should not only rely on pollution control, but would also need to artificially restore and rebuild the biological community particularly the submerged plants. However, we should develop better restoration methods for macrophytes in general. Submerged plants have been gaining interest since they grow fast and can absorb large amounts of nutrients from the sediment and overlying water, causing the dissolved oxygen to increase and the water quality to improve. Their secretion of allelochemicals can also effectively inhibit the growth of algae. Meanwhile, it can provide habitat and food for benthic animals, increasing species richness of the aquatic environment [11,12]. Thus, it is extremely important to develop submerged plant revegetation method with a high survival rate suitable for poor water quality environments.
Nowadays, although there had been much research done on plant growth and stresses in extreme or adverse environments (e.g., sediment fertilization, water depth, benthonic animal and etc.), studies on revegetation methods of submerged plants remain rare [13,14,15,16]. The research on current revegetation methods of submerged plants have been limited to sowing, cuttings and sinking. Traditional sinking method refers to covering the root with mud, wrapping and bundling the root with cloth, throwing the plants into the water, and using gravity to sink it to the bottom. Since the 1990s, successful restoration of submerged vegetation in shallow eutrophic lakes have already been done, but fluctuations in water levels, low transparency, and feeding by aquatic animals have become major obstacles to these efforts [17,18,19]. Studies showed that the survival rate of the cutting method was the highest, followed by the sinking method, and finally the sowing method, and there was no significant difference in the biomass of individual plants [20]. However, the cutting method is difficult to operate and requires a lot of manpower and material resources, while seed germination rate of the sowing method is low and time-consuming. Traditional sinking method on the other hand causes damage to plants, with the loss of mud reducing the survival rate of plants.
Thus, in this study, agar was used to lessen such disadvantages, and it can provide rich resources, such as nutrients. The introduction of agar will also greatly affect the structure of the associated microbial communities. In aquatic ecosystems, microorganisms drive most of the biogeochemical cycling and nutrient transfers. In ecological restoration, changes in bacterial abundance, community structure, and diversity can be used as important indicators in assessing the effect of the methods being employed [21,22]. Past studies on the restoration of submerged plants mainly compared the effects of common methods on plant biomass and water quality [20,23,24], but not the microbial communities. This study explored and segmented current understanding of the responses of microbial communities during restoration.
Vallisneria natans (V. natans) is a common perennial submerged plant with wide adaptability and high tolerance to pollution. It is regularly used as a pioneer species in vegetation restoration efforts in eutrophic waters [25].
This study then adopted V. natans as the target research species. By examining the growth of V. natans when transplanted using mud-sinking (MS) method, agar gel-sinking (AS) method, and agar gel-sinking with artificial aquatic mat (ASA) method, the effects of different planting methods on plant damage and photosynthesis were determined. The impact of different planting methods of V. natans on purification of water bodies and bacterial communities on the root system, rhizosphere soil, and plant leaf surfaces were then evaluated.

2. Materials and Methods

2.1. Materials

V. natans plants were obtained from an aquatic plant company (Pudong Tiancun Horticultural Company, Shanghai, China) and cultured for 7 days in aquaria containing tap water before the experiment. The plants were then cleaned with deionized water and only healthy plants of similar size were chosen for subsequent experiments. Quartz sand (particle size 4–7 mm, Huilong Environmental Company, Jiangsu, China), fishnet (mesh side length 4 cm, Boxing Net Industry Company, Jiangsu, China) and artificial aquatic mat (Shanghai Fan-resistant Aquarium Products Co., Ltd., Shanghai, China) were first treated with deionized water and UV sterilization before use. Agar powder was purchased from Sinopharm Chemical Reagent Co., Ltd.
The overlying water was obtained from Moon Lake, a typical shallow landscape lake in Jiangwan Campus, Fudan University. Water samples were uniformly mixed. The sediment was sampled from the surface layer of Zhushan Bay in Taihu Lake by a grab dredger.

2.2. Experimental Design

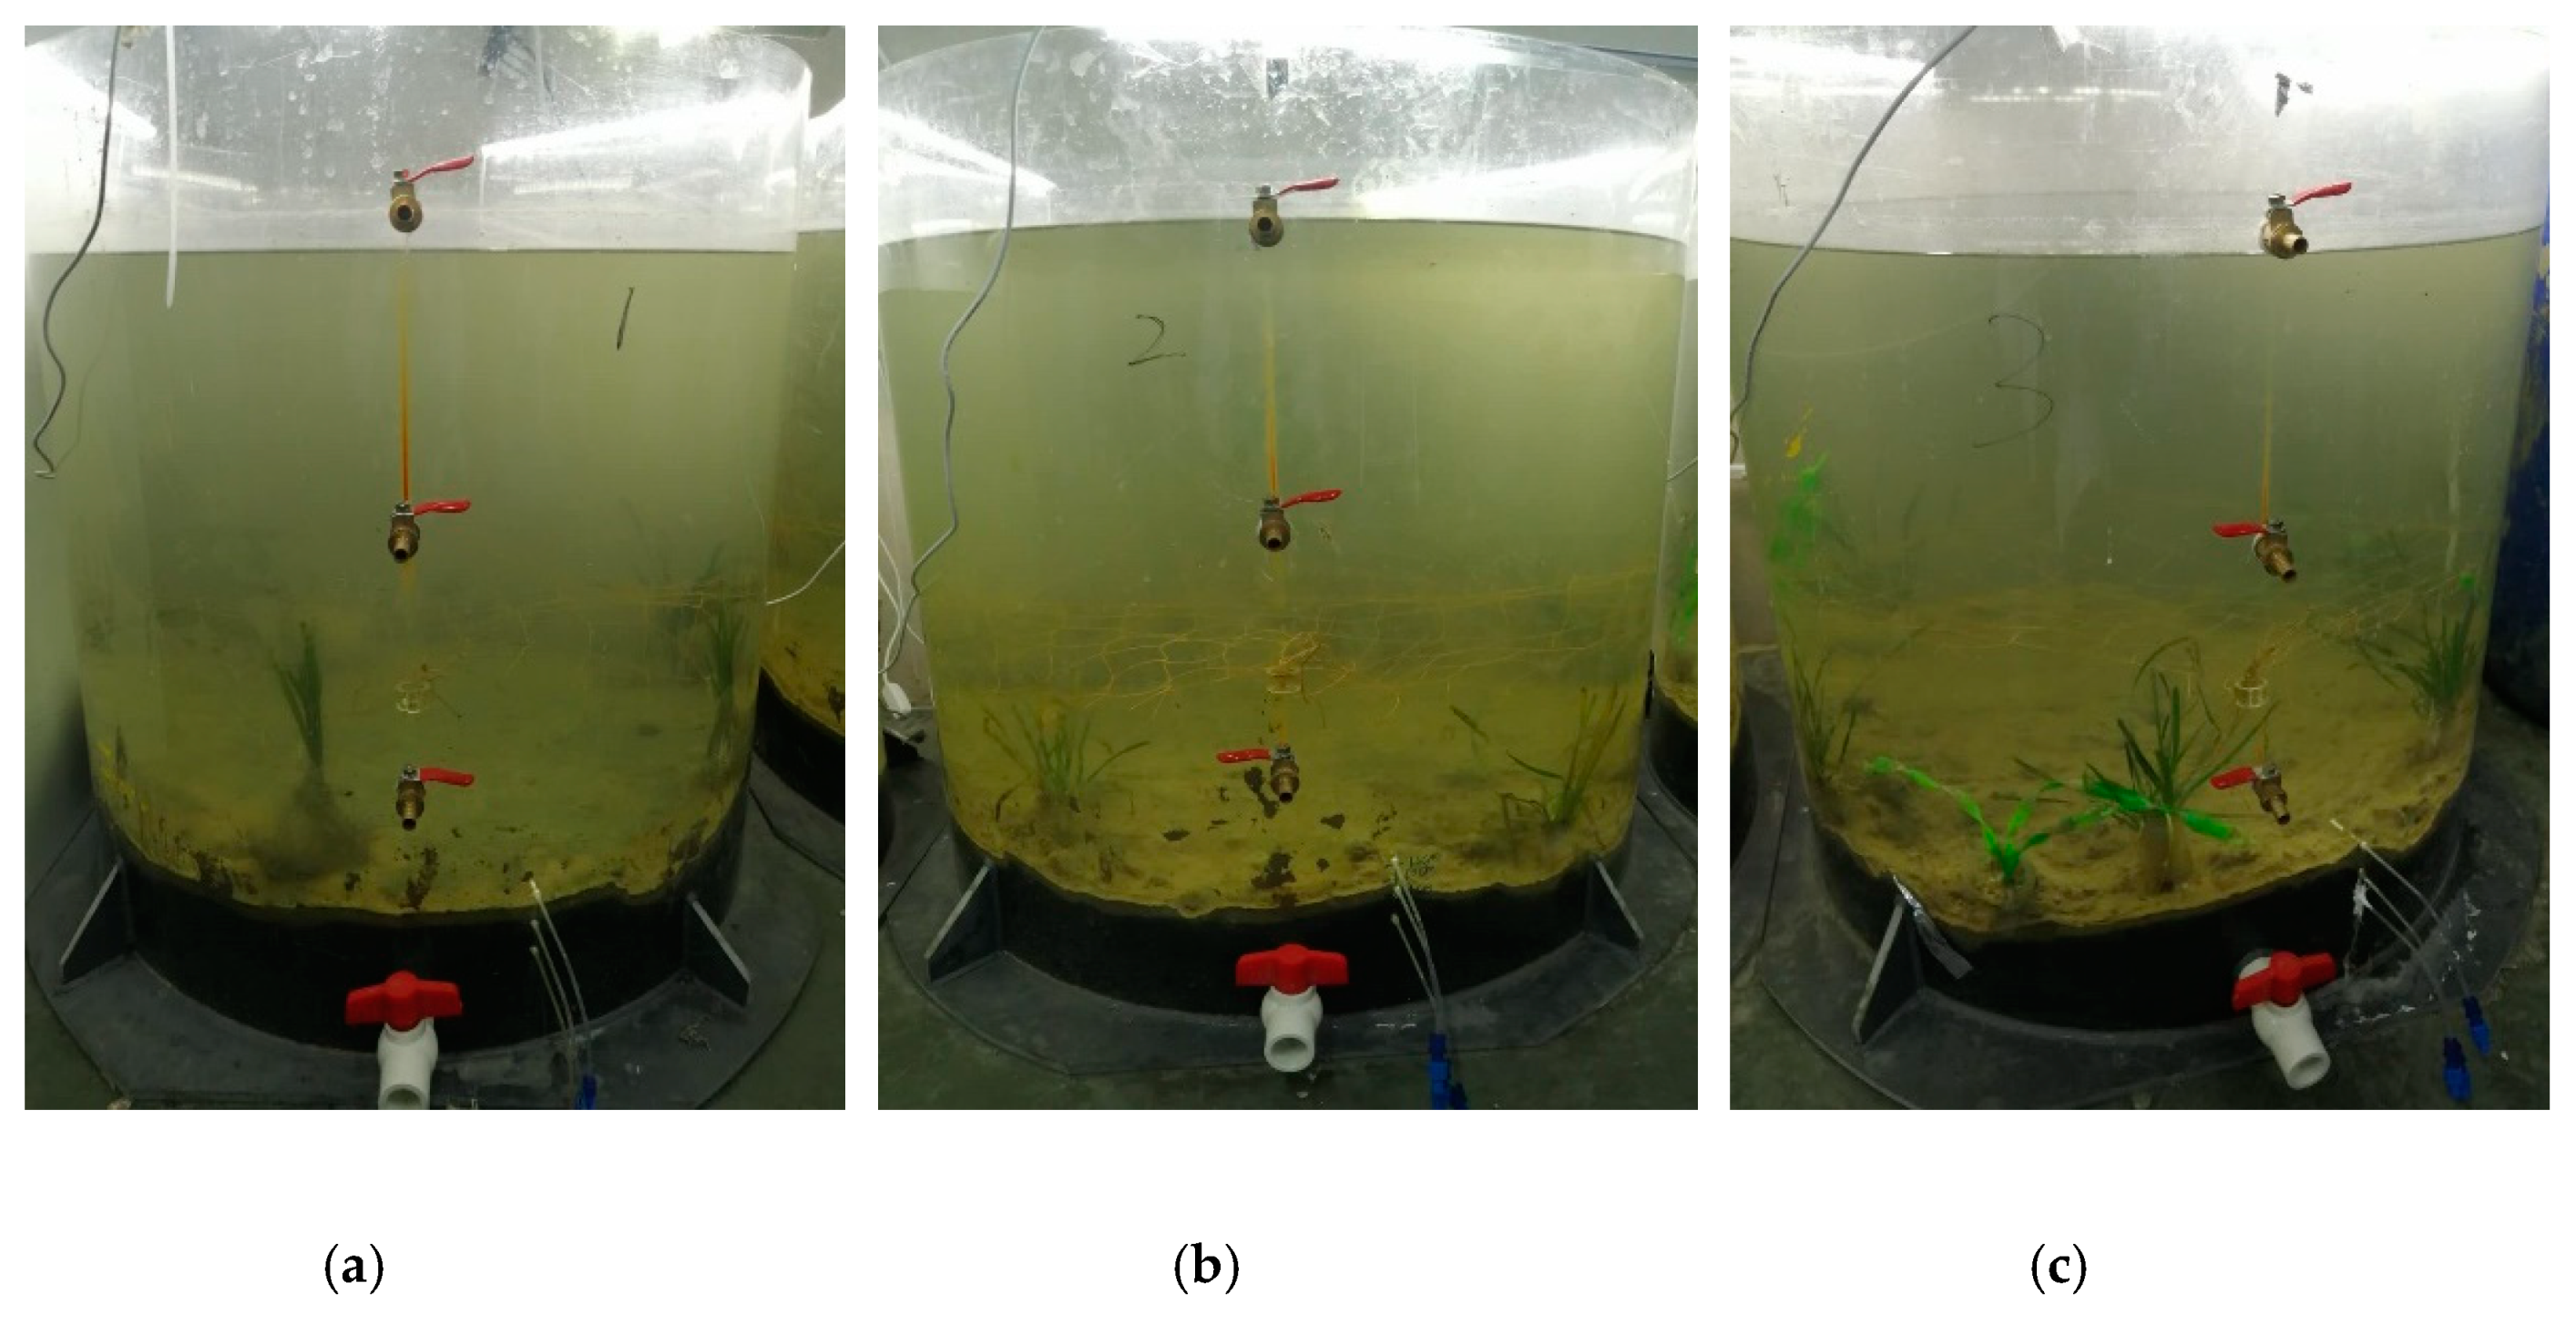
After culturing for 7 days, the V. natans individuals were divided into three groups, and evenly separated into five small bundles. Each group had a fresh weight of 20.30 ± 0.42 g, a dry weight of 4.06 ± 0.41 g, a shoot height of 16.83 ± 1.83 cm and a root height of 9.20 ± 2.20 cm. These were then cultivated into three Plexiglas buckets (inner diameter 600 mm, height 600 mm) at 18 ± 2 °C under 80 µmol quanta m−2 s−1 (PPFD) light and a 16:8 h light-dark cycle. In the Plexiglas buckets, the sediment depth was set at 10 cm, and the overlying water depth at 40 cm to simulate typical contaminated shallow lakes (Figure 1 and Figure 2). In the first group (hereafter referred to as mud-sinking method, MS), the root of the V. natans plants was wrapped with sediment from Taihu Lake to form a cone shape, and the sediment was tied by fishnet. The wrapped V. natans plants were put into the water then sank to the bottom. Meanwhile, in the second group (hereafter referred to as agar gel-sinking method, AS), the treatments of the root were modified. A 3% agar solution was prepared, heated to a boiling point, and cooled down to 42 °C; then, V. natans plants were placed in the center of small crucibles with a diameter of 5 cm and approximately 2 g quartz sand were added. After that, agar solution was poured quickly into the crucibles immersed in a cold-water bath. When the agar solidified, the content of the crucible was taken out, which included the agar base plant integrated grass seedling. In the third group (hereafter referred to as agar gel-sinking with artificial aquatic mat method, ASA), the V. natans plants were cultivated into the bucket in the same way as the second group but 20.00 ± 0.08 g string artificial aquatic mat were evenly added into the bucket to increase the microbial adhesion area [26].

2.3. Monitoring Plant Growth and Enzyme Activity

Plant growth was evaluated by measuring changes in fresh weight, dry weight, root length, shoot length, and photosynthetic efficiency including total chlorophyll (Chl (a + b)) and maximum quantum yield of PSII (Fv/Fm ratios). Fv/Fm ratios are optimal/maximal photochemical efficiency of PSII in the dark. Chl (a + b) was measured at the beginning and end of the experiment, which were extracted using 90% hot ethanol, and the absorbance measured at 649 nm and 665 nm, respectively. Chl contents were then calculated using the methods described by [27]. Maximum quantum yield of PSII was determined at the same frequency as the water quality parameter with a PAM 2100 fluorometer (AquaPen-C, Photon Systems Instruments, Czech Republic) [28]. The above indicators were measured in triplicate each sample at each time point.
Peroxidase (POD) and catalase (CAT) were detected at the beginning and end of the experiment. CAT is widely found in plant tissues—it has obvious ecological effects on a variety of adverse environmental factors (NO2, SO2, NH3), which can decompose H2O2 produced by cell metabolism and prevent H2O2 from harming the plant. As one of the important protective enzymes in plants, POD can effectively prevent the accumulation of reactive oxygen species in plants, the increase and decrease of POD activity reflects the protective stress response of plants under the action of adversity factors. Around 1.00 ± 0.01 g of leaves were first flash frozen in liquid nitrogen, and then crushed with 10 mL 0.1 mol/L PBS (pH 7.0, containing 1 mmol EDTA and 1% polyvinylpyrrolidone (w/v)). The homogenate was centrifuged at 10,000× g to obtain supernatants at 4 °C for 20 min. The activities of POD, CAT and the total protein content were assessed by a commercial chemical kit (Nanjing Jiancheng Bioengineering Institute, China)) following the manufacturer’s instructions. The above indicators were measured in triplicate each sample at each time point.

2.4. Water Quality Parameters

Total organic carbon (TOC) and total nitrogen (TN) were analyzed using a total organic carbon analyzer (TOC-L CPH, Shimadzu, Kyoto, Japan), and pH by a portable pH meter (PHB-4, Shanghai INESA Scientific Instrument Co., Ltd., Shanghai, China). Turbidity was measured by a portable turbidimeter (2100Q, HACH Water Analysis Instrument Co., Ltd., Shanghai, China). Then, NH3-N was determined by standard methods [29]. The experiment lasted for 40 days, with the physiochemical indicators being observed every 3 days in the early period (0 d to 12 d) to track rapid changes, then every 5 days between 12 d to 32 d, and then terminated on 40 d.

2.5. Scanning Electron Microscopy (SEM) and Microbial Properties Analysis

SEM was used to visualize the surface morphology of plant leaves, which allowed visualization of the microbial distribution on leaf surface. On the 40th day, random samples were collected from the middle part of the V. natans leaves, cut into squares (0.8 × 0.8 cm), and fixed with glutaraldehyde (2.5% in 50 mmol/L sodium cacodylate) immediately. After a double rinse with 0.1 M PBS (pH of 7.4), the leaf samples were dehydrated using a series of ethanol concentrations (20, 40, 60, 80 and 90%) for 15 min, and with 100% ethanol twice for 15 min. Dried samples were visualized using SEM (Hitachi, Tokyo, Japan, S-3400 NII) [30].
Around 1 g of samples (V. natans leaves, artificial aquatic mat leaves and roots with biofilms) from every group was collected at the end of the experiment. Samples were then added with 20 mL 0.1 mol/L sterile PBS solution, and the mixture was incubated at 20 °C and centrifuged at 180 RPM for 20 min. Plant tissues were removed, and 20 mL 0.1 mol/L sterile PBS solution was added one more time before centrifugation at 180 rpm for about 20 min. The plant tissues were taken out again, and added with 20 mL 0.1 mol/L sterile PBS solution, then washed by ultrasonic for 10 min (parameters: 160 W, 30 s). Finally, PBS was removed, and the plant tissues were stored in the refrigerator at −80 °C for later use. All wash solution was collected and passed through 0.2 μm filter membrane (or 12,000 g centrifugation for 10 min to collect the precipitate). Collected filter membranes were stored at −80 °C for preservation [31]. Around 10 g rhizosphere soil was gathered at the end of the experiment from every group. Samples were quickly frozen in liquid nitrogen, and stored at −80 °C for later use [32]. Samples for microbiological testing were from random sampling in the reactor and mixing before testing. Each leaf, root and rhizosphere soil samples were collected in triplicate and mixed [33].
Microbial DNA of the leaves, roots and rhizosphere soil samples were extracted from by using the E.Z.N.A.® soil DNA Kit (Omega Bio-tek, Norcross, GA, USA) according to manufacturer’s protocols. The final DNA concentration and purification were determined by NanoDrop 2000 UV-vis spectrophotometer (Thermo Scientific, Wilmington, NC, USA), and DNA quality was checked by 1% agarose gel electrophoresis. The V3-V4 hypervariable regions of the bacteria 16S rRNA gene were amplified with primers 338F (5’-ACTCCTACGGGAGGCAGCAG-3’) and 806R (5’-GGACTACHVGGGTWTCTAAT-3’) by thermocycler PCR system (GeneAmp 9700, ABI, Wilmington, NC, USA). The PCR reactions were conducted using the following program: 3 min of denaturation at 95 °C, 27 cycles of 30 s at 95 °C, 30s for annealing at 55 °C, and 45 s for elongation at 72 °C, and a final extension at 72 °C for 10 min. PCR reactions were performed in a triplicate 20-μL mixture containing 4 μL of 5 × FastPfu Buffer, 2 μL of 2.5 mM dNTPs, 0.8 μL of each primer (5 μM), 0.4 μL of FastPfu Polymerase and 10 ng of template DNA. The resulted PCR products were extracted from a 2% agarose gel and further purified using the AxyPrep DNA Gel Extraction Kit (Axygen Biosciences, Union City, CA, USA) and quantified using QuantiFluor ™ -ST (Promega, Madison, WI, USA) according to the manufacturer’s protocol. And purified amplicons were pooled in equimolar and paired-end sequenced (2 × 300) on an Illumina MiSeq platform (Illumina, San Diego, CA, USA) according to the standard protocols by Majorbio Bio-Pharm Technology Co., Ltd. (Shanghai, China).

2.6. Statistical Analysis

Statistical analysis was performed by Version 17.0 of SPSS for Windows (SPSS, Chicago, IL, USA). One-way analysis of variance (ANOVA) and a t-test were used to test the difference between of experiment groups, and followed by the least significant difference at p < 0.05. In this paper, the error bars on the bar plots indicate standard deviation. The microbial properties of V. natans were conducted by a web-based platform Majorbio I-Sanger Cloud Platform (www.i-sanger.com). PCoA (Principal Component Analysis) is a non-binding method of data downscaling that can be used to study similarities or differences in the composition of sample communities, and it was performed by Majorbio I-Sanger Cloud Platform (www.i-sanger.com). Raw FASTQ files were quality-filtered by Trimmomatic and merged by FLASH with the following criteria: (i) The readings were truncated at any site receiving an average quality score <20 over a 50 bp sliding window. (ii) Sequences whose overlap being longer than 10 bp were merged according to their overlap with mismatch no more than 2 bp. (iii) Sequences of each sample were separated according to barcodes (exactly matching) and Primers (allowing 2 nucleotide mismatching), and reads containing ambiguous bases were removed. Operational taxonomic units (OTUs) were clustered with 97% similarity cutoff using UPARSE (version 7.1 http://drive5.com/uparse/) with a novel ‘greedy’ algorithm that performs chimera filtering and OTU clustering simultaneously. The taxonomy of each 16S rRNA gene sequence was analyzed by RDP Classifier algorithm (http://rdp.cme.msu.edu/) against the Silva (SSU123) 16S rRNA database using confidence threshold of 70%.

3. Results and Discussion

3.1. Effects of Distinct Revegetation Methods on Growth, Physiological Parameters, and Enzyme Activity of V. natans

3.1.1. Growth of V. natans

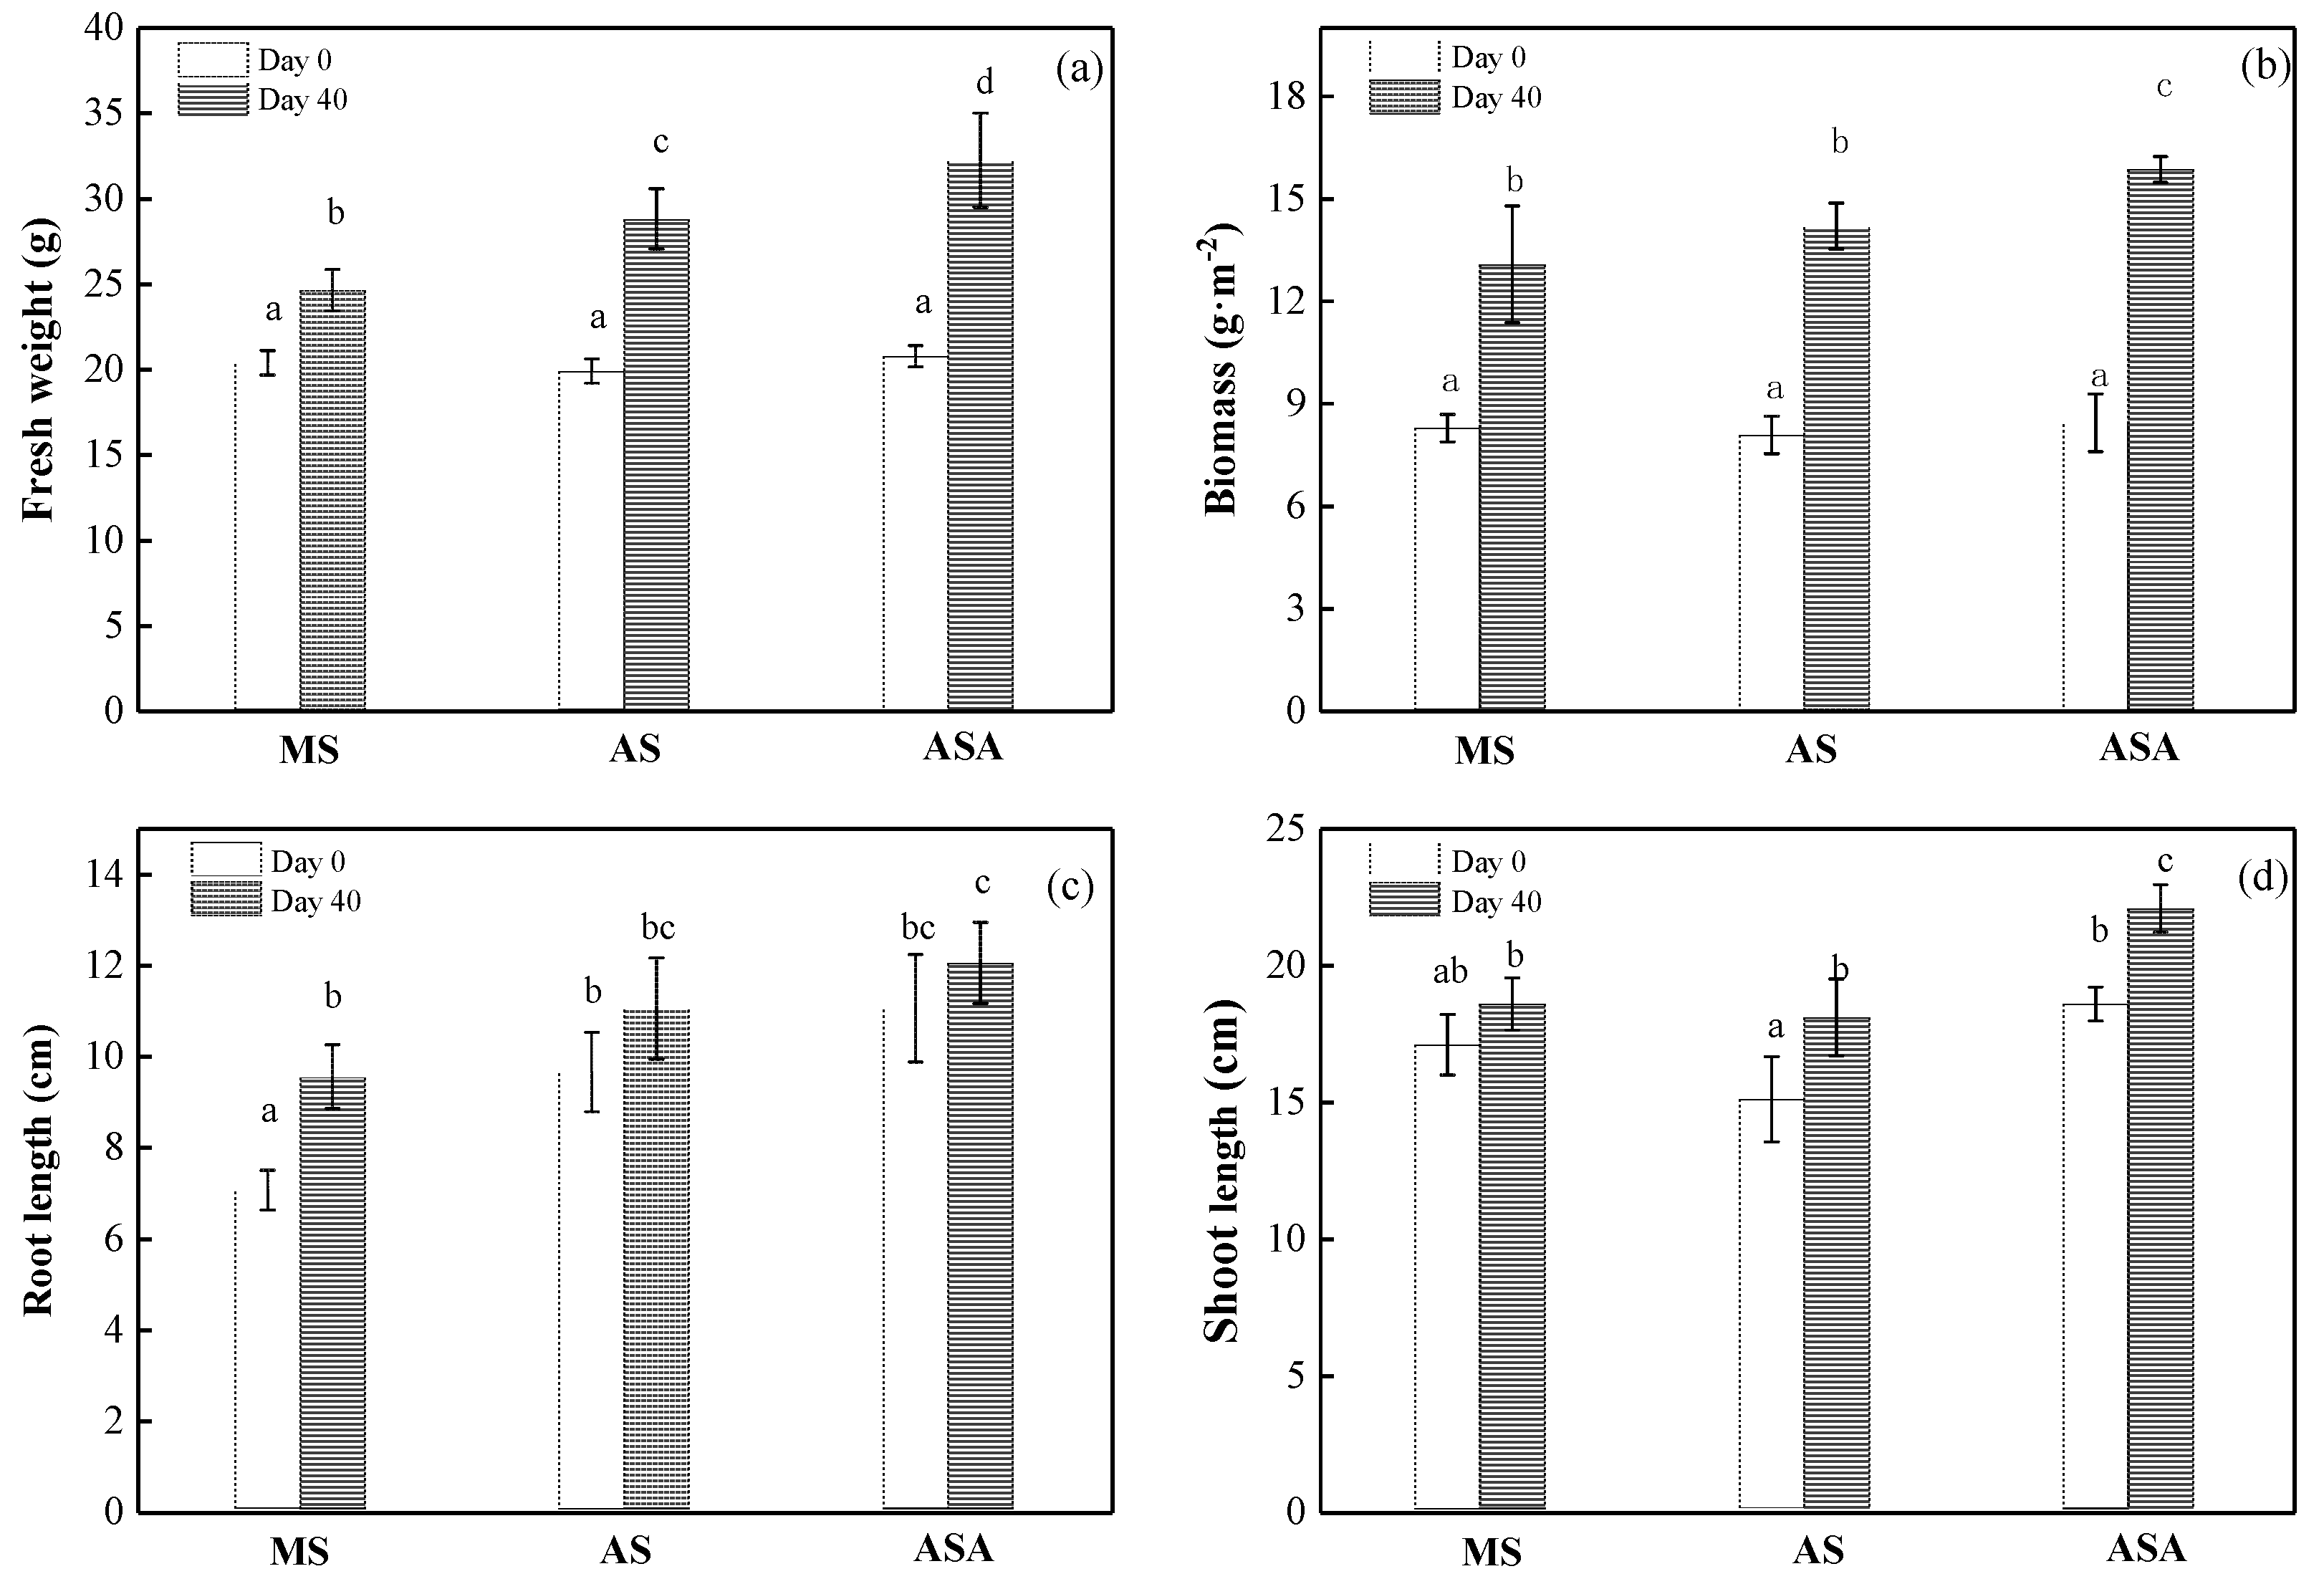
Figure 3 showed that the fresh weight and shoot height of V. natans in groups AS and ASA were significantly higher than that in group MS (p < 0.05). Further, ASA fresh weight and biomass increased more significantly than AS (p < 0.05). However, AS and ASA were not as good as MS in root growth (p < 0.05), which could be due to the agar encapsulation hindering the growth of the root system. Previous studies showed that agar penetration resistance is higher than soil, and an increase in penetration resistance will reduce root elongation [34]. The results showed that when comparing 0 d and 40 d, the growth rates of roots in the experimental group were MS (35.71%), AS (14.58%) and ASA (9.09%), respectively. The growth rate of the leaf length is MS (8.82%), AS (20.00%) and ASA (18.92%), respectively.

3.1.2. Physiological Parameters and Enzyme Activity of V. natans

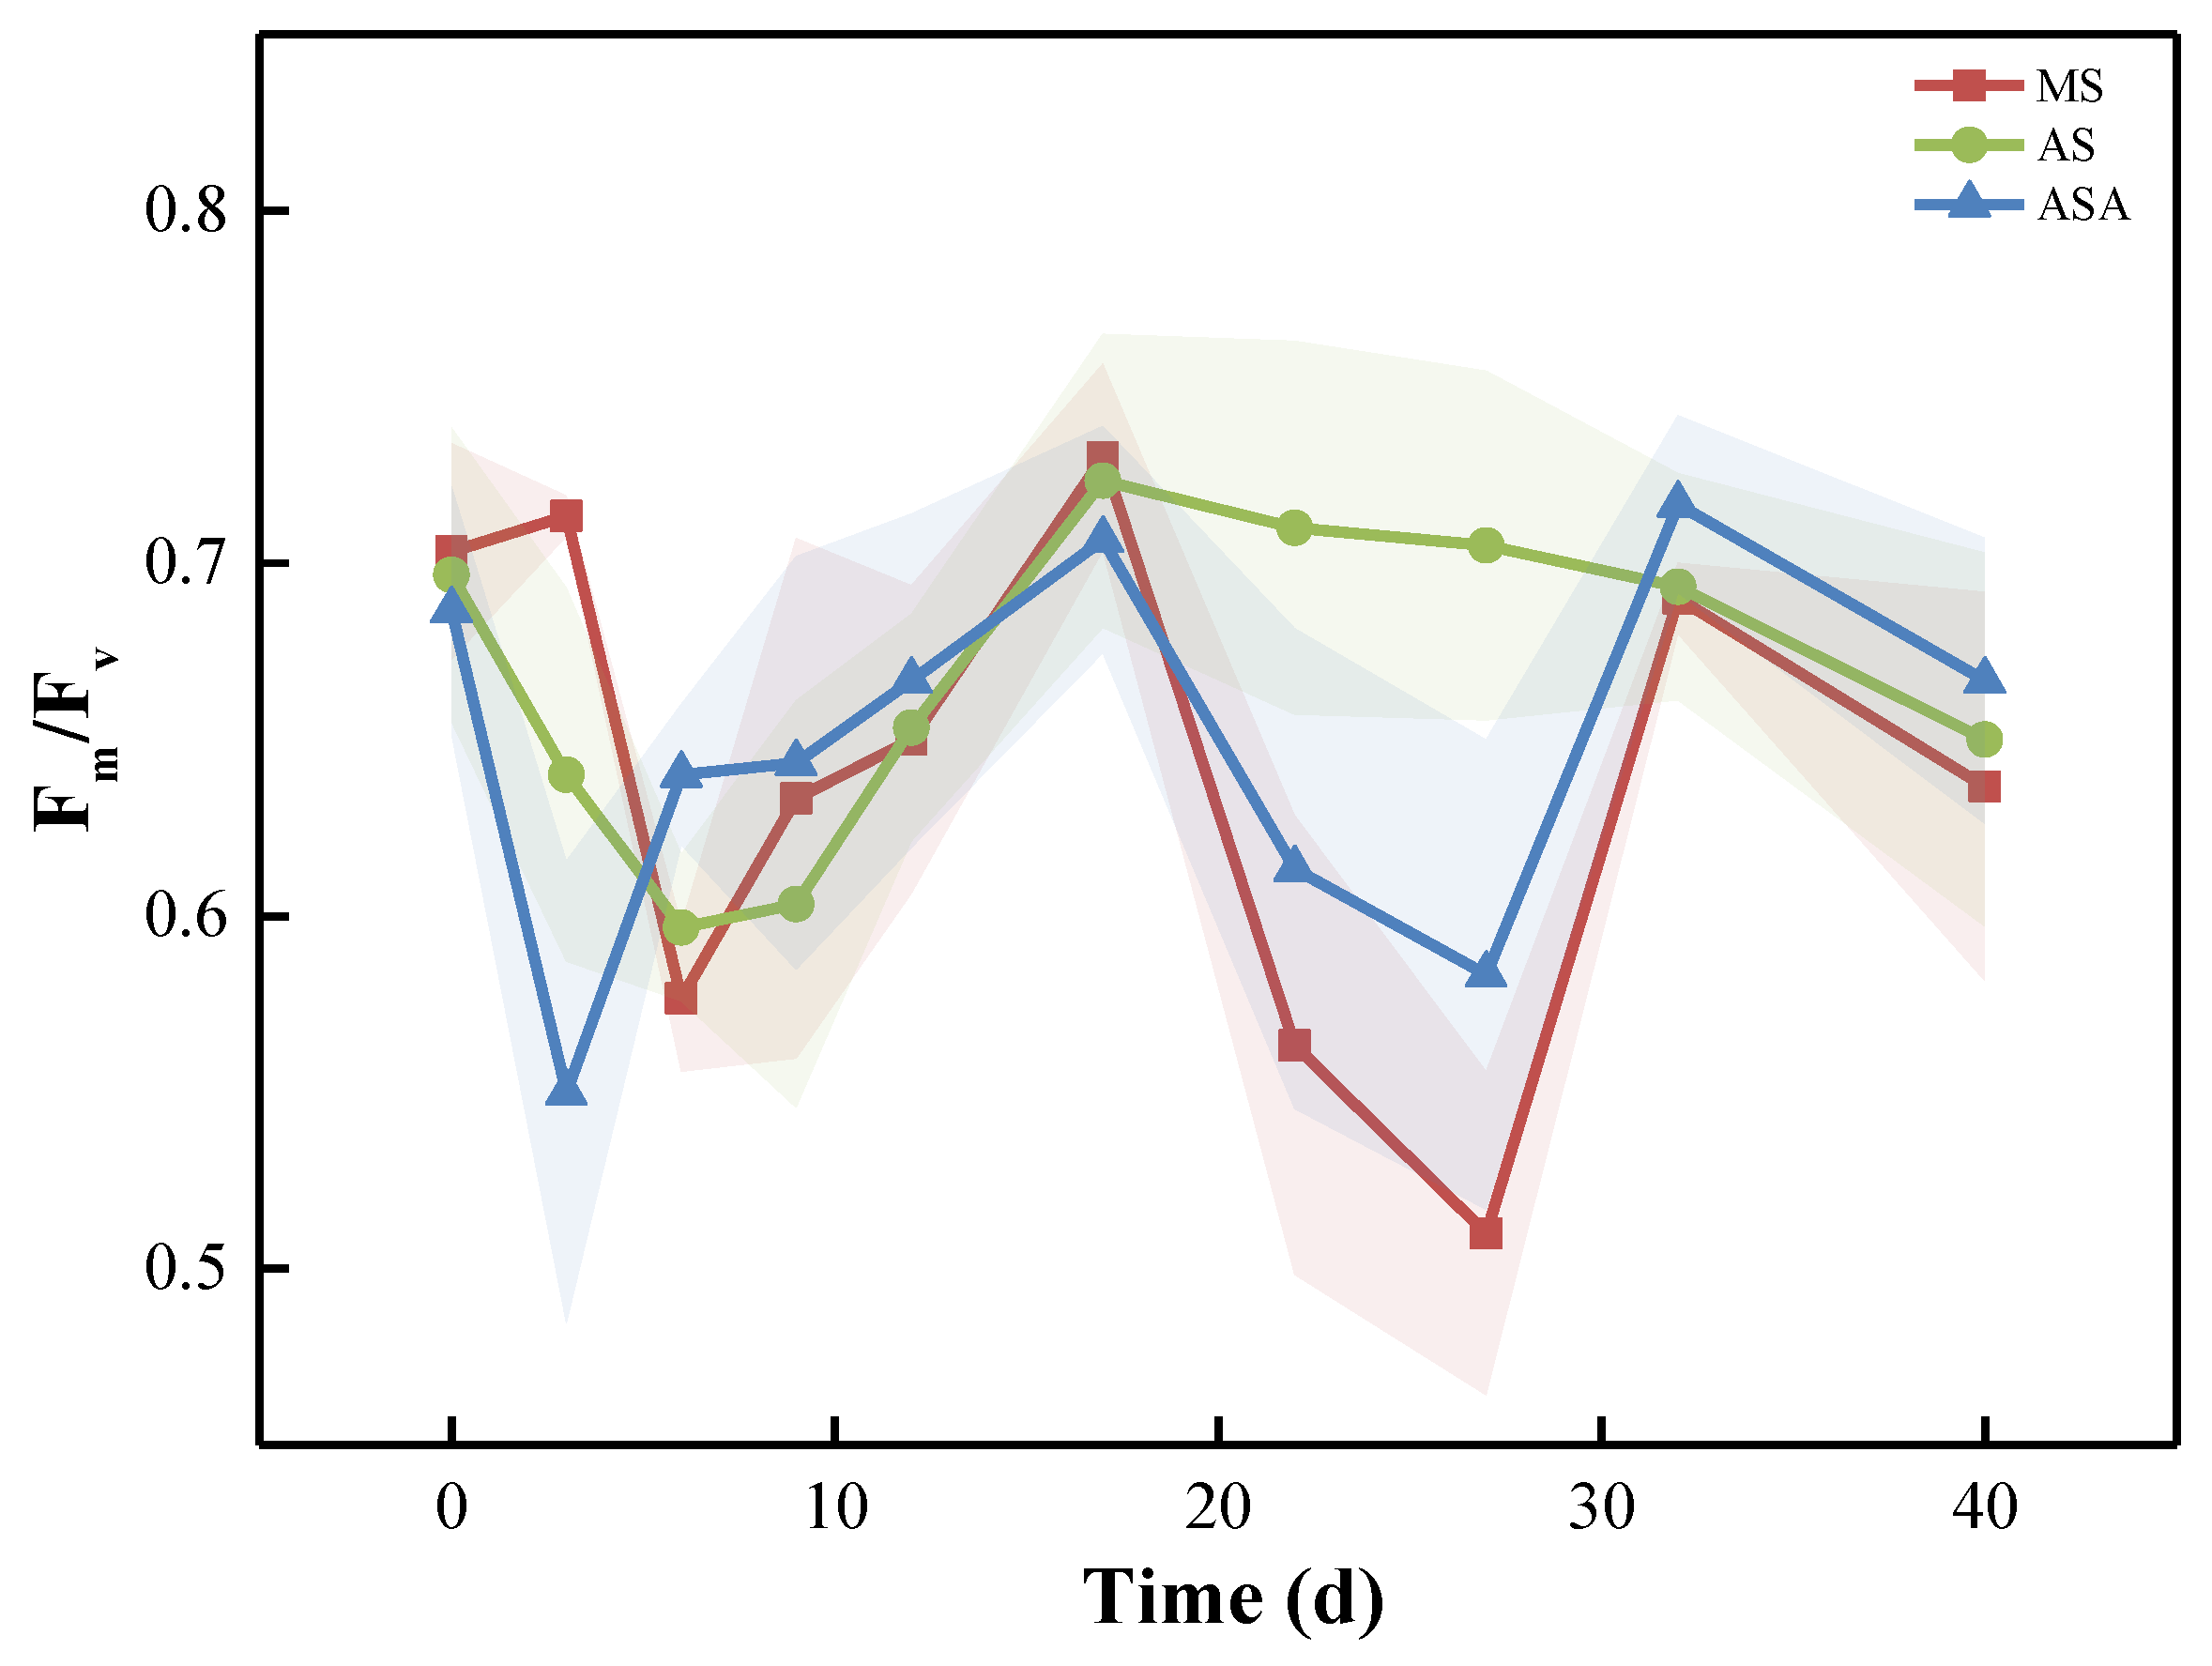
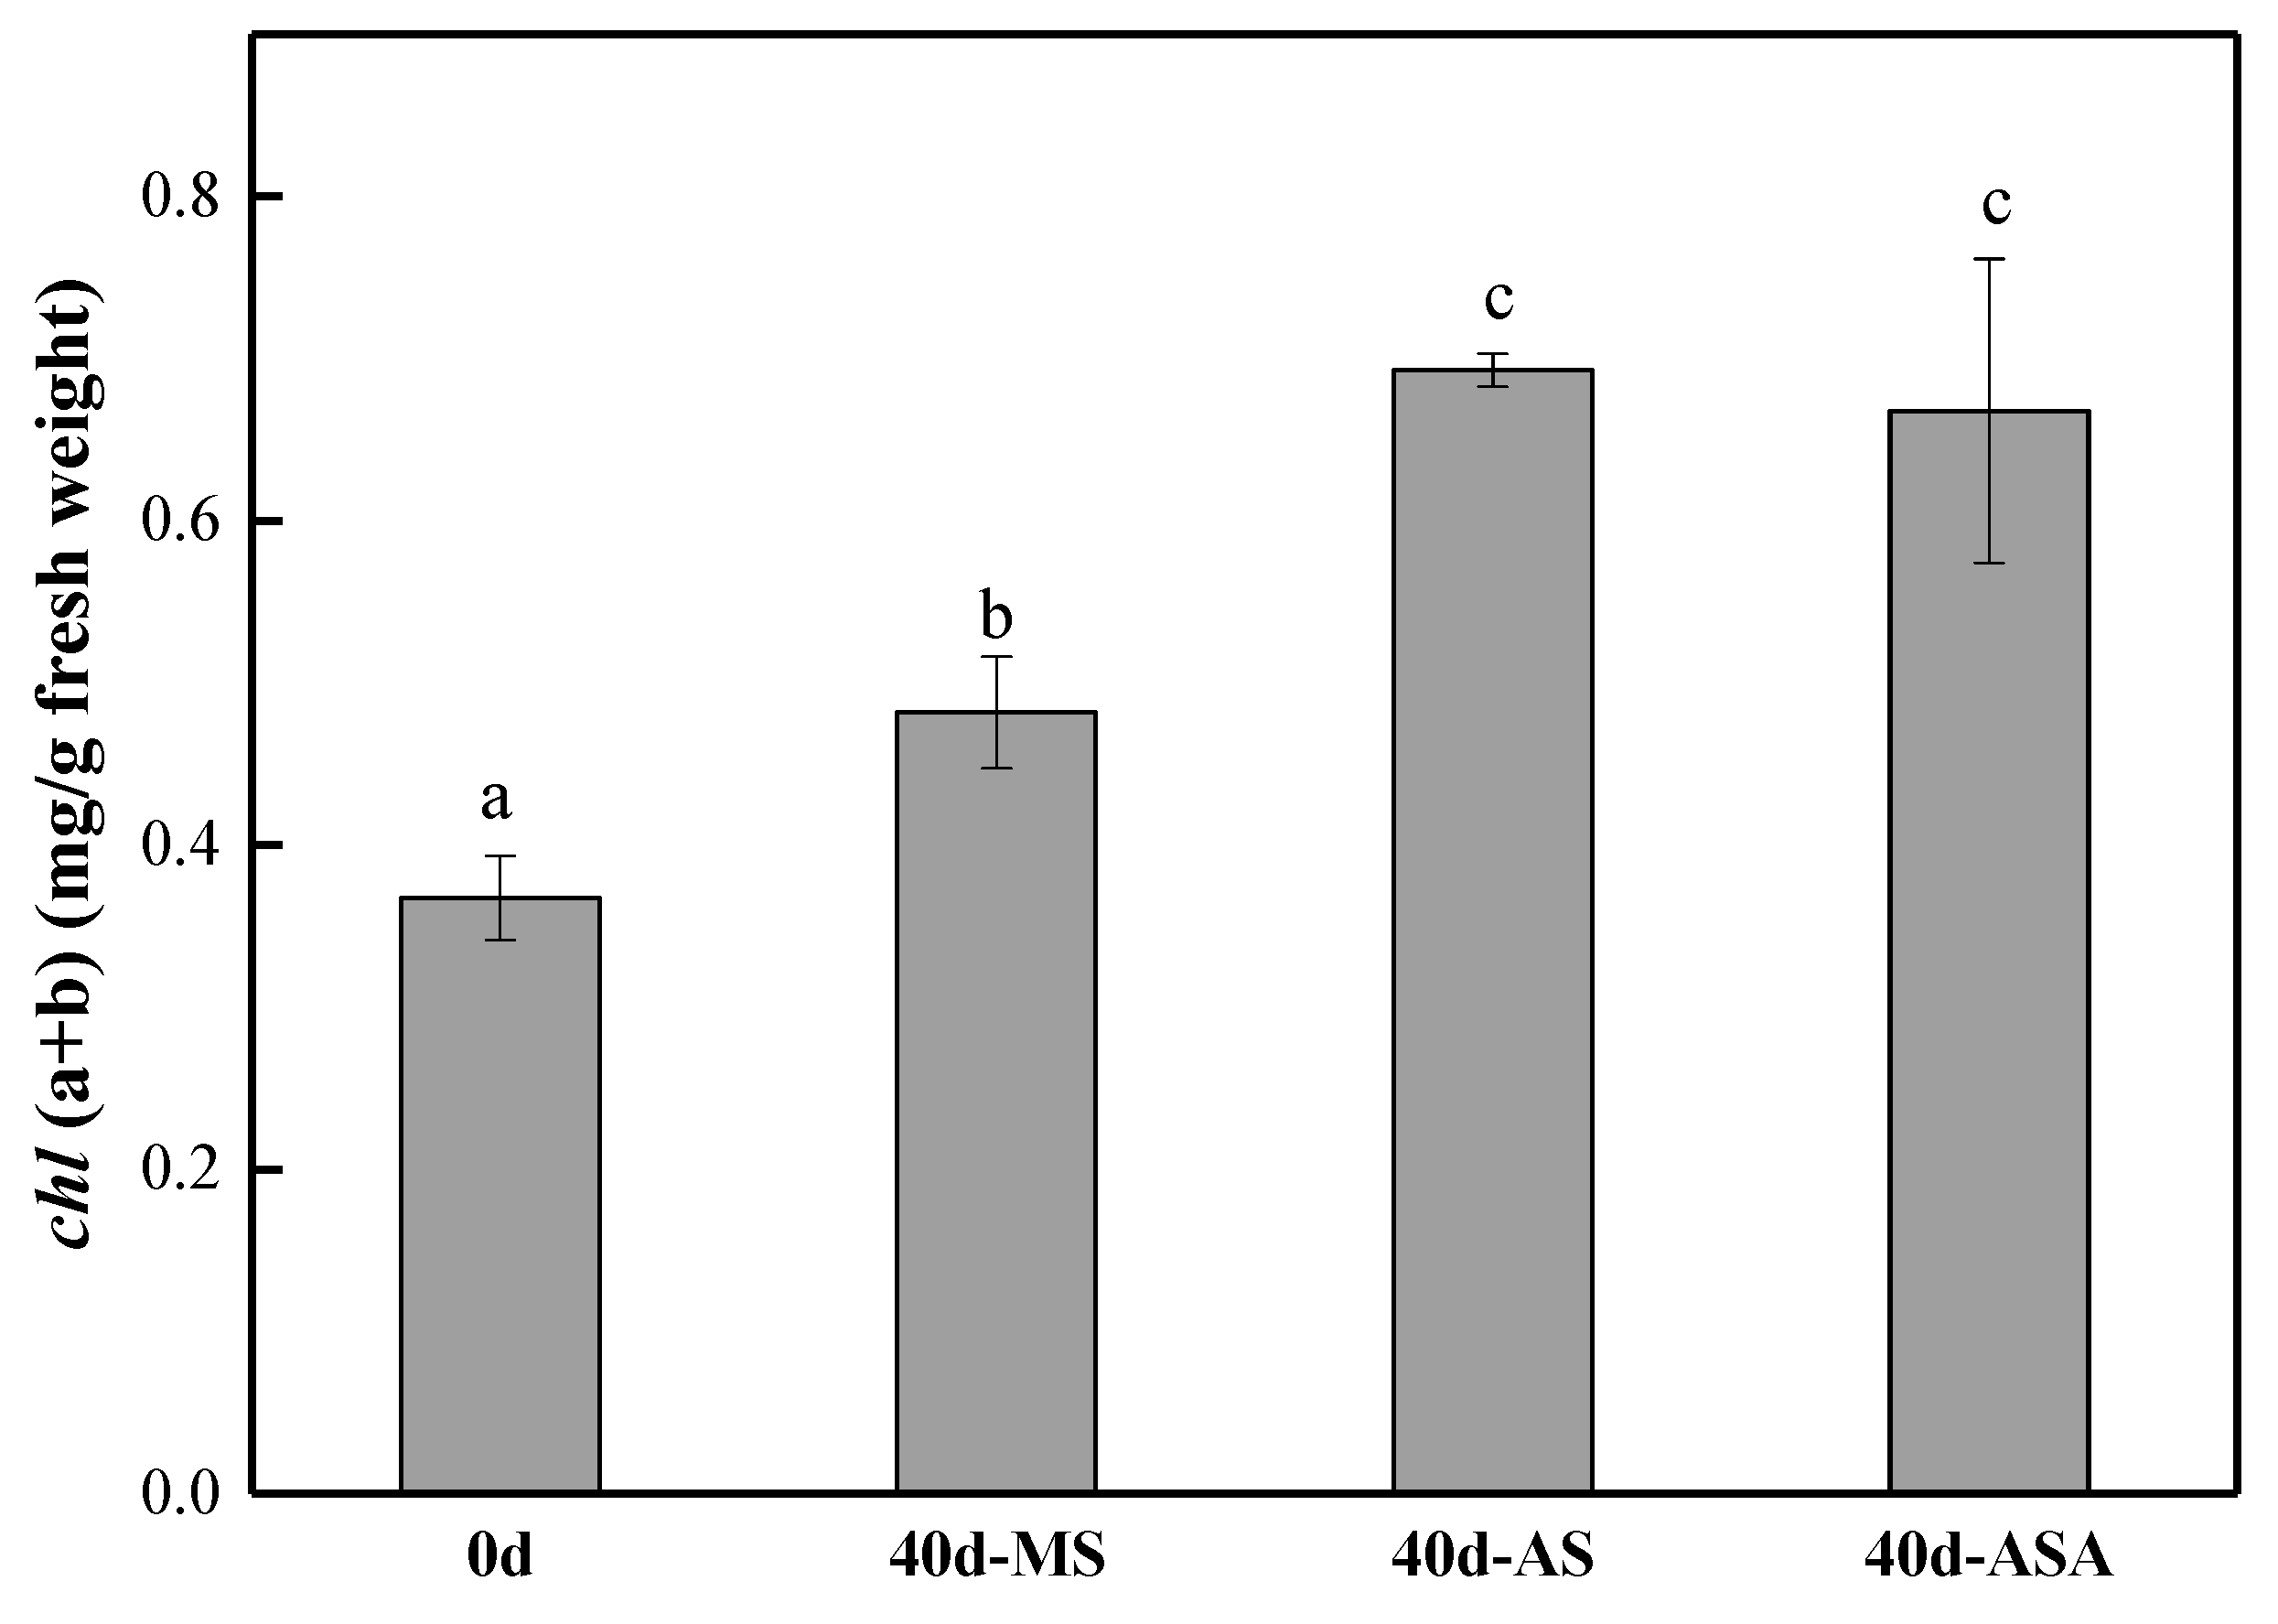
The Fv/Fm ratios and total chlorophyll are shown in Figure 4 and Figure 5. The Fv/Fm ratios showed no significant (p > 0.05) changes during the experiment, indicating that different revegetation methods had no influence in the potential maximum photosynthetic capacity of V. natans. Meanwhile, the total chlorophyll of AS and ASA were higher (p < 0.05) than that of MS, indicating that cultivation with agar did not diminish the plant’s photosynthetic capacity.
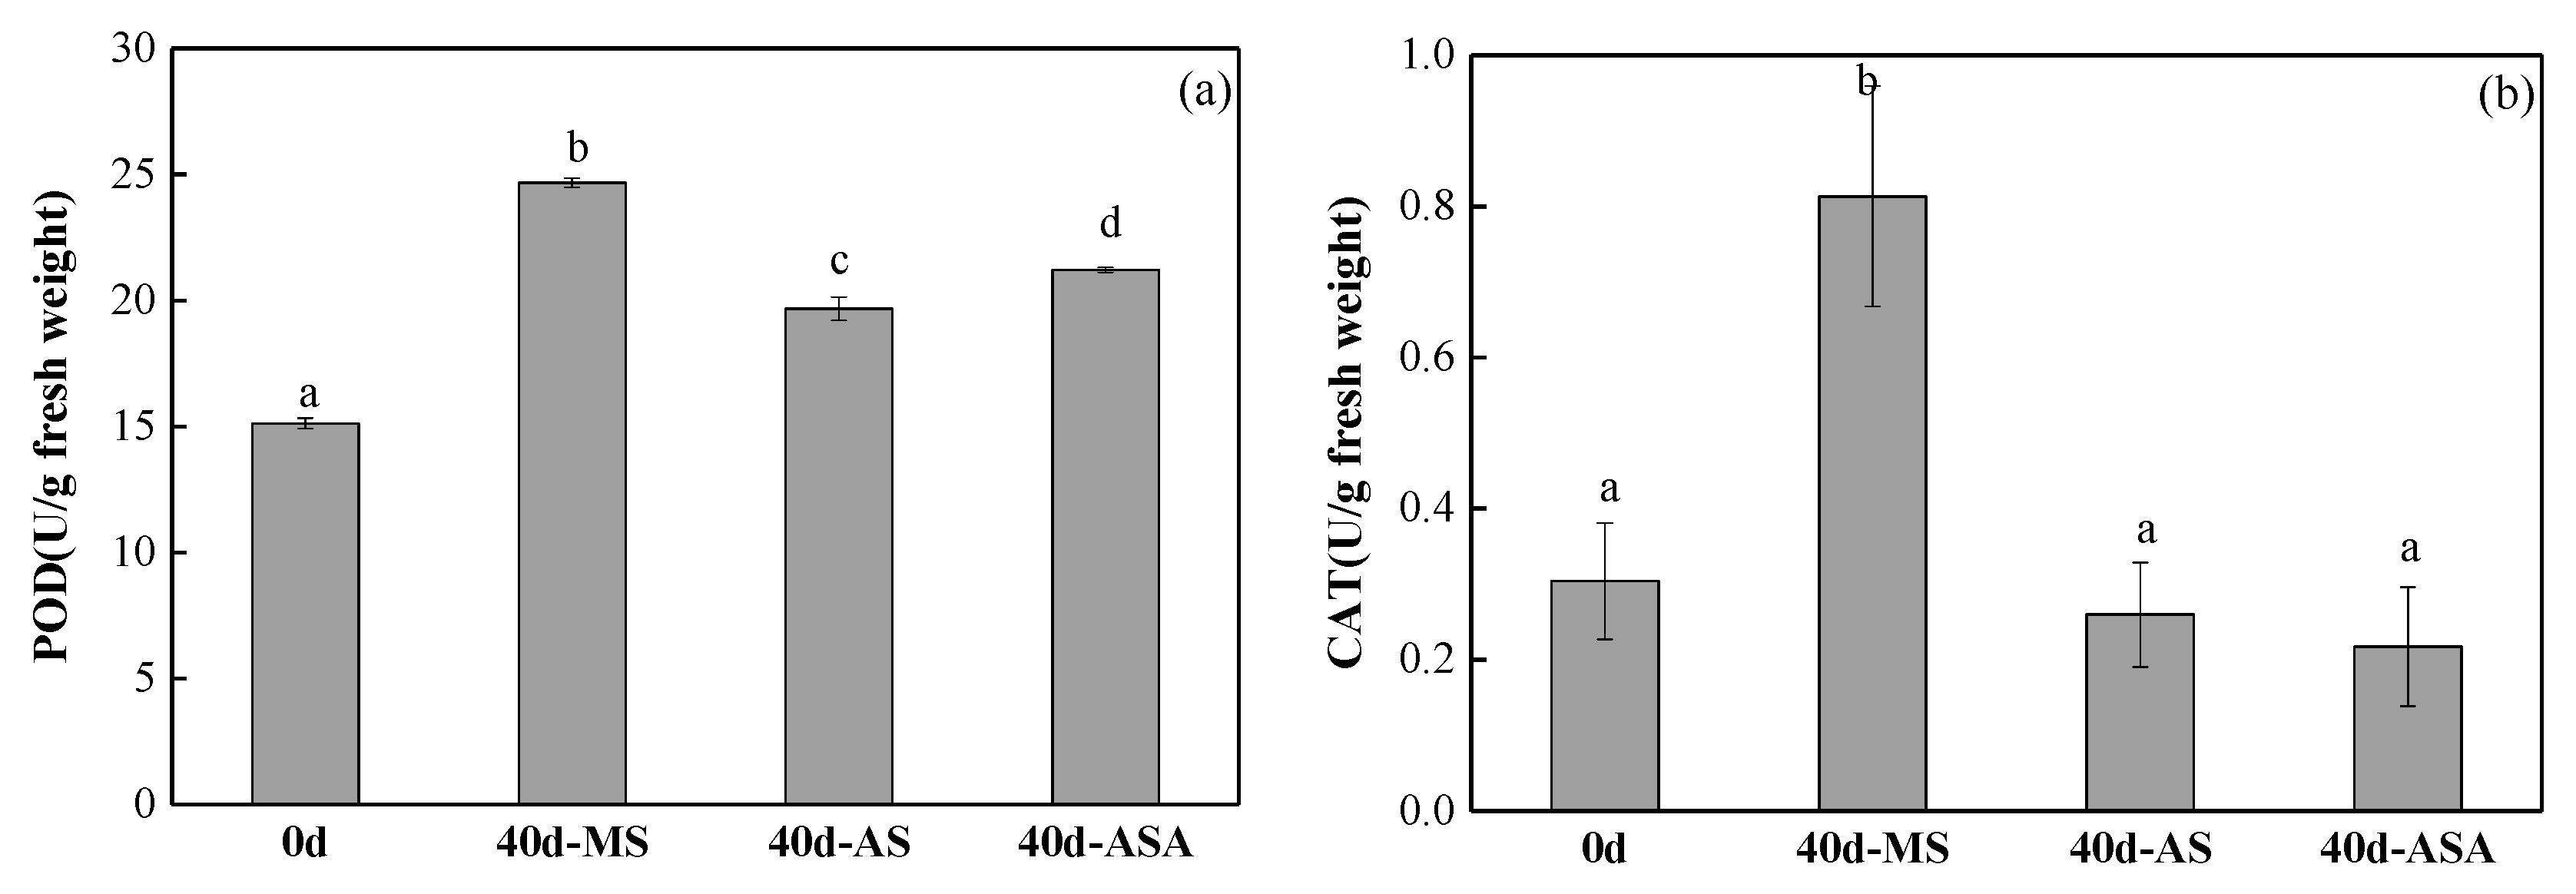
To investigate the impact of stress effect of the three revegetation methods on the plant, the antioxidant activity was monitored (Figure 6). Compared with the initial state, the enzyme activity of all the plants have been increased under different planting method, probably because the plants had some mechanical damage during the planting process. In MS, the concentrations of POD and CAT were significantly (p < 0.05) higher than that of AS and ASA. POD and CAT indicate plant regulation of its own protective system to eliminate harmful free radicals, which were also related to the reactive oxygen species (ROS) [35]. The mud in MS group was came from the sediment of Taihu lake, which had high nitrogen and phosphorus contents [36]. Studies have shown that increased nitrogen and phosphorus concentrations could lead to eutrophic stress, causing the enzyme activity to increase [37,38]. In addition, previous studies also showed that POD levels increased significantly after plants were mechanically damaged [39]. This study demonstrates that the damage to the anti-oxidation defense system caused by MS was greater than that of AS or ASA on V. natans, further confirming the superiority of agar cover on the growth of V. natans.

3.2. Effects of Distinct Revegetation Methods on the Results of Water Purification

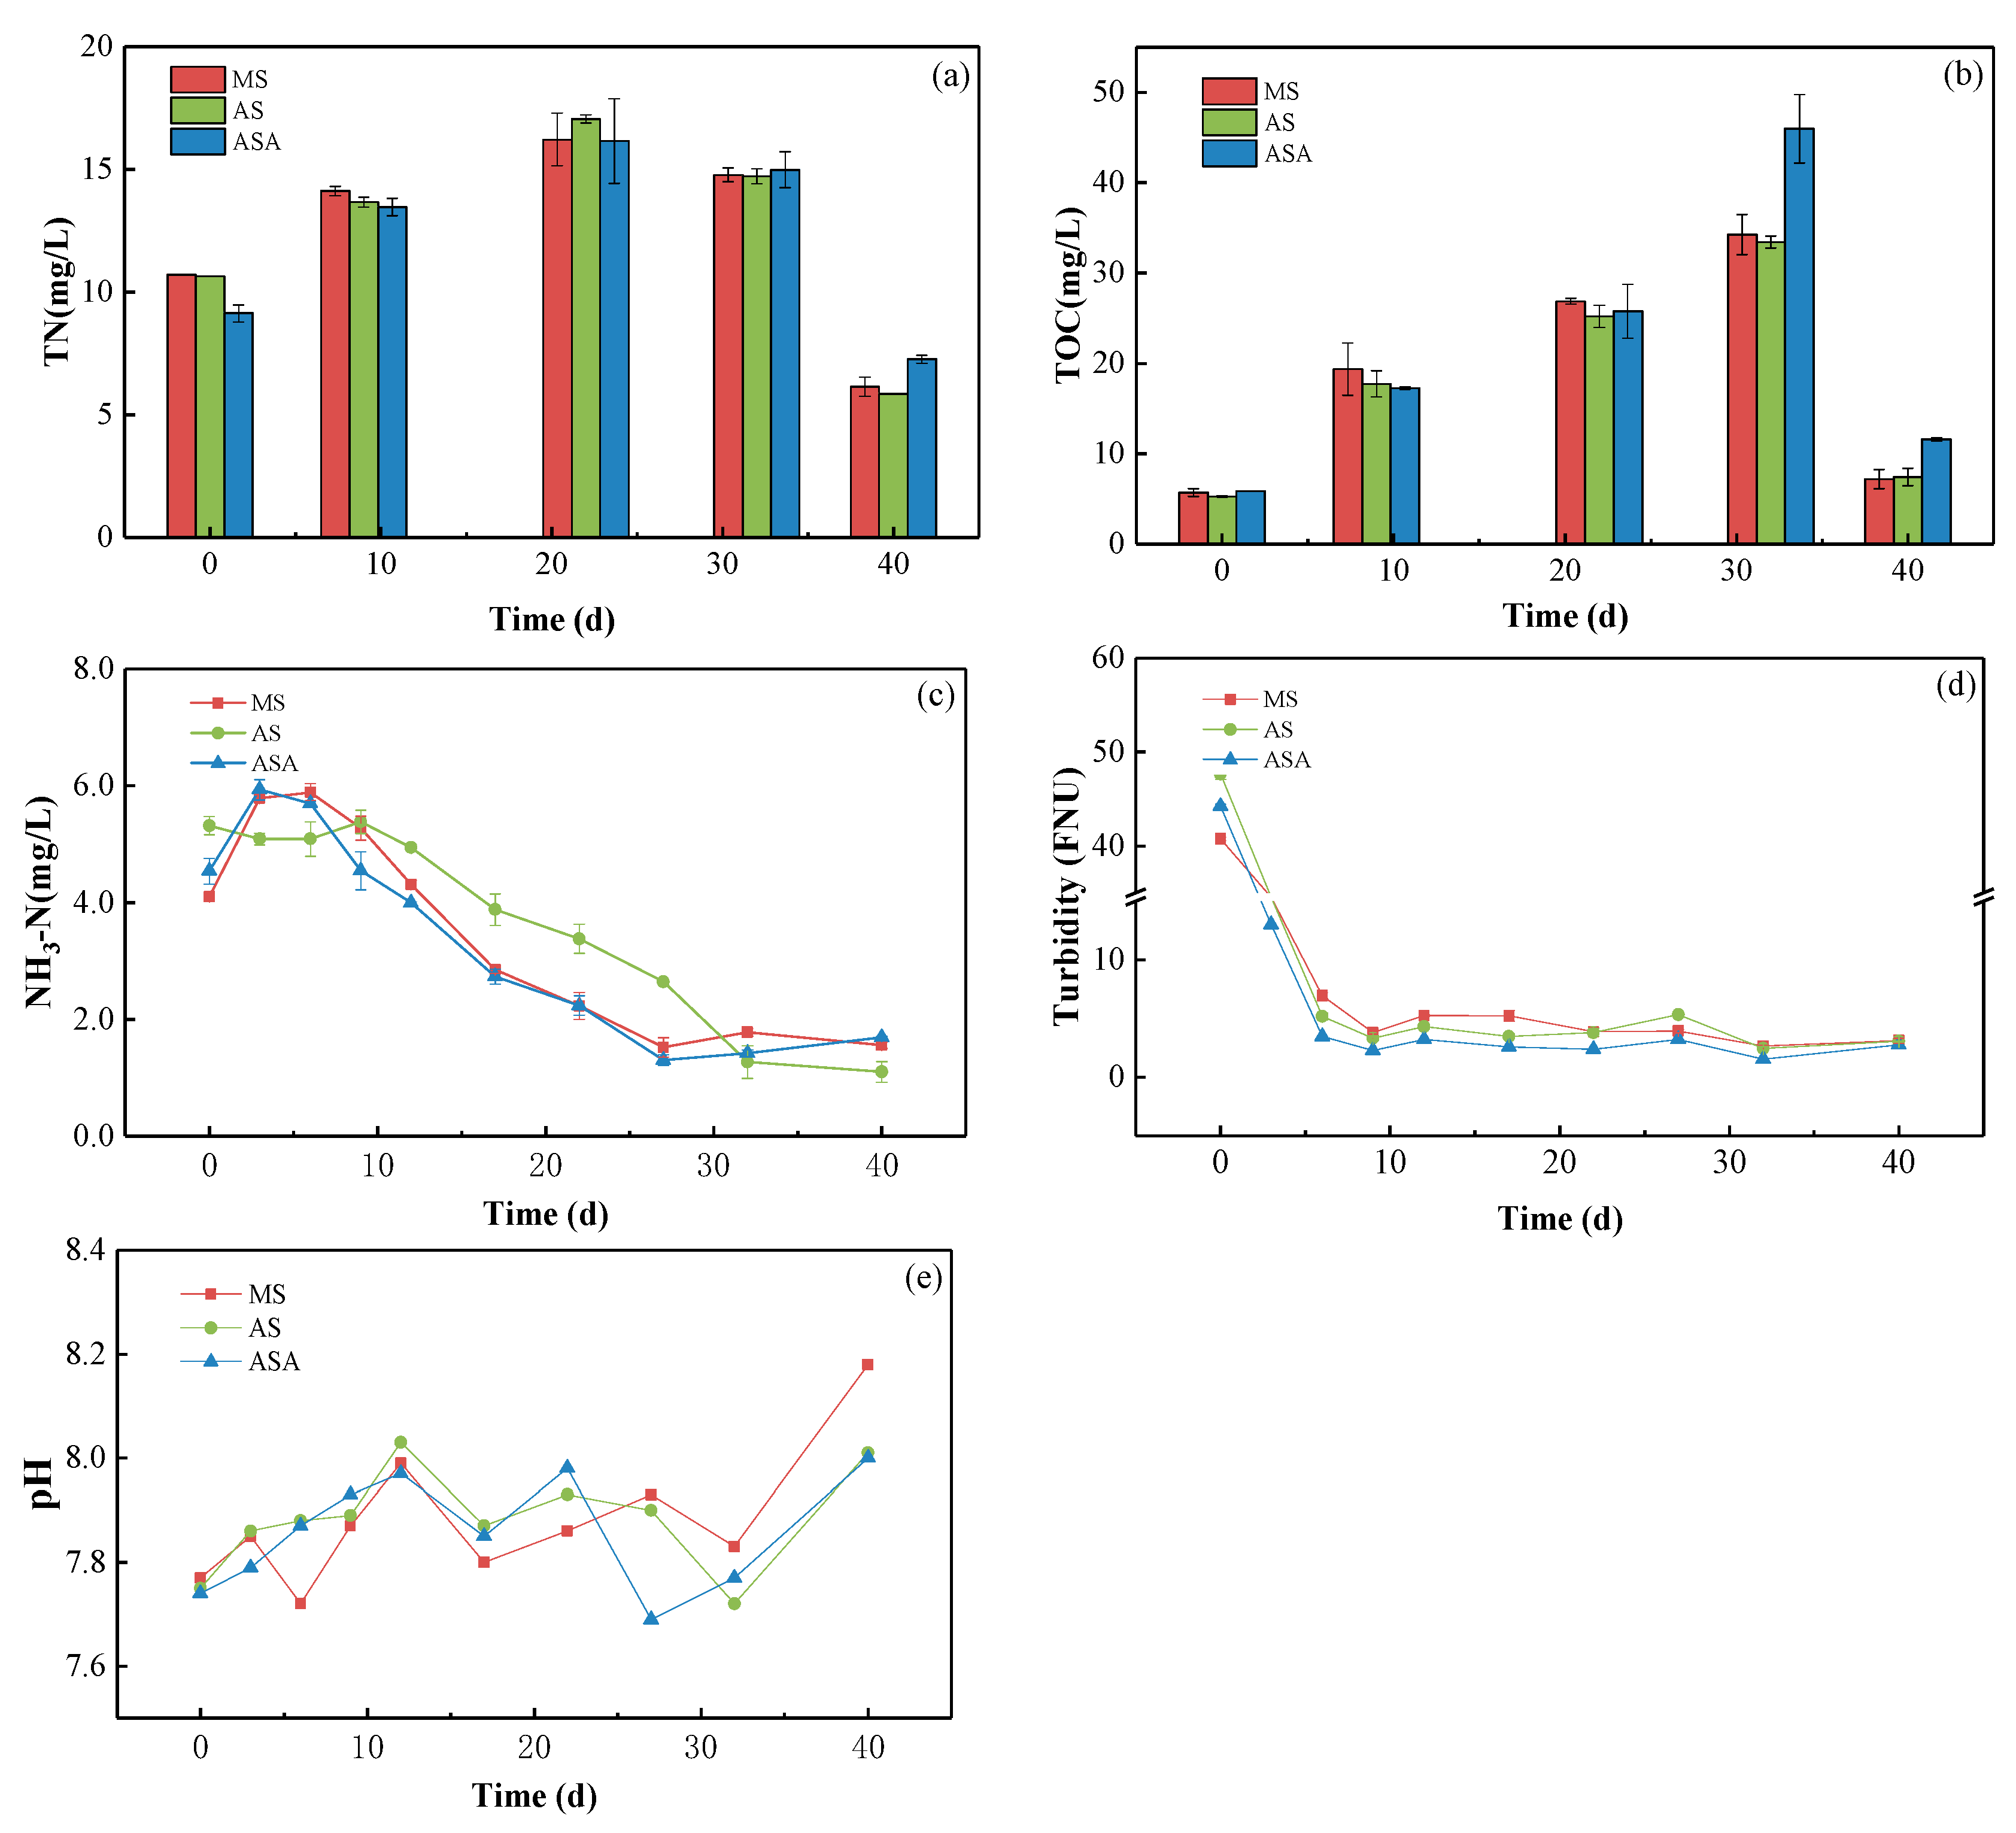
Changes in water quality parameters including TOC, TN, NH3-N, turbidity and pH are shown in Figure 7. Previous studies have shown that submerged plants significantly influence water purification processes [40,41,42]. This study revealed that the V. natans under the three planting methods has a significant (p < 0.05) purification effect on the water body, but there is no significant difference (p < 0.05) between the three planting methods thought t-test, indicating that the potential purification capacity of agar-based and mud-wrapped V. natans were similar. TOC (Figure 7b) concentration decreased through the removal by V. natans on water pollutants and promotion of organic matter released from sediment to overlying water. The purification effects of V. natans became more evident before 32 d, and in the late stage, growth was slower, causing much of the change in TOC. The tendency of TN (Figure 7a) was similar to TOC, but differed in the peak. Specifically, NH3-N (Figure 7c) increased in the first 3 d, and then continuously declined towards the end of the experiment since it is the form of nitrogen easiest to utilize [43,44].
pH was basically stable, only ranging from 7.74–8.18 (Figure 7e). The effects of V. natans on the water body were evident, particularly on turbidity (Figure 7d). At the initial stage of operation, the system was always disturbed by water intake, causing the sediment to be resuspended and the turbidity to reach 47.64 NTU followed by sharp decrease to 2 NTU within 12 d, and then stabilizing at about 2 NTU by the end of the experiment.

3.3. Effects of Distinct Revegetation Methods on the Microbial Properties of V. natans Root and Rhizosphere Soil

The structure and abundance of microbiota in the root and rhizosphere soil were studied using high throughput sequencing of 16S rRNA. At 97% similarity to cluster operational taxonomic units (OTU), a total of 34,1967 high-quality sequences were obtained, with the average length of the sequence at 420.74. All samples had high Good’s coverage indices, indicating that the sequencing results were reliable and representatives. Compared with the MS group, the AS and ASA groups had lower bacterial richness and diversity in their roots, and higher richness and diversity in their rhizosphere soils (Table 1). These results indicate that agar changed the local environmental in the soil but increased the microbial diversity of rhizosphere soil by inhibiting the exchange between the root system and the surrounding soil.
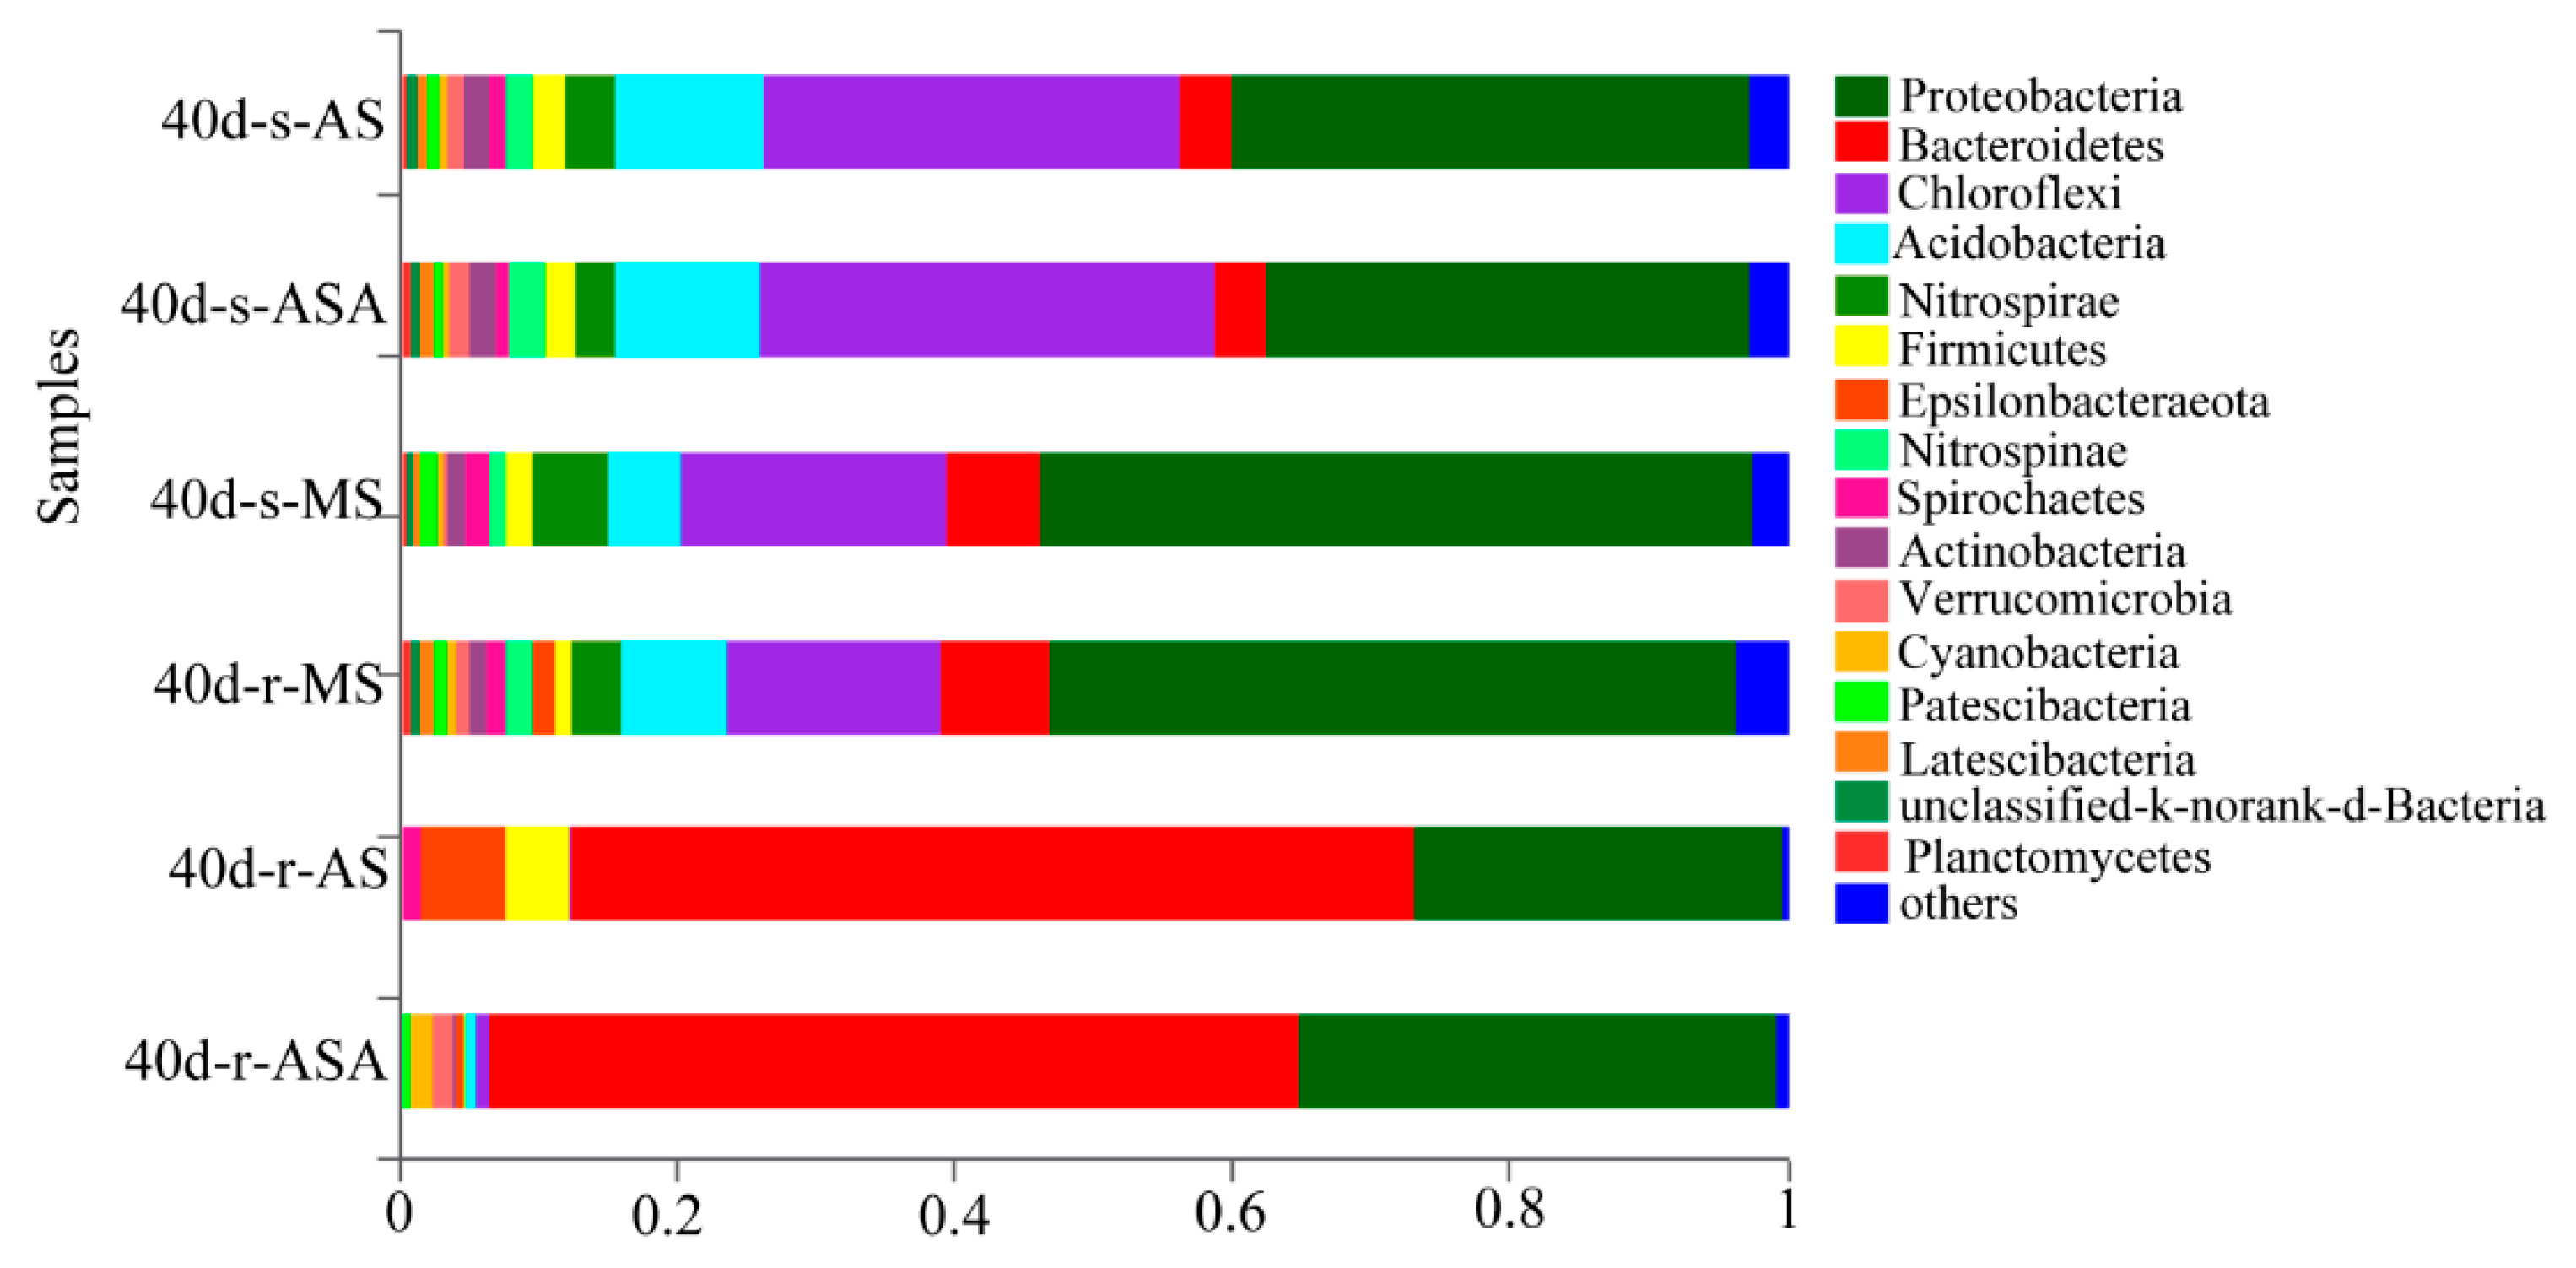
The bar plot (Figure 8) also clearly showed that the agar-based roots in group AS and ASA were dominated by Bacteroidetes (58.38–60.86%), while the root wrapped by mud had almost the same community as the rhizosphere soil, with Proteobacteria as the dominant taxa (49.59–51.48%). Previous results [45,46] showed that Proteobacteria and Chloroflexi both dominated in the sediment of eutrophic waters. In samples 40-s-AS and 40-s-ASA, microbial compositions were highly similar. The content of Chloroflexi (30.00–32.88%) and Proteobacteria (35.05–37.53%) in samples 40-s-AS and 40-s-ASA were more approximative than that in sample 40-s-MS, indicating that the addition of agar was more suitable for the survival of Chloroflexi [47,48]. In the agar-based group, Bacteroidetes was the dominant group. Studies have shown that the growth rate of Bacteroidetes on agar medium is faster, indicating that agar is more conducive for its growth [49].

3.4. Biofilm Attached to the Leaves of V. natans

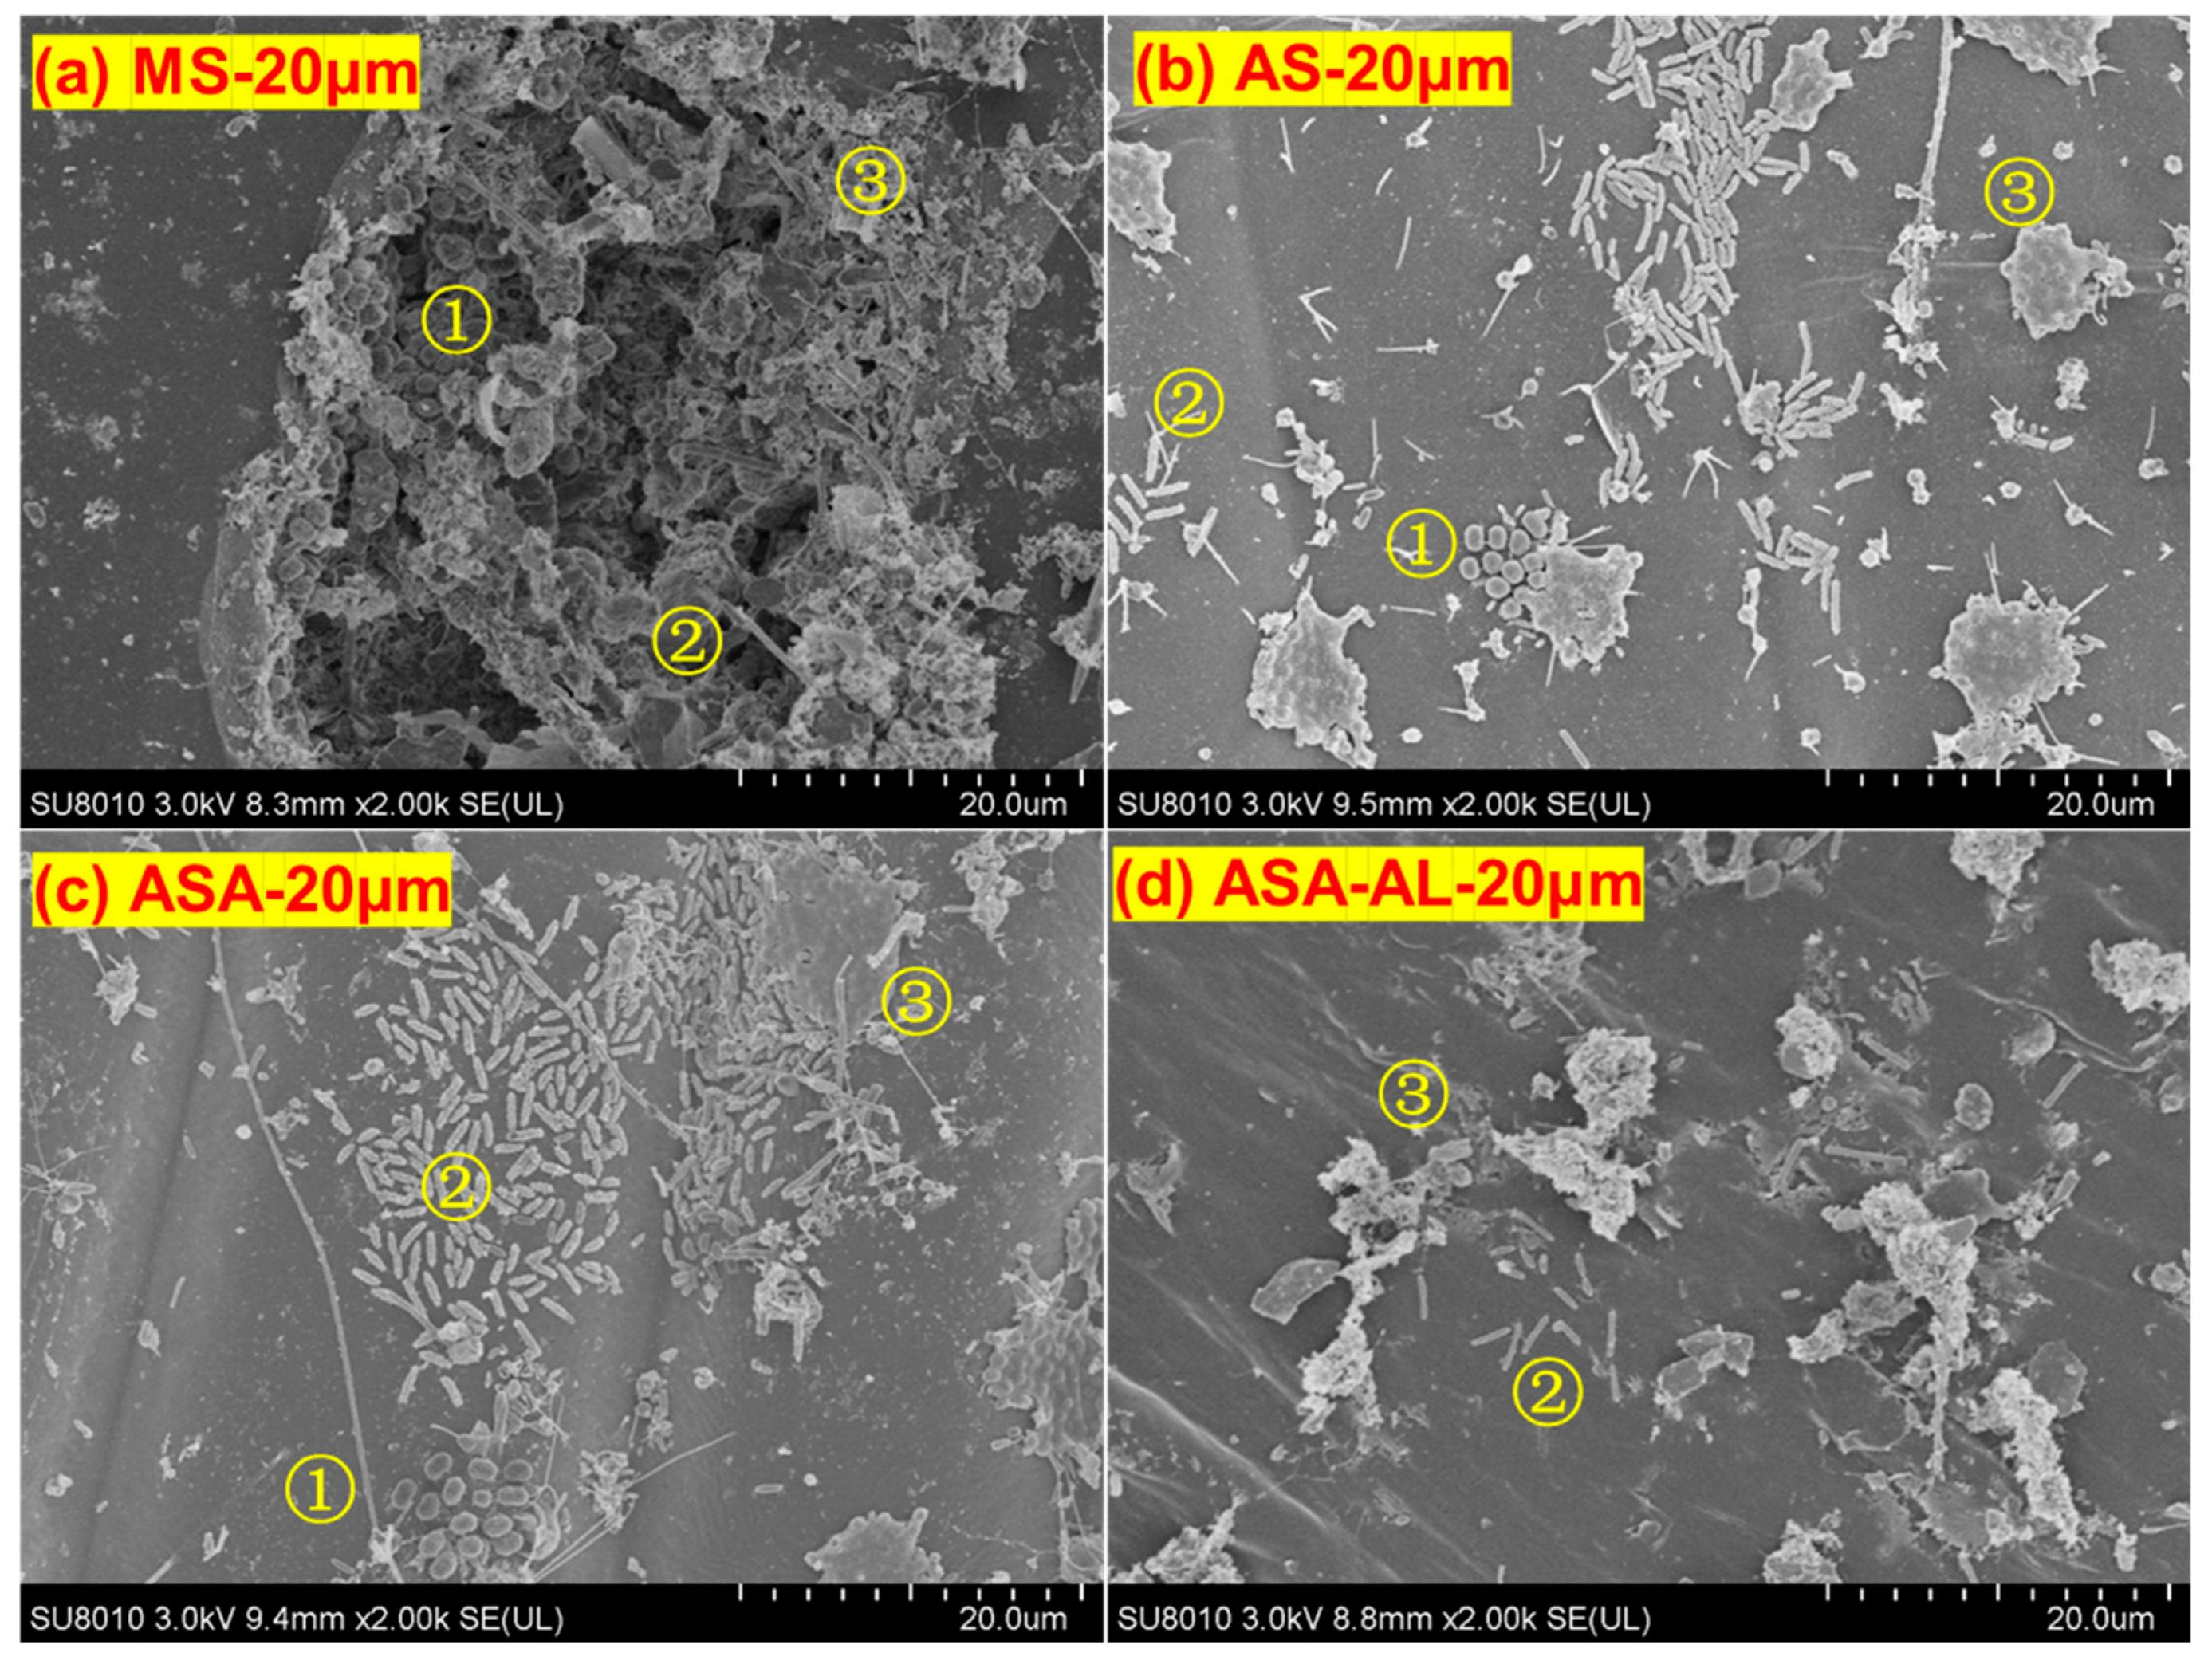
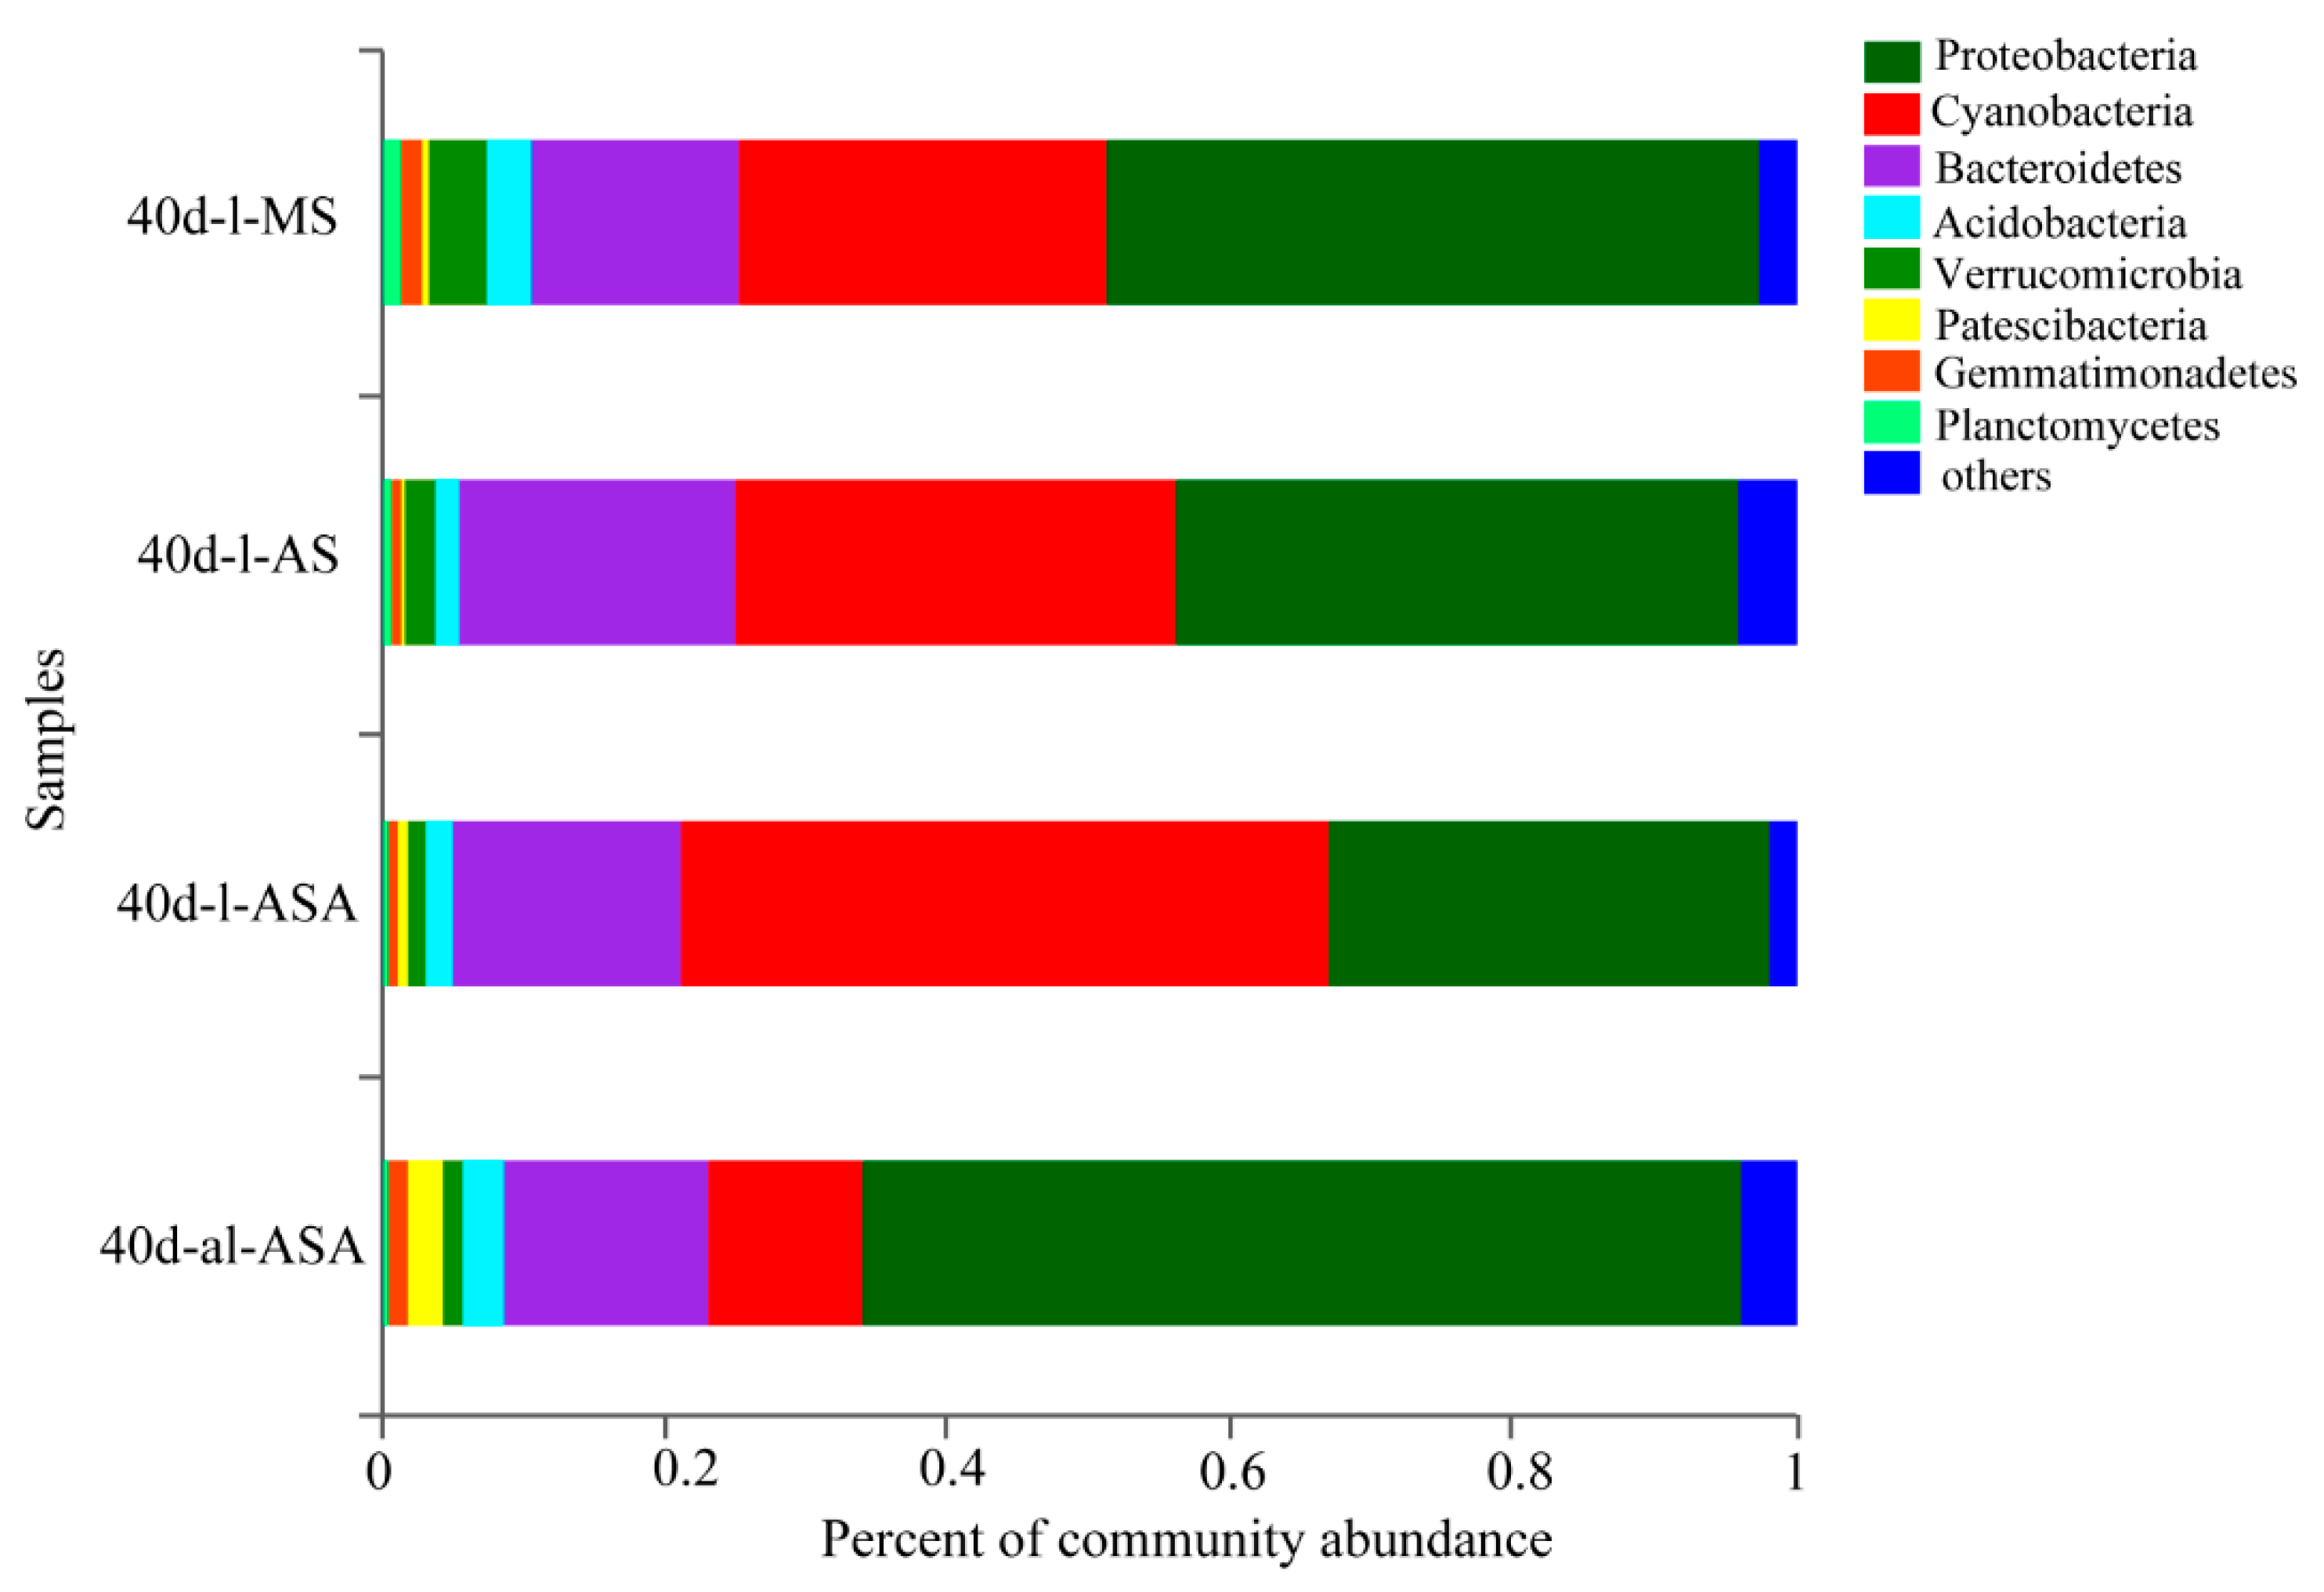
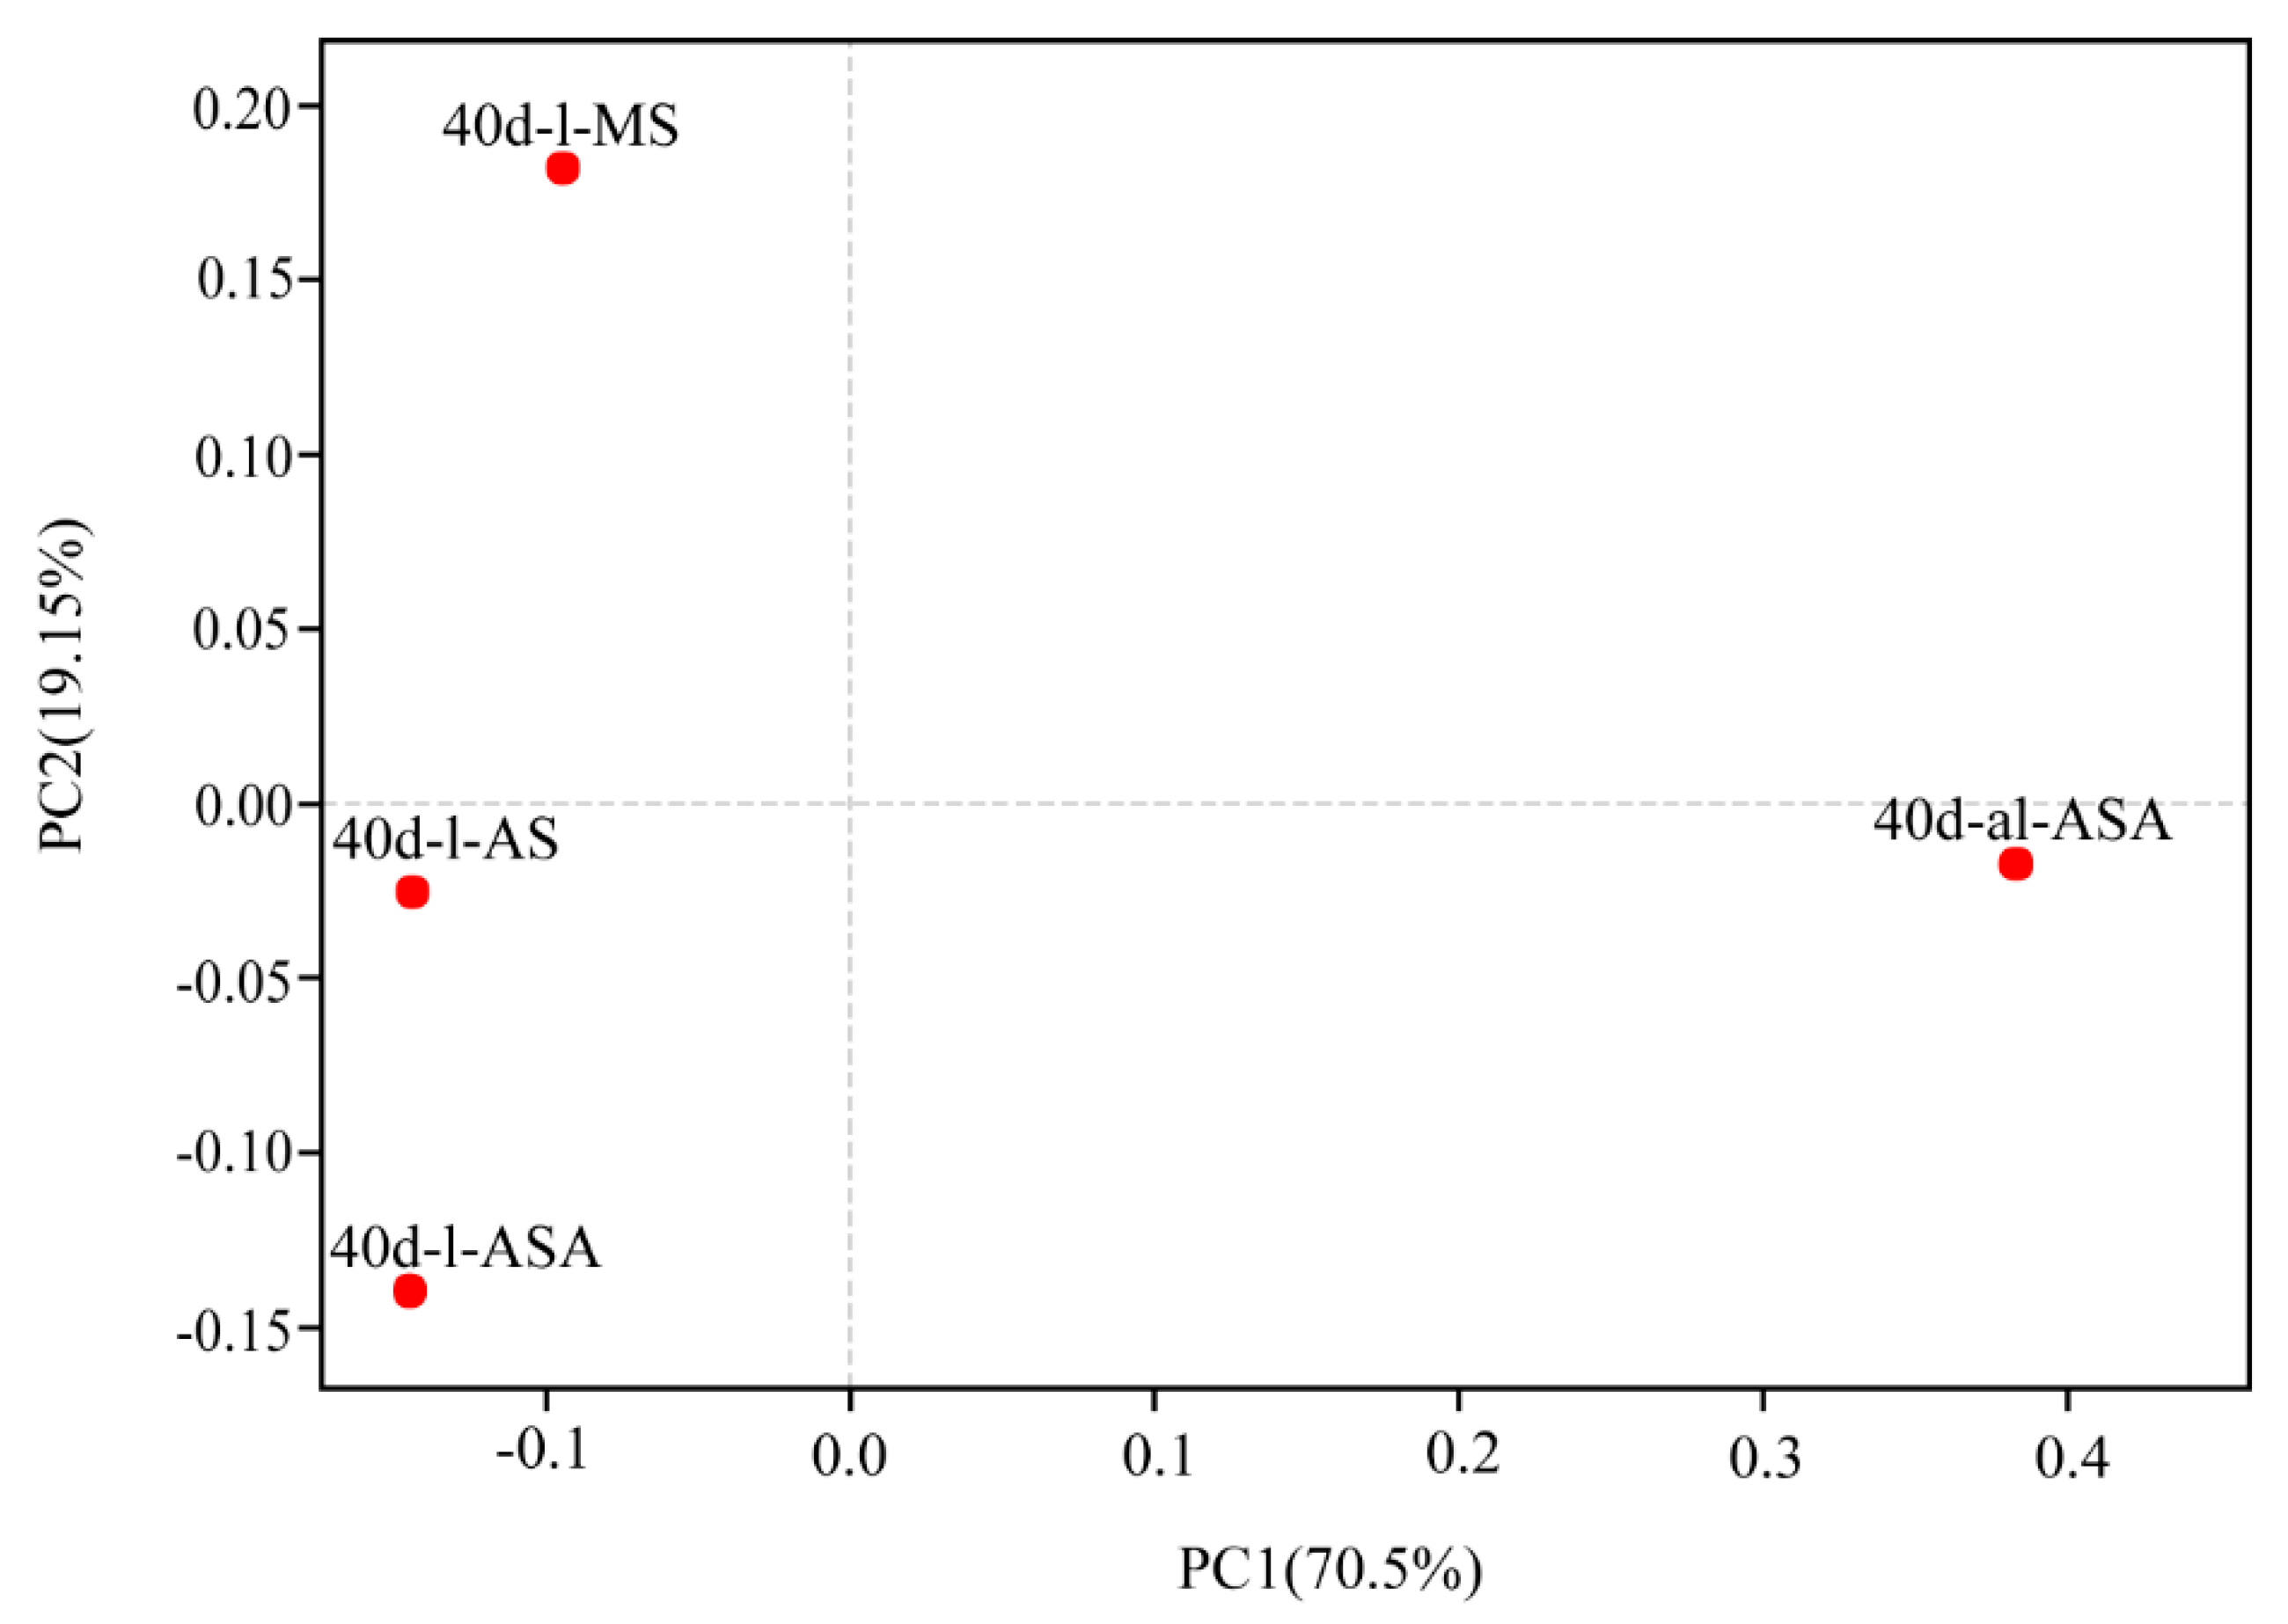
High throughput sequencing of 16S rRNA and scanning SEM were used to investigate the biofilm attached to the leaves of V. natans under three planting methods. Results showed that bacteria-like particles were distributed on the surface of the leaves such as cocci, bacilli and other forms of bacteria and organic matter. Biofilms were unevenly distributed on the leaf surface of MS, AS, ASA and artificial aquatic mat in ASA (ASA-AL) (Figure 9). The microbial distributions of AS and ASA were more similar. Cocci bacteria and organic matter were more commonly found in the MS group, while other samples in group AS and ASA were more found with bacilli. High-throughput sequencing results showed that the dominant microbes on the leaf surface were Proteobacteria, Cyanobacteria, and Bacteroides, which was consistent with previous studies [23]. Principal coordinates analysis (PCoA) and community bar plot analysis (Figure 10 and Figure 11) showed that the addition of agar certainly affected the surface microbes, with the most significant difference observed in the distribution of Proteobacteria and Cyanophyta on the surface of artificial aquatic mat and V. natans. This may due to the symbiotic and competitive relationships between the leaves of V. natans and the microbial community on the leaves. For example, the leaves provide the nutrients needed for the growth of Cyanophyta, and photosynthetic Cyanophyta can provide oxygen for V. natans. Proteobacteria are mostly anaerobic or facultative anaerobic bacteria, which grow more favorably in inorganic surfaces [50,51].

4. Conclusions

In this paper, the effects of three revegetation methods on the growth of V. natans, water purification effects, and changes in associated microbial communities were studied. Results showed that compared with the mud-wrapped method, the agar-based method effectively promoted plant growth and photosynthesis, and reduced physical damage to plants, with the antioxidant system stress response much lighter. In terms of water purification effects, the three planting methods differed little. Adding agar did not reduce water quality based on the variables we measured, but it did cause significant changes in the structure of microbial communities in the root, rhizosphere soil, and leaf surfaces. This study indicates that using agar to sink aquatic plants may improve plant performance over existing mud-sinking approaches, which may enhance restoration efforts in degraded aquatic ecosystems.

Author Contributions

Conceptualization, Z.Z. and J.Z.; methodology, N.W., Q.L. and W.Z.; software, H.Z.; validation, Z.Z. and J.Z.; formal analysis, N.W., M.J. and Z.H.; investigation, N.W.; resources, N.W.; data curation, N.W., Q.S.; writing—original draft preparation, N.W.; writing—review and editing, N.W.; visualization, N.W.; supervision, Z.Z. and J.Z.; project administration, Z.Z.; funding acquisition, Z.Z. All authors have read and agreed to the published version of the manuscript.

Funding

This work was supported by the Major Science and Technology Program for Water Pollution Control and Treatment (2017ZX07204005, 2012ZX07103004) and ABA Chemicals.

Conflicts of Interest

The authors declare no conflicts of interest.

References

  1. Scheffer, M.; Hosper, S.H.; Meijer, M.L.; Moss, B.; Jeppesen, E. Alternative equilibria in shallow lakes. Trends Ecol. Evol. 1993, 8, 275–279. [Google Scholar] [CrossRef]
  2. Tao, H.; Pan, J.Z.; Shen, Y.L.; Li, W.C.; Huang, F.; Zhao, H.G. Phosphorus threshold for the shift between grass-and algae-stable states in Dahong Harbor of Gehu Lake. J. Appl. Ecol. 2012, 23, 264. [Google Scholar]
  3. Cronin, G.; Lodge, D.M. Effects of light and nutrient availability on the growth, allocation, carbon/nitrogen balance, phenolic chemistry, and resistance to herbivory of two freshwater macrophytes. Oecologia 2003, 137, 32–41. [Google Scholar] [CrossRef] [PubMed]
  4. Hilt, S.; Gross, E.M.; Hupfer, M.; Morscheid, H.; Mählmann, J.; Melzer, A.; Poltz, J.; Sandrock, S.; Scharf, E.-M.; Schneider, S. Restoration of submerged vegetation in shallow eutrophic lakes–A guideline and state of the art in Germany. Limnologica 2006, 36, 155–171. [Google Scholar] [CrossRef] [Green Version]
  5. Zhou, Y.W.; Zhou, X.H.; Han, R.M.; Xu, X.G.; Wang, G.X.; Liu, X.S.; Bi, F.Z.; Feng, D.Y. Reproduction capacity of Potamogeton crispus fragments and its role in water purification and algae inhibition in eutrophic lakes. Sci. Total Environ. 2017, 580, 1421–1428. [Google Scholar] [CrossRef] [PubMed]
  6. Han, J.S. Research Status of Water Pollution Control by Aquatic Plants. Heilongjiang Agric. Sci. 2018, 8, 148–149. [Google Scholar]
  7. Xia, H.; Kong, W.; Wang, M.; Zongxue, X.U.; Yin, X.; Xuesen, L.I. Community structure and biotic integrity of aquatic plants along the North Canal in Beijing. Chin. J. Appl. Environ. Biol. 2018, 24, 260–268. [Google Scholar]
  8. Gulati, R.D.; Donk, E.V. Lakes in the Netherlands, their origin, eutrophication and restoration: State-of-the-art review. Hydrobiologia 2002, 478, 73–106. [Google Scholar] [CrossRef]
  9. Egertson, C.J.; Kopaska, J.A.; Downing, J.A. A Century of Change in Macrophyte Abundance and Composition in Response to Agricultural Eutrophication. Hydrobiologia 2004, 524, 145–156. [Google Scholar] [CrossRef]
  10. Han, T.; Zhang, H.; Hu, W.; Deng, J.; Zhu, G. Research on self-purification capacity of Lake Taihu. Environ. Sci. Pollut. Res. 2015, 22, 8201–8215. [Google Scholar] [CrossRef]
  11. Addisie, Y.; Medellin, A.C. Allelopathy in aquatic macrophytes: Effects on growth and physiology of phytoplankton. Afr. J. Plant Sci. 2012, 6, 270–276. [Google Scholar]
  12. Yi, Y.; Jie, S.; Yang, Y.; Yang, Z.; Tang, C.; Xuan, W.; Yang, Z. Habitat suitability evaluation of a benthic macroinvertebrate community in a shallow lake. Ecol. Indic. 2018, 90, 451–459. [Google Scholar] [CrossRef]
  13. Jeppesen, E.; Jensen, J.P.; Søndergaard, M.; Lauridsen, T.; Jensen, L. Top-down control in freshwater lakes: The role of nutrient state, submerged macrophytes and water depth. Hydrobiologia 1997, 342–343, 151–164. [Google Scholar] [CrossRef]
  14. Ciurli, A.; Zuccarini, P.; Alpi, A. Growth and nutrient absorption of two submerged aquatic macrophytes in mesocosms, for reinsertion in a eutrophicated shallow lake. Wetl. Ecol. Manag. 2009, 17, 107–115. [Google Scholar] [CrossRef]
  15. Duarte, C.M.; Kalff, J. Influence of Lake Morphometry on the Response of Submerged Macrophytes to Sediment Fertilization. Can. J. Fish. Aquat. Sci. 2011, 45, 216–221. [Google Scholar] [CrossRef]
  16. Cao, Y.; Li, W.; Jeppesen, E. The response of two submerged macrophytes and periphyton to elevated temperatures in the presence and absence of snails: A microcosm approach. Hydrobiologia 2014, 738, 49–59. [Google Scholar] [CrossRef]
  17. Perrow, M.R.; Moss, B.; Stansfield, J. Trophic interactions in a shallow lake following a reduction in nutrient loading: A long-term study. Hydrobiologia 1994, 275–276, 43–52. [Google Scholar] [CrossRef]
  18. Hosper, S.H. Stable states, buffers and switches: An ecosystem approach to the restoration and management of shallow lakes in the Netherlands. Water Sci. Technol. 1998, 37, 151–164. [Google Scholar] [CrossRef]
  19. Rodrigo, M.A.; Rojo, C.; Alonso-Guillén, J.L.; Vera, P. Restoration of two small Mediterranean lagoons: The dynamics of submerged macrophytes and factors that affect the success of revegetation. Ecol. Eng. 2013, 54, 1–15. [Google Scholar] [CrossRef]
  20. Zhang, C.; Feng, H.E.; Gao, X.H.; Kong, L.W.; Shenghua, H.U.; Xia, S.B.; Zhenbin, W.U. Restoration Efficiency of Submerged Macrophytes with Three Planting Patterns. Bull. Bot. Res. 2012, 32, 603–608. [Google Scholar]
  21. Stein, H.; Kellermann, C.; Schmidt, S.I.; Brielmann, H.; Griebler, C. The potential use of fauna and bacteria as ecological indicators for the assessment of groundwater quality. J. Environ. Monit. 2010, 12, 242–254. [Google Scholar] [CrossRef] [PubMed]
  22. Dudley, N.; Bhagwat, S.A.; Harris, J.; Maginnis, S.; Moreno, J.G.; Mueller, G.M.; Oldfield, S.; Walters, G. Measuring progress in status of land under forest landscape restoration using abiotic and biotic indicators. Restor. Ecol. 2018, 26, 5–12. [Google Scholar] [CrossRef] [Green Version]
  23. Dan, H.; Lijuan, R.; Qinglong, W. Epiphytic bacterial communities on two common submerged macrophytes in Taihu Lake: Diversity and host-specificity. Chin. J. of Oceanol. Limnol. 2012, 30, 237–247. [Google Scholar]
  24. Wang, S.; Zhang, Y.; Zeng, L.; Liu, B.; Wu, Z.; He, F. Effects of different planting methods on the growth of Vallisneria natans (Lour) Hara in dynamic and static water environments. Plant Sci. J. 2017, 35, 691–698. [Google Scholar]
  25. Ke, X.; Li, W. Germination Requirement of Vallisneria natans Seeds: Implications for Restoration in Chinese Lakes. Hydrobiologia 2006, 559, 357–362. [Google Scholar] [CrossRef]
  26. Barbiero, R.P. A multi-lake comparison of epilithic diatom communities on natural and artificial substrates. Hydrobiologia 2000, 438, 157–170. [Google Scholar] [CrossRef]
  27. García, A.L.; Nicolas, N. Influence of the Degree of Solvent Impurity on the Spectrophotometric Determination of Chlorophylls in 80% Aqueous Acetone and Dimethyl formamide. Application to Non-Abrasive Extraction of Leaves of Citrus Aurantium. Photosynthetica 1998, 35, 545–550. [Google Scholar] [CrossRef]
  28. Demmig, B. Comparison of the excessive light on chlorophyll fluorecence(77K) and photon yield of O2 evolution in higher plants. Planta 1987, 171, 171–184. [Google Scholar] [CrossRef]
  29. Clesceri, L.S.; Greenberg, A.E.; Eaton, A.D. Standard Methods for the Examination of Water and Wastewater, American Public Health Association; American Public Health Association: Washington, DC, USA, 2005. [Google Scholar]
  30. Jiang, M.; Zhou, Y.; Ji, X.; Li, H.; Zheng, Z.; Zhang, J. Responses of leaf-associated biofilms on the submerged macrophyte Vallisneria natans during harmful algal blooms. Environ. Pollut. 2019, 246, 819–826. [Google Scholar] [CrossRef]
  31. Bulgarelli, D.; Rott, M.; Schlaeppi, K.; Ver Loren van Themaat, E.; Ahmadinejad, N.; Assenza, F.; Rauf, P.; Huettel, B.; Reinhardt, R.; Schmelzer, E.; et al. Revealing structure and assembly cues for Arabidopsis root-inhabiting bacterial microbiota. Nature 2012, 488, 91–95. [Google Scholar] [CrossRef]
  32. Niemi, R.M.; Heiskanen, I.; Wallenius, K.; Lindstrom, K. Extraction and purification of DNA in rhizosphere soil samples for PCR-DGGE analysis of bacterial consortia. J. Microbiol. Methods 2001, 45, 155–165. [Google Scholar] [CrossRef]
  33. Li, Q.; Gu, P.; Ji, X.Y.; Li, H.M.; Zhang, J.B.; Zheng, Z. Response of submerged macrophytes and periphyton biofilm to water flow in eutrophic environment: Plant structural, physicochemical and microbial properties. Ecotoxicol. Environ. Saf. 2020, 189, 109990. [Google Scholar] [CrossRef] [PubMed]
  34. Bécel, C.; Vercambre, G.; Pagès, L. Soil penetration resistance, a suitable soil property to account for variations in root elongation and branching. Plant Soil 2011, 353, 169–180. [Google Scholar] [CrossRef]
  35. Gong, L.; Zhang, S.; Chen, D.; Liu, K.; Lu, J. Response of biofilms-leaves of two submerged macrophytes to high ammonium. Chemosphere 2018, 192, 152–160. [Google Scholar] [CrossRef]
  36. Zhao, X.; Yang, L.; Yin, D.; Wang, R.; Lu, X.; Qin, B. Vertical distribution of physicochemical characteristics and the microbial diversity in different spatial sediments samples in Lake Taihu. Environ. Sci. 2008, 29, 3537–3545. [Google Scholar]
  37. Best, E.P.H. Effects of nitrogen on the growth and nitrogenous compounds of Ceratophyllum demersum. Aquat. Bot. 1980, 8, 197–206. [Google Scholar] [CrossRef]
  38. Xie, Y.; An, S.; Wu, B. Resource allocation in the submerged plant Vallisneria natans related to sediment type, rather than water-column nutrients. Freshw. Biol. 2005, 50, 391–402. [Google Scholar] [CrossRef]
  39. Diaz-De-Leon, F.; Klotz, K.L.; Lagrimini, L.M. Nucleotide Sequence of the Tobacco (Nicotiana tabacum) Anionic Peroxidase Gene. Plant Physiol. 1993, 101, 1117–1118. [Google Scholar] [CrossRef] [Green Version]
  40. Hilt, S.; Gross, E.M. Can allelopathically active submerged macrophytes stabilise clear-water states in shallow lakes? Basic Appl. Ecol. 2008, 9, 422–432. [Google Scholar] [CrossRef] [Green Version]
  41. Dhote, S.; Dixit, S. Water quality improvement through macrophytes—A review. Environ. Monit. Assess. 2009, 152, 149–153. [Google Scholar] [CrossRef]
  42. Dai, Y.; Jia, C.; Liang, W.; Hu, S.; Wu, Z. Effects of the submerged macrophyte Ceratophyllum demersum L. on restoration of a eutrophic waterbody and its optimal coverage. Ecol. Eng. 2012, 40, 113–116. [Google Scholar] [CrossRef]
  43. Ozimek, T.; Donk, E.; Gulati, R.D. Growth and nutrient uptake by two species of Elodea in experimental. Hydrobiologia 1993, 251, 13–18. [Google Scholar] [CrossRef] [Green Version]
  44. Nayar, S.; Collings, G.J.; Miller, D.J.; Bryars, S.; Cheshire, A.C. Uptake and resource allocation of ammonium and nitrate in temperate seagrasses Posidonia and Amphibolis. Mar. Pollut. Bull. 2010, 60, 1502–1511. [Google Scholar] [CrossRef] [PubMed]
  45. Niu, Y.; Shen, H.; Chen, J.; Xie, P.; Yang, X.; Tao, M.; Ma, Z.; Qi, M. Phytoplankton community succession shaping bacterioplankton community composition in Lake Taihu, China. Water Res. 2011, 45, 4169–4182. [Google Scholar] [CrossRef]
  46. Bai, Y.; Shi, Q.; Wen, D.; Li, Z.; Jefferson, W.A.; Feng, C.; Tang, X. Bacterial communities in the sediments of Dianchi Lake, a partitioned eutrophic waterbody in China. PLoS ONE 2012, 7, e37796. [Google Scholar] [CrossRef] [Green Version]
  47. Stratton, C.W.; Weeks, L.S.; Aldridge, K.E. Comparison of kill-kinetic studies with agar and broth microdilution methods for determination of antimicrobial activity of selected agents against members of the Bacteroides fragilis group. J. Clin. Microbiol. 1987, 4, 645–649. [Google Scholar] [CrossRef] [Green Version]
  48. Beena, V.K.; Rao, S.; Kotian, M.; Shivananda, P.G. Fish meal extract bile esculin agar (FMBE) a selective medium for Bacteroides fragilis group. Indian J. Pathol. Microbiol. 1997, 3, 361–364. [Google Scholar]
  49. Brook, I. Growth of Bacteroides fragilis group in agar and broth media. J. Appl. Bacteriol. 1990, 5, 697–700. [Google Scholar] [CrossRef]
  50. Nayar, S.; Goh, B.P.L.; Chou, L.M. Settlement of marine periphytic algae in a tropical estuary. Estuar. Coast. Shelf Sci. 2005, 64, 241–248. [Google Scholar] [CrossRef]
  51. James, C.S.; Eaton, J.W.; Hardwick, K. Responses of three invasive aquatic macrophytes to nutrient enrichment do not explain their observed field displacements. Aquat. Bot. 2006, 84, 347–353. [Google Scholar] [CrossRef]
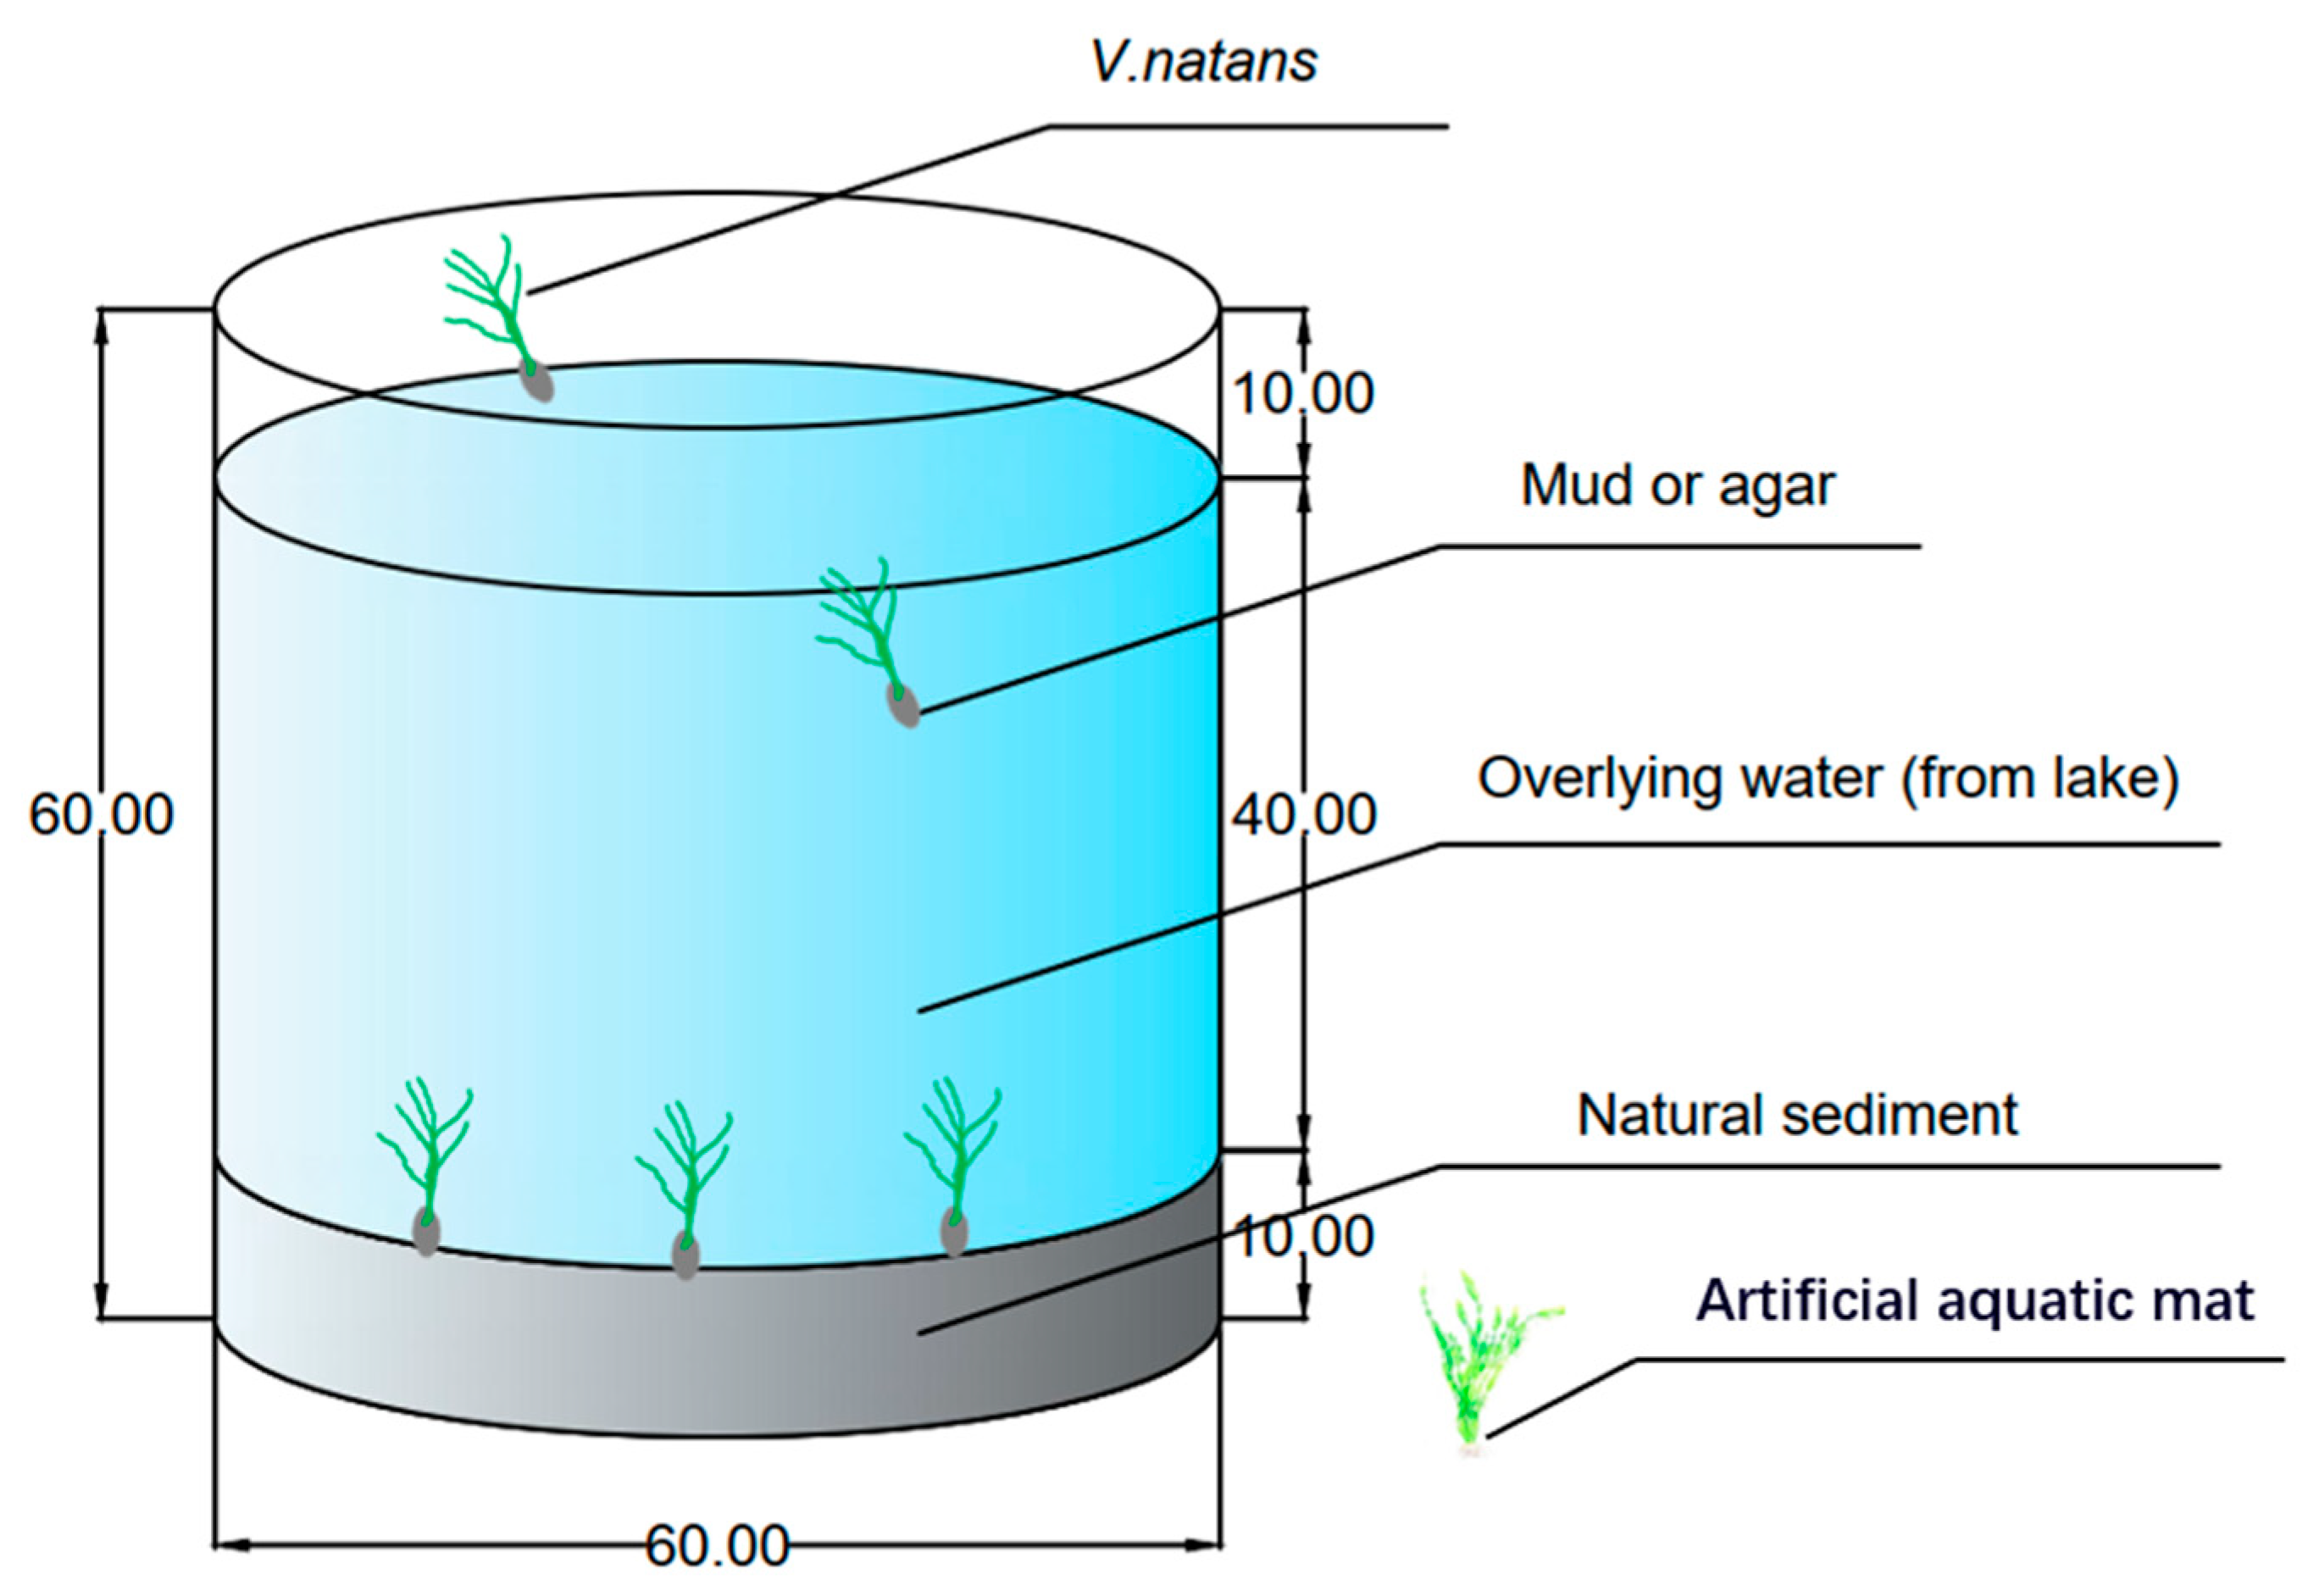
Figure 1. Schematic diagram of the experimental unit (cm).
Water 12 01294 g001
Figure 2. Experimental units for V. natans plants transplanted. Notes: (a) is mud-sinking method (MS); (b) is agar gel-sinking method (AS); (c) is agar gel-sinking with artificial aquatic mat method (ASA).
Water 12 01294 g002
Figure 3. Effects of the different revegetation methods on the growth of V. natans.
Water 12 01294 g003
Figure 4. Change in V. natans Fv/Fm ratios in MS, AS and ASA groups. Notes: The shaded area indicates error range.
Water 12 01294 g004
Figure 5. Total chlorophyll content of V. natans in MS, AS and ASA groups.
Water 12 01294 g005
Figure 6. Enzyme activity of V. natans in MS, AS and ASA groups.
Water 12 01294 g006
Figure 7. Changes in water quality parameters in MS, AS and ASA groups.
Water 12 01294 g007
Figure 8. Bar plot of the bacterial community in the rhizosphere soil and root at the phylum level. (Notes: 40d-s-AS is rhizosphere soil of the last day in group AS, 40d-s-ASA is rhizosphere soil of the last day in group ASA, 40d-s-MS is rhizosphere soil of the last day in group MS, 40d-r-MS is root of the last day in group MS, 40d-r-AS is root of the last day in group AS, 40d-r-ASA is root of the last day in group ASA.).
Water 12 01294 g008
Figure 9. Scanning Electron Microscopy (SEM) images (ad) of biofilms attached to V. natans leaves. (Notes: ①, cocci aggregates; ②, bacillus aggregates; ③, organic matter or extracellular polymers.).
Water 12 01294 g009
Figure 10. Community bar plot analysis of leaves on phylum level. (Notes: 40d-l-MS is leaf of the last day in group MS, 40d-l-AS is leaf of the last day in group AS, 40d-l-ASA is leaf of the last day in group ASA, 40d-al-ASA is artificial aquatic mat leaf of the last day in group ASA.).
Water 12 01294 g010
Figure 11. PCoA plot of bacterial communities on the leaves of V. natans on phylum level. (Notes: 40d-l-MS is leaf of the last day in group MS, 40d-l-AS is leaf of the last day in group AS, 40d-l-ASA is leaf of the last day in group ASA, 40d-al-ASA is artificial aquatic mat leaf of the last day in group ASA.).
Water 12 01294 g011
Table 1. Summary of the indices of community richness and diversity of bacterial taxa in MS, AS and ASA groups.
SamplesAceChaoCoverageShannonSimpsonSobs
40d-s-MS3168.893083.750.976.080.0112400.00
40d-s-AS3341.263252.700.986.240.0072572.00
40d-s-ASA3351.643326.660.976.240.0072564.00
40d-r-MS3747.643750.710.976.540.0052912.00
40d-r-AS934.22781.220.992.630.313576.00
40d-r-ASA1648.571457.830.993.510.1761037.00
Notes: 40d-s-AS is rhizosphere soil of the last day in group AS, 40d-s-ASA is rhizosphere soil of the last day in group ASA, 40d-s-MS is rhizosphere soil of the last day in group MS, 40d-r-MS is root of the last day in group MS, 40d-r-AS is root of the last day in group AS, 40d-r-ASA is root of the last day in group ASA.