Article

Energy Dissipation of Type a Piano Key Weirs

by
Kam R. Eslinger
and
Brian M. Crookston
*
Department Civil and Environmental Engineering, Utah Water Research Laboratory, Utah State University, Logan, UT 84322, USA
*
Author to whom correspondence should be addressed.
Water 2020, 12(5), 1253; https://doi.org/10.3390/w12051253
Submission received: 3 April 2020 / Revised: 24 April 2020 / Accepted: 24 April 2020 / Published: 28 April 2020
(This article belongs to the Section Hydraulics and Hydrodynamics)

Abstract

:
A Piano Key weir (PK weir) is a nonlinear, labyrinth-type weir well suited for rehabilitation projects due to a relatively small footprint and the ability to pass large discharges for lesser upstream-head values when compared with other weir types. A critical component of a hydraulic structure is the energy-dissipative properties. Currently, information and guidance is limited, with previous energy dissipation studies of PK weirs primarily of specific projects. Therefore, to document and quantify energy dissipation, four laboratory-scale Type A PK weir models with different width ratios (Wi/Wo) were studied, with 255 tests comprising this new dataset, along with detailed observations of the flow field. Results were compared to existing published data regarding energy dissipation downstream of trapezoidal and rectangular labyrinth weirs. To support design efforts, two equations, both functions of head-water ratio (H/P) and Wi/Wo, are proposed to predict the relative residual energy downstream of PK weirs. The energy dissipation of PK weirs is largest at low flows and decreases in a logarithmic-like manner as flow increases. PK weirs with increased hydraulic efficiency, caused by an increase in Wi/Wo, resulted in slightly smaller energy dissipation values within the range 0.2 ≤ H/P ≤ 0.8. The energy dissipation of PK weirs was found to be relatively constant, independent of Wi/Wo, and in the ranges 0.07 ≤ H/P ≤ 0.2 and 0.8 ≤ H/P ≤ 0.95.

1. Introduction

1.1. PK Weir Overview

A Piano Key weir (PK weir) is an overflow control structure often used as the crest of spillways and in similar flow regulation applications. This hydraulic structure may be considered a type of labyrinth weir, which was first introduced by Hydrocoop [1], that follows a rectangular pattern in plan (see Figure 1). PK weirs include inlet and outlet keys (or units) and most commonly feature sloped floors with portions of the crest extending beyond the weir base, creating overhangs in the upstream and/or downstream directions. PK weirs have been designed and constructed due to their site adaptability, hydraulic performance, and economics and include over 34 structures in North America, Europe, Asia, and Australia on gravity dams (Malarce Dam, France), at embankment dams (Lake Peachtree Dam, GA, USA), and as run-of-river structures (Dakmi 2 and Van Phong Barrage, Vietnam).
In addition to the techno-hydraulic benefits of PK weirs, much of the nappe cascading from the crest of a PK weir impinges on an adjacent nappe due to the geometric layout of the weir and flows through the PK weir outlet keys. This dissipation of energy due to turbulence could be considered when sizing a terminal structure such as an apron or downstream energy dissipator. In the case of a spillway, there may be improved economy and a more precise estimation of a performance safety factor when sizing the apron or stilling basin if the estimation of total energy considers dissipation provided not only by the spillway chute but also by a PK weir serving as the spillway crest. But what information is available to inform such an analysis?

1.2. Energy Dissipation

Hydraulic studies on energy dissipation for the general case of free overfalls and vertical drops include, among others, [2,3,4,5,6,7,8]. For the more specific case of nonlinear weirs, there have been numerous hydraulic studies regarding discharge capacity (e.g., see [9,10,11,12,13,14,15,16]) but relatively few investigations on the topic of energy dissipation.
Energy dissipation and flow characteristics downstream of trapezoidal labyrinth weirs were studied at the Laboratório Nacional de Engenharia Civil (LNEC), beginning with the work of [17]. Approximately 10 years later, [18,19,20] analyzed [17] along with their own experimental data to estimate relative residual energy (H1/H0) downstream of trapezoidal labyrinth weirs, where H0 is the upstream specific energy (H0 = H + P, P = weir height) and H1 is the downstream specific energy. An empirical equation was fit to the data to predict H1/H0, which was also compared with energy dissipation downstream of vertical drops [7,8]. They concluded that H1/H0 at the base of labyrinth weirs increases nonlinearly as H0 increases. Additionally, for a given H0, labyrinth weirs were shown to dissipate more energy than vertical drops, in part due to the colliding nappes in the downstream cycles. Lopes et al. [19,20] estimated ±10% or better agreement with [17] and also documented the characteristic depths, air concentrations, and described flow patterns downstream of trapezoidal labyrinth weirs. They observed a three-dimensional flow field directly downstream of labyrinth weirs, noting shockwaves and areas of air entrainment. It was also noted that as the headwater ratio (H/P) increases, the horizontal downstream distance to a normalized two-dimensional flow regime also increases. Finally, within the two-dimensional flow regime, characteristic depths (which increase with increasing H/P) and air concentration profiles become similar regardless of transverse location.
Approximately ten years later, energy dissipation and flow characteristics downstream of rectangular labyrinth weirs were studied over a limited range at Bundesanstalt für Wasserbau (BAW) [21] for 0.1 < H/P < 0.21 and Wi/Wo = 1.0 to assist with the optimization of stilling basin configurations. They noted that energy dissipation provided by rectangular labyrinth weirs is somewhat similar to that of trapezoidal labyrinth weirs. Al-Shukur and Al-Khafaji [22] studied the role of PK weir slopes on energy dissipation and concluded that dissipation decreases as the slope decreases. The magnitude of the energy dissipation was determined by the distance of the hydraulic jump downstream from the toe of the PK weir. They assumed that the dissipation of energy decreases as the distance to the hydraulic jump increases.
In addition to the aforementioned general research, studies focused on the energy dissipation of labyrinth and PK weirs, project-specific and unique studies, have been performed by [23,24,25,26,27,28], and [29] focused on energy dissipation of stepped chutes with a PK weir crest. To illustrate, Refs. [23,24] proposed for the spillway at St-Marc Dam a “ski jump” and stepped outlet floors of the PK weir to increase energy dissipation. For Gloriettes dam, [25] was able to achieve up to 90 percent energy dissipation by combining a PK weir, a winding stepped channel, and an intermediate stilling basin. Ho Ta Khanh et al. [28] suggested that PK weirs placed on small gravity dams coupled with short stilling basins may, in general, adequately dissipate energy; however, when placed on medium-to-large dams, PK weirs may be best combined with a short stilling basin and a stepped spillway. Erpicum et al. [26] suggested that PK weirs placed above stepped spillways provide quicker effective energy dissipation than ogee weirs for equivalent conditions. They also recommended further testing using a shorter stepped spillway. Silvestri et al. [29] elaborated on the important work of [26] by testing four stepped spillway lengths and concluded that uniform flow conditions and flow energy are reached on shorter-stepped spillway lengths downstream of PK weirs, but not those downstream of ogee-crested weirs.
Also connected to energy dissipation of PK weirs are the studies of local scour at the toe of PK weirs placed in canals and rivers. Jüstrich et al. [30] studied the scour hole and ridge formation caused by PK weirs without any scour protection, concluding that the overall process is jet-induced scour. The scour depth and volume of sediment removed at the toe of PK weirs are primarily a function of sediment characteristics, discharge, residual energy, and tail water depth. They present four formulas for estimating scour maxima. Pfister et al. [31] investigated riprap downstream of PK weirs for scour protection, and [32] proposed a stilling basin, baffle blocks, and an end sill followed by a rockfill layer as another possible method of scour protection downstream of PK weirs. Palermo et al. [33] investigated one uniform noncohesive granular bed material tested under different combinations of discharge and tailwater depth, presenting a preliminary analysis of the scour morphology downstream of a PK weir with results focused on the effects of different tested variables at equilibrium conditions.
Although various valuable studies have been conducted on the energy dissipation of labyrinth and PK weirs, sufficient information from a systematic study remains unavailable to designers regarding energy dissipation and residual energy for Type A PK weirs. A more precise safety factor estimation could be made when sizing the apron or stilling basin if the estimation of total energy considers dissipation provided not only by the spillway chute but also by a PK weir serving as the spillway crest. Therefore, to meet this need, this study was performed using four laboratory-scale PK weir models with four different width ratios (Wi/Wo) of 1.0, 1.25, 1.28, and 1.5 and two size scales for a wide range of hydraulic conditions 0.05 ≤ H/P ≤ 1.0 to estimate dissipation of energy and corresponding flow features.

2. Experimental Setup

This investigation was conducted at the Utah Water Research Laboratory (UWRL) at Utah State University (USU) in Logan, Utah. Physical model tests utilized two rectangular flumes (Flume 1 is 1.23 m wide, 0.91 m deep, and 14.63 m long; Flume 2 is 0.93 m wide, 0.61 m deep, and 7.32 m long). Four Type A PK weir geometries with flat crests (no parapet, no nose) were investigated (see Figure 2) for 1.0 ≤ Wi/Wo ≤ 1.5 with four datasets of 0.05 ≤ H/P ≤ 1.0, comprising 255 tests in total. The experimental test matrix is summarized in Table 1, with an overview of the experimental setup in each flume presented in Figure 3.
The 1.28 Wi/Wo PK weir was directly mounted to the floor of Flume 1. In Flume 2, the remaining three PK weirs were mounted to a thin plate (Pp = 6.4 mm thick) that was necessary for installing in the flume. Pp was accounted for when estimating specific energy. Flows were gravity fed from the reservoir adjacent to the laboratory and were measured using calibrated orifice meters (±0.25% accuracy) connected to pressure transducers (0.1% accuracy). Flows were averaged over 5 min sample periods, with 10% of tests repeated as part of experimental uncertainty and quality control.
Upstream flow depths (P + h = h0) and downstream flow depths, h1, were carefully measured with a point gage (±0.1 mm) and stilling well setup with taps at locations that considered the flow fields in the flume selected at 4P upstream [34] and at 10P downstream of each PK weir. Piezometric head for PK1.28 in Flume 1 was also measured at 8P. The downstream measurement locations to estimate H1 were selected based upon the complex flow field exiting immediately downstream of the PK weirs and the downstream distance needed for the flow field to return to gradually varied with a quasi-constant flow depth in a given cross section, and the assumption of a uniform unit discharges (q) is reasonable. Specific energy upstream and downstream of the PK weirs (H0 and H1, respectively) was calculated as h0 + V02/2g or h1 + V12/2g with the flume bottom as reference, where h0 and h1 are the piezometric head and V0 and V1 are the average cross-sectional velocity. Pp was also considered for tests in Flume 2. Values of H1 and H0 were then used to compute relative energy dissipation [(H0H1)/H0] and relative residual energy (H1/H0). This analysis also looked specifically at local velocities, U, since the appropriate estimation of V is necessary. According to [34], U measurements upstream of labyrinth weirs were uniform at approximately 1–3P, depending on flow. With this guidance, U measurements (sample period of 2 min) in this study therefore focused on the downstream flow field, where U profiles were systematically taken at 8P and 10P at 0.25, 0.5, and 0.75W across the width W of the flume using a Sontek Acoustic Doppler Velocimeter [35]. Velocity analysis results found agreement between these two approaches, resulting in a difference of less than 5% in H1 for the range of Q.
In this study, tailwater was not artificially controlled; for tests that featured a hydraulic jump at the toe of the structure and upstream of flow depth measurements, energy dissipated by the jump was estimated using a tool commonly implemented in industry via momentum and computing an inflow depth via Belanger’s equation h1/hj = 0.5[(1 + 8Fj2) − 1], where hj is the inflow depth to the jump and Fj is the inflow or approach Froude number. Such dissipation estimates were small when juxtaposed to energy dissipated by the PK weirs. The authors point out that there is some uncertainty in this indirect approach since Fj and Belanger’s equation assume uniform inflow conditions but are being applied to a three-dimensional rapidly varied flow field at the base of the PK weirs. However, since the focus of this analysis is to provide design information to industry where safety factors are typical and there may be much greater uncertainties in hydrologic studies, the authors believe that this estimation is reasonable, certainly as a first-order approximation. Nonetheless, the authors would encourage additional research focused on this complex region to expand and build upon the results presented herein.
Furthermore, recorded observations of the flow field downstream of the PK weirs is included herein to provide additional insight into the flow patterns a PK weir may generate. Lastly, to link these results to published literature, two comparisons were made. First, a comparison of H0 and H1 to the datasets by [21] of a rectangular labyrinth weir and [17] (also presented in [18]). The second comparison is specific to PK weirs, where the Q vs. H data collected herein were compared to a commonly used head-discharge method [36] and a scale effects study [37], where [36] tested Type A PK weirs with P = 0.197 m and Wi/Wo = 1.50, 1.25, and 1.0 (H was computed at 1P and 2P), while [37] included data for P = 0.42 m and Wi/Wo = 1.28 (H0 was computed at ~4.7P). As shown in Table 2, the comparison of Q for a given H was made by computing the mean absolute percentage error (MAPE) and the root mean square error (RMSE) between the data from this study and that from [36,37].

3. Results

3.1. Type A PK weir Flow Features

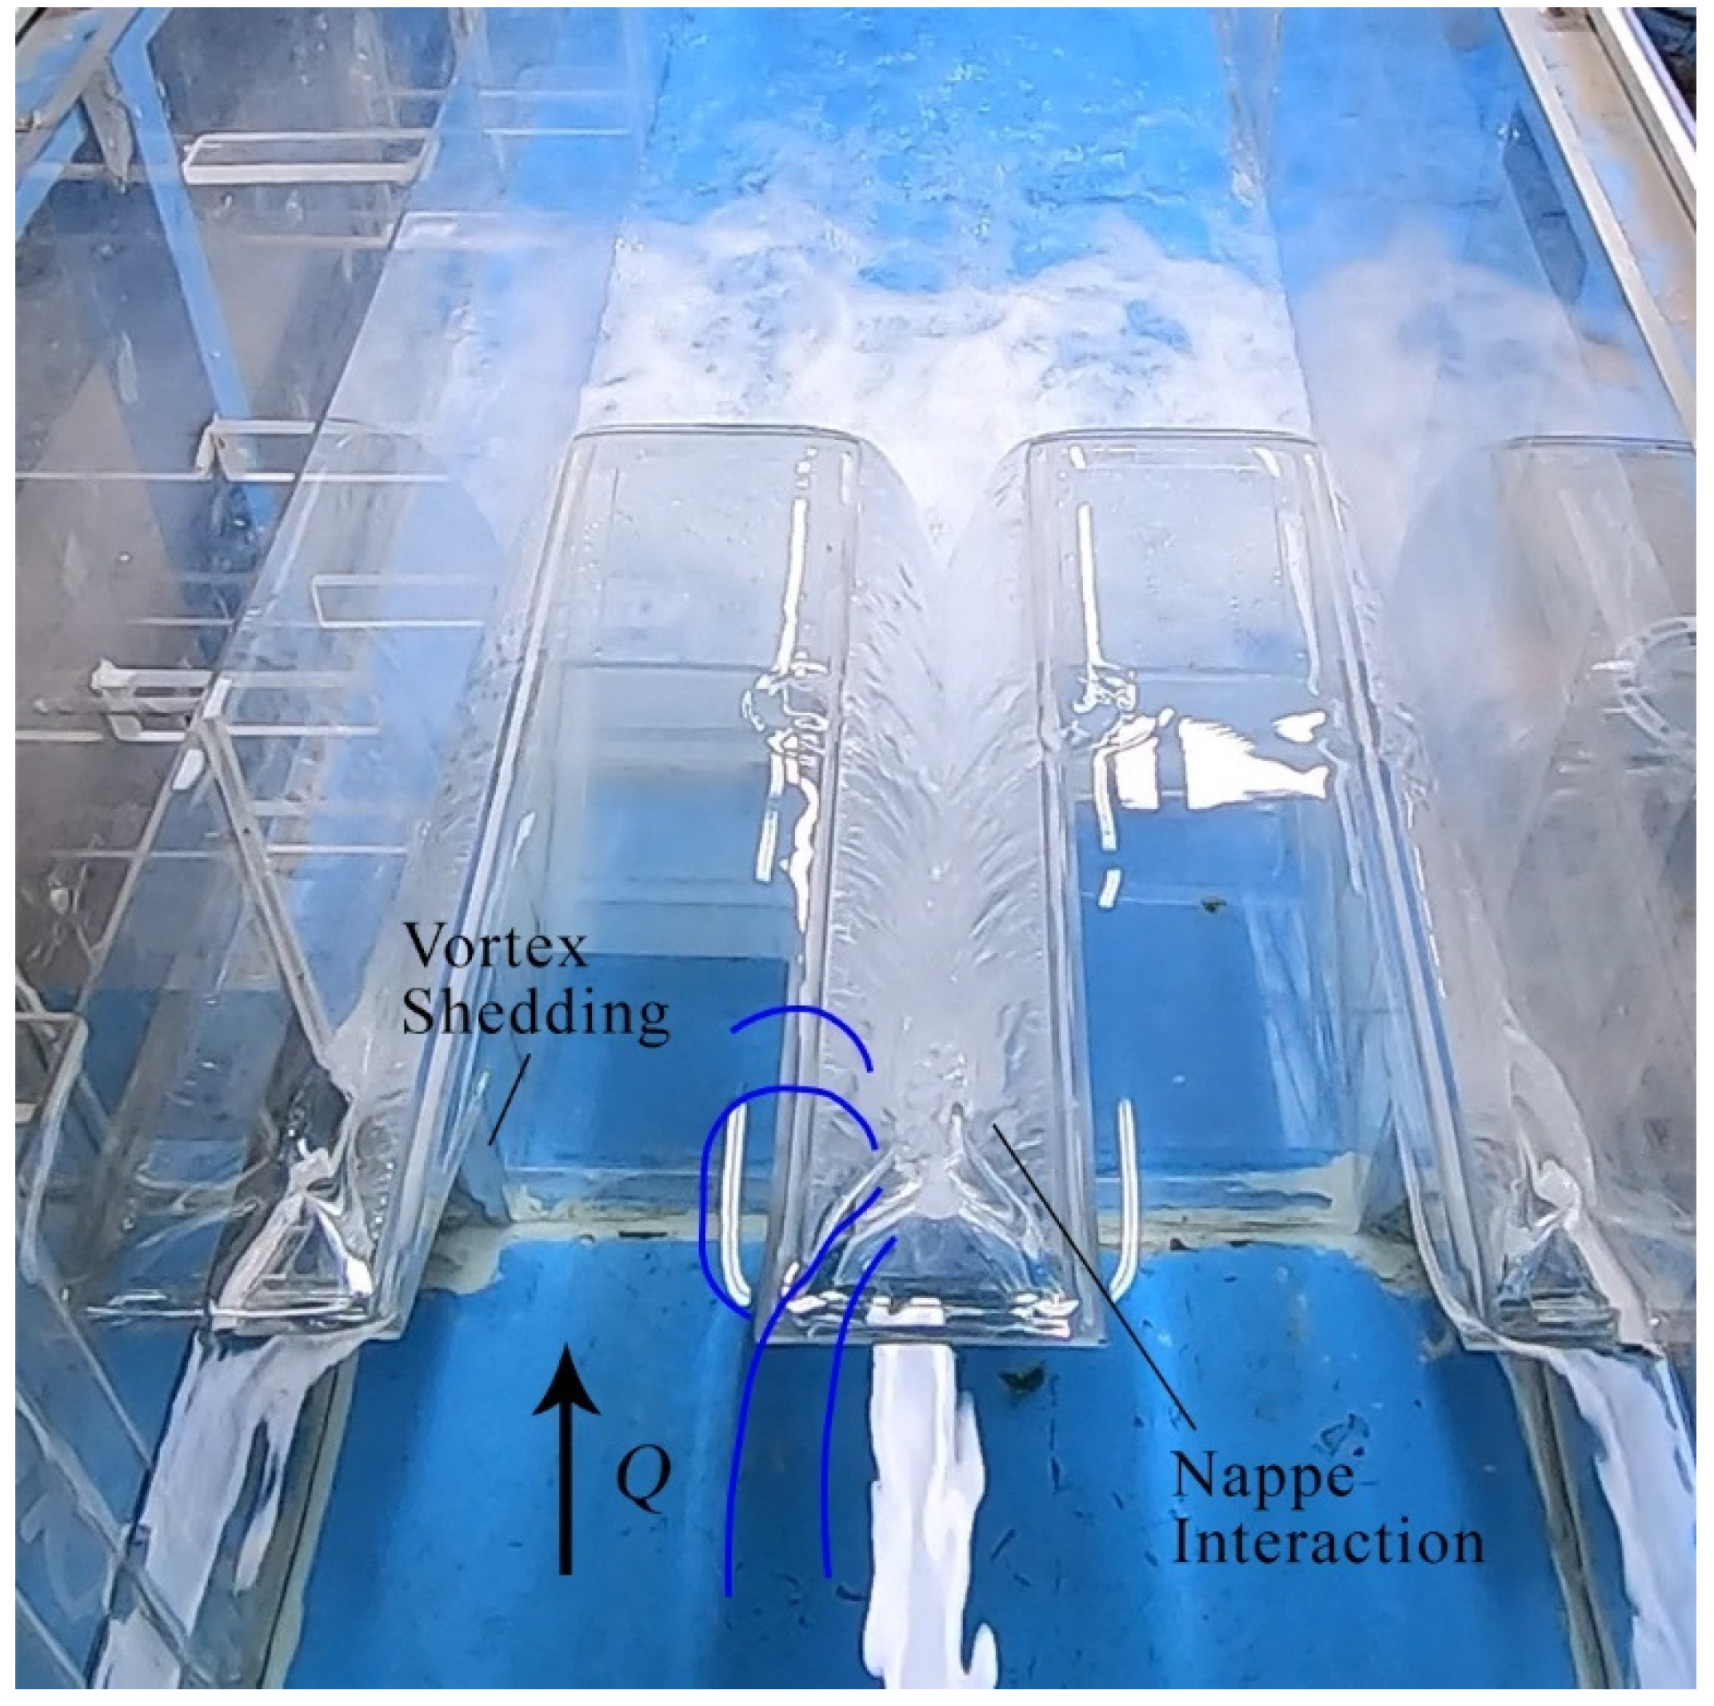
The flow field approaching the PK weir for the present study was channelized and uniform with a smooth water surface. The PK weir modifies this approaching flow field with streamlines passing along the bottom, up the inlet ramps, and over the weir wall, with unit discharge decreasing in the streamwise direction while experiencing acceleration and increased local velocities. This is substantiated by a reduction in the water surface elevation and some visual observance of increased turbulence. The region beneath the PK weir overhangs (see Figure 4) projecting upstream contributes to energy dissipation via the face of the PK weir, serving as an obstacle redirecting flows perpendicular or outward and also introducing dual shear layers with vortex shedding propagating downstream to the weir crest, which also manifests capillary surface waves (also noted in Figure 4). Observable in Figure 4 are the nappes passing over the crest, considered as three planar jets interacting over a sloping surface, exhibiting jet expansion, jet interaction dominated by opposing nappes with a water surface impingement zone, crossing region, and small wakes near the upstream apexes. The resulting interactions result in significant mixing and turbulence with a highly aerated rotating jet exiting from each outlet key that is directed downstream and immediately expands. Note that nappes acting in opposite directions contribute to energy dissipation as noted in previous crossing jet studies, e.g., [38].
The evolution of the flow field is clearly evident as upstream head H and Q increase the volumetric space of the outlet keys restricts jet interaction and energy dissipation caused by the crossing jets. In fact, H/P ≥ 0.2 local submergence is observed to increase and occupies a larger percentage of this region until the majority of Bo + Bb streamwise distance is locally submerged [39]. Local submergence is a contributor to reduced discharge capacity and is also noteworthy when considering the reduction in energy dissipation for higher H/P ratios, as discussed in the subsequent section.
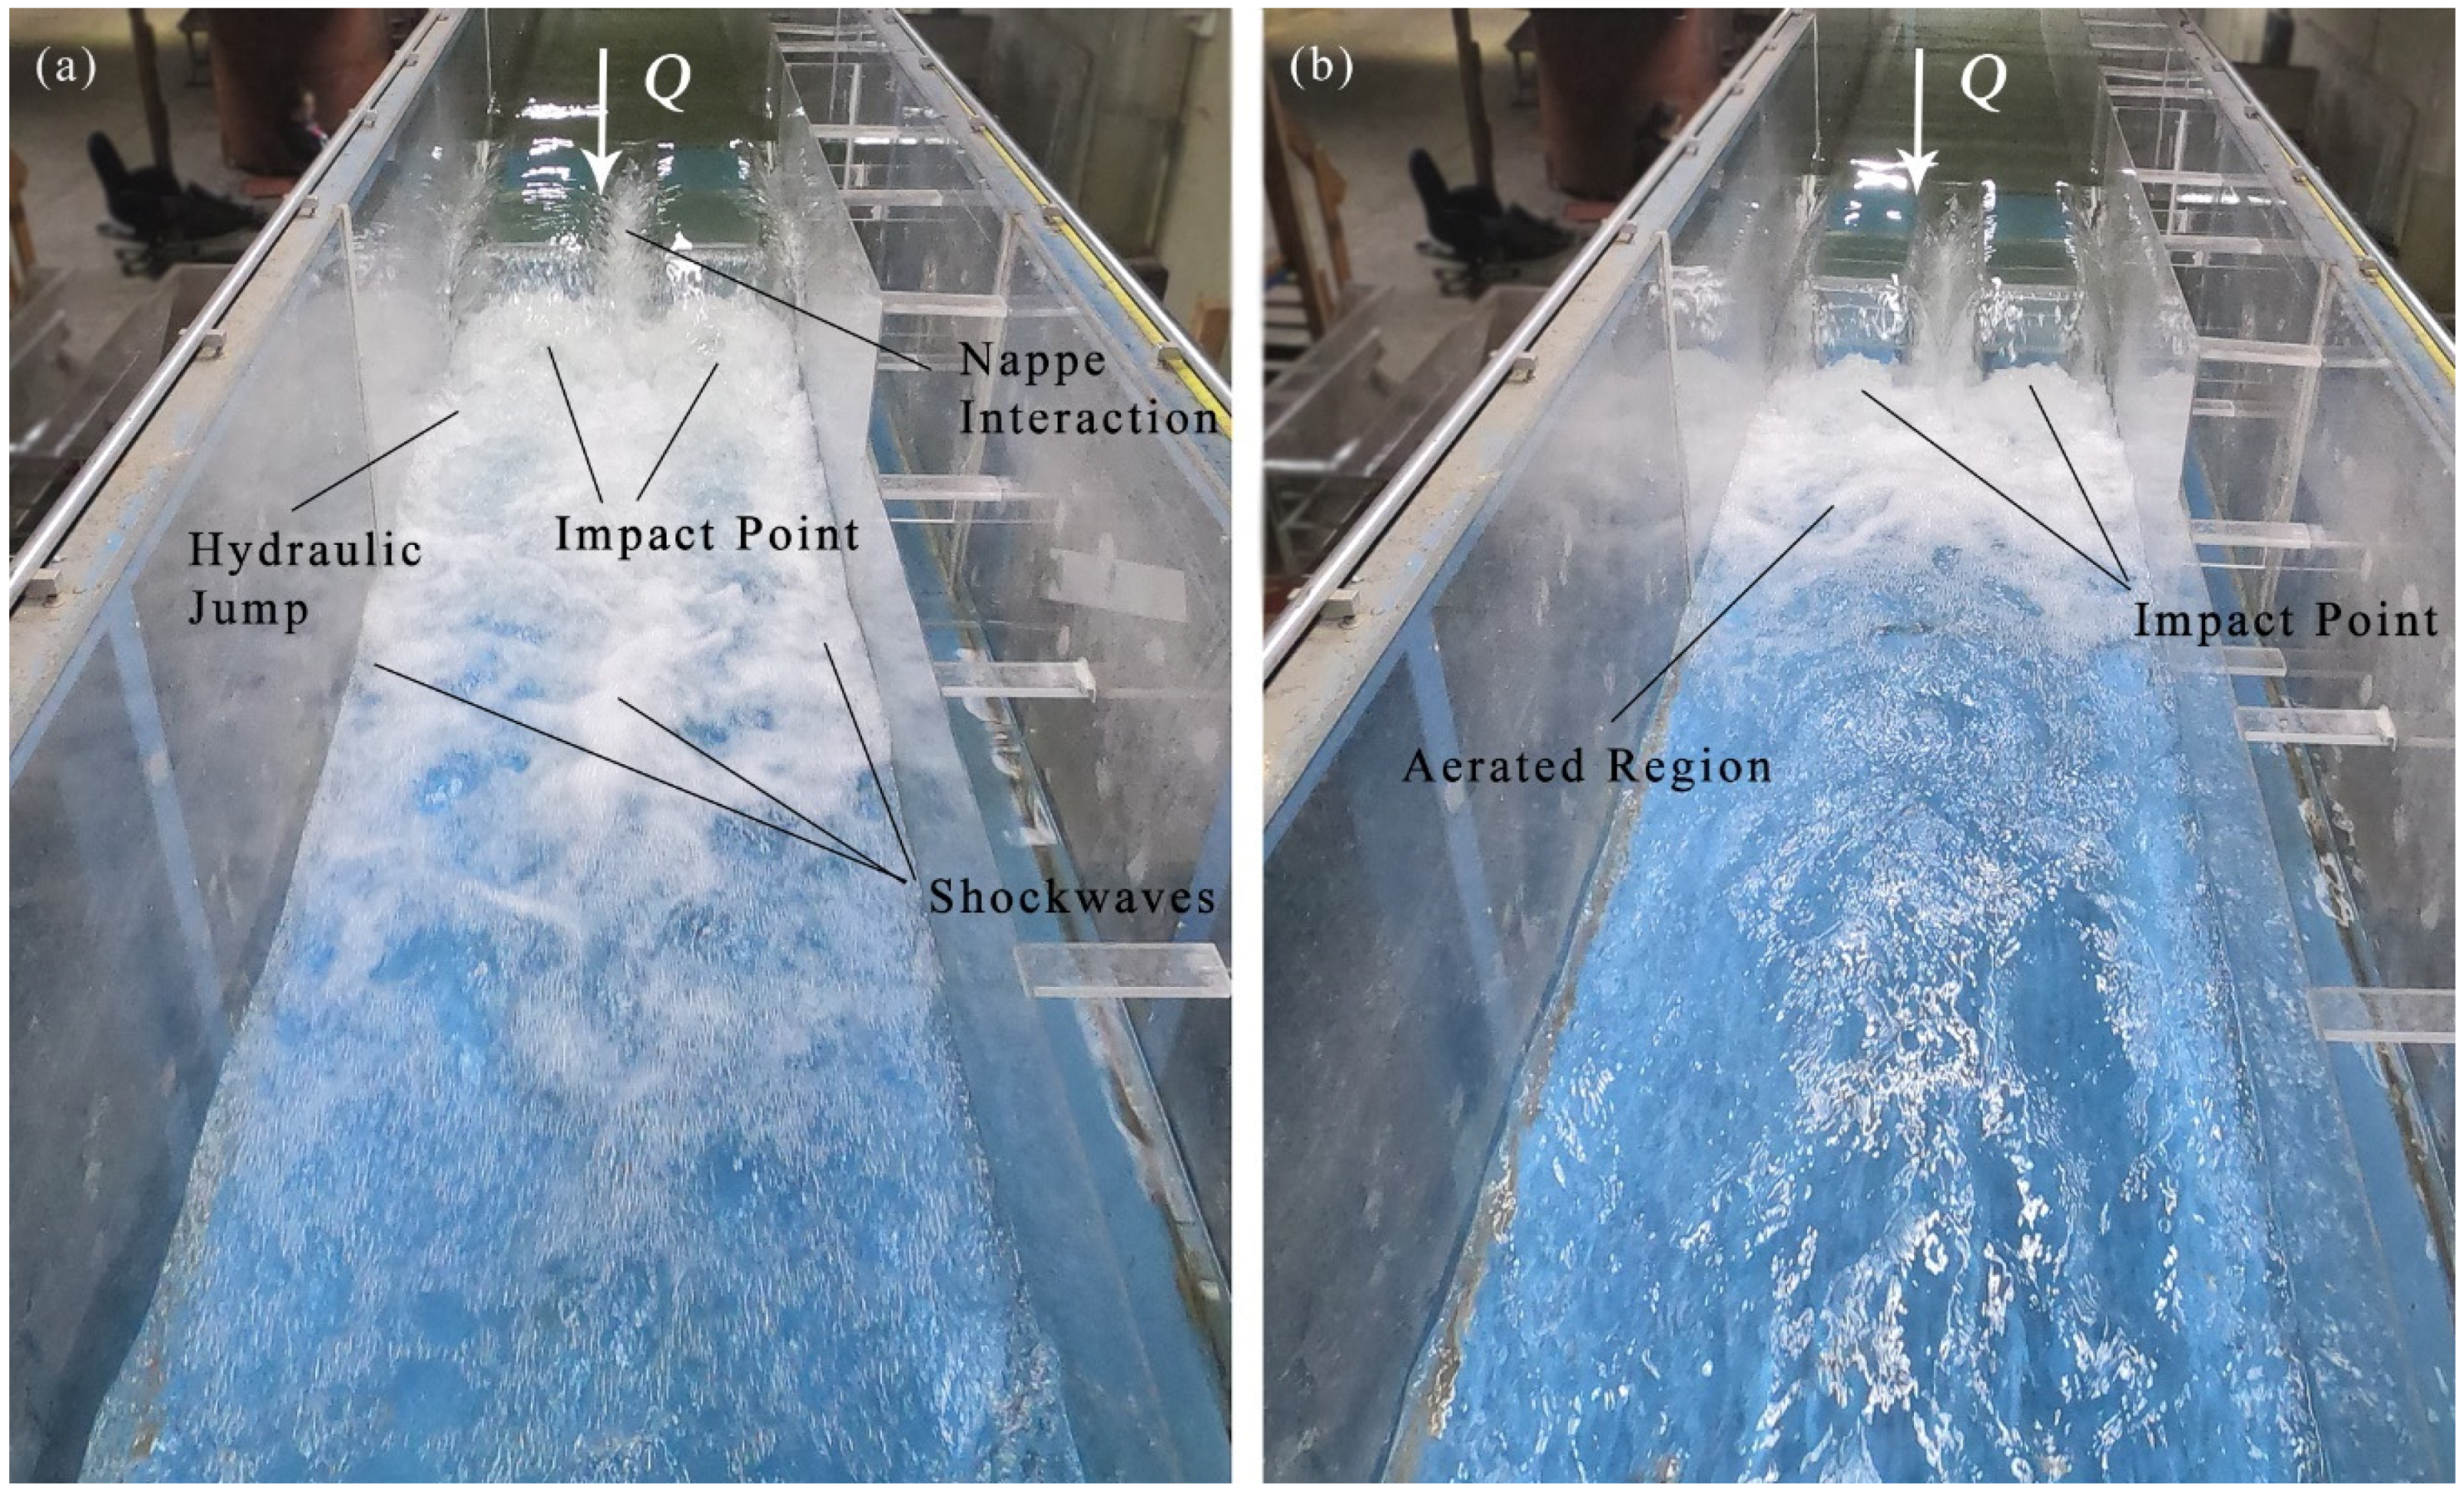
As shown in Figure 5 and Figure 6, flow through the PK weir is highly aerated and three-dimensional with splash and spray regions within the outlet keys and at the base of the structure. The spray and splash region only marginally increased proportional to H and planar jet trajectory departing from the downstream-most extents of the weir crest. However, the aeration region significantly increased with H, in part due to the increase in local velocity resulting in higher levels of advection and turbulent mixing.
At the base of the PK weir, some differences in the flow field relative to labyrinth weirs were noted when referencing [17]. First, for H/P ≤ 0.15, the aerated region did not include a hydraulic jump. As H increased the rotational jets issuing from each outlet key visually appeared to be of higher intensity relative to labyrinth weirs, which allow jet expansion throughout the outlet cycle. Where jets from labyrinth weirs are aligned with the downstream apexes and not the centerline of the outlet cycles, PK weir jets were observed to be aligned with the outlet keys (see Figure 6) and directed at the flume with angle similar to the outlet key ramp angle. Upon impact, jets were deflected by the flume floor with a tendency for the supercritical flow to continue past the structure toe and form a hydraulic jump from about 0.15 ≤ H/P ≤ 0.45. Hydraulic jump flow regimes ranged from undular to broken and were stable. Since for this study it was not possible to measure energy upstream of the hydraulic jump, an indirect method previously used in similar studies was adopted, discussed further in this paper. For H/P ≥0.45, no roller or hydraulic jump was noted with supercritical flow in the downstream channel as tailwater was not artificially controlled in the horizontal flumes. Finally, the shockwaves displayed small deflection angles without downstream intersection as observed in labyrinth weirs [20,34].

3.2. Dissipation of Energy

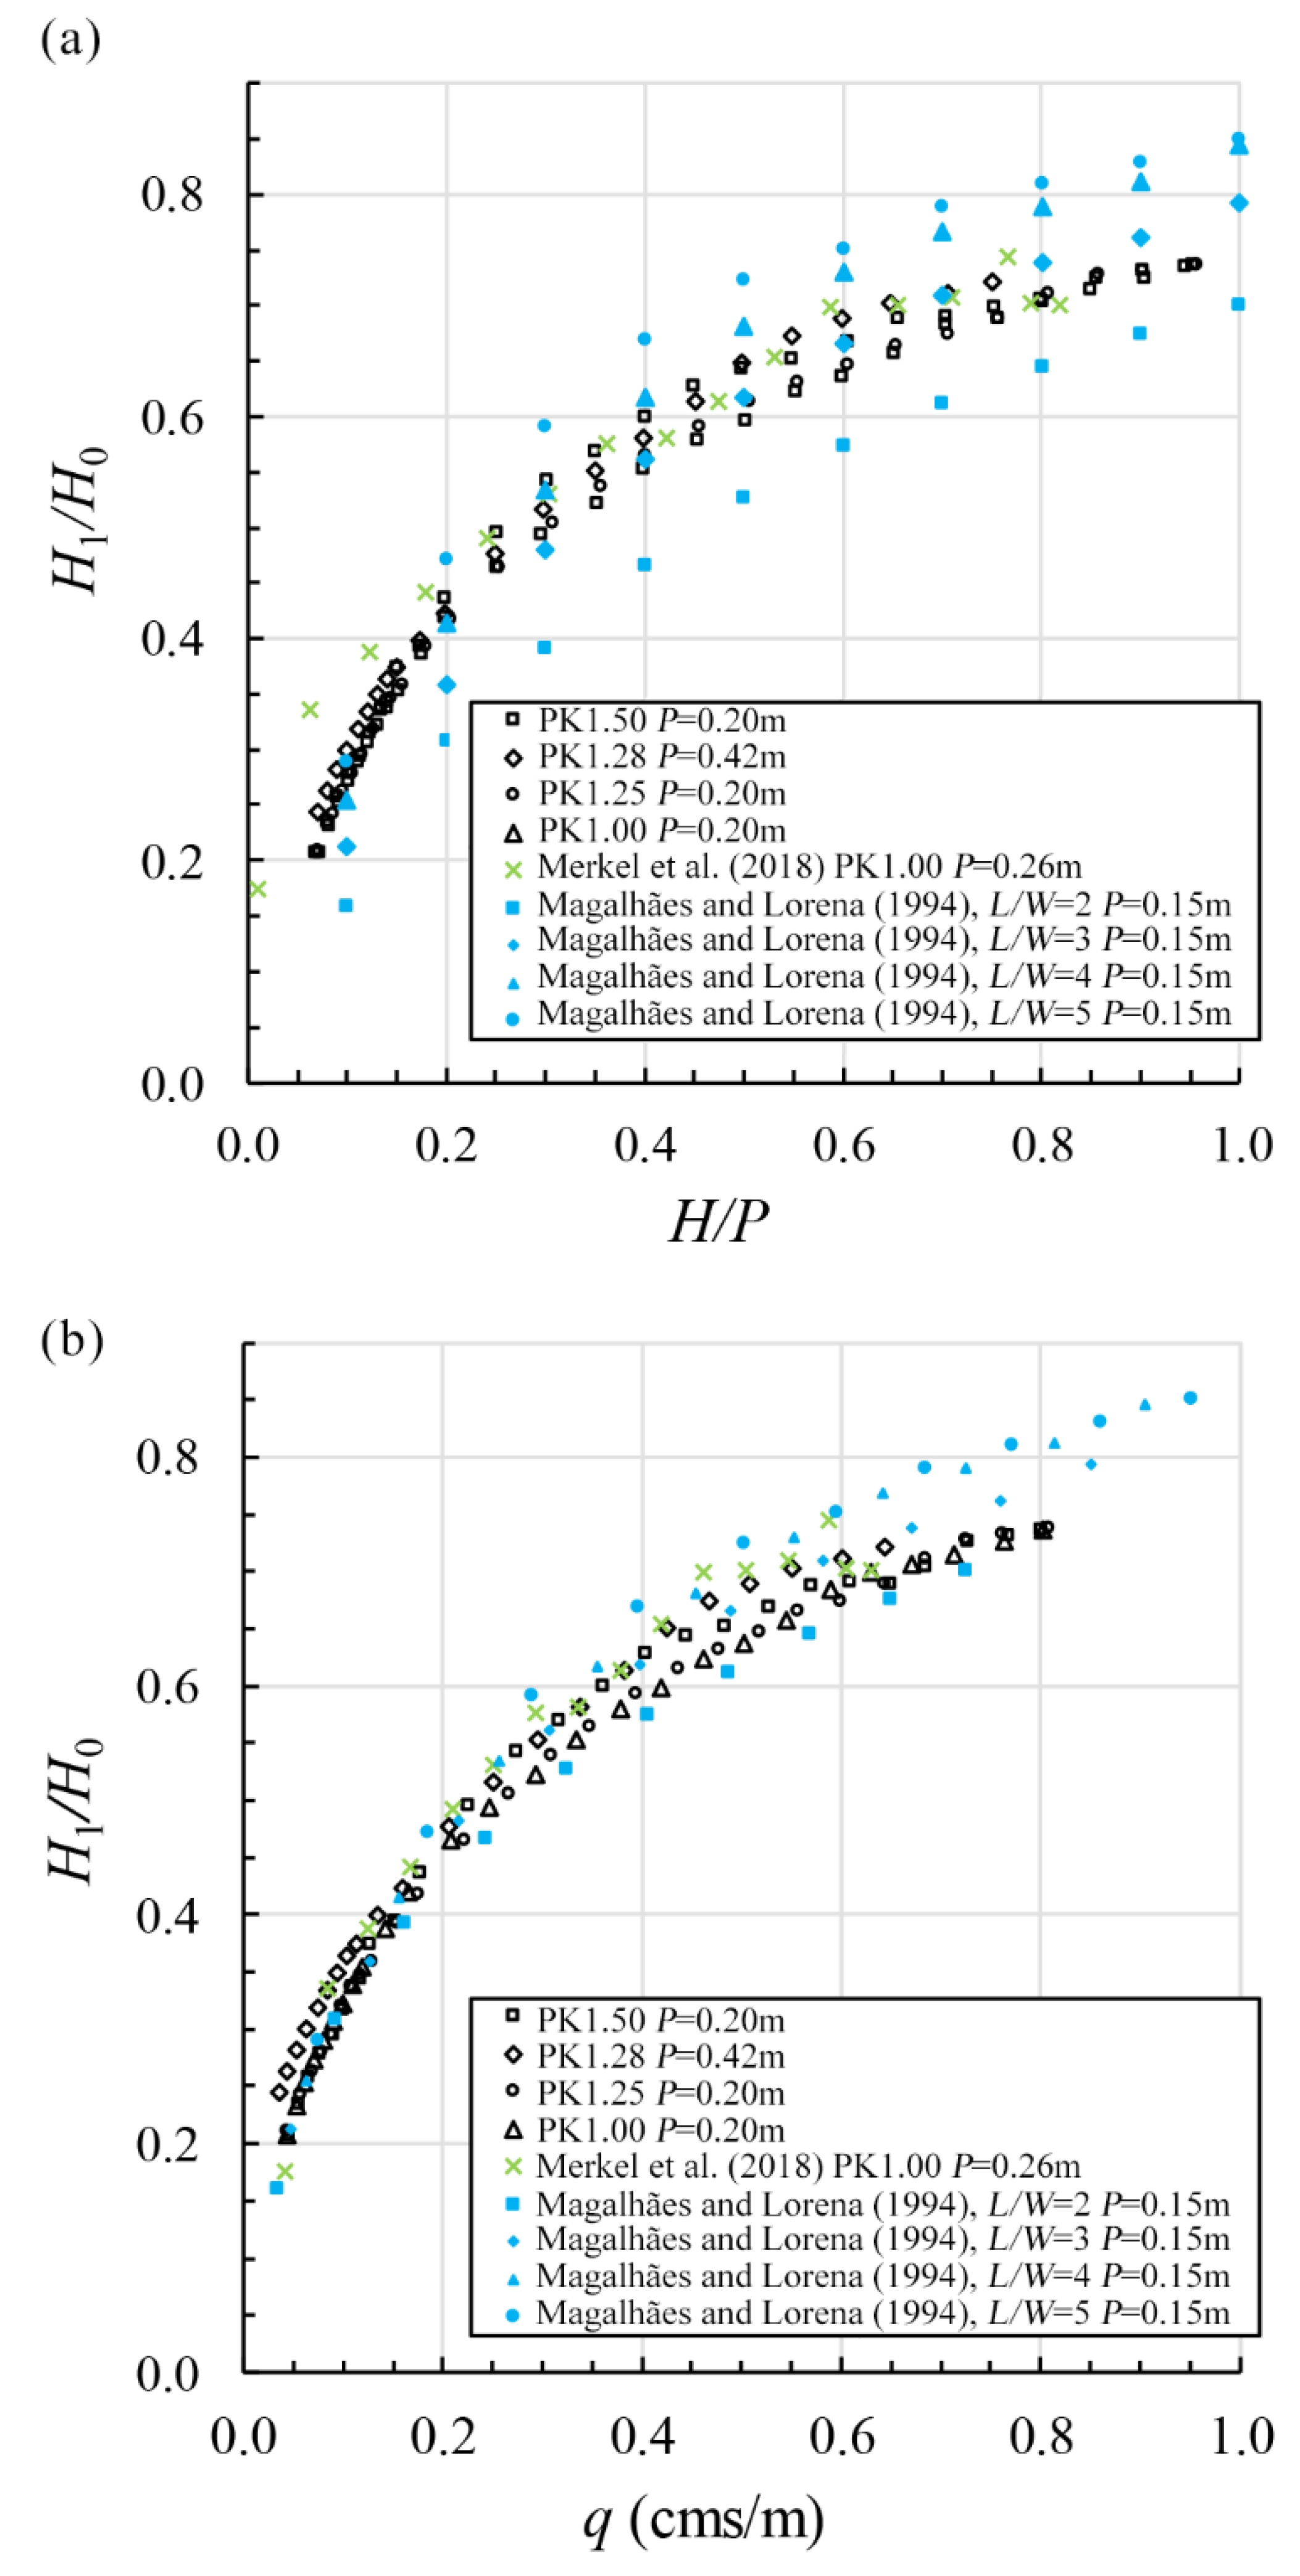
After considering the flow fields created by a Type A PK weir, the dissipation of energy provided by the PK weir geometries tested herein (see Table 1) is discussed and quantified as relative energy dissipation, (H0 − H1)/H0, in Figure 7. The published data for laboratory-scale trapezoidal labyrinth weirs [17] and rectangular labyrinth weirs [21] is included for comparison and reference. A second quantification of energy dissipation is relative residual energy, H1/H0 (see Figure 8). (H0 − H1)/H0 of PK and labyrinth weirs are directly inverse to the trends for H1/H0.
As shown, it is apparent that for nonlinear weirs, (H0 − H1)/H0 is inversely proportional to H/P with a nonlinear trend. Energy dissipation is greatest for lowest flow depths, and a PK weir is less effective at dissipating energy at higher heads. Also observed is for H/P < 0.3, a small change in H/P results in a relatively large change in relative energy dissipation. As H/P increases, the rate of change in (H0 − H1)/H0 gradually decreases. This is in part due to the progressive change in the portion of the nappe affected by local submergence [39]. The labyrinth or PK weir nappe conditions transition from aerated to partially aerated and then drown [40], energy dissipation provided by jet collision and downstream impact is altered and consequently reduced. The trends discussed above are also true when comparing relative energy dissipation to q of dissimilar structures such as vertical drops and overflow weirs.
The relative energy dissipation of PK weirs and labyrinth weirs may be fitted with a logarithmic function [20]; however, labyrinth weirs appear to present families of curves based upon sidewall angle α or L/W, whereas, to date, constructed PK weirs have α = 0. The (H0 − H1)/H0 across PK weirs is relativity uniform at the dataset extremities (low and high ends of H/P) and independent of Wi/Wo values. At 0.2 ≤ H/P ≤ 0.9, the relative energy dissipation of PK weirs exhibits a dependence upon key geometries, and thus values of Wi/Wo are a convenient parameter. Furthermore, the results of [21] for rectangular labyrinth weirs compared with the PK 1.00 tested herein do not clarify the quantitative effects of energy dissipation by the inlet and outlet ramps, as it would be anticipated that less energy would be dissipated by the presence of inlet and perhaps also outlet ramps.
The data for PK 1.00, PK 1.25, and PK 1.50 demonstrate a pattern of convergence in relative energy dissipation at both low and high values of H/P. The data for PK 1.28 show a similar trend to the other PK weirs tested, but the slight differences in energy dissipation are attributed in part to experimental uncertainties and different experimental geometries. Further testing regarding energy dissipation scale effects is recommended to explore any potential performance differences between larger prototypes and scaled models since the scale of PK 1.28 is 2.1 times larger than the other three weirs.

3.3. Residual Energy Estimation for Design

The ability to accurately predict the residual energy downstream of a PK weir is important in the design of energy-dissipative structures. Knowing the approximate residual energy allows a designer to more accurately account for the energy that must be dissipated downstream of PK weirs. The same is true of all structures including other nonlinear weir types such as labyrinth weirs. Fortunately, designers have had the contribution of [18], who provided an empirical prediction for the relative residual energy downstream of labyrinth weirs that is a function of H/P and L/W.
To expand this approach, Equations (1) and (2) are presented to predict energy dissipation by a Type A PK weir. The equations are both functions of H/P since this ratio is common to nonlinear weir head-discharge formulations but also includes Wi/Wo.
Coefficients for Equation (1) are provided Table 3, which also includes three statistical measures of R2, mean absolute percentage error (MAPE), and root mean square error (RMSE) for each set of coefficients.
H 1 H 0 = A + Bln ( H P ) + Cln ( W i W o )
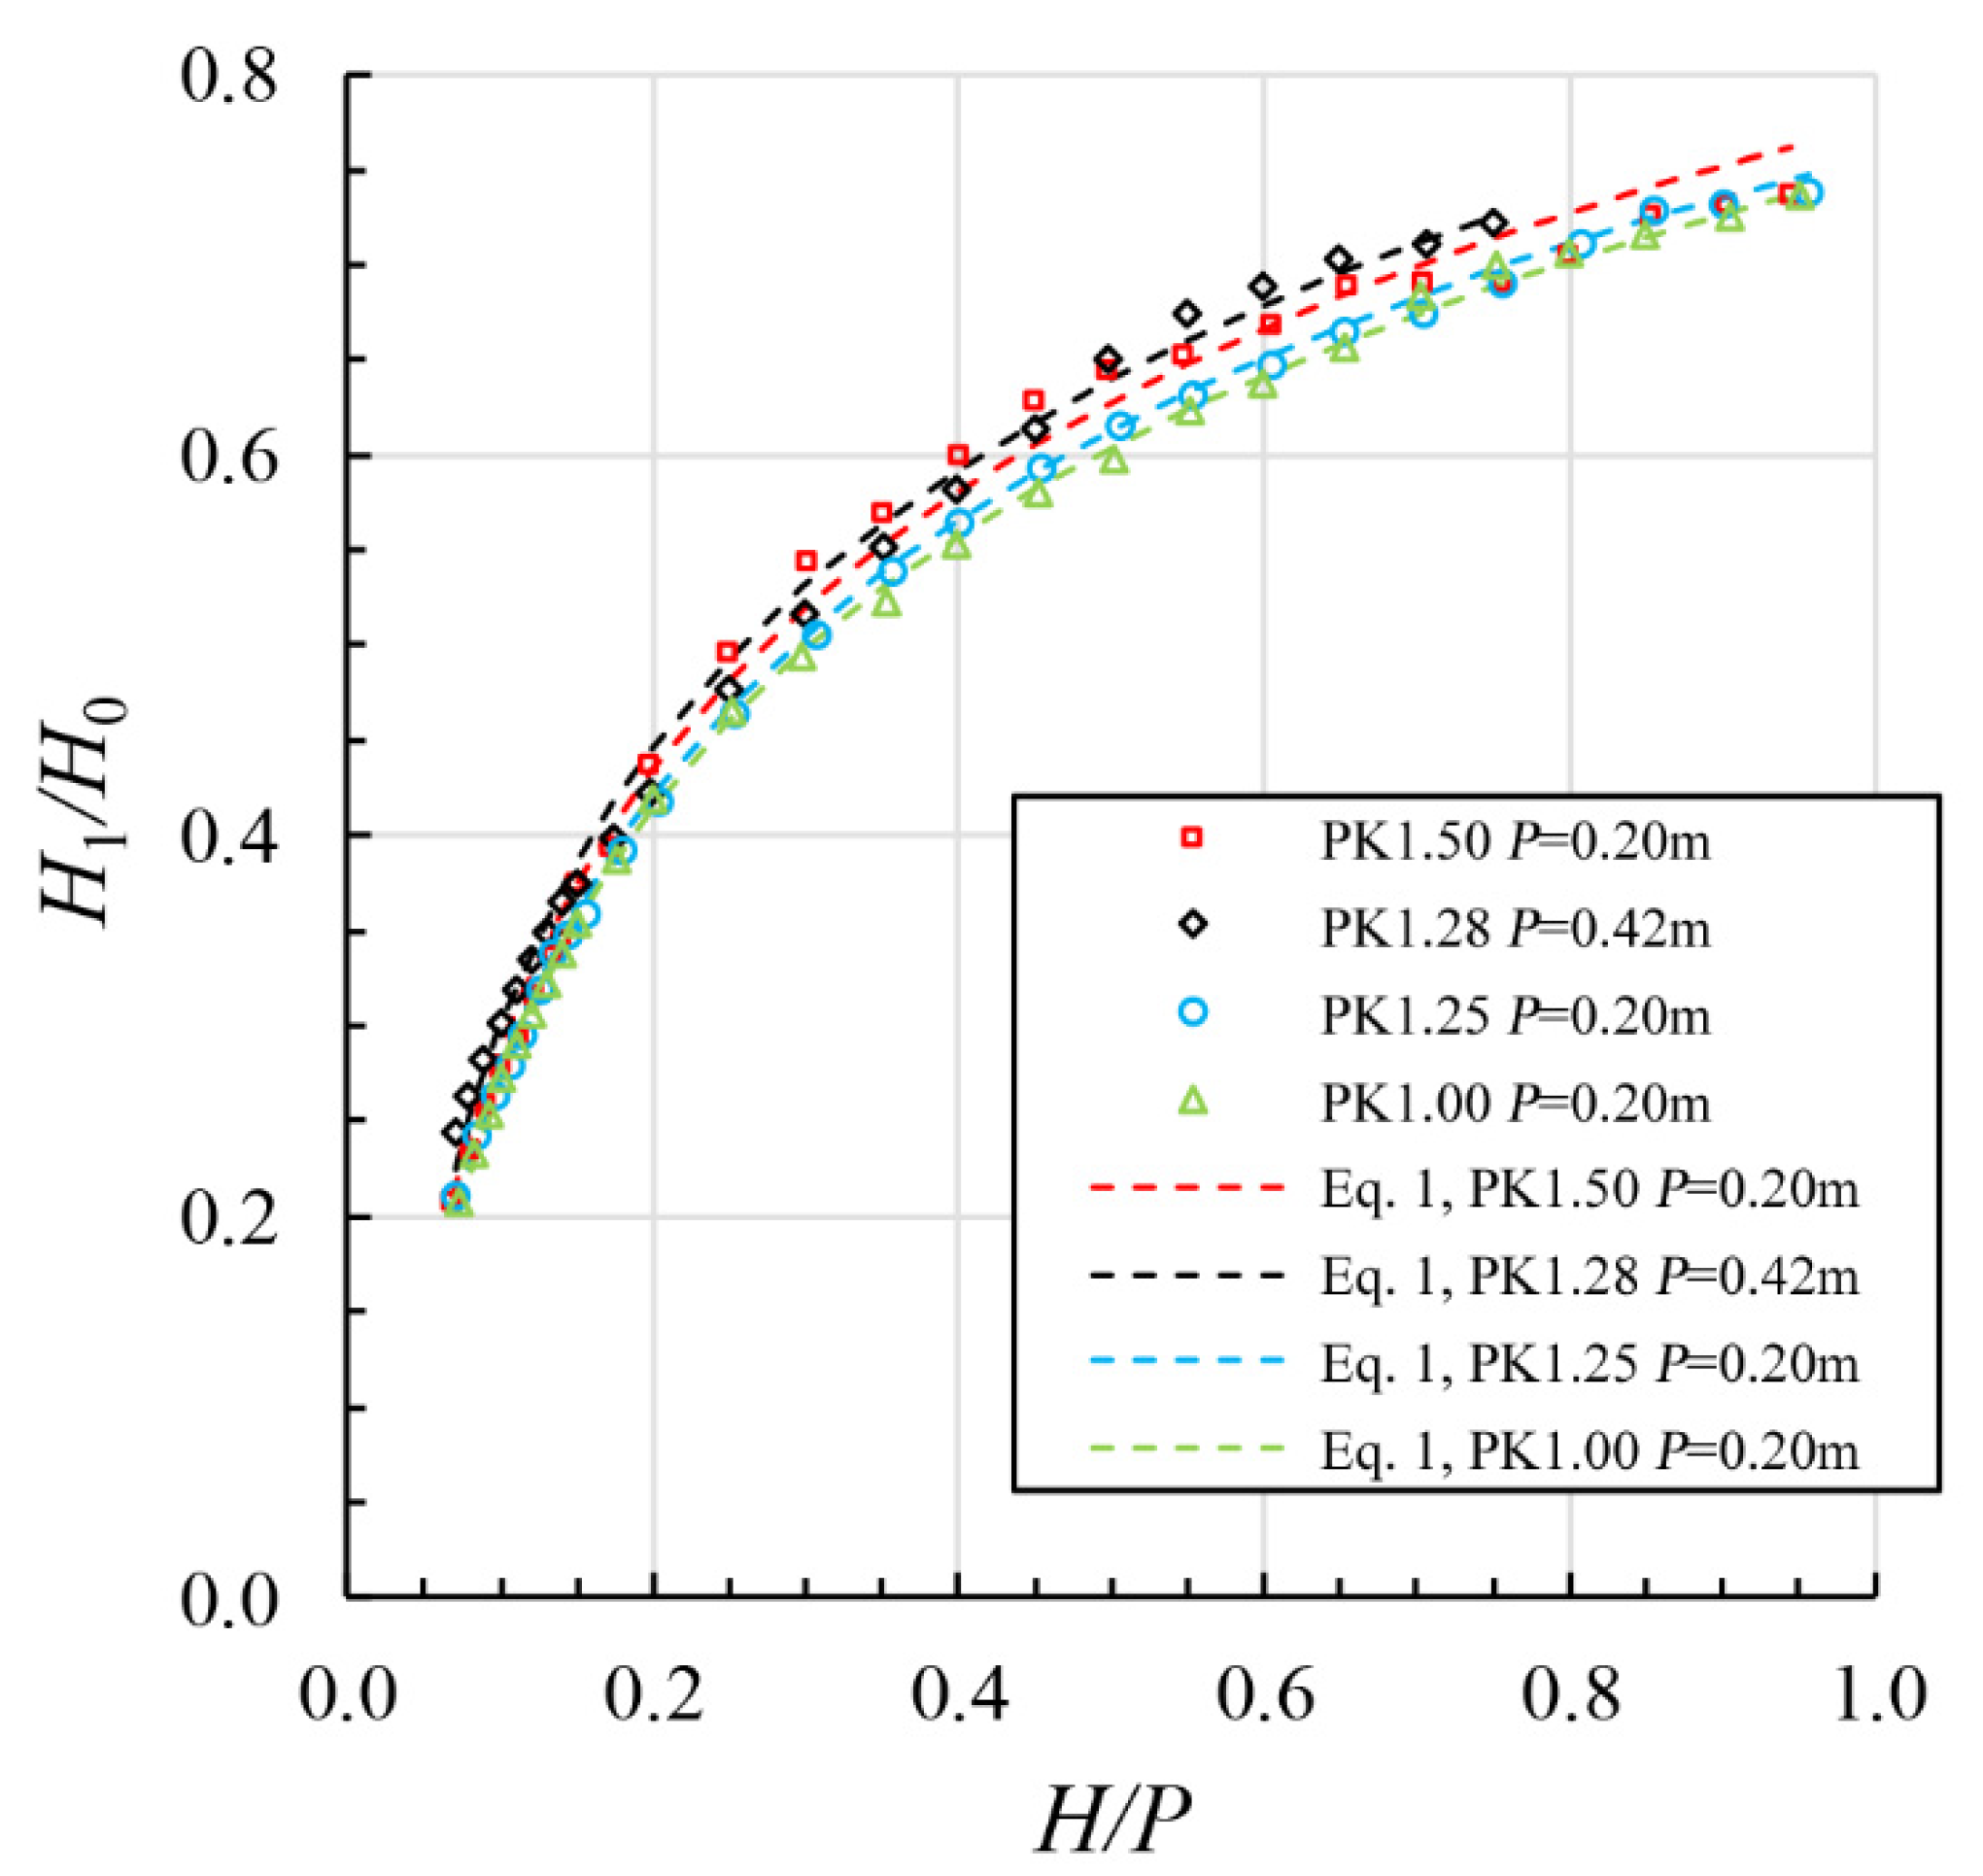
The predicted values of H1/H0 using Equation (1) and the corresponding coefficients from Table 3 are plotted against the observed data for each weir in Figure 9. It can be seen that the predicted values of relative residual energy for PK1.00 and PK1.25 correspond well to the observed data. Larger differences are noted between the predicted and observed values of relative residual energy of PK1.28 and PK1.50. The authors recommend that this tool be considered a first-order approximation that may be acceptable for conceptual designs and alternative analyses. Hydraulic modeling of site-specific conditions using physical and, when appropriate, computational fluid dynamics is recommended for final design.
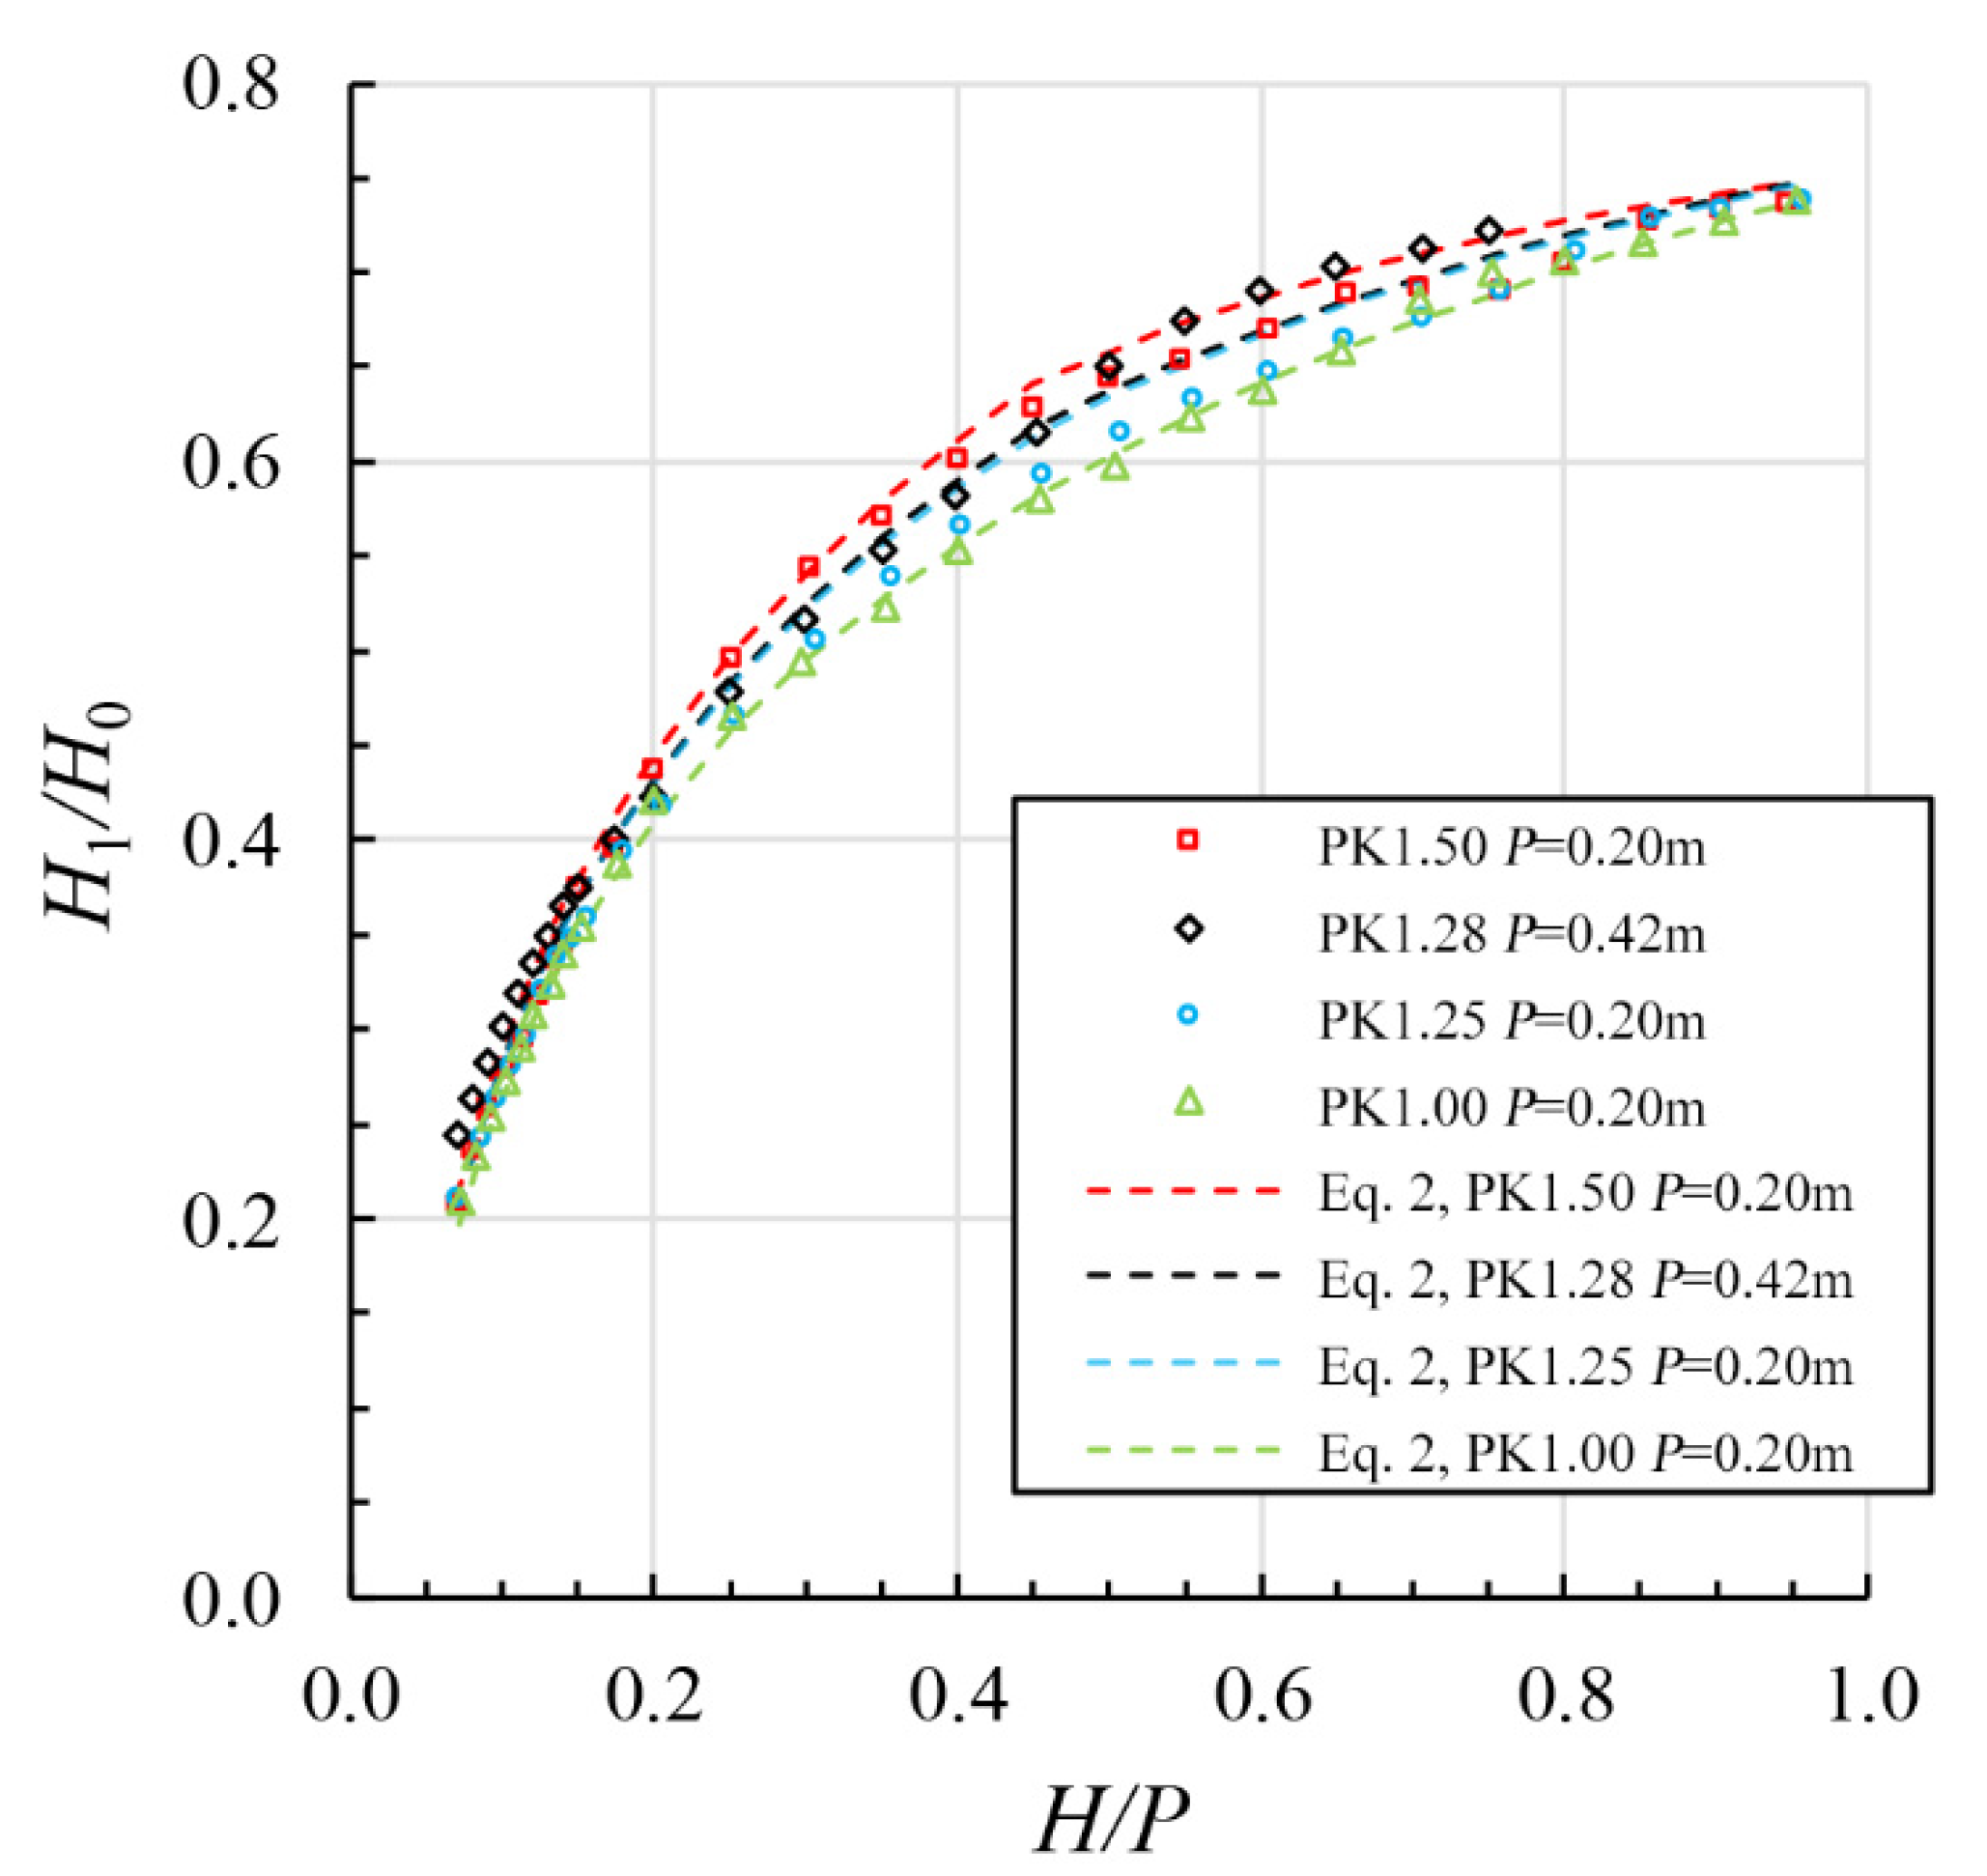
This recommendation equally applies to Equation (2), which is proposed as a singular equation to predict the energy dissipation downstream of PK weirs. This equation is accompanied by Table 4, which lists the R2, MAPE, and RMSE values of Equation (2) relative to each Type A PK weir geometry.
H 1 H 0   =   0.748   +   0.21 ln ( H P )   +   0.15 ln ( W i W o )     [ 0.2 ( W i W o     1 ) | H P     0.45 | ] ,
The predicted values of relative residual energy using Equation (2) are plotted against the observed data for each weir in Figure 10. It can be seen that Equation (2) more accurately follows the data trend of convergence at around 0.07 ≤ H/P ≤ 0.2 and 0.8 ≤ H/P ≤ 0.95. Equation (2) assumes a liner relationship between Wi/Wo and the change in H1/H0, causing a slight overestimation of the H1/H0 for PK1.5. Additionally, for PK1.28, the predicted values of H1/H0 at 0.5 ≤ H/P are slightly less than the observed values.

4. Discussion and Conclusions

To develop an increased understanding of energy dissipation provided by PK weirs, four Type A PK weir laboratory-scale models were tested at the UWRL. First, observations of the flow field were documented, noting various features contributing to energy dissipation. Second, energy at the toe or base of the PK weirs was presented as relative energy dissipation and residual energy with a comparison of the energy dissipation downstream of rectangular and trapezoidal labyrinth weir datasets. Finally, the experimental results were fit to two empirical equations that may be used as first-order approximations by practitioners. Based on the results of this study, the following conclusions were drawn:
  • Similar to labyrinth weirs, PK weirs provide some energy dissipation that may be desirable in rehabilitation and new projects. The rate of energy dissipation is not linear and is greatest at low heads.
  • Energy dissipation is in part provided by flow entering the structure with the front perpendicular faces of the PK weir beneath the upstream overhangs. Some vortex shedding is noted along with capillary waves. The nappes are considered as opposing planar jets producing turbulence, mixing, increasing aeration, and forming jets directed downstream at a trajectory mimicking the outlet cycle ramps. These jets expand and interact at the toe of the PK weir and with the tailwater.
  • The parameter Wi/Wo appears to affect energy dissipation of a PK weir in the following range: 0.2 ≤ H/P ≤ 0.8. As Wi/Wo increases, the hydraulic efficiency also increases, resulting in decreased energy dissipations. At values of H/P ≤ 0.2 and H/P ≥ 0.8, energy dissipation appears to remain relatively constant, independent of the parameter Wi/Wo.
Additional research is recommended regarding energy dissipation of PK weirs. This may include additional geometries such as PK weir types B, C, and D. Although the laboratory-scale models are of adequate size per [41] and [42], the authors recommend an energy dissipation scale effects study considering field-scale PK weirs. It is hoped that the contents of this paper, including flow field observations, the dataset, and the predictive residual energy equations, will be beneficial to researchers and, in particular, practitioners designing PK weirs and downstream features such as chutes and energy dissipators.

Author Contributions

Conceptualization, B.M.C.; Methodology, B.M.C.; Formal analysis, K.E., B.M.C.; Investigation, K.R.E., B.M.C.; Resources, B.M.C.; Data curation, K.R.E., B.M.C.; Writing—original draft preparation, K.R.E., B.M.C.; Writing—review and editing, B.M.C.; Visualization, B.M.C.; Supervision, B.M.C.; Project administration, B.M.C.; Funding acquisition, B.M.C. All authors have read and agreed to the published version of the manuscript.

Funding

This research was funded by the State of Utah through Utah State University.

Acknowledgments

The authors thank Wyatt Lantz and Shelby Bulkley, undergraduate researchers at UWRL, for their assistance in this study. The authors also thank Jorge Matos and Jennifer Merkel for sharing their LNEC and BAW data sets.

Conflicts of Interest

The authors declare no conflict of interest.

References

  1. Blanc, P.; Lempérière, F. Labyrinth spillways have a promising future. Hydropower Dams 2001, 8, 129–131. [Google Scholar]
  2. Moore, W.L. Energy loss at the base of free overfall. Trans. ASCE 1943, 108, 1343–1360. [Google Scholar]
  3. White, M.P. Discussion of moore. Trans. ASCE 1943, 108, 1361–1364. [Google Scholar]
  4. Rand, W. Flow geometry at straight drop spillways. Proc. ASCE 1953, 81, 1–13. [Google Scholar]
  5. Gill, M.A. Hydraulics of rectangular vertical drop structures. J. Hydraul. Res. 1979, 17, 289–302. [Google Scholar] [CrossRef]
  6. Chanson, H. Comparison of energy dissipation between nappe and skimming flow regimes on stepped chutes. J. Hydraul. Res. 1994, 32, 213–218. [Google Scholar] [CrossRef]
  7. Chanson, H. Hydraulic Design of Stepped Cascades, Channels, Weirs, and Spillways; Pergamon: Oxford, UK, 1995. [Google Scholar]
  8. Chamani, M.; Rajaratnam, N. Energy loss at drops. J. Hydraul. Res. 1995, 33, 373–384. [Google Scholar] [CrossRef]
  9. Erpicum, S.; Laugier, F.; Boillat, J.L.; Pirotton, M.; Reverchon, B.; Schleiss, A.J. Labyrinth and Piano Key Weirs—PKW 2011; CRC Press: London, UK, 2011. [Google Scholar]
  10. Erpicum, S.; Laugier, F.; Pfister, M.; Pirotton, M.; Cicero, G.; Schleiss, A.J. Labyrinth and Piano Key Weirs II—PKW 2013; CRC Press: London, UK, 2013. [Google Scholar]
  11. Erpicum, S.; Laugier, F.; Ho Ta Khanh, M.; Pfister, M. Labyrinth and Piano Key Weirs III—PKW 2017; CRC Press: London, UK, 2017. [Google Scholar]
  12. Crookston, B.M.; Erpicum, S.; Tullis, B.P.; Laugier, F. Hydraulics of labyrinth and piano key weirs: 100 years of prototype structures and future research needs. J. Hydraul. Eng. 2019, 145. [Google Scholar] [CrossRef]
  13. Crookston, B.M.; Anderson, R.M.; Tullis, B.P. Free-flow discharge estimations for piano key weir geometries. J. Hydro-environ. Res. 2018, 19, 160–167. [Google Scholar] [CrossRef]
  14. Leite Ribeiro, M.; Pfister, M.; Schleiss, A.J.; Boillat, A.L. Hydraulic design of A-type piano key weirs. J. Hydraul. Res. 2012, 50, 400–408. [Google Scholar] [CrossRef] [Green Version]
  15. Lempérière, F.; Ouamane, A. The piano key weir: A new cost-effective solution for spillways. Int. J. Hydropower Dams 2003, 10, 144–149. [Google Scholar]
  16. Machiels, O.; Pirotton, M.; Archambeau, P.; Dewals, B.J.; Erpicum, S. Experimental parametric study and design of piano key weirs. J. Hydraul. Res. 2014, 52, 326–335. [Google Scholar] [CrossRef]
  17. Magalhães, A.P.; Lorena, M. Perdas de Energiado do Escoamento Sobre Soleiras em Labirinto. (Energy Losses in Flow Over Labyrinth Weirs); SILUSBA: Lisboa, Portugal, 1994; pp. 203–211. (In Portuguese) [Google Scholar]
  18. Lopes, R.; Matos, J.; Melo, J. Discharge Capacity and Residual Energy of Labyrinth Weirs. In Hydraulic Model Report No. CH61/06, Proceedings of the International Junior Researcher and Engineer Workshop on Hydraulic Structures (IJREWHS ‘06), Montemor-o-Novo, Portugal, 2–4 September 2006; The University of Queensland: Brisbane, Australia, 2006; pp. 47–55. [Google Scholar]
  19. Lopes, R.; Matos, J.; Melo, J. Characteristic Depths and Energy Dissipation Downstream of a Labyrinth Weir. In Hydraulic Structures, Proceedings of the International Junior Researcher and Engineer Workshop on Hydraulic Structures (IJREWHS ‘08), Pisa, Italy, 20 July–1 August 2008; Pagliara, S., Ed.; Pisa University Press: Pisa, Italy, 2008. [Google Scholar]
  20. Lopes, R.; Matos, J.; Melo, J.F. Flow Properties and Residual Energy Downstream of Labyrinth Weirs. In Labyrinth and Piano Key Weirs; Erpicum, S., Laugier, F., Boillat, J.L., Pirotton, M., Reverchon, B., Schleiss, A., Eds.; CRC Press/Balkema: Boca Raton, FL, USA, 2011; pp. 97–104. [Google Scholar]
  21. Merkel, J.; Belzner, F.; Gebhardt, M.; Thorenz, C. Energy Dissipation Downstream of Labyrinth Weirs. In Proceedings of the 7th IAHR International Symposium on Hydraulic Structures, Aachen, Germany, 15–18 May 2018. [Google Scholar] [CrossRef]
  22. Al-Shukur, A.-H.K.; Al-Khafaji, G.H. Experimental study of the hydraulic performance of piano key weir. Int. J. Energy Environ. 2018, 9, 63–70. [Google Scholar]
  23. Leite Ribeiro, M.; Boillat, J.L.; Schleiss, A.J.; Laugier, F.; Albalat, C. Rehabilitation of St-Marc Dam. Experimental Optimization of a Piano Key Weir. In Proceedings of the 32nd IAHR Congress, Venice, Italy, 1–6 July 2007. [Google Scholar]
  24. Leite Ribeiro, M.; Boillat, J.L.; Schleiss, A.J.; Laugier, F. Coupled Spillway Devices and Energy Dissipation Systems at St-Marc Dam (France). In Labyrinth and Piano Key Weirs II—PKW 2013; CRC Press: Leiden, The Netherlands, 2011; pp. 113–121. [Google Scholar]
  25. Bieri, M.; Federspiel, M.; Boillat, J.-L.; Houdant, B.; Faramond, L.; Delorme, F. Energy Dissipation Downstream of piano key weirs—Case study of Gloriettes Dam (France). In Labyrinth and Piano Key Weirs—PKW 2011; CRC Press: Leiden, The Netherlands, 2011; pp. 120–130. [Google Scholar]
  26. Erpicum, S.; Machiels, O.; Archambeau, P.; Dewals, B.; Pirotton, M.; Daux, C. Energy dissipation on a stepped spillway downstream of a Piano Key WeirExperimental study. In Labyrinth and Piano Key Weirs—PKW 2011; CRC Press: London, UK, 2011; pp. 105–112. [Google Scholar]
  27. Erpicum, S.; Silvestri, A.; Dewals, B.; Archambeau, P.; Pirotton, M.; Colombié, M.; Faramond, L. Escouloubre Piano Key Weir: Prototype Versus Scale Models. In Labyrinth and Piano Key Weirs II—PKW 2013; CRC Press: Leiden, The Netherlands, 2013; pp. 65–72. [Google Scholar]
  28. Ho Ta Khanh, M.; Hein, T.C.; Hai, N.T. Main Results of the PK Weir Model Tests in Vietnam (2004–2010). In Labyrinth and Piano Key Weirs—PKW 2011; CRC Press: Leiden, The Netherlands, 2011; pp. 191–198. [Google Scholar]
  29. Silvestri, A.; Archambeau, P.; Pirotton, M.; Dewals, B.; Erpicum, S. Comparative Analysis of the Energy Dissipation on a Stepped Spillway Downstream of a Piano Key Weir. In Labyrinth and Piano Key Weirs II; Erpicum, S., Laugier, F., Pfister, M., Pirotton, M., Cicero, G.M., Schleiss, A.J., Eds.; CRC Press/Balkema: Leiden, The Netherlands, 2013; pp. 111–120. [Google Scholar]
  30. Jüstrich, S.; Pfister, M.; Schleiss, A.J. Mobil riverbed scour downstream of a piano key weir. J. Hydraul. Eng. 2016, 142. [Google Scholar] [CrossRef]
  31. Pfister, M.; Jüstrich, S.; Schleiss, A.J. Toe-scour formation at Piano Key Weirs. In Labyrinth and Piano Key Weirs III—PKW 2017; CRC Press: Leiden, The Netherlands, 2017; pp. 147–156. [Google Scholar]
  32. Truong Chí, H.; Huynh Thanh, S.; Ho Ta Khanh, M. Results of Some Piano Keys Weir Hydraulic Model Tests in Vietnam. In Proceedings of the 22nd ICOLD Congress, Barcelona, Spain, 18–23 June 2006. [Google Scholar]
  33. Palermo, M.; Crookston, B.M.; Pagliara, S. Analysis of Equilibrium Morphologies Downstream of a PK Weir Structure. In Proceedings of the EWRI World Environmental and Water Resource Congress, Las Vegas, NV, USA, 17–21 May 2020. [Google Scholar]
  34. Crookston, B.M. Labyrinth Weirs. Ph.D. Thesis, Department of Civil and Environmental Engineering, Utah State University, Logan, Utah, 2010. [Google Scholar]
  35. SonTek. FlowTracker Handheld ADV Technical Manual, Firmware Version 3.3 Software Version 2.2; SonTek/YSI Inc.: San Diego, CA, USA, 2007. [Google Scholar]
  36. Anderson, R.M.; Tullis, B.P. Piano key weir hydraulics and labyrinth weir comparison. J. Irrig. Drain. Eng. 2013, 139. [Google Scholar] [CrossRef]
  37. Young, N.L. Size-Scale Effects of Nonlinear Weir Hydraulics. Master’s Thesis, Utah State University, Logan, Utah, 2018. Available online: https://digitalcommons.usu.edu/etd/6926 (accessed on 1 November 2018).
  38. Pagliara, S.; Palermo, M.; Carnacina, I. Scour process due to symmetric dam spillways crossing jets. Int. J. River Basin Manag. 2011, 9, 31–42. [Google Scholar] [CrossRef]
  39. Crookston, B.M.; Tullis, B.P. Labyrinth weirs: Nappe interference and local submergence. J. Irrig. Drain. Eng. 2012, 138, 757–765. [Google Scholar] [CrossRef]
  40. Crookston, B.M.; Tullis, B.P. Hydraulic design and analysis of labyrinth weirs. II: Nappe aeration, instability, and vibration. J. Irrig. Drain. Eng. 2013, 139, 371–377. [Google Scholar] [CrossRef]
  41. Erpicum, S.; Tullis, B.P.; Lodomez, M.; Archambeau, P.; Dewals, B.; Pirotton, M. Scale effects in physical piano key weirs models. J. Hydraul. Res. 2016, 54, 692–698. [Google Scholar] [CrossRef] [Green Version]
  42. Tullis, B.P.; Crookston, B.M.; Young, N. Scale effects in free-flow nonlinear weir head-discharge relationships. J. Hydraul. Eng. 2019, 146. [Google Scholar] [CrossRef]
Figure 1. Overview of the new Piano Key weir (PK weir) under construction at West Fork of Eno Reservoir Dam (North Carolina, USA). (a) Looking upstream; (b) across weir towards right wingwall, and (c) looking downstream. Photos courtesy Schnabel Engineering.
Water 12 01253 g001
Figure 2. Geometric overview of PK weir geometries investigated herein.
Water 12 01253 g002
Figure 3. Experimental setup overview.
Water 12 01253 g003
Figure 4. Type A PK weir (Wi/Wo = 1.28) with flow field modification due to structure geometry and energy dissipated in part by outlet keys including upstream face and jet interaction.
Water 12 01253 g004
Figure 5. Type A PK weir flow field in section.
Water 12 01253 g005
Figure 6. Downstream flow field of Type A PK weir for (a) H/P = 0.23 and (b) H/P = 0.12.
Water 12 01253 g006
Figure 7. Relative energy dissipation [(H0 − H1)/H0] with respect to (a) the head water ratio (H/P) and (b) unit discharge (q) for Type A PK weirs.
Water 12 01253 g007
Figure 8. Relative residual energy (H1/H0) with respect to (a) the head water ratio (H/P) and (b) unit discharge (q) for Type A PK weirs.
Water 12 01253 g008
Figure 9. Observed and predicted values of relative residual energy using Equation (1) and Table 3.
Water 12 01253 g009
Figure 10. Observed and predicted values of relative residual energy using Equation (2).
Water 12 01253 g010
Table 1. Type A PK weir energy dissipation model summary.
ModelRange of HWi/WoWiPLBNFlume
(m)(mm)(m)(m)(m)
PK 1.500.014–0.1861.50124.70.204.820.5042
PK 1.280.020–0.2111.28248.40.425.151.0421
PK 1.250.014–0.1881.25115.60.204.750.5042
PK 1.000.014–0.1871.00103.90.204.810.5042
Table 2. Q comparison for corresponding H between the present study and published data for Type A PK weir.
GeometryPublished Data0.2 ≤ H/P0.2 ≤ H/P ≤ 0.9
MAPE 1RMSE 2MAPE 1RMSE 2
PK 1.50Anderson and Tullis (2013) [36]3.12%0.01134.97%0.0327
PK 1.28Young (2018) [37]1.79%0.00613.39%0.0226
PK 1.25Anderson and Tullis (2013) [36]1.94%0.00863.01%0.0179
PK 1.00Anderson and Tullis (2013) [36]1.15%0.00451.86%0.0103
1 MAPE = Mean Absolute Percentage Error; 2 RMSE = Root Mean Square Error.
Table 3. Coefficients corresponding to Equation (1) and values of R2, MAPE, and RMSE.
GeometryABCR2 1MAPE 2RMSE 3
PK 1.500.76990.21070.010.99312.83%0.0154
PK 1.280.78350.21080.010.99542.27%0.0113
PK 1.250.75280.20880.020.99941.29%0.0062
PK 1.000.74780.20750.100.99930.75%0.0046
1 R2 = coefficient of determination; 2 MAPE = Mean Absolute Percentage Error; 3 RMSE = Root Mean Square Error.
Table 4. Values of R2, MAPE, and RMSE corresponding to Equation (2).
GeometryR2 1MAPE 2RMSE 3
PK 1.500.99816.84%0.0313
PK 1.280.99432.73%0.0146
PK 1.250.99906.93%0.0320
PK 1.000.99943.10%0.0150
1 R2 = coefficient of determination; 2 MAPE = Mean Absolute Percentage Error; 3 RMSE = Root Mean Square Error.