Abstract
Floating oscillating water column (OWC) type wave energy converters (WECs), compared to fixed OWC WECs that are installed near the coastline, can be more effective as they are subject to offshore waves before the occurrence of wave dissipation at a nearshore location. The performance of floating OWC WECs has been widely studied using both numerical and experimental methods. However, due to the complexity of fluid–structure interaction of floating OWC WECs, most of the available studies focus on 2D problems with WEC models of limited degrees-of-freedom (DOF) of motion, while 3D mooring effects and multiple-DOF OWC WECs have not been extensively investigated yet under 2D and 3D wave conditions. Therefore, in order to gain a deeper insight into these problems, the present study focuses on wave flume experiments to investigate the motion and mooring performance of a scaled floating OWC WEC model under 2D wave conditions. As a preparatory phase for the present MaRINET2 EsflOWC (efficiency and survivability of floating OWC) project completed at the end of 2017, experiments were also carried out in advance in the large wave flume of Ghent University. The following data were obtained during these experimental campaigns: multiple-DOF OWC WEC motions, mooring line tensions, free surface elevations throughout the wave flume, close to and inside the OWC WEC, change in the air pressure inside the OWC WEC chamber and velocity of the airflow through the vent on top of the model. The tested wave conditions mostly include nonlinear intermediate regular waves. The data obtained at the wave flume of Ghent University, together with the data from the EsflOWC tests at the wave flume of LABIMA, University of Florence, provide a database for numerical validation of research on floating OWC WECs and floating OWC WEC farms or arrays used by researchers worldwide.
1. Introduction
Oscillating water column (OWC) wave energy converters (WECs) consist of a partially submerged reservoir with a water column (open to the sea below the waterline) and a column of trapped air. The incident waves change the water level inside the reservoir, which in turn compresses and decompresses the air column. This trapped air is allowed to flow to and from the atmosphere through a turbine where its rotation is used to generate electricity. A comprehensive review of the history and development of OWC WECs has been given in [1], where several OWC WEC concepts such as the Backward Bend Duck Buoy (BBDB) OWC [2], the Spar Buoy [3] and the U-Gen WECs [4] are introduced.
OWC WECs can be classified as fixed (onshore) or floating (offshore). The fixed onshore devices are usually mounted on coastal structures, such as the breakwater of Mutriku in Spain [5] or the REWEC3 breakwater in Italy [6]. Integrating an OWC device, or more in general, a WEC, into a coastal structure has some recognized advantages, mainly from an economic point of view (as recently reviewed in [7]). However, for fixed onshore OWC WECs, the incident waves that propagate towards the shallow coastal waters lose part of their energy content due to dissipation mechanisms arising from the wave-bottom interaction. Indeed, in rare cases, focusing mechanisms triggered by the refraction phenomenon may lead to coastal hotspots where the local wave energy is higher than the related offshore energy, as proved by [8], but, most often, the nearshore wave energy content is much lower than the foreshore counterpart. Consequently, offshore floating OWC WECs can be a better option in order to exploit a higher wave energy potential. However, there are still challenges to be overcome in order to increase the performance and commercial competitiveness of such offshore floating OWC devices. One of the main challenges is related to the mooring system in terms of the lifetime of the floating OWC WEC under extreme wave conditions and implications in the device efficiency. The floating OWC WECs must be able to cope with a wide range of realistic wave conditions, maintaining efficiency despite a significant variation of the incoming wave power flux.
Physical model tests are essential to investigate the governing physical processes of the floating OWC WECs. Besides, physical model tests are essential to calibrate and validate numerical models aimed at further optimization. The first experimental studies on OWC WECs focused on 2D problems in wave channels. In most cases, these tests were small-scale tests with fixed OWC WECs ([9,10,11]). Within the tests, they measured water surface elevation changes along the channel, the pressure difference in the OWC chamber, and air velocity at the orifice (only in [11]). Experimentally, floating OWC WECs are considerably less studied. For floating OWC WECs, the mooring spring elasticity plays an essential role in power capture and efficiency, as discussed in [12]. However, such previous studies are focused on heave-only motion. An OWC WEC with a spar buoy configuration is analyzed in [13]. They conducted experiments at a very small-scale (1:120) using soft mooring lines, but they neither measured tensions in the lines, nor did they study extreme conditions. In a more recent study, both fixed and floating–moored OWC WECs were tested with a scale of 1/50 [14]. They measured several parameters by conducting a comprehensive experiment with tight mooring lines. They focused on the maximization of the OWC performance, so they used tension legs in order to maximize the relative motion between the internal water column and the device walls. However, they did not focus on mooring dynamics. The idea to assemble many single units of OWC WECs on a very large floating structure (VLFS) for installation in the Mediterranean Sea and a preliminary assessment of performance comparison between fixed and floating conditions is presented in [15]. The results showed a considerable relevance between energy output efficiency, incident wave frequency, and the floating behaviour of the VLFS.
Mooring line tensions and extreme conditions performance are two critical fundamental aspects of the design of the floating OWC WECs. The mooring system plays a significant role in the overall OWC WEC efficiency. The failure of Wave Dragon is an example of how the main mooring connection broke and the platform drifted towards the shore during the storm [16]. Therefore, all essential governing physical processes should be measured for a complete design. It is important to measure simultaneously: water surface variation in the chamber and at the vicinity of the model, tension loads originating from the mooring lines, air velocity in the air tube orifice, pressure variations in the model chamber, and all 6 DOF of the model motions. If the air in the OWC chamber behaves as an incompressible fluid (as it happens in case of specific testing conditions), measuring the air pressure and water level variations in the chamber is enough for determining the airflow velocity through the vent [14]. Meanwhile, different numerical models are established to simulate the dynamics of OWC WECs. These models allow the computation of quantities that can be difficult or impossible to obtain in laboratory experiments. They also expedite the evaluation of many different design parameters and environmental conditions. In recent years, the behavior of the coupled motion of the OWC WEC and the mooring system are topics of interest in numerical studies.
Thus, the primary objective of the present work is to study the fluid–structure interaction between ocean waves and a floating OWC WEC moored to the sea bed to cover the above knowledge gaps. To achieve this objective, an experimental database, freely available for public use by the scientific community and containing all significant variables related to floating OWC WECs, has been created (i.e., free-surface elevation and air pressure changes inside the chamber, air flux between the chamber and the atmosphere, tensions in the mooring lines, and the motion of the OWC WEC within the experimental campaign performed for the EU EsflOWC MaRINET2 project). The data will be used for the validation of numerical models and the basic understanding of the governing physical phenomena. In this manner, smoothed particle hydrodynamics (SPH) solver DualSPHysics, coupled with the inelastic catenary theory, is used to numerically simulate a floating and moored OWC WEC [17].
A preliminary test with a 1:25 scaled (Froude Scale) floating OWC WEC model was conducted in the large wave flume of Ghent University (GGG-UGent) in Belgium [18] in preparation of the EU EsflOWC MaRINET2 tests that were later conducted at LABIMA of the University of Florence. In both mentioned works, the OWC model that had already been studied in fixed conditions, experimentally and numerically, by [19,20] was tested in the floating conditions. The primary purpose of the tests conducted at the Ghent University was to assess the OWC WEC response and mooring line tensions using two types of mooring materials, including nylon rope and an iron chain. Then, the new work conducted at LABIMA was based on the lessons learned from that work.
The present article is structured as follows: a detailed overview of the design and execution procedure of the experiments and the EsflOWC database is given in Section 2. In Section 3, experimental results are presented for OWC WEC and BOX models. A summary of the findings and the characteristics of the EsflOWC database are presented in Section 4. Finally, discussions and conclusions are given in Section 4.
2. Physical Modelling of a Moored Floating OWC WEC
2.1. Experimental Set-up in the Wave Flume
The experiments were performed in the Wave–Current flume of the Maritime Engineering Laboratory (LABIMA) at Florence University (abbreviated as “LABIMA-WCF”) in Italy. The LABIMA-WCF is a structure entirely made of steel and glass side walls, with a total length of 37.0 m and a width and height of 0.8 m. The piston-type wave generator is installed at one end of the wave flume, and it has a stroke equal to 1.5 m, driven by an electromechanical system with an absolute encoder of 0.01 cm accuracy in position.
As a passive absorber, a submerged rubble-mound breakwater (made of 4 to 6 kg stones, with a total length of 200 cm and crest submergence of 5 to 10 cm) and a perforated planar sloping (2.4 long, with holes of 1 cm diameter, in a 2 × 2 cm grid, and positioned with a slope of 1/3) was left in place during the tests to reduce further wave reflection (Figure 1). The measured wave reflection coefficient Kr for the whole dissipative system is in the range of 10% to 20% for the tested range of wave heights (H = 0.05–0.17 m), periods (T = 0.8–2.3 s) and water depth (d = 0.50 and 0.6250 m).

Figure 1.
Experimental set in the LABIMA-WCF (Wave–Current flume of the Maritime Engineering Laboratory (LABIMA) at Florence University) wave flume. A submerged breakwater and a perforated sloping beach are used for absorption of reflected waves at the end of the wave flume: (a) plan view, (b) middle line cross-section (all dimensions are in cm).
2.2. Floating Bodies of the Tested BOX and OWC WEC Scale Models
Two different models with a scale factor (Froude Scale) of 1:50, located 1823 cm away from the wave paddle, were tested. The first one is a floating closed box (referred to as “BOX” hereafter), and the second one is the model of a generic floating “OWC WEC.” The geometry of the OWC WEC tested during this study corresponds closely to that of the fixed OWC WEC previously studied at LABIMA-WCF, both experimentally and numerically ([11,19,21]).
The BOX model has dimensions of 200 × 200 × 132 mm and is made of light PVC material with a density of 570 kg/m3 (Figure 2). A 324 mm high plate is attached to the front face of the BOX, on which reflective markers have been installed to be used by the OptiTrack 6-DOF motion tracking system (four grey spheres in Figure 2b).
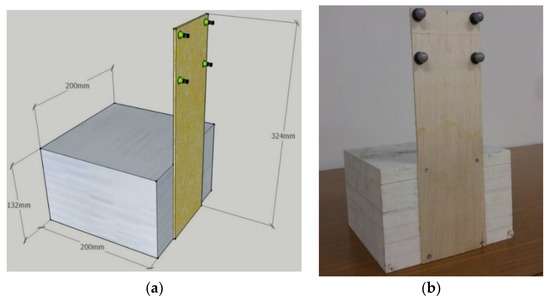
Figure 2.
The BOX model: (a) sketch and dimensions; (b) the BOX model as built with its front plate with four reflective markers.
The OWC WEC model has a rectangular prism shape with 200 × 200 × 440 mm dimensions. The model was initially destabilized because the frontal and the back walls are asymmetrical to the principal symmetrical axis. Therefore, extra ballast is required to lower down the center of gravity (COG) to prevent capsizing. A 3D sketch of the OWC WEC model geometry (Figure 3a,b), the actual model built (Figure 3c), and the side cross-section of the model (Figure 3d) are shown in Figure 3. The main structure is built by using a light PVC material with a density of 570 kg/m3. In addition, there are light expanded polystyrene (EPS) foam blocks around the four sides; both the buoyancy and stability were enhanced to ensure safe operation during the tests. Orifices were drilled on the top plate of the scale model to simulate the OWC WEC turbine power-take-off (PTO) damping. The OWC WEC model was tested using three different orifice diameters (Table 1). The total mass of 778 g from the extra floaters (15 × 75 mm, thickness × height, indicated using pink color in Figure 3a) and bottom hanging weights (indicated using green color in Figure 3a) were attached to the model to ensure its balance. The extra weight of 55 g was attached on top of the model on the back wall, to satisfy the balance. The total weight of the four-ball markers (equal to those used in Figure 3c) used by the video motion tracking system was 6 g (1.5 g × 4). The weight of the air tube attached on the cover orifice (yellow color in Figure 3) and the support structure for the hot wire anemometer is 98 g for OWC WEC1, 58 g for OWC WEC2, 38 g for OWC WEC3; since OWC WEC4 had no top cover, no weight for the air tube and support structure was added. The total mass of each OWC is shown in Table 1. The center of gravity coordinates (XG and ZG) in Figure 3d are presented in Table 1. The model is symmetrical along the wave flume y-axis, and therefore YG has 0 mm offset from the Y-direction center plane.
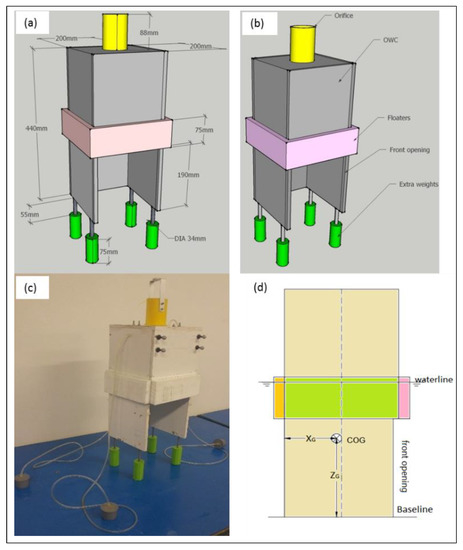
Figure 3.
The OWC WEC scale model: (a) 3D sketch showing all basic dimensions; (b) 3D sketch showing all important parts; (c) photo of the actual model with reflective markers attached; (d) cross-section along the middle X–Z plane and center of gravity (COG).

Table 1.
Specifications of floating oscillating water column type wave energy converter (OWC WEC) variants with different orifices.
2.3. Mooring System of the Tested BOX and OWC WEC Scale Models
The mooring system connects the scale models (BOX and OWC WEC) to the wave flume bottom through four chains with a length of each (Figure 4). The mooring chains are connected to monoaxial load cells (LCs) through soft cotton ropes passing through eye hooks to avoid cross-field disturbance effects and to transfer just the horizontal mooring line force (Figure 4). The LCs are used to measure mooring line tensions. The length of the rope between the eye hook and the chain end is 85 mm. The LCs are fixed on a 15 mm thick plate (see the yellow plate in Figure 4a,b). The overall distance of the LC connection point from the wave flume bottom is 43 mm. The LC measuring axis is arranged to be parallel to the tensile forces exerted by the mooring chain. The chain weight is 0.607 g/cm, and the volume is 0.105 cm3/cm. The length of each chain element is 0.8 cm. The elasticity properties of the chain are acquired through tensile tests performed at the laboratory of Ghent University, and the elasticity of the chain in small amplitude deformation is 18.95 N/mm.
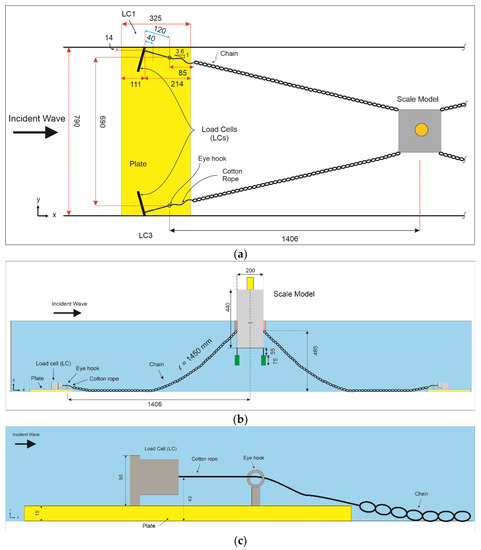
Figure 4.
(a) Top view, (b) front view of the mooring system used for the BOX and the OWC WEC models, (c) detail of the load cell (LC) connection to the wave flume bottom (all dimensions are in mm).
2.4. Instrumentation
The wave flume is instrumented with ten ultrasonic wave gauges (abbreviated as WGs) to measure the incident and the reflected waves (Figure 1). The employed WGs measure the free surface displacement with an accuracy of 1 mm at a distance from the sensor in the range 60–500 mm and belong to Series 943-M18-F4V-2D-1C0-330E by HONEYWELL (Figure 5a).
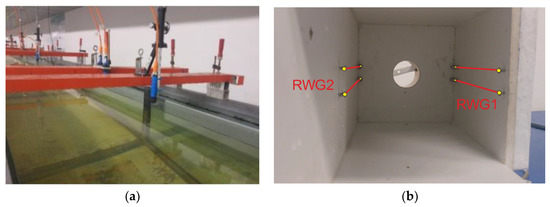
Figure 5.
Wave gauges used in the experimental setup, (a) ultrasonic wave gauges (WGs) installed along the wave flume, (b) resistive type wave gauges (RWGs) installed inside the OWC WEC chamber (wires are highlighted in red). Photo is taken from the bottom of the OWC WEC chamber looking upwards in the direction of the OWC WEC orifice.
As indicated in Figure 1, along the centreline of the wave flume, and starting from the wave paddle, two WGs are located before (WG1 and WG2), and six WGs are located after, the model (WG5–WG10). At the location of the model, two WGs are installed along both sides of the model (WG3 and WG4). The last three WGs (WG8, WG9, WG10) are located close to the passive absorption dissipative beach and are used for wave reflection analysis according to the Mansar and Funke Method [22] (see Table 2 for distances between the WGs).

Table 2.
Distances of the ultrasonic WGs from the wave paddle and position of the scale model (OWC WEC/BOX).
Two resistive wave gauges (RWGs) are installed inside the chamber of the OWC WEC model to measure the water surface variation in the chamber, which is directly related to the velocity of the water surface inside the chamber and the airflow rate at the PTO. RWG1 is installed on the internal side of the OWC WEC front wall (with regards to the wave propagation direction), and RWG2 is installed on the internal side of the OWC WEC rear wall (Figure 5b). The sampling frequency of the RWGs is 1 kHz.
The four LCs, installed on the bottom of the wave flume to measure tension loads originating from the mooring lines (Figure 4 and Figure 6a), are monoaxial load cells and have a measurement capacity of FS = 5 kg and an accuracy of ±0.01 %FS.
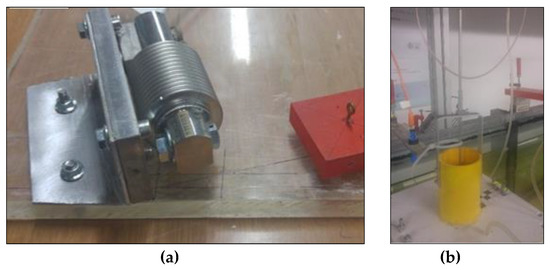
Figure 6.
(a) Load cells (LCs), (b) hot-wire anemometer (HWA).
A hot-wire anemometer (abbreviated as HWA) was used to measure air velocity in the air tube (Figure 6b). The height of the tube is 88 mm (see the yellow tube in Figure 3a), and the sensor was placed in the middle of it.
Differential pressure transducers (abbreviated as PTs) of the KELLER Series 46X (Figure 7a) with a full scale (FS) of 100 mBar and accuracy of ±0.1 %FS have been used to measure pressure variations in the OWC WEC chamber. These pressures are sensitive to changes in the water surface elevation in the chamber. The locations of their attachment on the OWC WEC model are shown in Figure 7e. Each transducer is located outside the wave flume (Figure 7a,b) and is connected to the OWC WEC model through a small flexible plastic tube (see transparent small tubes in Figure 7c,d) which can transmit pressure variation insight the OWC WEC chamber without adding any additional weight on the model, and thus without affecting externally its dynamics. Two tubes are located on both sides of the OWC WEC, while the third one is located on the top of the OWC (Figure 7c,d).
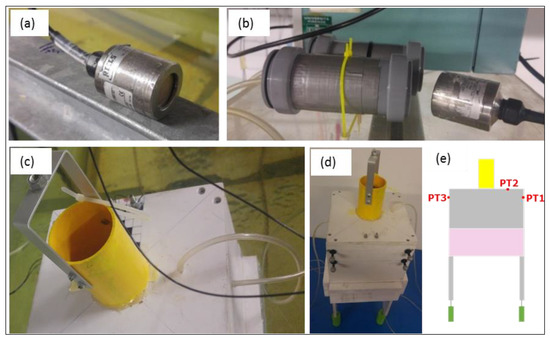
Figure 7.
(a) Pressure transducers (PTs), (b,c) set-up of the pressure transducers on the floating OWC model (b,c,d), and (e) sketch of the PTs position on the OWC and pressure transducers’ (PTs) naming.
Moreover, a video motion tracking (abbreviated as VT) system OptiTrack, which uses a camera to process the location of a moving object (or multiple objects), with up to six degrees of freedom (6-DOF) of motion (see Figure 8) over time, is installed. During the present tests, the VT used three cameras, which were aligned on a metal bar (see Figure 9). The VT system was located perpendicular to the LABIMA-WCF axis, at a distance of 17.1 m from the wave paddle (see Figure 1). A sketch of the coordinate system used for the obtained 6-DOF data is shown in Figure 9b.
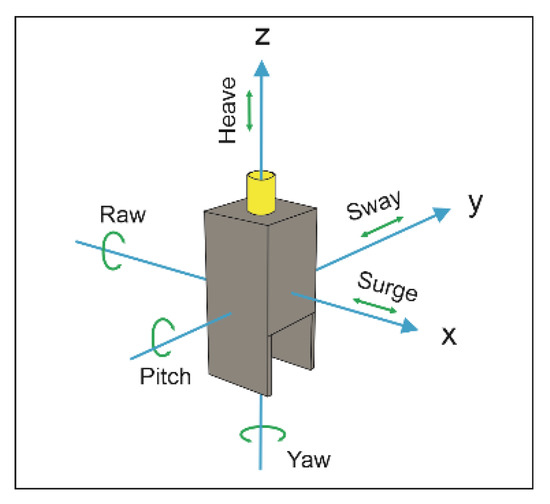
Figure 8.
Definition sketch for six degrees of freedom (6-DOF).
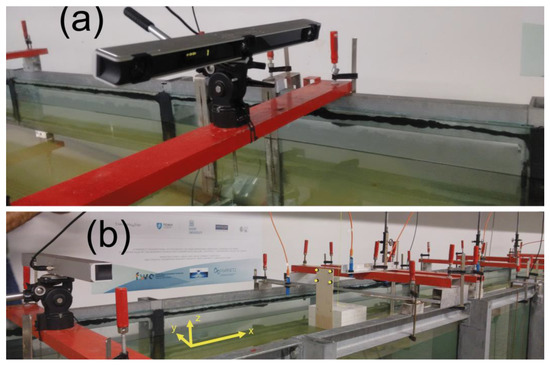
Figure 9.
The OptiTrack video motion tracking system (VT): (a) the three cameras of the VT attached on a single axis; (b) the VT facing the four “ball” markers attached to the BOX model and sketch of the coordinate system used for the VT.
The sampling frequency of each sensor (i.e., WGs, RWGs, LC, PTs, and VT) was 1 kHz.
2.5. Hydrodynamic Conditions Used for the Test Matrix
A total of 41 different combinations of wave and test conditions have been included in the test matrix (Table 3). Among these 41 sets of wave conditions, it has been observed for 8 cases (H15, H16, H21, H22, H28, H34, H35, H38), either the wave breaking occurs in a zone immediately after the wave paddle, or there was an overflow of water along the lateral sidewalls of the wave flume. Therefore, they were not considered further in the database. Tests H07 and H14 were repeated ten times each to create specific benchmarking tests for validation of numerical models. In total, these 33 conditions were tested by using the scaled BOX model, and the scaled OWC WEC models with four different orifices at the top (see Table 1). Most of the tests were run in a water depth of 60 cm, while tests H39, H40, and H41 were also repeated in a water depth of 50 cm for the case of the OWC WEC.

Table 3.
Tests matrix showing hydrodynamic conditions for regular waves, test duration, and the naming of the performed tests.
A series for device decay tests was performed to study the pitch, roll, surge, heave, sway, and yaw of both the BOX and OWC WEC models. A total of 229 tests was conducted.
All presented H and T are target wave condition values, which means that the H and T values resulting from the Fourier transformation analysis are slightly different from the target values. This is because all presented results refer to test cases where the model is always present in the wave flume. As such, wave radiation, diffraction, and reflection induced by the floating objects are included in the presented results.
Figure 10 shows the diagram of the applicability of different theories of water waves [23]. Most of the waves are in the zone of nonlinear wave theory, and they fulfill the condition of the Stokes 2nd order wave theory in intermediate water depths.
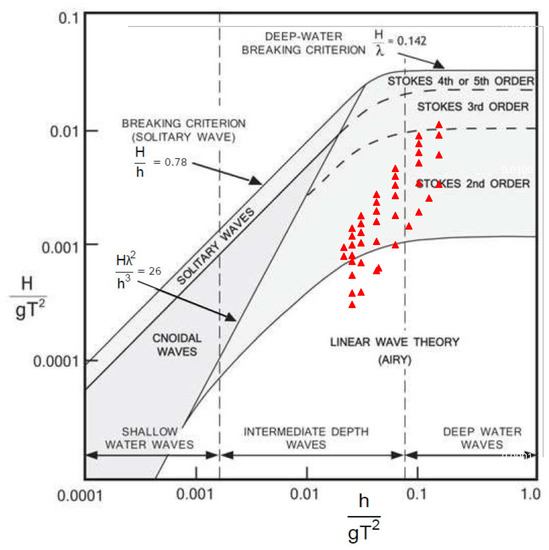
Figure 10.
Diagram of applicability of different theories of water waves: Le-Méhauté [23]. The wave height H and the water depth d are normalized by gT^2, where g is the gravity acceleration and T is the wave period.
2.6. Uncertainty Sources
There are several uncertainty sources related to the obtained experimental data, which should be considered. The sources of uncertainty are listed as following:
- (1)
- The length, and weight, volume per unit length and material elasticity of the mooring line, the locations of loadcells and fairleads, and the tensions are the source of the uncertainties in the mooring system.
- (2)
- The geometrical dimensions of the model, the mass, the center of gravity, and momentum of inertia of the model, the spatial position of the model, including the initial position and the 6-DOF motion, are the source of uncertainties related to the scaled model.
- (3)
- For the wave generation system, uncertainties are related to the measurement of the wave surface elevation and the wave period.
3. Results
The behavior of the floating OWC WEC under wave action is analyzed based on the recommended guidelines of the tank testing of wave energy conversion systems and the ITTC seakeeping procedure [24]. Here, the results of test H14 (d = 0.625 m, H = 0.1 m, and T = 2.1 s), which was repeated ten times, are presented to show the repeatability of the test conditions and the obtained measurements. H14 has a moderate condition among the test matrix, and it is rather easy to repeat the tests without extra difficulties. The parameters of wave height variation in and out of the OWC WEC chamber, the 6-DOF model response, tension loads originating from the mooring lines, air velocity, and pressure variations in the OWC WEC chamber, are investigated.
3.1. Wave Height Evaluation Along the LABIMA Wave–Current Flume
Free surface displacements were measured along the wave flume using ten ultrasonic WGs of Figure 1. Figure 11 shows the results at flume WG2 and WG9, which are located before and after the OWC WEC model, respectively. Tests were run for 30 nonlinear regular waves. The phase differences between gauges WG2 and WG9 were eliminated to show the wave height variations of every single wave before and after the OWC WEC. The measured average wave heights are and . The difference is mainly due to the presence of OWC WEC, which absorbs energy from the incoming waves and energy dissipation mechanisms taking place during wave propagation along the flume.
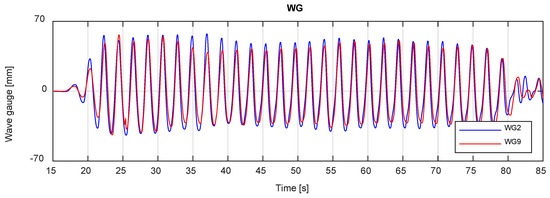
Figure 11.
Wave height time series for 30 nonlinear regular waves measured by WG2 and WG9. The phase difference between WG2 and WG9 were eliminated manually (H14: d = 0.625 m, H = 0.1 m, and T = 2.1 s).
3.2. OWC WEC Motions in Six Degrees of Freedom
The OWC WEC 6-DOF motions as a response to the incident waves are shown in Figure 12. As waves are regular, 2D, and long-crested, the observed significant OWC WEC model motions are surge, heave, and pitch. The sway motion amplitude is in a negligible range. The amplitude of the heave motion is very close to the incident wave amplitude, whereas the surge motion range is controlled and restrained by the mooring chain length. The surge and heave components led to a pitch motion of the OWC WEC ranging between −7.5 and +7.5 degrees.
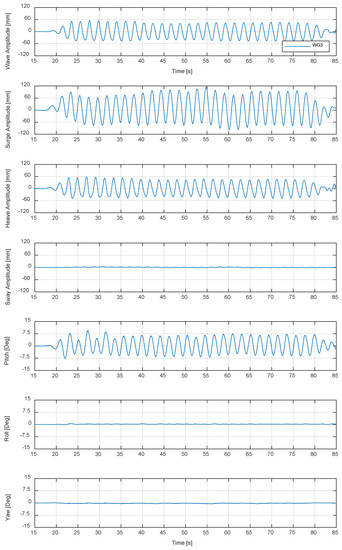
Figure 12.
OWC WEC motions with incident waves (WG3, surge, heave, sway, pitch, roll, and yaw) for test H14 (d = 0.625 m, H = 0.1 m, and T = 2.1 s).
3.3. Comparison of Different Measurements on OWC WEC Model
Figure 13 represents the simultaneous results of five different instrumentations for the case H14 (d = 0.625 m, H = 0.1 m, and T = 2.1 s). All results are synchronized. Free surface variation in the channel is measured by WG3 and WG4, which are installed at the model location. Water column surface oscillation amplitudes inside the OWC WEC chamber are rather low compared to the outside of the chamber, and they have a double peak. RWG signals are out of phase due to the differences in locations along the x-axis. The tested hydrodynamic condition (H14) is a moderate wave condition in which all chains stay on the ground and do not transmit the tension loads to LCs. The small variations on the LCs signals are related to the oscillation of the terminal part of the mooring chain (the one close to the LC), which was maintained partially detached from the bottom due to the specific connection whit LC via the cotton rope. (see LCs in Figure 13). Therefore, LCs in the same location, e.g., LC1 and LC3, have an in-phase and reflect the free surface variations. The variation of the water surface elevation and the air pressure inside the chamber represent the air exchange rate through the orifice so that the velocity of the water surface inside the chamber and the airflow rate at the PTO can be calculated, assuming air compressibility effect is negligible for small-model scales [14,25]. In fact, the air compressibility does not take place at the scale of the tested, as proved by [25], and the experimental measurements can be corrected in the later processing of data results, as proposed by [26]. Compare to the other sensor results, pressure sensor and hot-wire anemometer results show high scatter, which means they are more sensitive to any change in the water surface elevation inside the chamber.
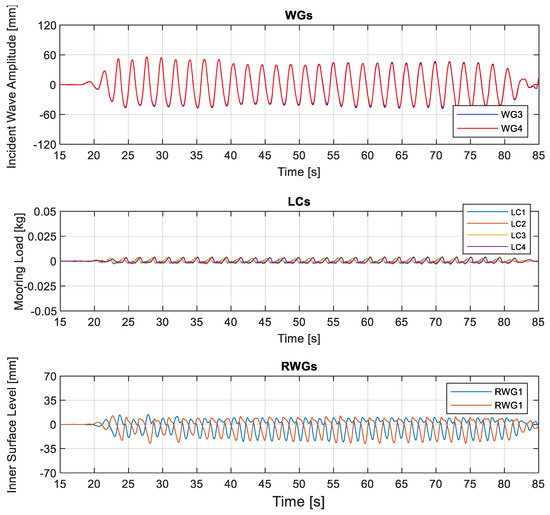
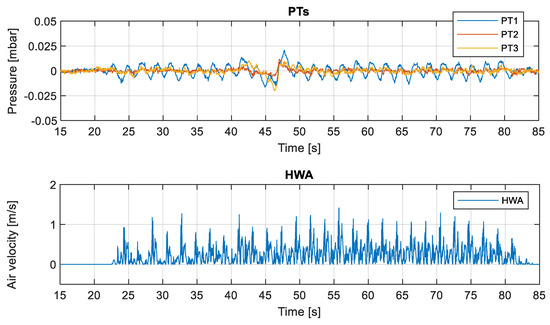
Figure 13.
Overview of simultaneous measurements: (a) WG3 (located at the model location), (b) RWG1, (c) LC1, (d) PT1, and (e) hot-wire anemometer (HWA) for H14 (d = 0.625 m, H = 0.1 m, and T = 2.1 s).
3.4. Repeatability of the Measured Data
In general, the randomness of the experimental process is characterized by the repeatability of the test, which defines the uncertainty level of the obtained measurements. The number of repetitions should be as high as possible to quantify uncertainty [24]. Therefore, some selected tests were repeated ten times, based on experimental practice. Figure 14 shows test results for the surge, heave, mooring load, pressure, and air velocity for the repetition test of H14 (d = 0.625 m, H = 0.1 m, and T = 2.1 s) compared to the results of Figure 14. Surge, heave, and mooring measurements are well repeatable. However, pressure and air velocity results show a variation between the repeated tests.
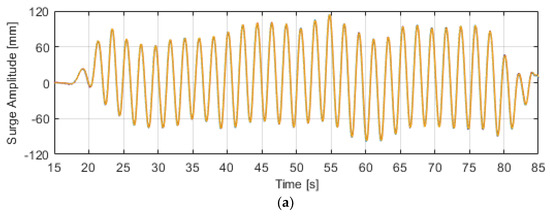
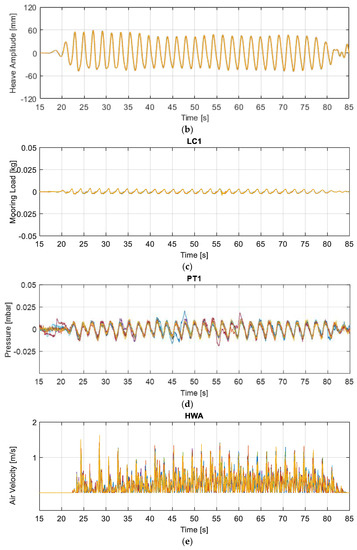
Figure 14.
Testing the repeatability of the measurements under the identical conditions (H14: d = 0.625 m, H = 0.1 m, and T = 2.1 s), the tests were repeated ten times. (a) surge, (b) heave, (c) mooring load, (d) air velocity, and (e) pressure.
The repeatability of the individual waves in a wave train is different from each other (see Figure 14). To quantify, the means and standard deviations of each wave are calculated separately. Table 4 shows the minimum and maximum standard deviations among the thirty individual waves in a wave train.

Table 4.
Minumum and maximum standart deviations and related mean values of the repeated measurements.
3.5. Variation of Water Surface Elevation inside the OWC WEC Chamber
The change in air flux is determined by the mean water surface variation inside the OWC WEC chamber. Therefore, the variation of the water surface elevation in the chamber plays a critical role. Based on this, comparisons between the water surface elevation change in and out of the OWC WEC are made for various wave conditions. Figure 15 shows the water surface variations in and out of the OWC WEC chamber recorded by RWG1 (inside the OWC WEC chamber) and WG3 (located at the OWC WEC model), respectively. Two different wave conditions are considered (H14: d = 0.625 m, H = 0.1 m, and T = 2.1 s; H36: d = 0.625 m, H = 0.17 m, and T = 1.6 s). The water surface elevation amplitude in the chamber decreases by approximately ≈65% as the incident wave height measured by WG3 (Figure 15a). Figure 15b shows a resonance case at ( is the resonance period). This indicates a narrow frequency band of optimum power output.
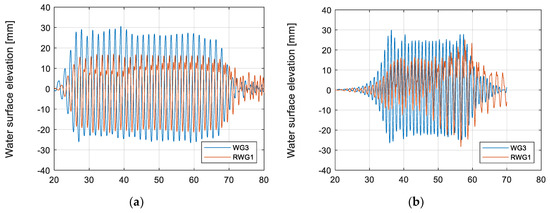
Figure 15.
Water surface variation for 30 nonlinear regular waves measured by WG2 and RWG1 (a) d = 0.625 m, H = 0.6 m, and T = 1.6 s, (b) d = 0.625 m, H = 0.6 m, and T = 1.0 s.
As it is mentioned, most of the waves are nonlinear regular waves and fulfill the condition of the Stokes 2nd order wave theory in intermediate water depths. WG results from Figure 12, Figure 13, and Figure 15 show the nonlinearity of the incident waves. Being in the intermediate water depth is the reason for the nonlinearity of the incident waves.
3.6. Mooring Line Tensions
The motion response to nonlinear regular waves is defined as the motion amplitude of a floating object in regular waves per unit amplitude. The tensions in the mooring lines are also developed as a response to the WEC motions. By varying the frequency of the incident wave, a motion response curve can be obtained to depict the motion characteristics of the floating system in the frequency domain.
Figure 16a illustrates the maximum horizontal components of the chain mooring line tensions measured by all four loadcells as a function of wave period (T) and wave height (H) for orifice OWC3. Figure 16b shows the variation of normalized heave and surge motions of the OWC WEC. The heave and surge motion response is expressed by a division of the mean single motion amplitude over an averaged wave amplitude as or , where . Examples are given for the regular wave conditions of T = 0.8, 1, 1.3, 1.6, 1.9, and 2.1 s and H = 0.05 and 0.08 m, as presented in Figure 16.
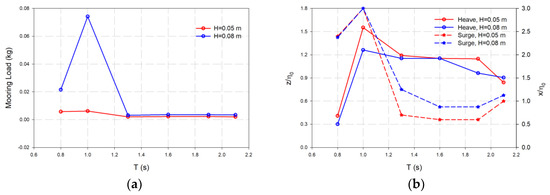
Figure 16.
OWC WEC mooring line tension response for the heave and surge motions as a function of wave period (), (a) mooring loads, (b) normalized surge () and heave () motions (OWC3: d = 0.625 m, and H = 0.05, and H = 0.08 m).
The motion response curves for both heave and surge motions have peak values of and respectively. Although the motion is regular, nonlinear effects are obvious. The resonance periods in surge and heave of the OWC WEC model are observed at as plotted in Figure 16. For a wave period of , the OWC WEC surge and heave motion response reaches a maximum value. Consequently, tensions at the mooring lines reach their maximum at .
Moreover, as shown in Figure 12, the pitch motion of the BOX contains strong nonlinearity and is rather irregular. This is due to a combined effect of the nonlinear incident waves and of the mooring lines. For a moored floating OWC WEC, the motion response information reflects its motion amplitude, provides its natural frequency, and reveals nonlinear effects due to the mooring system and the incoming waves.
4. Conclusions
Under the framework of the EU EsflOWC MaRINET2 project, an experimental study for investigating the 6-DOF motion and mooring line tension characteristics of 1:50 scaled slack-moored floating OWC WEC and BOX models under regular waves is presented. Different wave conditions, power-take-off damping characteristics, and mooring line tensions were studied. Researchers will further use the datasets as a benchmark case for further development of fully nonlinear numerical models used to simulate the behavior of moored floating objects.
Free surface displacements were measured along the wave flume using ten ultrasonic WGs. The wave height variations of every single wave before and after the OWC WEC are shown. The difference is due to the presence of OWC WEC, which absorbs energy from the incoming waves.
6-DOF motions of the OWC WEC are shown as a response to the incident waves. The surge, heave, and pitch type of motions are significantly observed because of waves are regular, 2D, and long-crested. The amplitude of the heave motion is very close to the incident wave amplitude, whereas the surge motion range is controlled and restrained by the mooring chain length. The surge and heave components led to a pitch motion of the OWC WEC, ranging between −7.5 and +7.5 degrees.
The simultaneous results of synchronized WGs, LCs, RWGs, PTs, and HWA are presented. Water column surface elevations inside the OWC WEC chamber were rather low compared to the outside of the chamber, and they have a double peak. RWG signals were out of phase due to the differences in locations along the x-axis. Compare to the other sensor results, pressure sensor and hot-wire anemometer results are more sensitive to any change in the water surface elevation inside the chamber.
In general, the randomness of the experimental process, characterized by the repeatability of the test, which defines the uncertainty level of the obtained measurements, was analyzed. According to the results, surge, heave, and mooring load were well repeatable. However, pressure and air velocity results showed a variation between the repeated tests.
The comparisons between the water surface elevation change in and out of the OWC WEC were made for various wave conditions. The water surface elevation amplitude in the chamber decreased by approximately ≈65% as the incident wave height measured by WG3. A resonance case at was observed.
The motion response to regular waves is defined as the motion amplitude of a floating object in regular waves per unit amplitude. The tensions in the mooring lines are also developed as a response to the WEC motions. By varying the frequency of the incident wave, a motion response curve can be obtained to depict the motion characteristics of the floating system in the frequency domain. For a moored floating OWC WEC, the motion response information reflects its motion amplitude, provides its natural frequency, and reveals nonlinear effects due to the mooring system and the incoming waves.
The maximum horizontal components of the chain mooring line tensions were measured by all four loadcells as a function of wave period (T) and wave height (H) for orifice OWC3. The heave and surge motion response is expressed by a division of the mean single motion amplitude over an averaged wave amplitude as or , where . The motion response curves for both heave and surge motions have peak values of and respectively. The resonance periods in surge and heave of the OWC WEC model are observed at . The tensions at the mooring lines reach their maximum at .
Also, two datasets from tests with OWC WEC and BOX models moored to the wave flume bottom are presented. These data include synchronized wave surface elevations, the 6-DOF model responses, as well as the mooring line tensions, air velocity in the orifice, and pressure in the WEC chamber.
As a result of applying nonlinear regular waves and the slack chain mooring system, the nonlinear motion results of the BOX and OWC WEC models were obtained and analyzed. The presented study is novel as it focuses on the nonlinear responses of the motion and mooring system of a floating OWC WEC and BOX model in nonlinear intermediate-depth water wave conditions. As nonlinear numerical models are becoming more and more popular for the simulation of floating moored OWC WEC models, their validation using experimental data is crucial. The present study covers then this existing data gap seen in the literature regarding floating moored OWC WECs by providing an open-access experimental database.
Also, the obtained data will be available in the future for the validation of the numerical models of OWC WECs farms and arrays to study coastal areas and wave energy converter (WEC) farms under highly dispersive and directional waves.
Author Contributions
Formal analysis, D.K.; Investigation, D.K., M.W., and L.C.; Methodology, D.K. and L.C.; Project administration, V.S. and P.T.; Writing—original draft, D.K.; Writing—review and editing, D.K., V.S., M.W., P.T., A.C., C.A., J.D., L.C., I.S., M.H., M.G.-G., R.B.C., and P.S. All authors have read and agreed to the published version of the manuscript.
Funding
This research was funded by MaRINET2 EsflOWC project, which received funding from the EU H2020 Programme under grant agreement no 731084. The APC was funded by COST Action CA17105 WECANet, supported by COST (European Cooperation in Science and Technology), which is funded by the Horizon 2020 Framework Programme of the European Union. COST is a funding agency for research and innovation networks. COST Actions help connect research initiatives across Europe and enable scientists to grow their ideas by sharing them with their peers. This boosts their research, career, and innovation.
Conflicts of Interest
The authors declare no conflict of interest. The funders had no role in the design of the study; in the collection, analyses, or interpretation of data; in the writing of the manuscript, or in the decision to publish the results.
References
- Falcão, A.; Henriques, J. Oscillating-water-column wave energy converters and air turbines: A review. Renew. Energy 2016, 85, 1391–1424. [Google Scholar] [CrossRef]
- Masuda, Y.; Yamazaki, T.; Outa, Y.; Michael, E. McCormick study of backward bent duct buoy. In OCEANS’87; IEEE: Piscataway, NJ, USA, 1987. [Google Scholar]
- McCormick, M.E. Analysis of a wave energy conversion buoy. J. Hydronautics 1974, 8, 77–82. [Google Scholar] [CrossRef]
- Fonseca, N.; Pessoa, J. Numerical modeling of a wave energy converter based on U-shaped interior oscillating water column. Appl. Ocean Res. 2013, 40, 60–73. [Google Scholar] [CrossRef]
- Ibarra-Berastegi, G.; Sáenz, J.; Ulazia, A.; Serras, P.; Esnaola, G.; Garcia-Soto, C. Electricity production, capacity factor, and plant efficiency index at the Mutriku wave farm (2014–2016). Ocean Eng. 2018, 147, 20–29. [Google Scholar] [CrossRef]
- Arena, F.; Romolo, A.; Malara, G.; Fiamma, V.; LaFace, V.; Soares, C. The first worldwide application at full-scale of the REWEC3 device in the Port of Civitavecchia: Initial energetic performances. In Proceedings of the RENEW2016, Lisbon, Portugal, 24–26 October 2016; pp. 303–312. [Google Scholar]
- Vicinanza, D.; Di Lauro, E.; Contestabile, P.; Gisonni, C.; Lara, J.L.; Losada, I.J. Review of innovative harbor breakwaters for wave-energy conversion. J. Waterw. Port Coast. Ocean Eng. 2019, 145. [Google Scholar] [CrossRef]
- Vannucchi, V.; Cappietti, L. Wave energy assessment and performance estimation of state of the art wave energy converters in Italian hotspots. Sustain. 2016, 8, 1300. [Google Scholar] [CrossRef]
- Iturrioz, A.; Guanche, R.; Lara, J.L.; Vidal, C.; Losada, I. Validation of OpenFOAM® for Oscillating Water Column three-dimensional modeling. Ocean Eng. 2015, 107, 222–236. [Google Scholar] [CrossRef]
- López, I.; Pereiras, B.; Castro, F.; Iglesias, G. Optimisation of turbine-induced damping for an OWC wave energy converter using a RANS–VOF numerical model. Appl. Energy 2014, 127, 105–114. [Google Scholar] [CrossRef]
- Crema, I.; Simonetti, I.; Cappietti, L.; Oumeraci, H. Laboratory experiments on oscillating water column wave energy converters integrated in a very large floating structure. In Proceedings of the 11th European Wave and Tidal Energy Conference, EWTEC 2015, Nantes, France, 6–11 September 2015. [Google Scholar]
- Luo, Y.; Wang, Z.; Peng, G.; Xiao, Y.; Zhai, L.; Liu, X.; Zhang, Q. Numerical simulation of a heave-only floating OWC (oscillating water column) device. Energy 2014, 76, 799–806. [Google Scholar] [CrossRef]
- Gomes, R.; Henriques, J.; Gato, L.; Falcão, A. Wave power extraction of a heaving floating oscillating water column in a wave channel. Renew. Energy 2016, 99, 1262–1275. [Google Scholar] [CrossRef]
- Elhanafi, A.; Macfarlane, G.; Fleming, A.; Leong, Z. Experimental and numerical investigations on the hydrodynamic performance of a floating–moored oscillating water column wave energy converter. Appl. Energy 2017, 205, 369–390. [Google Scholar] [CrossRef]
- Cappietti, L.; Simonetti, I.; Crema, I. Laboratory experiments on the performance of an OWC-WEC: Fixed condition versus floating platform-embodied condition. In Proceedings of the 13th European Wave and Tidal Energy Conference, EWTEC 2019, Napoli, Italy, 1–6 September 2019. [Google Scholar]
- Soerensen, H.C.; Knapp, W.; Tedd, J.; Kofoed, J.P.; Friis-Madsen, E. Wave dragon, the wales 4–7 MW demonstrator. In Proceedings of the IMECHE Symposium: Fluid Machinery for Wave and Tidal Energy, Aalborg, Denmark, 2–5 September 2013. [Google Scholar]
- Crespo, A.J.C.; Domínguez, J.M.; Gómez-Gesteira, M.; Hall, M.; Altomare, C.; Wu, M.; Verbrugghe, T.; Stratigaki, V.; Troch, P.; Kisacik, D.; et al. Survivability of floating moored offshore structures studied with DualSPHysics. In Proceedings of the 13th SPHERIC International Workshop, SPHERIC 2018, Galway, Ireland, 26–28 June 2018. [Google Scholar]
- Wu, M.; Stratigaki, V.; Troch, P.; Altomare, C.; Verbrugghe, T.; Crespo, A.; Cappietti, L.; Hall, M.; Gómez-Gesteira, M. Experimental study of a moored floating oscillating water column wave-energy converter and of a moored cubic box. Energies 2019, 12, 1834. [Google Scholar] [CrossRef]
- Thorimbert, Y.; Latt, J.; Cappietti, L.; Chopard, B. Virtual wave flume and Oscillating Water Column modeled by lattice Boltzmann method and comparison with experimental data. Int. J. Mar. Energy 2016, 14, 41–51. [Google Scholar] [CrossRef]
- Simonetti, I.; Cappietti, L.; Safti, H.; Oumeraci, H. 3D numerical modelling of oscillating water column wave energy conversion devices: Current knowledge and OpenFOAM® implementation. In Proceedings of the Renewable Energies Offshore, Lisbon, Portugal, 24–26 November 2014; Informa UK Limited: Colchester, UK, 2015; pp. 497–504. [Google Scholar]
- Simonetti, I.; Cappietti, L.; Elsafti, H.; Oumeraci, H. Optimization of the geometry and the turbine induced damping for fixed detached and asymmetric OWC devices: A numerical study. Energy 2017, 139, 1197–1209. [Google Scholar] [CrossRef]
- Mansard, E.P.D.; Funke, E.R. The Measurement of Incident and Reflected Spectra Using a Least Squares Method; Int. Conf. on Coastal Engineering (ICCE): Sydney, Australia, 1980. [Google Scholar]
- Bernard Le Méhauté An Introduction to Hydrodynamics and Water Waves; Springer: Berlin/Heidelberg, Germany, 1976.
- ITTC—International Towing Tank Conference Recommended Procedures and Guidelines Seakeeping Experiments. 2014. Available online: https://www.ittc.info/media/8101/75-02-07-021.pdf (accessed on 4 January 2020).
- Simonetti, I.; Cappietti, L.; Elsafti, H.; Oumeraci, H. Evaluation of air compressibility effects on the performance of fixed OWC wave energy converters using CFD modelling. Renew. Energy 2018, 119, 741–753. [Google Scholar] [CrossRef]
- Simonetti, I.; Cappietti, L. The impact of modelling air compressibility in the selection of optimal OWC design parameters in site specific wave conditions. In Proceedings of the OMAE2019, Madrid, Spain, 9–14 June 2019. [Google Scholar]
© 2020 by the authors. Licensee MDPI, Basel, Switzerland. This article is an open access article distributed under the terms and conditions of the Creative Commons Attribution (CC BY) license (http://creativecommons.org/licenses/by/4.0/).