Temporal and Spatial Characteristics of Multidimensional Extreme Precipitation Indicators: A Case Study in the Loess Plateau, China
Abstract
:1. Introduction
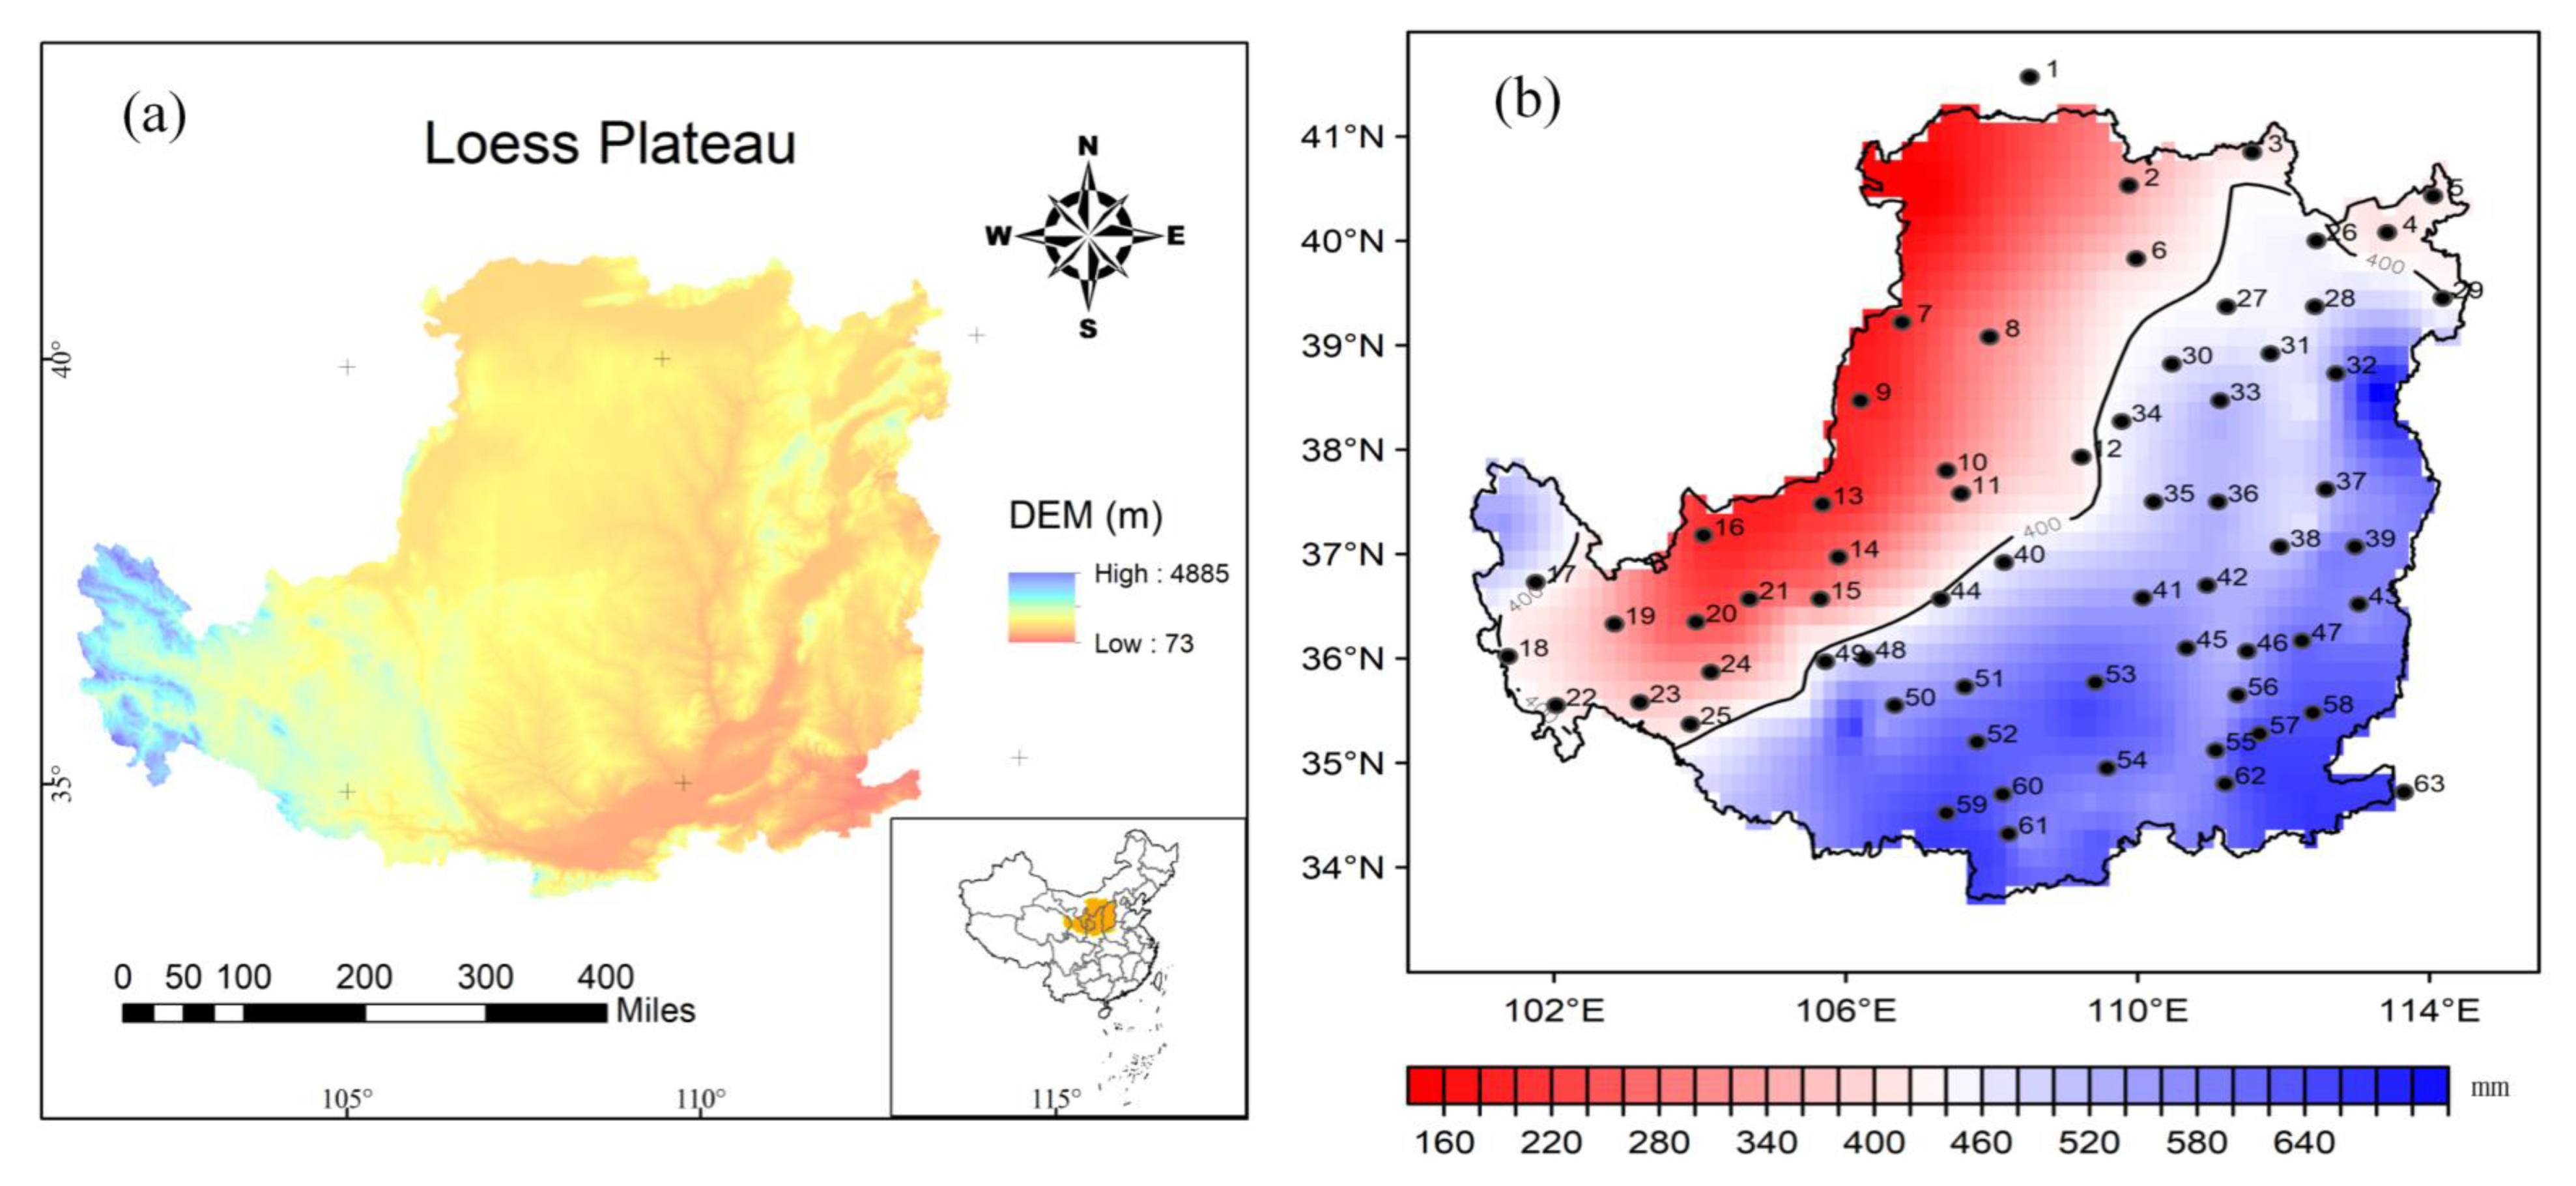
2. Overview of the study area and data
3. Method
3.1. Gaussian Mixture Model
3.2. Joint Probability Distribution and Return Period
3.2.1. Joint Probability Distribution for Extreme Precipitation Indicators
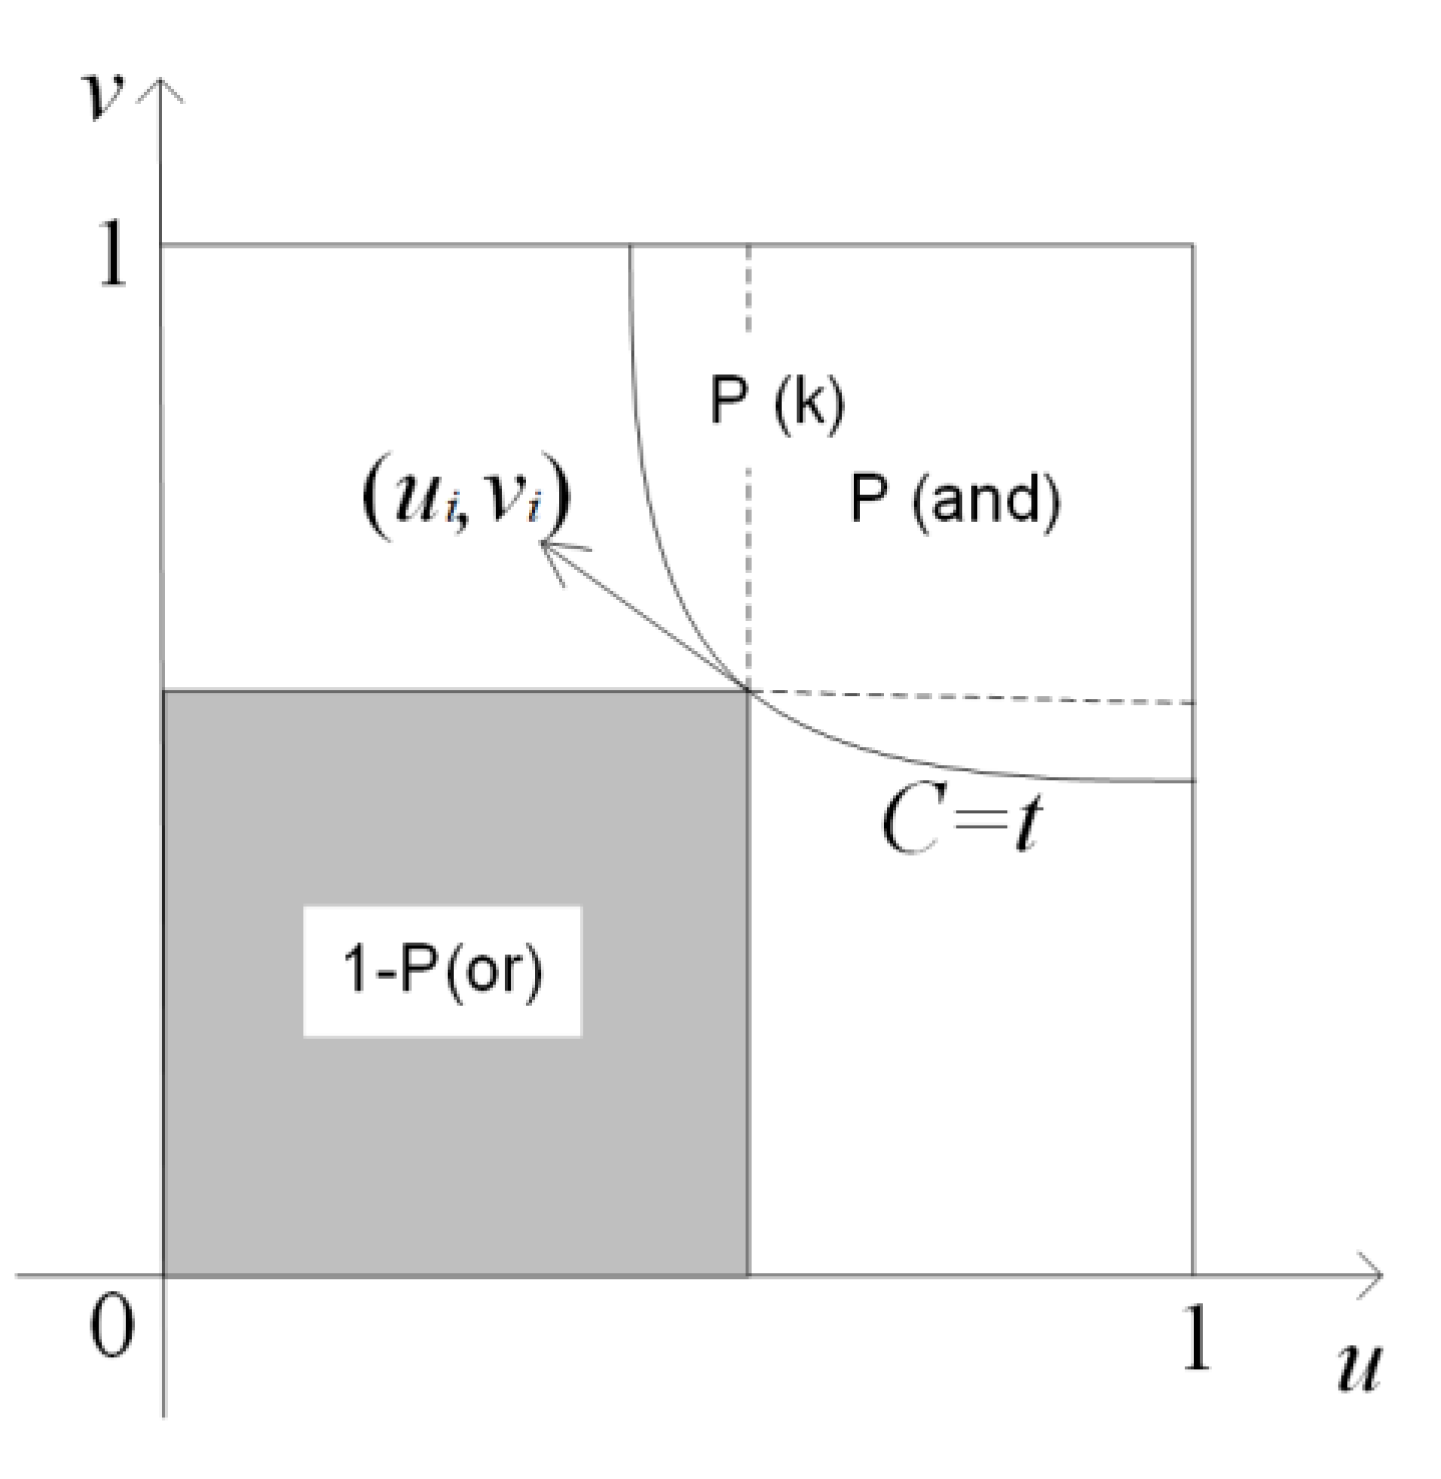
3.2.2. Return Periods for Extreme Precipitation Indicators and Their Combinations
- Simulate a sample u1, ..., um from the d-dimensional copula C;
- For i = 1 ,..., m calculate wi = C(ui);
- Estimate Kc: .
4. Case Study and Results Analysis
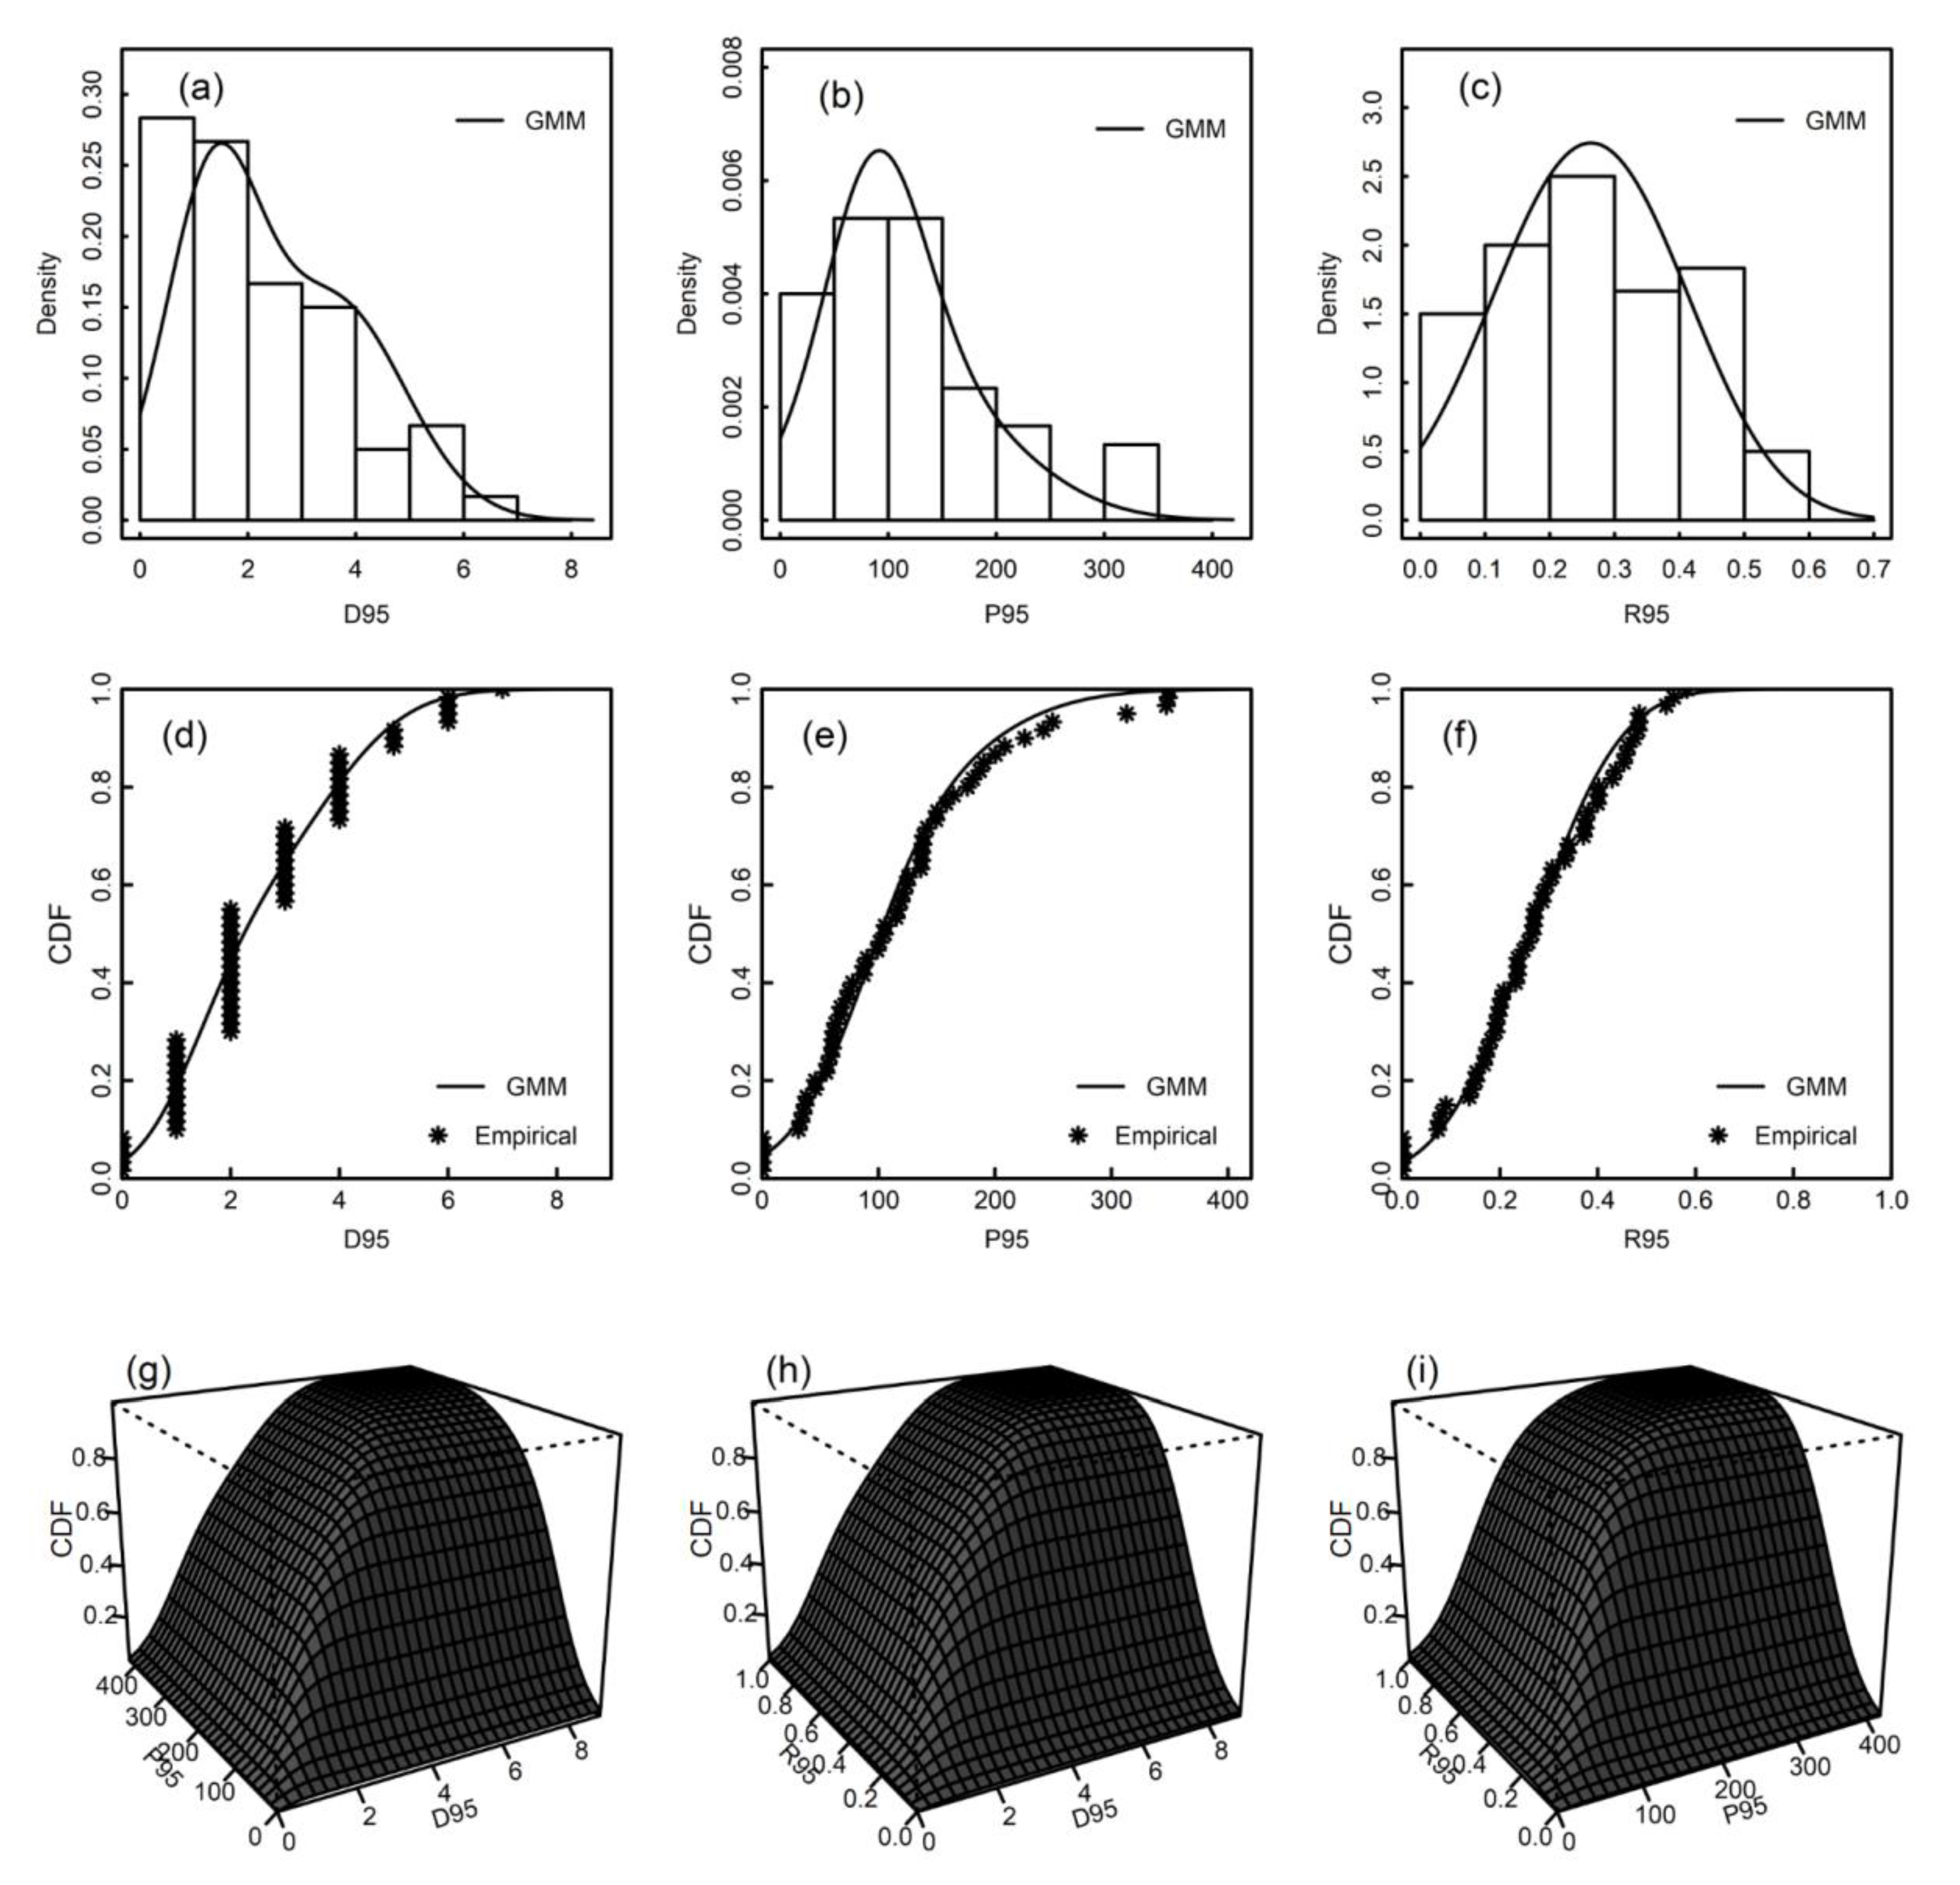
4.1. Case Study
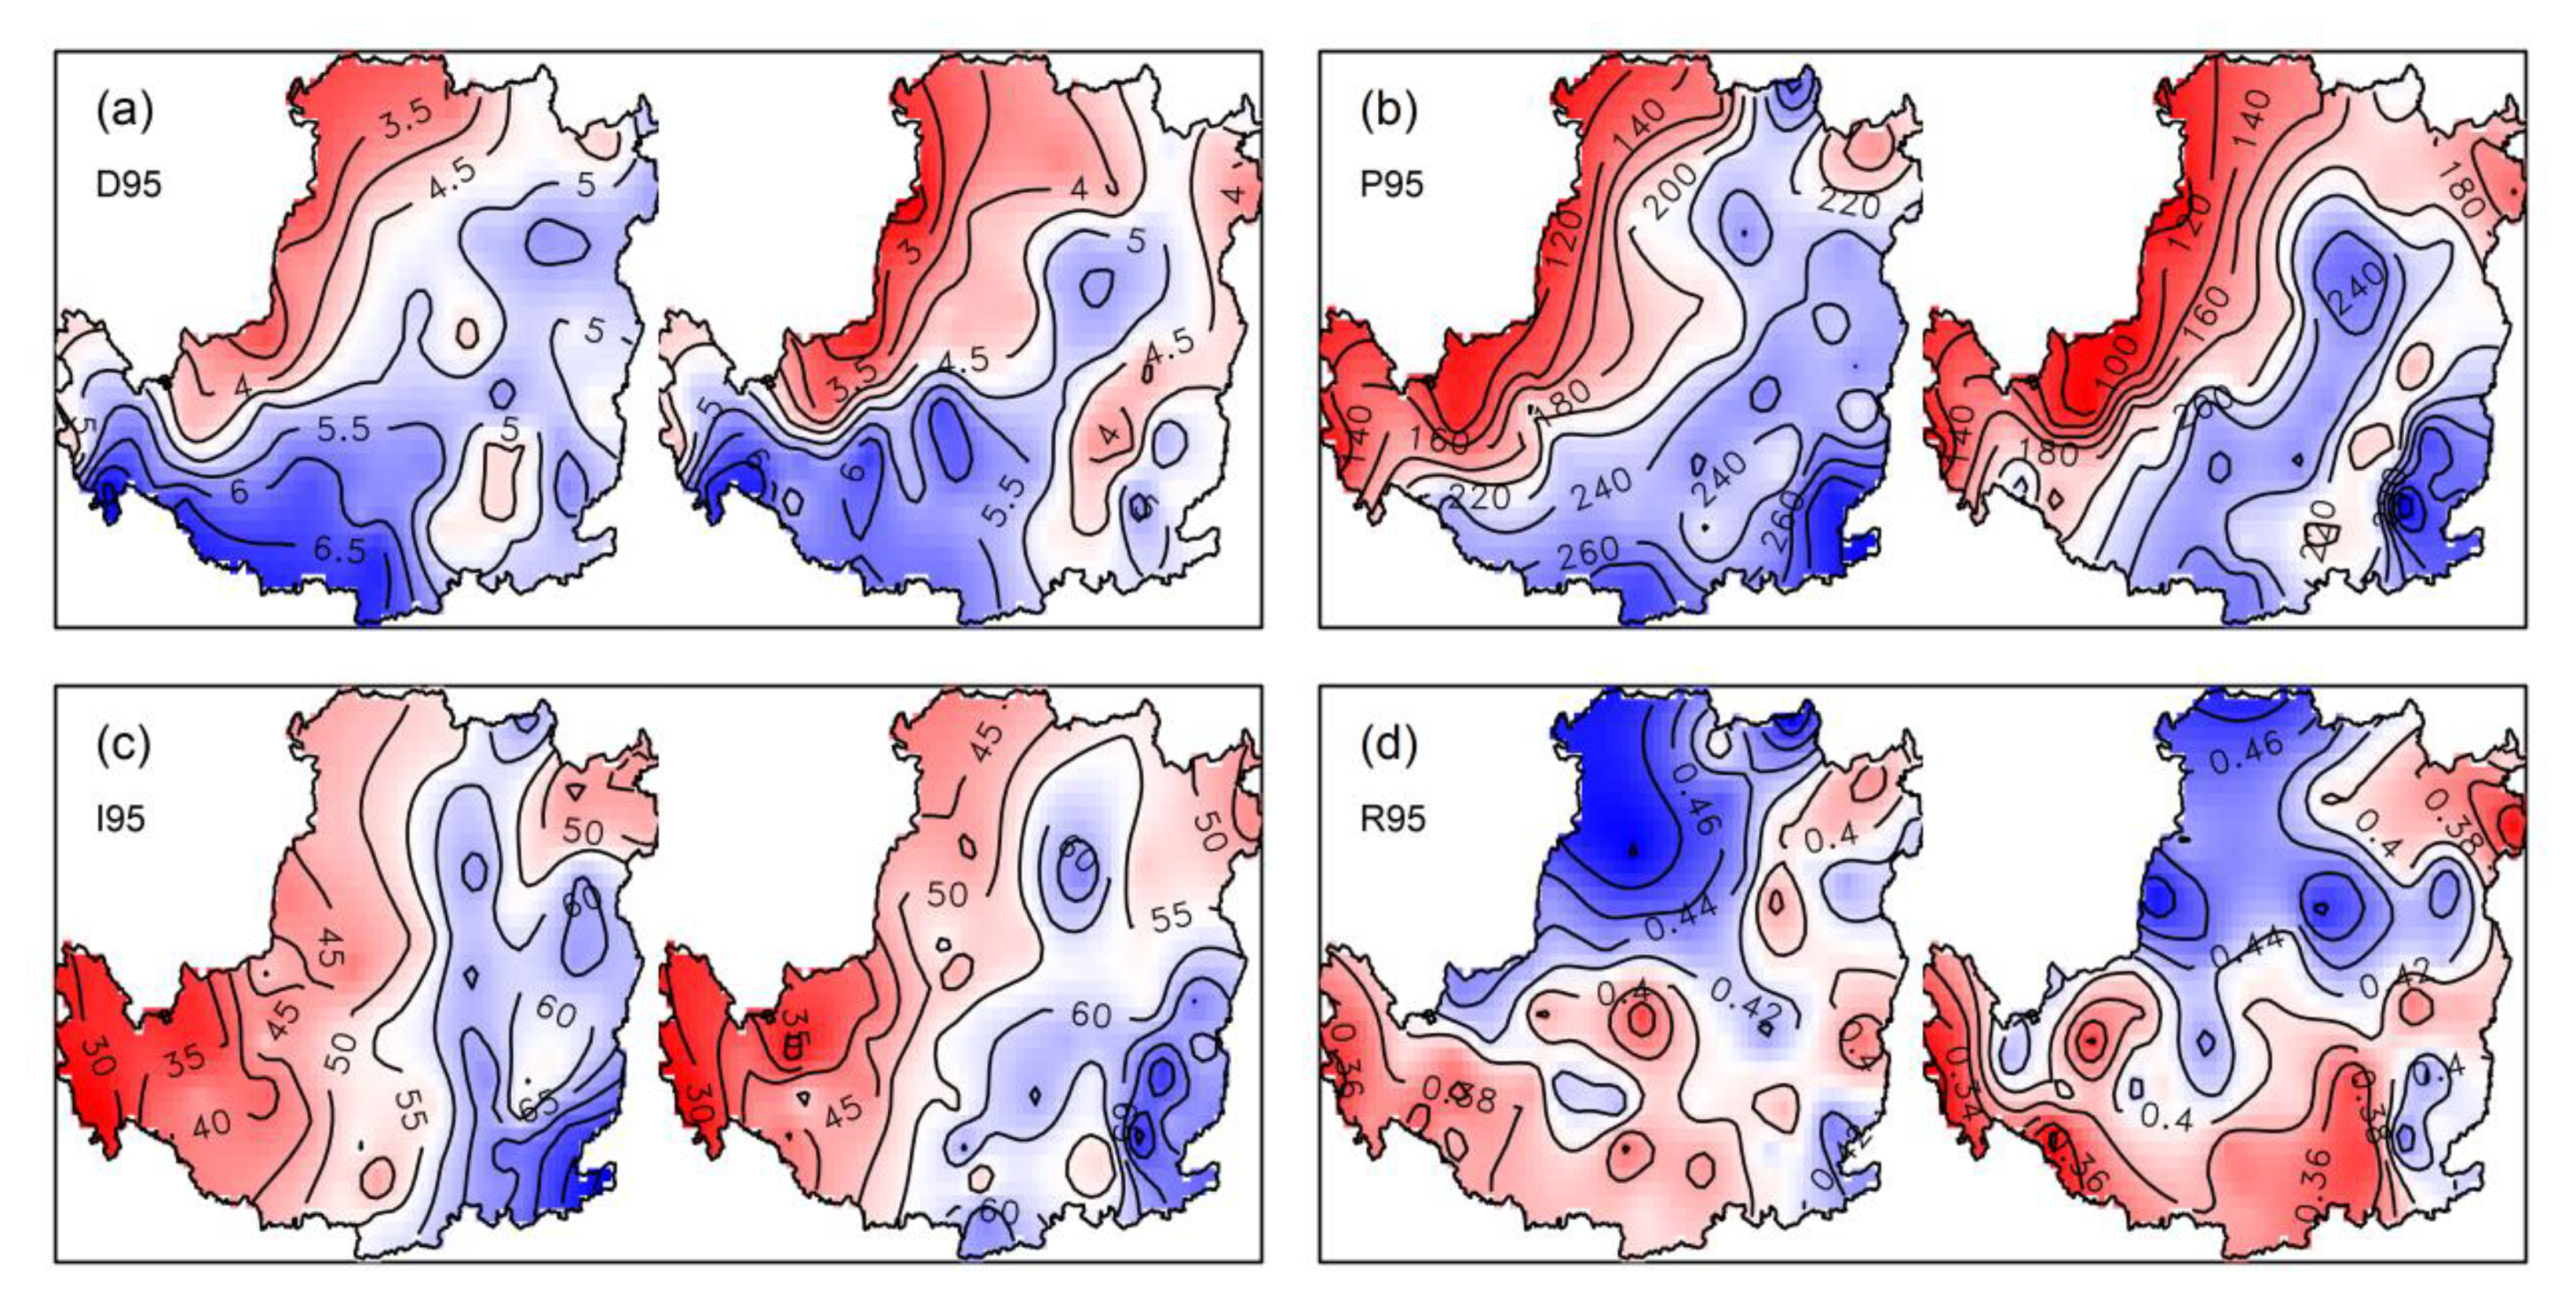
4.2. Changes of Different Schemes in Two 30-Year Stages
4.3. The Trend of Return Period of Multidimensional Moving Window Series
5. Discussions and Conclusions
Supplementary Materials
Author Contributions
Funding
Conflicts of Interest
References
- Aguilar, E. Changes in temperature and precipitation extremes in western Central Africa, Guinea Conakry, and Zimbabwe, 1955–2006. J. Geophys. Res. 2008, 114, D02115. [Google Scholar] [CrossRef]
- Ullah, S.; You, Q.; Ullah, W.; Ali, A. Observed changes in precipitation in china-pakistan economic corridor during 1980–2016. Atmos. Res. 2018, 210, 1–14. [Google Scholar] [CrossRef]
- Lu, W.; Qin, X.S.; Jun, C. A parsimonious framework of evaluating WSUD features in urban flood mitigation. J. Environ. Inform. 2019, 33, 17–27. [Google Scholar] [CrossRef]
- IPCC. Climate Change 2007: The Physical Science Basis. Contribution of Working Group I to the Fourth Assessment Report of the Intergovernmental Panel on Climate Change; Cambridge University Press: Cambridge, UK, 2007. [Google Scholar]
- Shivam, G.; Goyal, M.K.; Sarma, A.K. Index-based study of future precipitation changes over subansiri river catchment under changing climate. J. Environ. Inform. 2019, 34, 1–14. [Google Scholar] [CrossRef]
- Rudari, R.; Entekhabi, D.; Roth, G. Terrain and multiple-scale interactions as factors in generating extreme precipitation events. J. Hydrometeorol. 2004, 5, 390–404. [Google Scholar] [CrossRef]
- Merino, A.; Fernández-González, S.; García-Ortega, E.; Sánchez, J.L.; López, E.; Gascón, L. Temporal continuity of extreme precipitation events using sub-daily precipitation: Application to floods in the ebro basin, northeastern Spain. Int. J. Climatol. 2018, 38, 1877–1892. [Google Scholar] [CrossRef]
- Shaffie, S.; Mozaffari, G.A.; Khosravi, Y. Determination of extreme precipitation threshold and analysis of its effective patterns (case study: West of Iran). Nat. Hazards 2019, 99, 857–878. [Google Scholar] [CrossRef]
- Šraj, M.; Viglione, A.; Parajka, J.; Blöschl, G. The influence of non-stationarity in extreme hydrological events on flood frequency estimation. J. Hydrol. Hydromech. 2016, 64, 426–437. [Google Scholar] [CrossRef] [Green Version]
- Mondal, A.; Daniel, D. Return levels under nonstationarity: The need to update infrastructure design strategies. J. Hydrol. Eng. 2019, 24, 04018060. [Google Scholar] [CrossRef]
- Li, H.; Wang, D.; Singh, V.P.; Wang, Y.; Wu, J.; Wu, J.H.; Liu, J.; Zou, Y.; He, R.; Zhang, J. Non-stationary frequency analysis of annual extreme rainfall volume and intensity using Archimedean Copulas: A case study in eastern China. J. Hydrol. 2019, 571, 114–131. [Google Scholar] [CrossRef]
- Lloyd, E.A.; Oreskes, N. Climate change attribution: When is it appropriate to accept new methods? Earth’s Future 2018, 6, 311–325. [Google Scholar] [CrossRef]
- Vasquez, R.; Diego, J. Evaluating Hydrologic Design under Stationary and Non-Stationary Assumptions. Ph.D. Thesis, University of California, Irvine, CA, USA, 2016. [Google Scholar]
- Ramos, M.C.; Martínez-Casasnovas, J.A. Trends in precipitation concentration and extremes in the mediterranean Penedes-Anoia region NE Spain. Clim. Chang. 2006, 74, 457–474. [Google Scholar] [CrossRef]
- Goswami, U.P.; Hazra, B.; Kumar, G.M. Copula-based probabilistic characterization of precipitation extremes over north sikkim himalaya. Atmos. Res. 2018, 212, 273–284. [Google Scholar] [CrossRef]
- Vincent, L.A.; Mekis, É. Changes in daily and extreme temperature and precipitation indices for Canada over the twentieth century. Atmos. -Ocean 2006, 44, 177–193. [Google Scholar] [CrossRef] [Green Version]
- Gao, Y.; Feng, Q.; Liu, W.; Lu, A.; Wang, Y.; Yang, J.; Cheng, A.; Wang, Y.; Su, Y.; Liu, L.; et al. Changes of daily climate extremes in Loess Plateau during 1960–2013. Quat. Int. 2014, 371, 5–21. [Google Scholar]
- El Adlouni, S.; Ouarda, T.; Zhang, X.; Roy, R.; Bobee, B. Generalized maximum likelihood estimators for the nonstationary generalized extreme value model. Water Resour. Res. 2007, 43, W03410. [Google Scholar] [CrossRef]
- Dars, G.H. Climate Change Impacts on Precipitation Extremes over the Columbia River Basin Based on Downscaled CMIP5 Climate Scenarios. Master’s Thesis, Department of Civil & Environmental Engineering, Portland State University, Portland, OR, USA, 2013. [Google Scholar]
- Wehner, M. Sources of uncertainty in the extreme value statistics of climate data. Extremes 2010, 13, 205–217. [Google Scholar] [CrossRef] [Green Version]
- Ghosh, S.; Das, D.; Kao, S.C.; Ganguly, A.R. Lack of uniform trends but increasing spatial variability in observed indian rainfall extremes. Nat. Clim. Chang. 2011, 2, 86–91. [Google Scholar] [CrossRef]
- Fan, Y.R.; Huang, W.W.; Huang, G.H.; Li, Y.P.; Huang, K.; Li, Z. Hydrologic risk analysis in the yangtze river basin through coupling gaussian mixtures into copulas. Adv. Water Resour. 2016, 88, 170–185. [Google Scholar] [CrossRef] [Green Version]
- Sun, C.X.; Huang, G.H.; Fan, Y.; Zhou, X.; Lu, C.; Wang, X.Q. Drought occurring with hot extremes: Changes under future climate change on Loess Plateau, China. Earth’s Future 2019, 7, 587–604. [Google Scholar] [CrossRef] [Green Version]
- Salvadori, G.; De Michele, C. Frequency analysis via copulas: Theoretical aspects and applications to hydrological events. Water Resour. Res. 2004, 40. [Google Scholar] [CrossRef]
- Jhong, B.C.; Tung, C.P. Evaluating future joint probability of precipitation extremes with a copula-based assessing approach in climate change. Water Resour. Manag. 2018, 32, 4253–4274. [Google Scholar] [CrossRef]
- Liu, M.; Xu, X.; Sun, A.Y.; Wang, K.; Liu, W.; Zhang, X. Is southwestern china experiencing more frequent precipitation extremes? Environ. Res. Lett. 2014, 9, 064002. [Google Scholar] [CrossRef] [Green Version]
- Akaike, H. A new look at the statistical model identification. IEEE Trans. Autom. Control 1974, 19, 716–723. [Google Scholar] [CrossRef]
- Kurowicka, D.; Joe, H. Dependence Modeling: Vine Copula Handbook; World Scientific: Singapore, 2011; Available online: https://econpapers.repec.org/bookchap/wsiwsbook/7699.htm (accessed on 12 January 2020).
- Xu, K.; Yang, D.; Xu, X.; Lei, H. Copula based drought frequency analysis considering the spatio-temporal variability in southwest china. J. Hydrol. 2015, 527, 630–640. [Google Scholar] [CrossRef]
- Zhu, U.; Liu, Y.; Wang, W.; Singh, V.P.; Ma, X.; Yu, Z. Three dimensional characterization of meteorological and hydrological droughts and their probabilistic links. J. Hydrol. 2019, 578, 124016. [Google Scholar] [CrossRef]
- Wang, W.; Shao, Q.; Peng, S.; Zhang, Z.; Xing, W.; An, G.; Yong, B. Spatial and temporal characteristics of changes in precipitation during 1957–2007 in the Haihe river basin, China. Stoch. Environ. Res. Risk Assess. 2011, 25, 881–895. [Google Scholar] [CrossRef]
- Sondergaard, T.; Lermusiaux, P.F.J. Data assimilation with gaussian mixture models using the dynamically orthogonal field equations. part ii: Applications. Mon. Weather Rev. 2013, 141, 1761–1785. [Google Scholar] [CrossRef] [Green Version]
- He, J. Mixture model based multivariate statistical analysis of multiply censored environmental data. Adv. Water Resour. 2013, 59, 15–24. [Google Scholar] [CrossRef]
- Sklar, K. Fonctions dé repartition á n dimensions et leurs marges. Publ. Inst. Stat. Univ. Paris 1959, 8, 229–231. [Google Scholar]
- Nelsen, R.B. An Introduction to Copulas; Springer: New York, NY, USA, 2006. [Google Scholar]
- Sraj, M.; Bezak, N.; Brilly, M. Bivariate flood frequency analysis using the copula function: A case study of the Litija station on the Sava River. Hydrol. Process. 2015, 29, 225–238. [Google Scholar] [CrossRef]
- Zhang, L. Multivariate Hydrological Frequency Analysis and Risk Mapping. Ph.D. Thesis, Department of Civil and Environmental Engineering, Lousiana State University and Agricultural and Mechanical College, Baton Rouge, LA, USA, 2005. [Google Scholar]
- Genest, C.; Rivest, L.P. Statistical inference procedures for bivariate Archimedean copulas. J. Am. Stat. Assoc. 1993, 88, 1034–1043. [Google Scholar] [CrossRef]
- Salvadori, G.; De, M.C.; Durante, F. On the return period and design in a multivariate framework. Hydrol. Earth Syst. Sci. 2011, 15, 3293–3305. [Google Scholar] [CrossRef] [Green Version]
- Kendall, M.G. Rank Correlation Methods; Charles Griffin & Company Ltd.: London, UK, 1975. [Google Scholar]
- Wu, H.; Chen, B.; Snelgrove, K.; Lye, L.M. Quantification of Uncertainty Propagation Effects during Statistical Downscaling of Precipitation and Temperature to Hydrological Modeling. J. Environ. Inform. 2019, 34, 139–148. [Google Scholar] [CrossRef]
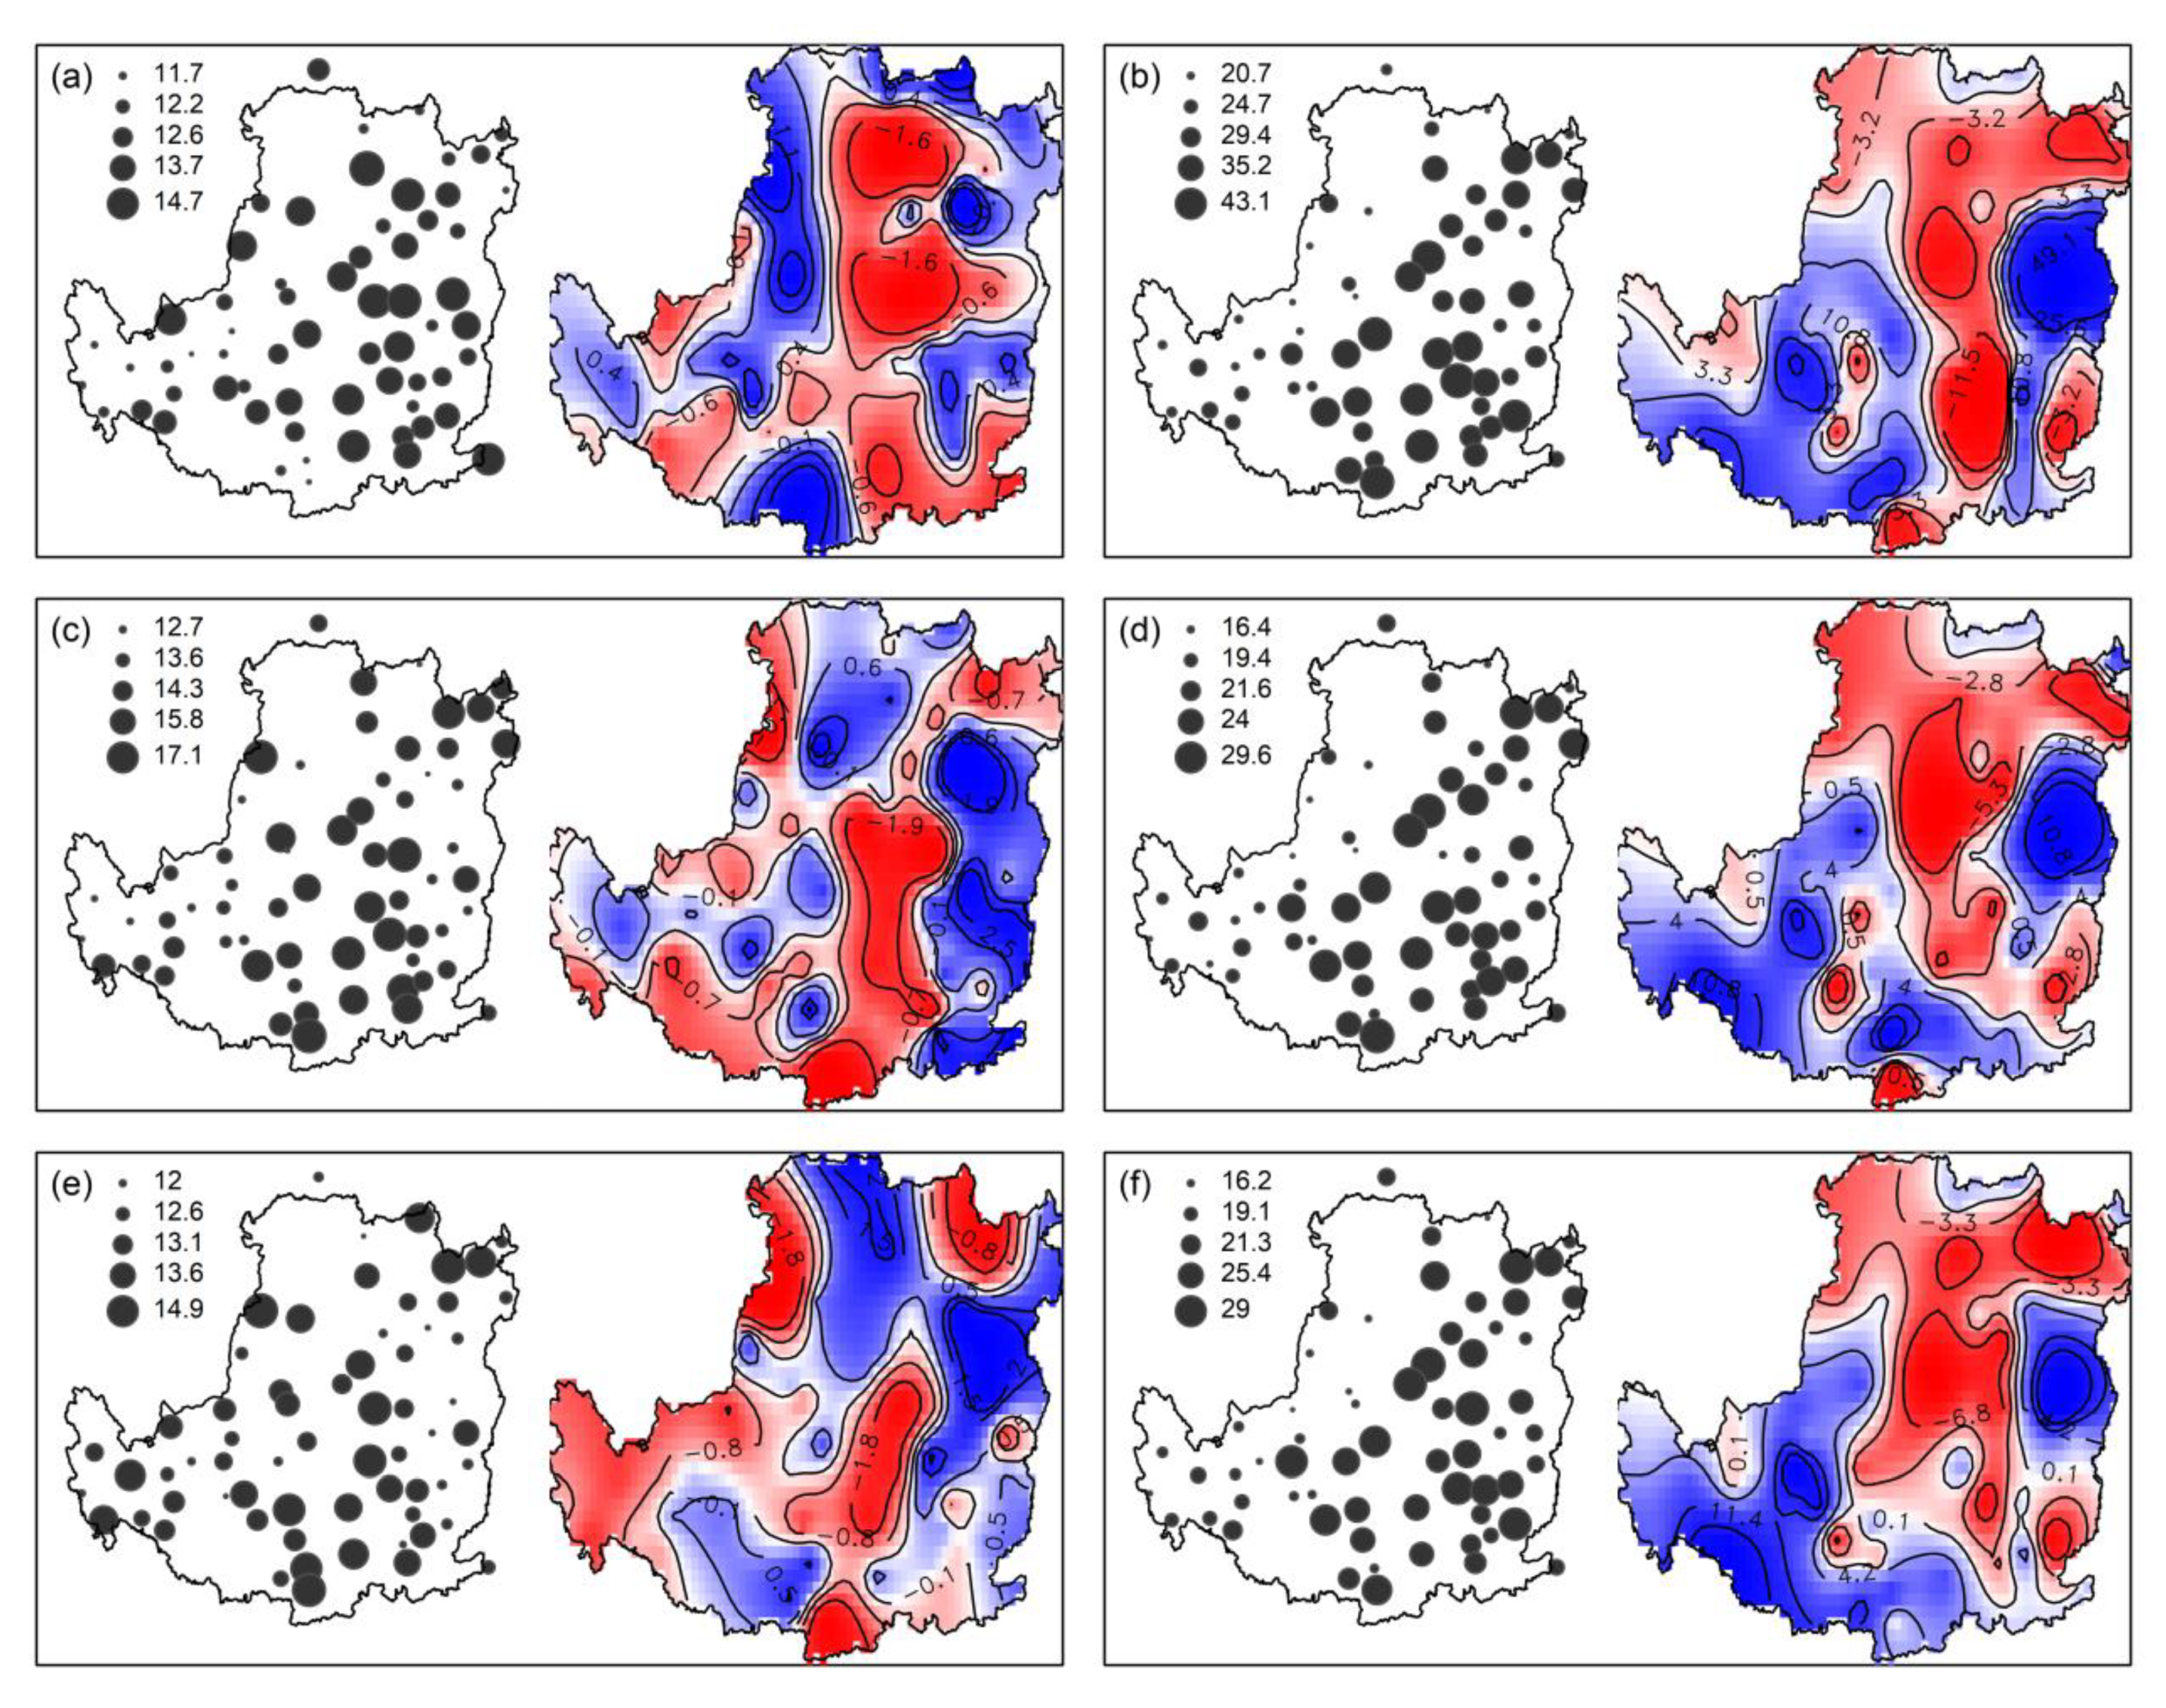
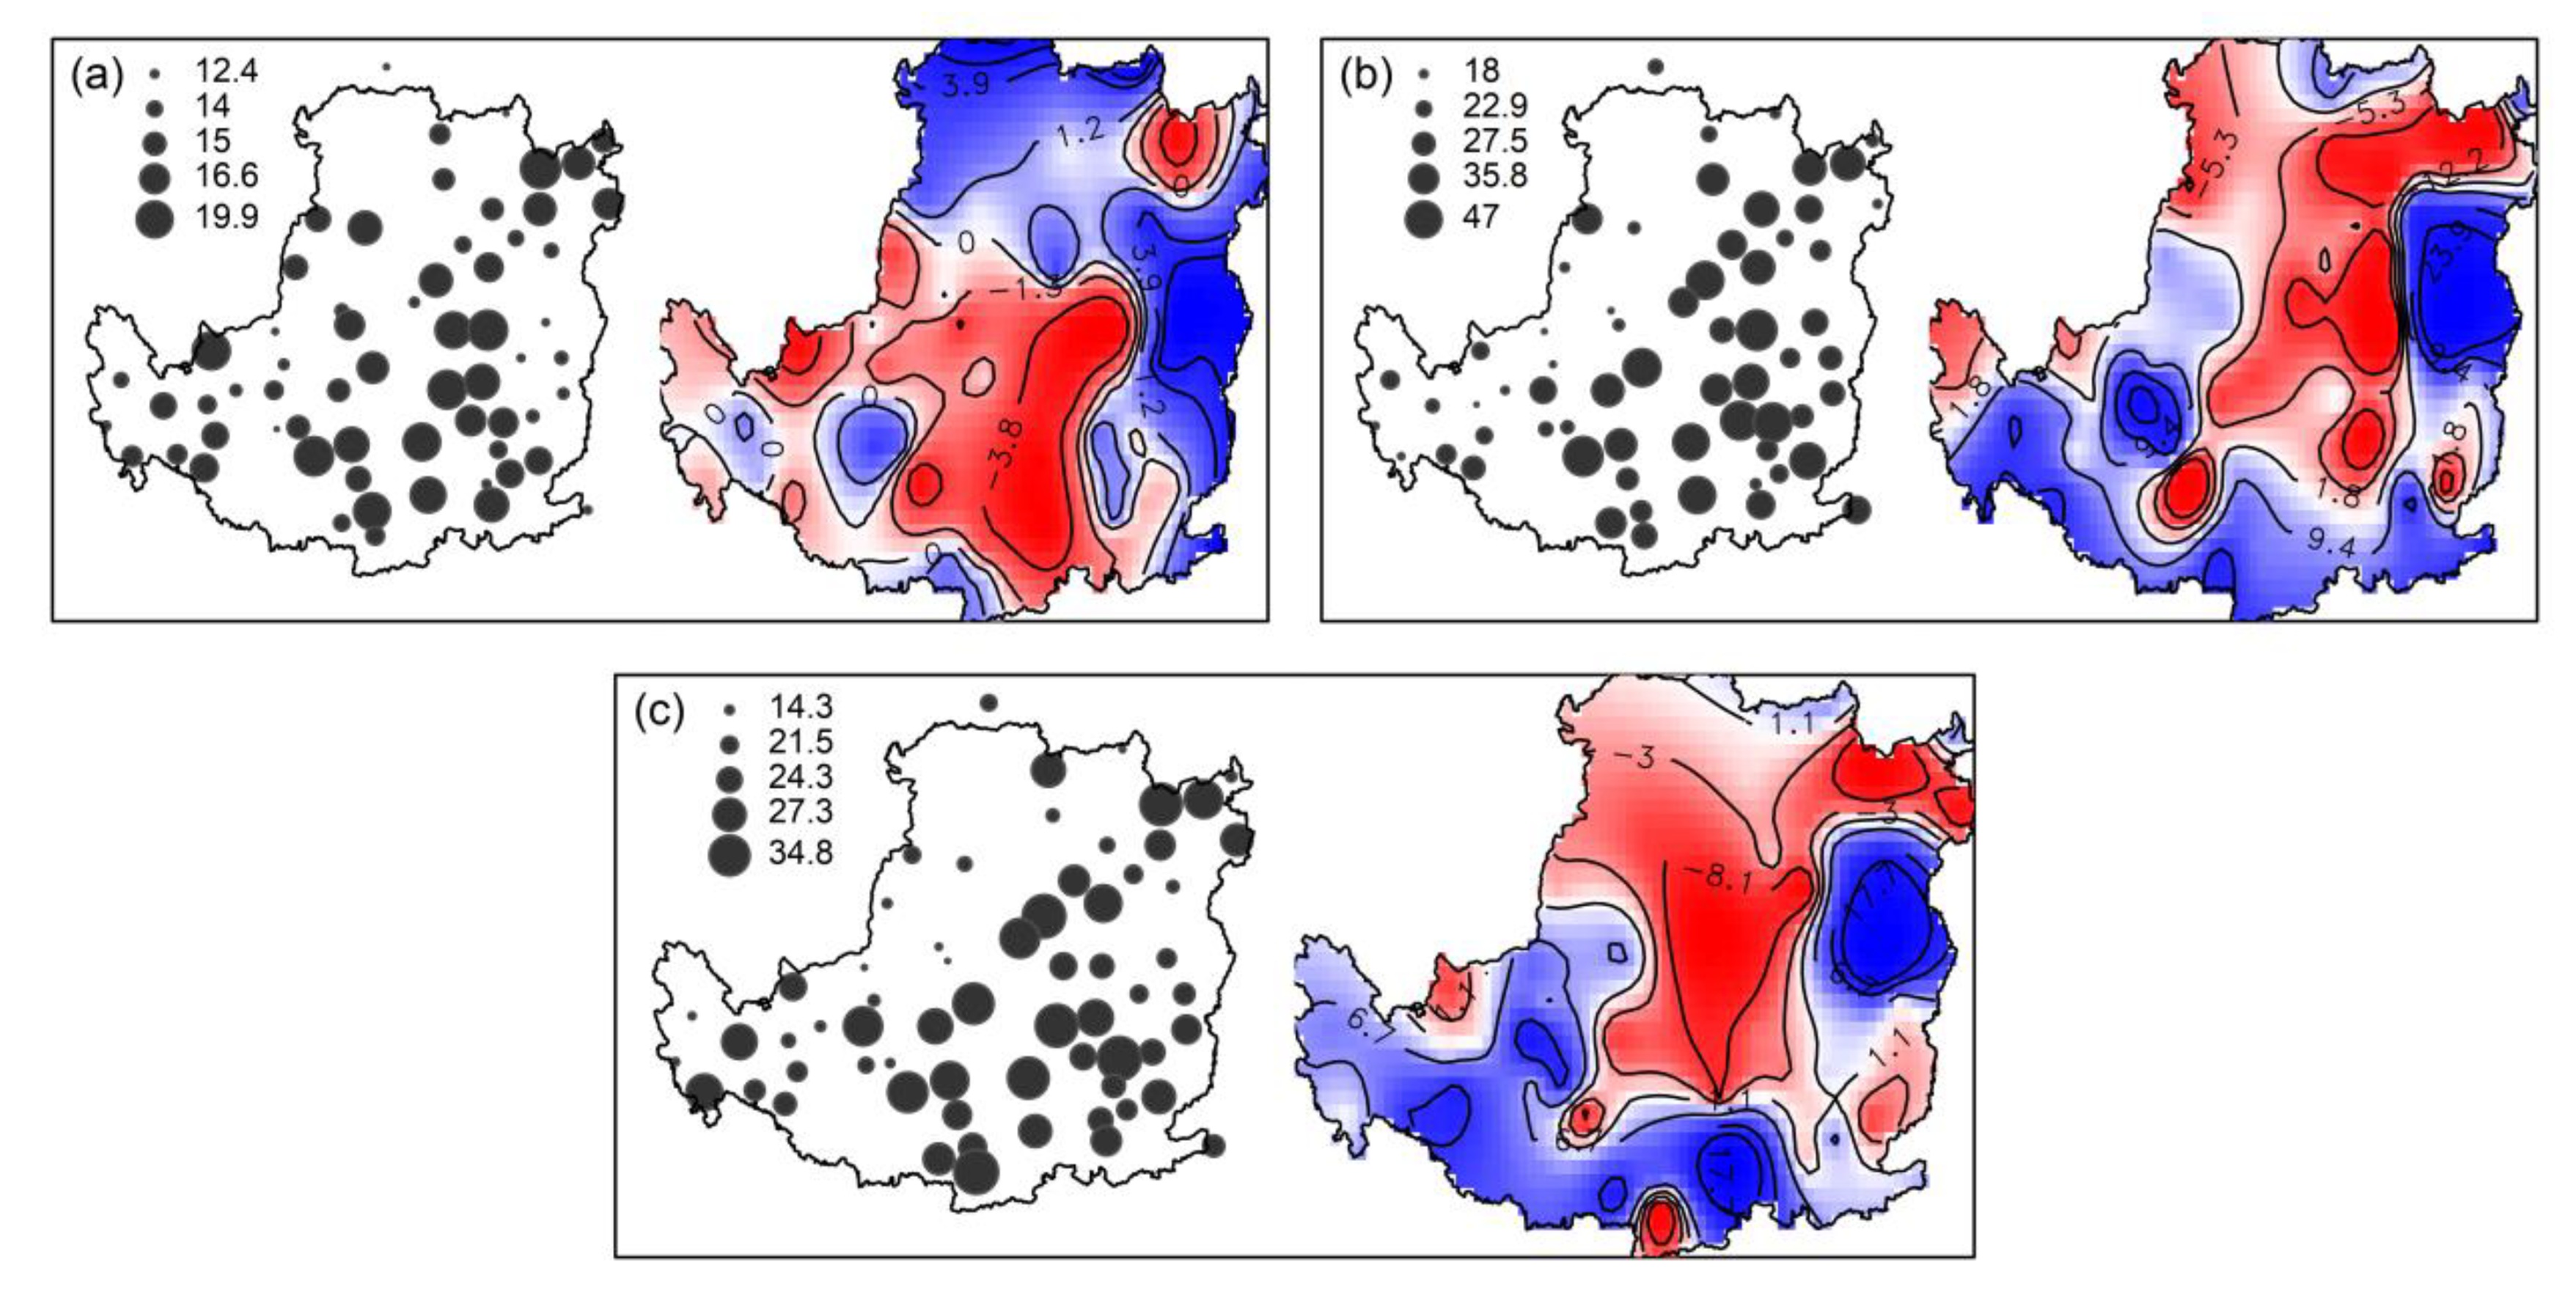
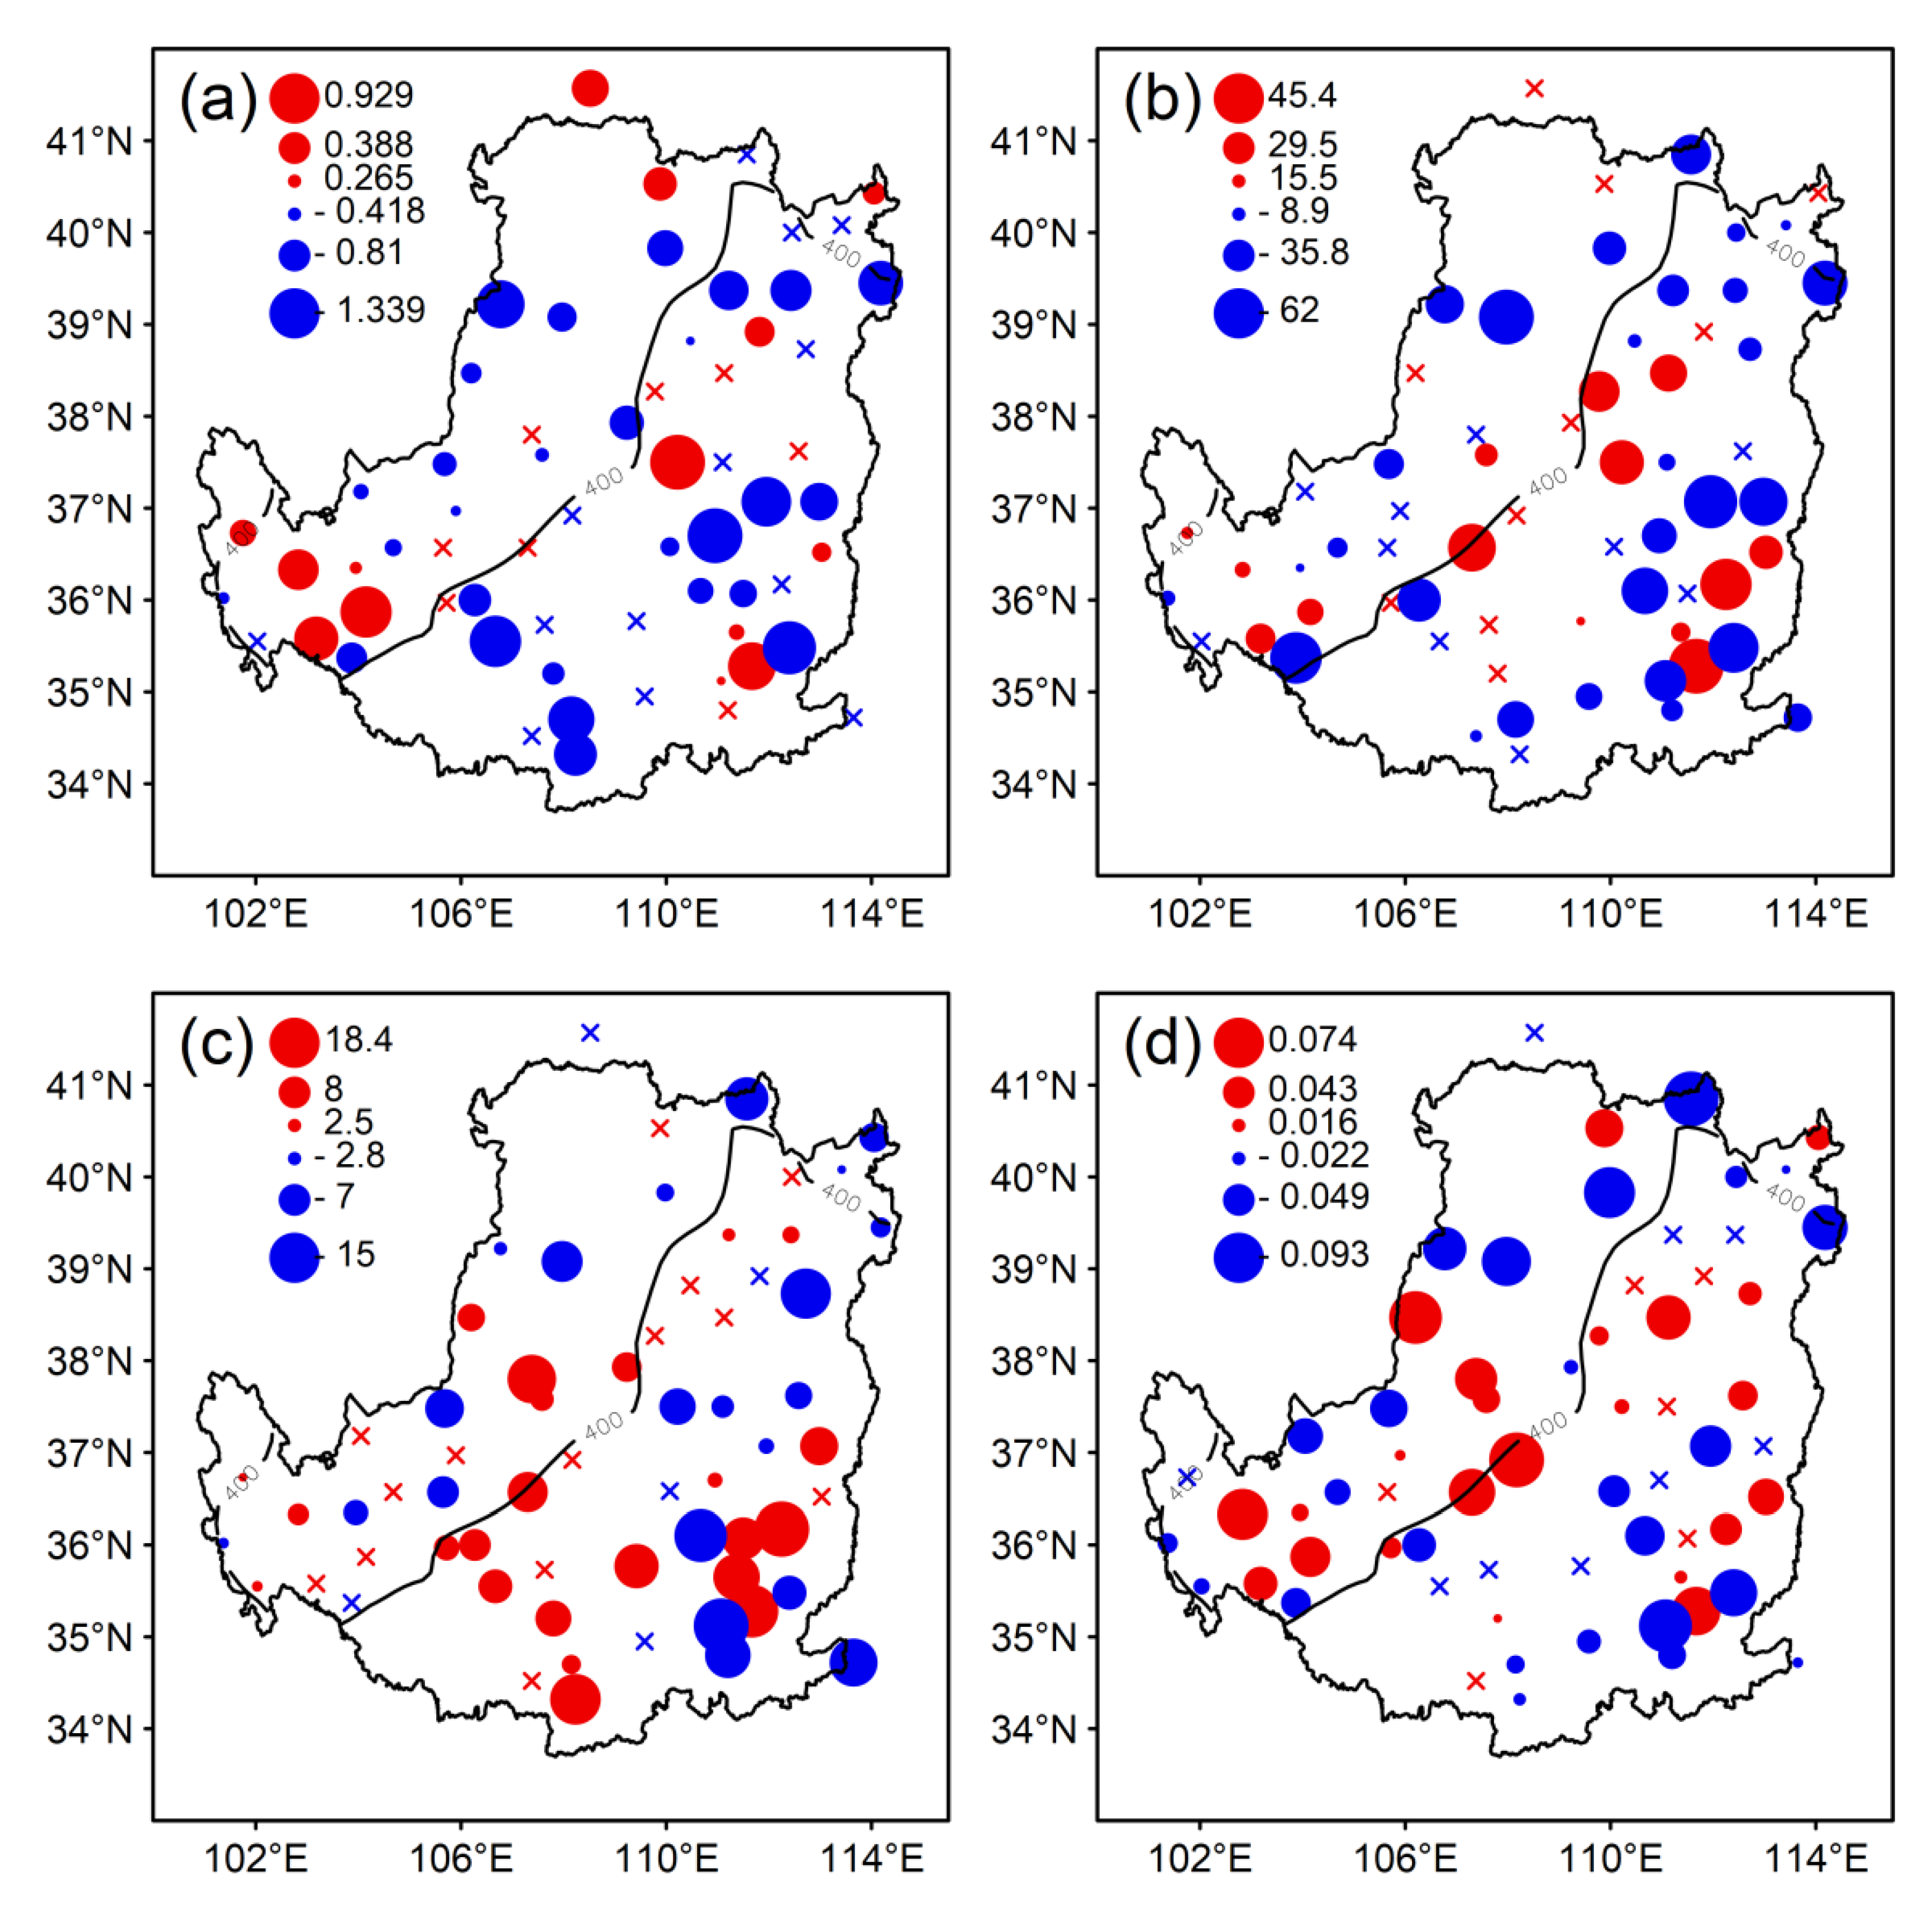
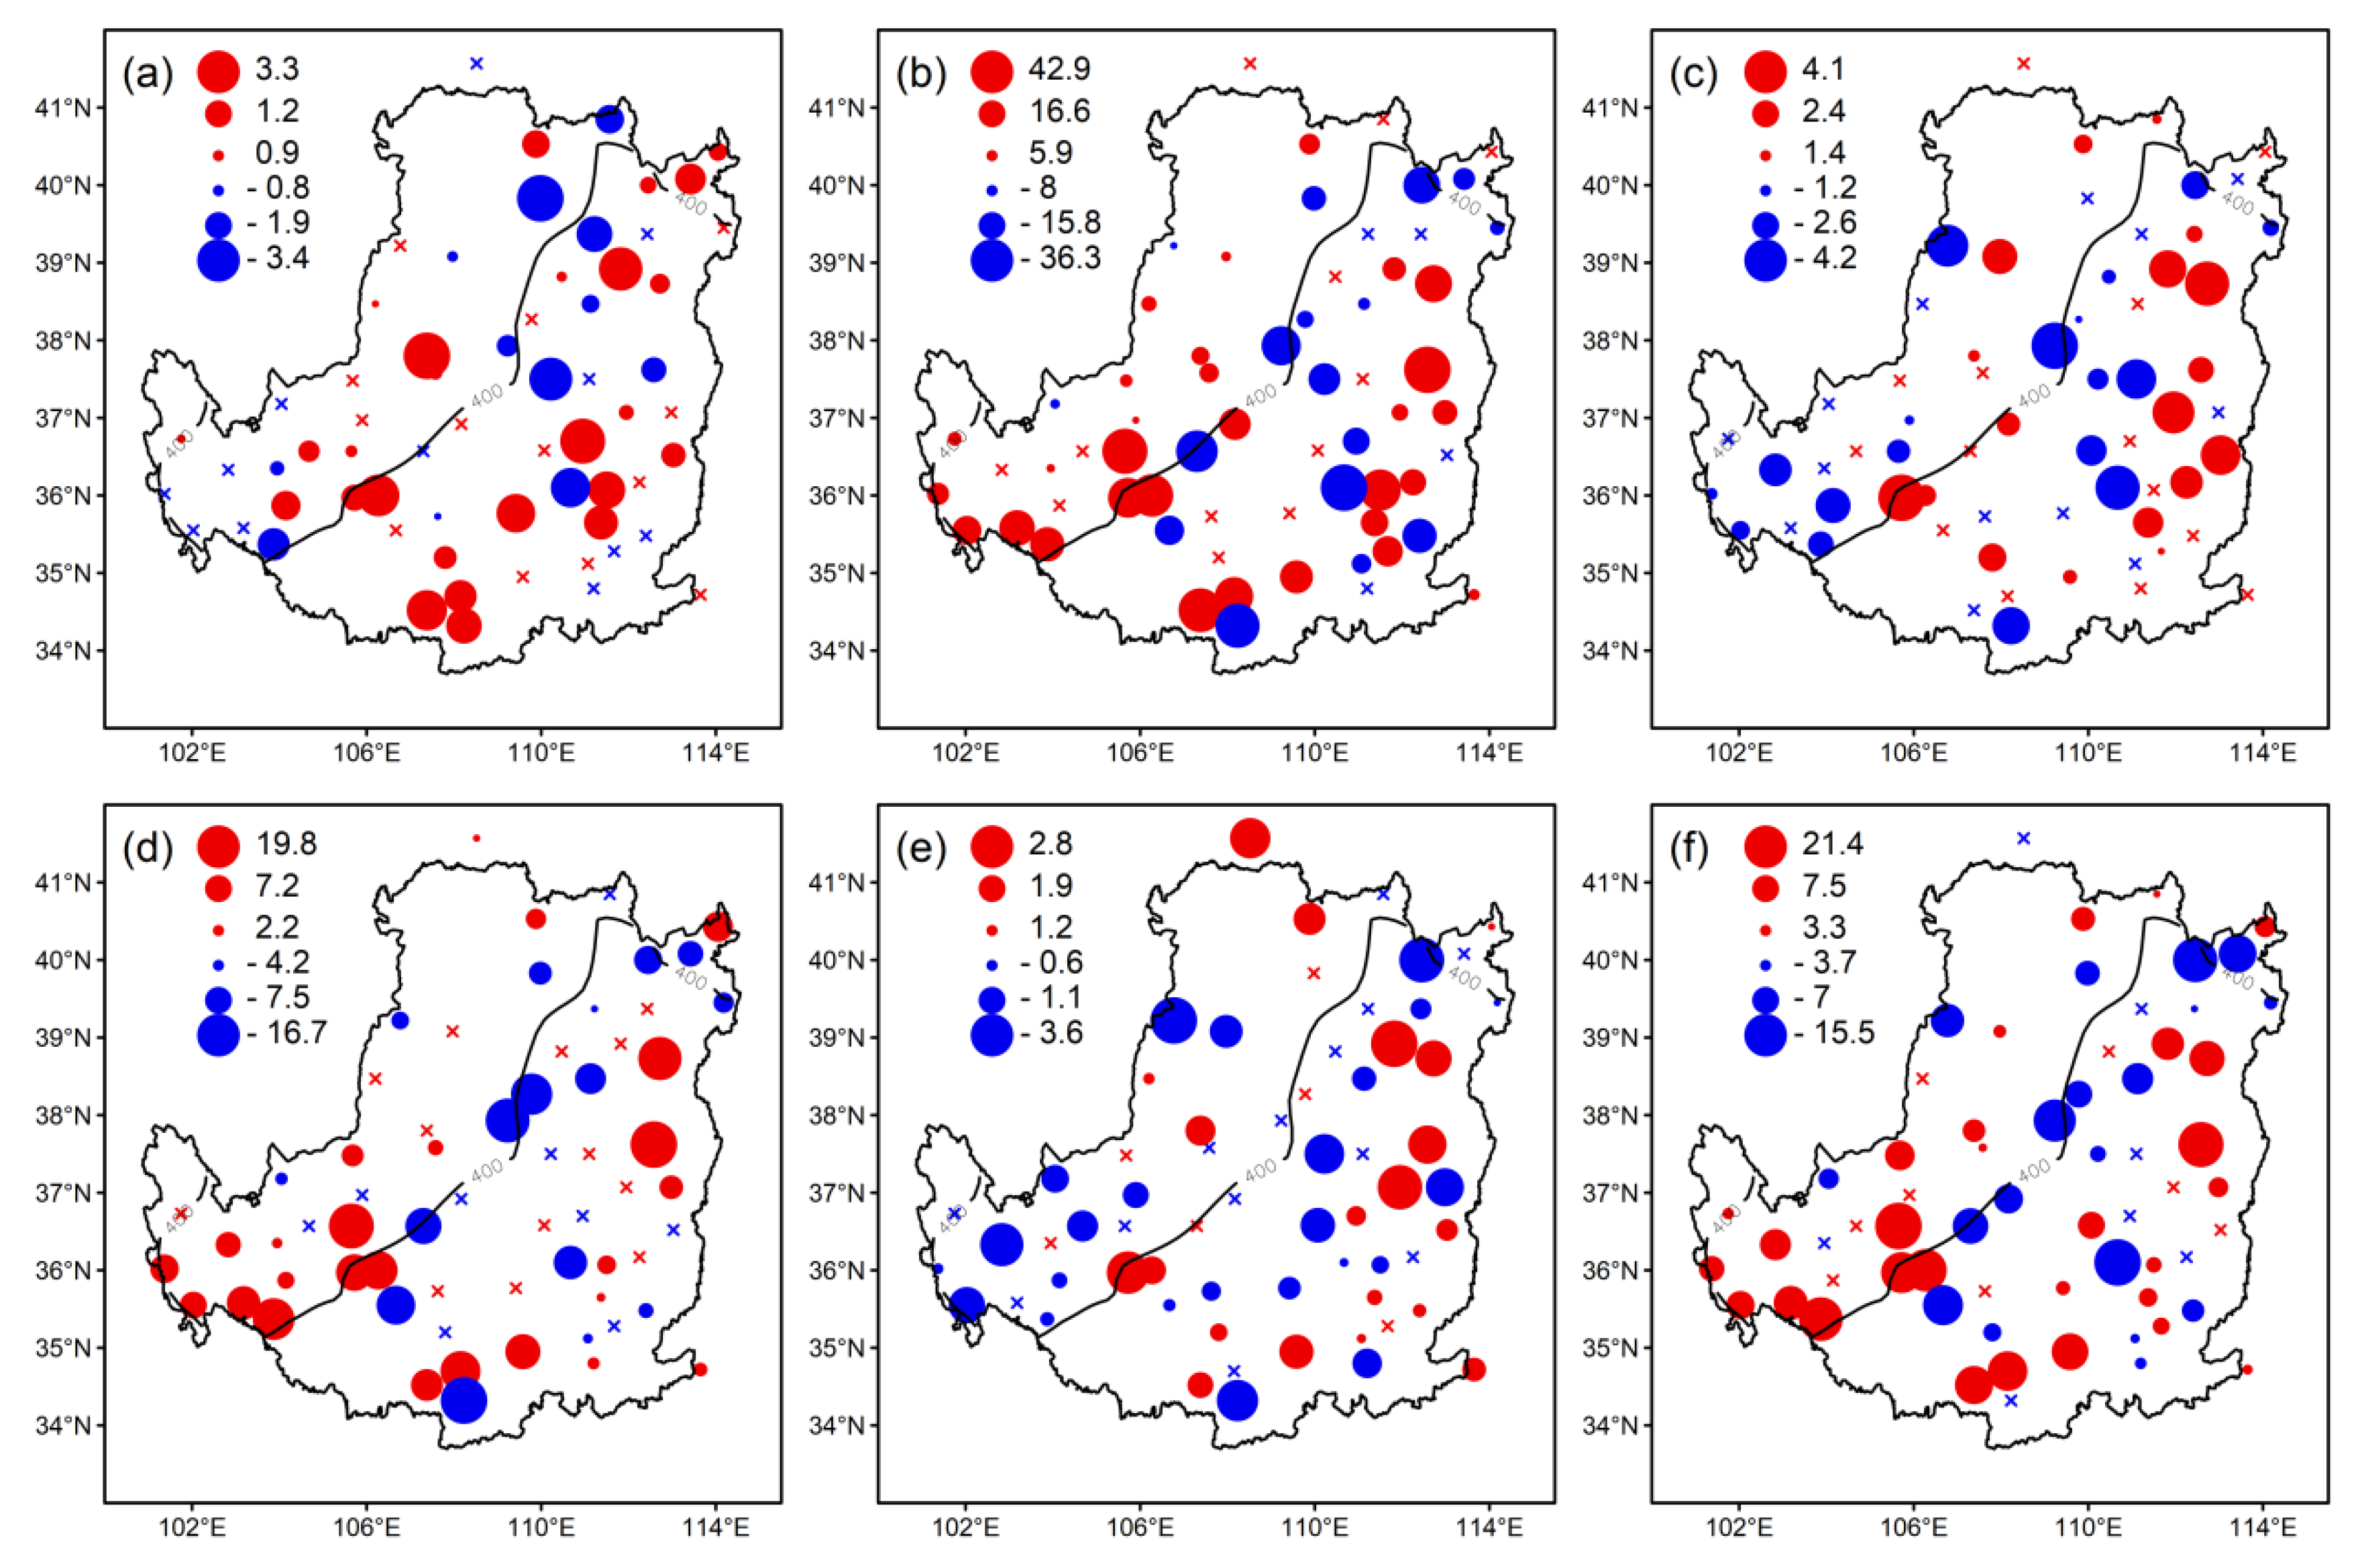

| Indices | Abbreviations | Definitions | Unit |
|---|---|---|---|
| Number of extreme precipitation days | D95 | Number of days with P > 95th percentile (daily precipitation exceeding the 95th percentile of precipitation series during 1971–2000). | days |
| The amount of extreme heavy precipitation | P95 | Annual total amount of precipitation with P > 95th percentile | mm |
| The intensity of extreme precipitation | I95 | Average daily precipitation intensity of extreme precipitation | mm/day |
| Ratio of extreme precipitation | R95 | Ratio of annual total precipitation due to events exceeding the 95th percentile | - |
| ID | Combinations | ID | Combinations | ID | Combinations |
|---|---|---|---|---|---|
| 1 | {D95, P95} | 4 | {P95, I95} | 7 | {D95, P95, R95} |
| 2 | {D95, I95} | 5 | {P95, R95} | 8 | {D95, I95, R95} |
| 3 | {D95, R95} | 6 | {I95, R95} | 9 | {P95, I95, R95} |
| Scheme | Distribution | KS Test | RMSE | AIC | |
|---|---|---|---|---|---|
| p-Value | |||||
| D95 | GMM | 0.143 | 0.568 | 0.055 | −170.089 |
| P95 | GMM | 0.089 | 0.972 | 0.029 | −208.096 |
| R95 | GMM | 0.082 | 0.987 | 0.032 | −202.164 |
| {D95, P95} | Gaussian | 0.022 | 0.615 | 0.027 | −215.108 |
| {D95, R95} | t | 0.024 | 0.697 | 0.032 | −203.671 |
| {P95, R95} | Gaussian | 0.028 | 0.790 | 0.030 | −208.887 |
| {D95, P95, R95} | t | 0.032 | 0.648 | 0.021 | −228.451 |
| Return Periods | {D95, P95} | {D95, R95} | {P95, R95} | {D95, P95, R95} |
|---|---|---|---|---|
| Tor | 8.09 | 7.28 | 7.79 | 7.01 |
| Tk | 11.66 | 13.50 | 11.77 | 12.66 |
| Tand | 13.09 | 15.99 | 13.96 | 17.45 |
| Region | Number of Stations | D95 | P95 | I95 | R95 | ||||
|---|---|---|---|---|---|---|---|---|---|
| A | N | A | N | A | N | A | N | ||
| 1 | 25 | −0.24 | 7 | −11.29 | 11 | 0.36 | 14 | −0.013 | 11 |
| 2 | 38 | −0.27 | 14 | −8.27 | 14 | 1.44 | 24 | −0.004 | 16 |
| Indices | Region 1 | Region 2 | ||
|---|---|---|---|---|
| PI/TG | PD/TD | PI/TG | PD/TD | |
| D95 | 0.31/0.54 | 0.46/−0.63 | 0.16/0.53 | 0.42/−0.95 |
| P95 | 0.19/22.04 | 0.38/−35.7 | 0.24/39.40 | 0.50/−37.01 |
| I95 | 0.27/6.79 | 0.38/−6.80 | 0.42/12.17 | 0.29/−11.63 |
| R95 | 0.38/0.05 | 0.46/−0.06 | 0.34/0.04 | 0.34/−0.05 |
© 2020 by the authors. Licensee MDPI, Basel, Switzerland. This article is an open access article distributed under the terms and conditions of the Creative Commons Attribution (CC BY) license (http://creativecommons.org/licenses/by/4.0/).
Share and Cite
Sun, C.; Huang, G.; Fan, Y. Temporal and Spatial Characteristics of Multidimensional Extreme Precipitation Indicators: A Case Study in the Loess Plateau, China. Water 2020, 12, 1217. https://doi.org/10.3390/w12041217
Sun C, Huang G, Fan Y. Temporal and Spatial Characteristics of Multidimensional Extreme Precipitation Indicators: A Case Study in the Loess Plateau, China. Water. 2020; 12(4):1217. https://doi.org/10.3390/w12041217
Chicago/Turabian StyleSun, Chaoxing, Guohe Huang, and Yurui Fan. 2020. "Temporal and Spatial Characteristics of Multidimensional Extreme Precipitation Indicators: A Case Study in the Loess Plateau, China" Water 12, no. 4: 1217. https://doi.org/10.3390/w12041217
APA StyleSun, C., Huang, G., & Fan, Y. (2020). Temporal and Spatial Characteristics of Multidimensional Extreme Precipitation Indicators: A Case Study in the Loess Plateau, China. Water, 12(4), 1217. https://doi.org/10.3390/w12041217


