Article

Nitrogen Surplus—A Unified Indicator for Water Pollution in Europe?

1
Coordination Unit Climate, Johann Heinrich von Thünen-Institute, 38116 Braunschweig, Germany
2
Agri-Food and Biosciences Institute (AFBI), Belfast BT9 5PX, Northern Ireland, UK
3
Department of Physics and Technology, National Research and Development Institute for Soil Science, Agrochemistry and Environment, 011464 Bucharest, Romania
4
Nitrates, Biodiversity and Engineering Division, Department of Agriculture, Food and the Marine, Y35PN52 Wexford, Ireland
5
Department of Agroecology, Aarhus University, DK-8830 Tjele, Denmark
6
Research Institute of Organic Agriculture (FiBL), 5070 Frick, Switzerland
7
Biotechnical Faculty, University of Ljubljana, 1000 Ljubljana, Slovenia
8
Research and Advisory Board on Sustainable Fertilization and ILVO Plant, 9820 Merelbeke, Belgium
9
Department of Environment, Faculty of Bioscience Engineering, UGent, 9000 Gent, Belgium
10
Research and Advisory Board on Sustainable Fertilization, 9820 Merelbeke, Belgium
11
Polytechnic Institute of Coimbra (IPC), Coimbra Agrarian Higher School (ESAC), Research Centre for Natural Resources, Environment and Society (CERNAS), 3045-093 Coimbra, Portugal
12
Bureau de Recherches Geologiques et Minieres (BRGM), 45060 Orléans, France
13
Environmental Research, Wageningen University and Research, 6700 AA Wageningen, The Netherlands
*
Authors to whom correspondence should be addressed.
Water 2020, 12(4), 1197; https://doi.org/10.3390/w12041197
Submission received: 10 March 2020 / Revised: 14 April 2020 / Accepted: 15 April 2020 / Published: 22 April 2020
(This article belongs to the Special Issue Land Use and Water Quality)

Abstract

:
Pollution of ground-and surface waters with nitrates from agricultural sources poses a risk to drinking water quality and has negative impacts on the environment. At the national scale, the gross nitrogen budget (GNB) is accepted as an indicator of pollution caused by nitrates. There is, however, little common EU-wide knowledge on the budget application and its comparability at the farm level for the detection of ground-and surface water pollution caused by nitrates and the monitoring of mitigation measures. Therefore, a survey was carried out among experts of various European countries in order to assess the practice and application of fertilization planning and nitrogen budgeting at the farm level and the differences between countries within Europe. While fertilization planning is practiced in all of the fourteen countries analyzed in this paper, according to current legislation, nitrogen budgets have to be calculated only in Switzerland, Germany and Romania. The survey revealed that methods of fertilization planning and nitrogen budgeting at the farm level are not unified throughout Europe. In most of the cases where budgets are used regularly (Germany, Romania, Switzerland), standard values for the chemical composition of feed, organic fertilizers, animal and plant products are used. The example of the Dutch Annual Nutrient Cycling Assessment (ANCA) tool (and partly of the Suisse Balance) shows that it is only by using farm-specific “real” data that budgeting can be successfully applied to optimize nutrient flows and increase N efficiencies at the farm level. However, this approach is more elaborate and requires centralized data processing under consideration of data protection concerns. This paper concludes that there is no unified indicator for nutrient management and water quality at the farm level. A comparison of regionally calculated nitrogen budgets across European countries needs to be interpreted carefully, as methods as well as data and emission factors vary across countries. For the implementation of EU nitrogen-related policies—notably, the Nitrates Directive—nutrient budgeting is currently ruled out as an entry point for legal requirements. In contrast, nutrient budgets are highlighted as an environment indicator by the OECD and EU institutions.

1. Introduction

1.1. Nitrogen Budgets and Relation to Water Quality

Nitrogen (N) surplus is used as an indicator to compare the environmental status with regard to nitrogen between the EU and OECD member states. The OECD [1,2] suggested the gross nitrogen budget (GNB) as an appropriate method to calculate comparable indicators at the regional and the national scale. The OECD approach was later adopted by Eurostat [3]. Budgets calculating the nitrogen surplus at the farm level are particularly used to determine the leaching potential from arable land [4]. According to Eurostat/OECD [3], the term “nitrogen budget,” as introduced by [5], is more comprehensive and appropriate than the term “nitrogen balance,” as it includes a summary of all major N flows between the major compartments of agriculture and the environment. One aim of the Horizon2020 European Union-funded project FAIRWAY (farm systems management and governance for producing good water quality for drinking water supplies), running from 2017 to 2021, is to identify “agri-drinking water indicators (ADWIs)”: harmonized indicators—preferably at the farm level—for detecting nitrate pollution of ground and surface waters and for monitoring implemented mitigation measures. These ADWIs should be “ready to use” and produce comparable results across Europe. Therefore, we conducted a survey among the experts within the project and selected experts of further countries in order to evaluate the current state of applying nitrogen budgets at the farm level in Europe and the possibility of establishing nitrogen budgets as a unified ADWI at the farm level. In this paper, we thus focus on calculation methods and implementation set ups for nitrogen budgets at the farm scale in different European countries. Looking at nitrogen budgets from a comparability and applicability perspective, we discuss the differences and decisive parameters and so contribute to the current state of research.
In Austria, Wick et al. [6] used the nitrogen land budget to compare nationwide regional agricultural budgets with the concentration of nitrates in groundwater of corresponding catchments, finding a good statistical correlation.
Wick et al. [6] reported that a couple of authors cast doubt upon the applicability of the soil surface budget to assess the actual nitrate leaching. The budget is a theoretical concept describing only the potential for groundwater contamination [7,8,9]. Wick et al. [8] further explain that some authors find only a poor statistical relationship between the soil surface budget result and nitrate leaching, using correlation analysis [10], analysis of covariance [8,10] and regression analysis [9,10,11]. According to [8], these statistical evaluations are geographically and temporarily limited. This can be explained by the fact that the soil surface budget is an indicator for potential N loss through nitrate leaching, subject to denitrification and shifts of soil organic matter (SOM) content as interfering elements. The rate of denitrification as well as the share of N input fixed in SOM differs between soils, climatic zones and types of farm management.
Hansen et al. [12] found significant correspondence between developments in N surplus and nitrate concentrations in upper groundwater for four subsequent development periods for Danish agriculture in the period 1946–2012, and similarly for developments in the nitrogen use efficiency.
Dalgaard et al. [13] calculated gross farm budgets for six European landscapes in Poland, The Netherlands, France, Italy, Scotland and Denmark as an indicator for N losses: the highest surpluses were found in livestock-intensive landscapes. The authors found significant correlations of N surplus to both nitrate concentrations in soils (A-horizons) and groundwater, measured during the period of N management data collection in the landscapes (2007–2009).
Andelov et al. [14], went a step further, assessing nitrogen reduction levels necessary to reach groundwater quality targets in Slovenia. For this purpose, the hydrological model GROWA–DENUZ (Großräumiges Wasserhaushaltsmodell-Denitrifikation in der ungesättigten Zone) was coupled with agricultural N budgets and applied consistently to the whole territory of Slovenia. Model results indicated that additional specific N reduction measures should be implemented in priority areas rather than across a whole country. This would allow the development of specific measures and spatial allocation of financial funds.

1.2. Nitrogen Surpluses as a Result of Budgets and as Indicators for Measures and Policies

For Switzerland, Spiess [15] calculated nitrogen (as well as phosphorus and potassium) budgets in the period 1975–2008. Intensification of Swiss agriculture after 1950 was characterized by increasing plant nutrient inputs into the agricultural production system. The farm gate budget for 2008 showed a surplus of 108 kg N. Nutrient surpluses rose between 1975 and 1980 and then decreased significantly until 2008, with a higher percentage of relative reductions for P (80%) and K (54%) than for N (27%). A pronounced decrease in nutrient surpluses was achieved through the introduction of direct payments for ecological programs in 1993. Reductions in mineral fertilizer use and N deposition primarily caused lower surpluses. Uncertainties in the budget calculation were mostly due to biological N fixation and atmospheric deposition. Recent figures show that N surplus has stagnated on a high level for the last two decades.
In France, Poisvert et al. [16] calculated N soil surface budgets according to [17] between 1940 and 2010 for metropolitan France. The authors showed that there was high variation for the N budgets between regions and time and performed a sensitivity analysis, revealing that N removal by crop production and N inflow by organic fertilizer use contributed most to total uncertainties in the N budgets. The average of the departmental imprecision in N surpluses ranged from 6 to 45 kg N/ha per utilized agricultural area (UAA) per year for the whole period, with an average of 21 kg N/ha per UAA per year, calculated by a Monte Carlo simulation analysis. Imprecisions were mainly linked to N export and organic fertilization, but also to symbiotic N fixation. Between 1940 and 1991, there was an upward trend in N surplus for 82% of the studied area. Between 1991 and 2010, there was a downward or stable trend for more than 90% of the area, probably as a consequence of the implementation of the Nitrates Directive.
In Portugal, Cameira et al. [18] quantified the gross soil nitrogen budget between 1989 and 2016, according to [17], for representative groups of crops in a catchment located in a nitrate vulnerable zone (NVZ). The N surplus varied over the 27 years, showing a general decrease of 1.8 kg N/ha/year, according to the type of crop. A higher decrease (26%) in N surplus occurred between 1989 and 1999 due to the reduction in fertilizer sales at the country level. After 2005, although at a lower rate, N surplus continued to decrease due to the restrictions imposed by the national action program linked to the Nitrates Directive.

1.3. Nitrogen Budgets for Investigating Farm Performance and as Tool for Farm Advice

Gourley et al. [19] calculated farm budgets for N, P and K for 41 representative Australian dairy farms. N surpluses ranged from 47 to 601 kg*ha−1 and nitrogen use efficiencies ranged from 14% to 50%. Imports and exports were measured individually. The authors detected a wide within-farm variation in the nutrient; content of forages, whereas variation in nutrient concentrations, except for sulfur, of the produced milk was small (CV < 15%). In organic farms, nutrient concentrations of forages were generally lower than in conventional farms. The authors conclude that an increase in milk production per ha is associated with rising nutrient surpluses at the farm scale, with potential for growing environmental impact.
In Flanders, a farm gate advice system for livestock farms, including deposition but not fixation, was developed in the first years of the new millennium [20]. In order to validate the advice system in practice, farms of the different livestock sectors were followed closely. The farm gate advice system was tested in Hungary at a limited number of farms, revealing that that agriculture is still clearly less intensive in Hungary. Four major restrictions to the accurate calculation of farm-level nutrient budgets were identified: (1) the wide variability that is allowed between the actual and reported nutrient composition of concentrated feed; (2) the estimates of the amount and the composition of manure; (3) the assessment of changes in standing stock on the farm between the beginning and end of the reporting period; (4) the accuracy of the data supplied by the farmers [21]. At present, in Flanders, nutrient budgeting at the farm level is compulsory only in certain cases. In order to restrict the nitrogen and phosphorus fertilization and still meet the crop nutrient needs, now yield and nitrogen dose response curves are developed by a re-evaluation of field experiments, also calculating soil surface budgets [22]. The Nmin (0–90 cm) is measured regularly in some farms between October 1 and November 15, as the main leaching period is during the winter. The measurement of Nmin also gives a good evaluation of the N fertilization rate [22]. However, the nitrate leaching risk also depends on the crop residue and presence of catch crop [23].
In Switzerland, in its annual environmental report, the federal office for agriculture publishes N budgets for farms in different regions (valley, hills, and mountains). These aggregated data are deduced from 300 farms whose owners voluntarily calculated N budgets according to the OECD soil surface budget [24].
In France, the CORPEN (Comité d’ORientation pour des Pratiques agricoles respectueuses de l’ENvironnement) soil surface budget [25] was introduced on a voluntary basis to measure nitrogen surplus at the farm level. Updates are regularly available. The budget is mainly used by animal breeding farms as, in France, this type of farm has to prove that there is no structural over-fertilization with breeding effluents.
In Germany, due to the legislation, a range of tools are in use to calculate N budgets according to the national legislation and specifications of the federal States.
In the Netherlands, permissible manure and N fertilizer use rates in arable and dairy farming systems were calculated using N budgets based on standard farms on sandy soils. Nitrate leaching was estimated from the N surplus and leaching fractions (the fraction of the N surplus that leaches a nitrate from the rooting zone) that depend on land use and soil type. Through calculations based on experimental data from various sources, the limits on the use of cattle slurry and mineral fertilizer in grass and silage maize production on sandy soils were calculated [26].

2. Materials and Methods

As our research is focused on the use of nitrogen budgets at the farm level, we define the framework within which we carried out our survey.

2.1. Theoretical Framework

Budgets are applied on various levels and can be calculated differently, according to the system boundary (farm, soil or land) they refer to [3].

2.1.1. Budget Type

The (net) nitrogen soil (surface) budget takes the soil surface as the boundary. Only nutrient inflows to the soil and nutrient removal from the soil are taken into account. The soil budget, therefore, requires data on manure and fertilizer applications to the soil. The term “net” refers to the fact that the result of the soil surface budget approach results in N surpluses excluding N gaseous emissions occurring before the application of manure and other fertilizers to the soil [3] (Figure 1a).
The (gross) farm (gate) budget refers to the farm boundaries and records the nutrients in all products that enter and leave the farm gate. N emissions from stables and manure storages or during the application of organic fertilizers to land are not explicitly accounted for and neither are changes in soil pools and storages. However, all these emissions are part of the nitrogen losses and thus contribute to the total nitrogen surplus in the gross budget (Figure 1b). Farm budgets can also be calculated at larger scales, e.g., at the country level—in that case, the whole farming sector in a country is considered as a single farm [3].
The (gross) land budget approach aims to estimate the total nutrient loads at risk of pollution (air, soil and water). The land budget, therefore, requires data on excretion. The term “gross” refers to the fact that the result of the land budget, the gross nitrogen budget (GNB), includes all N emissions to the air [3] (Figure 2).
In summary, nitrogen surplus data thus may be derived from different calculation methods, including the above-mentioned total N budget assessment [5] and system boundaries may vary between methods.

2.1.2. Level of Application of Budget

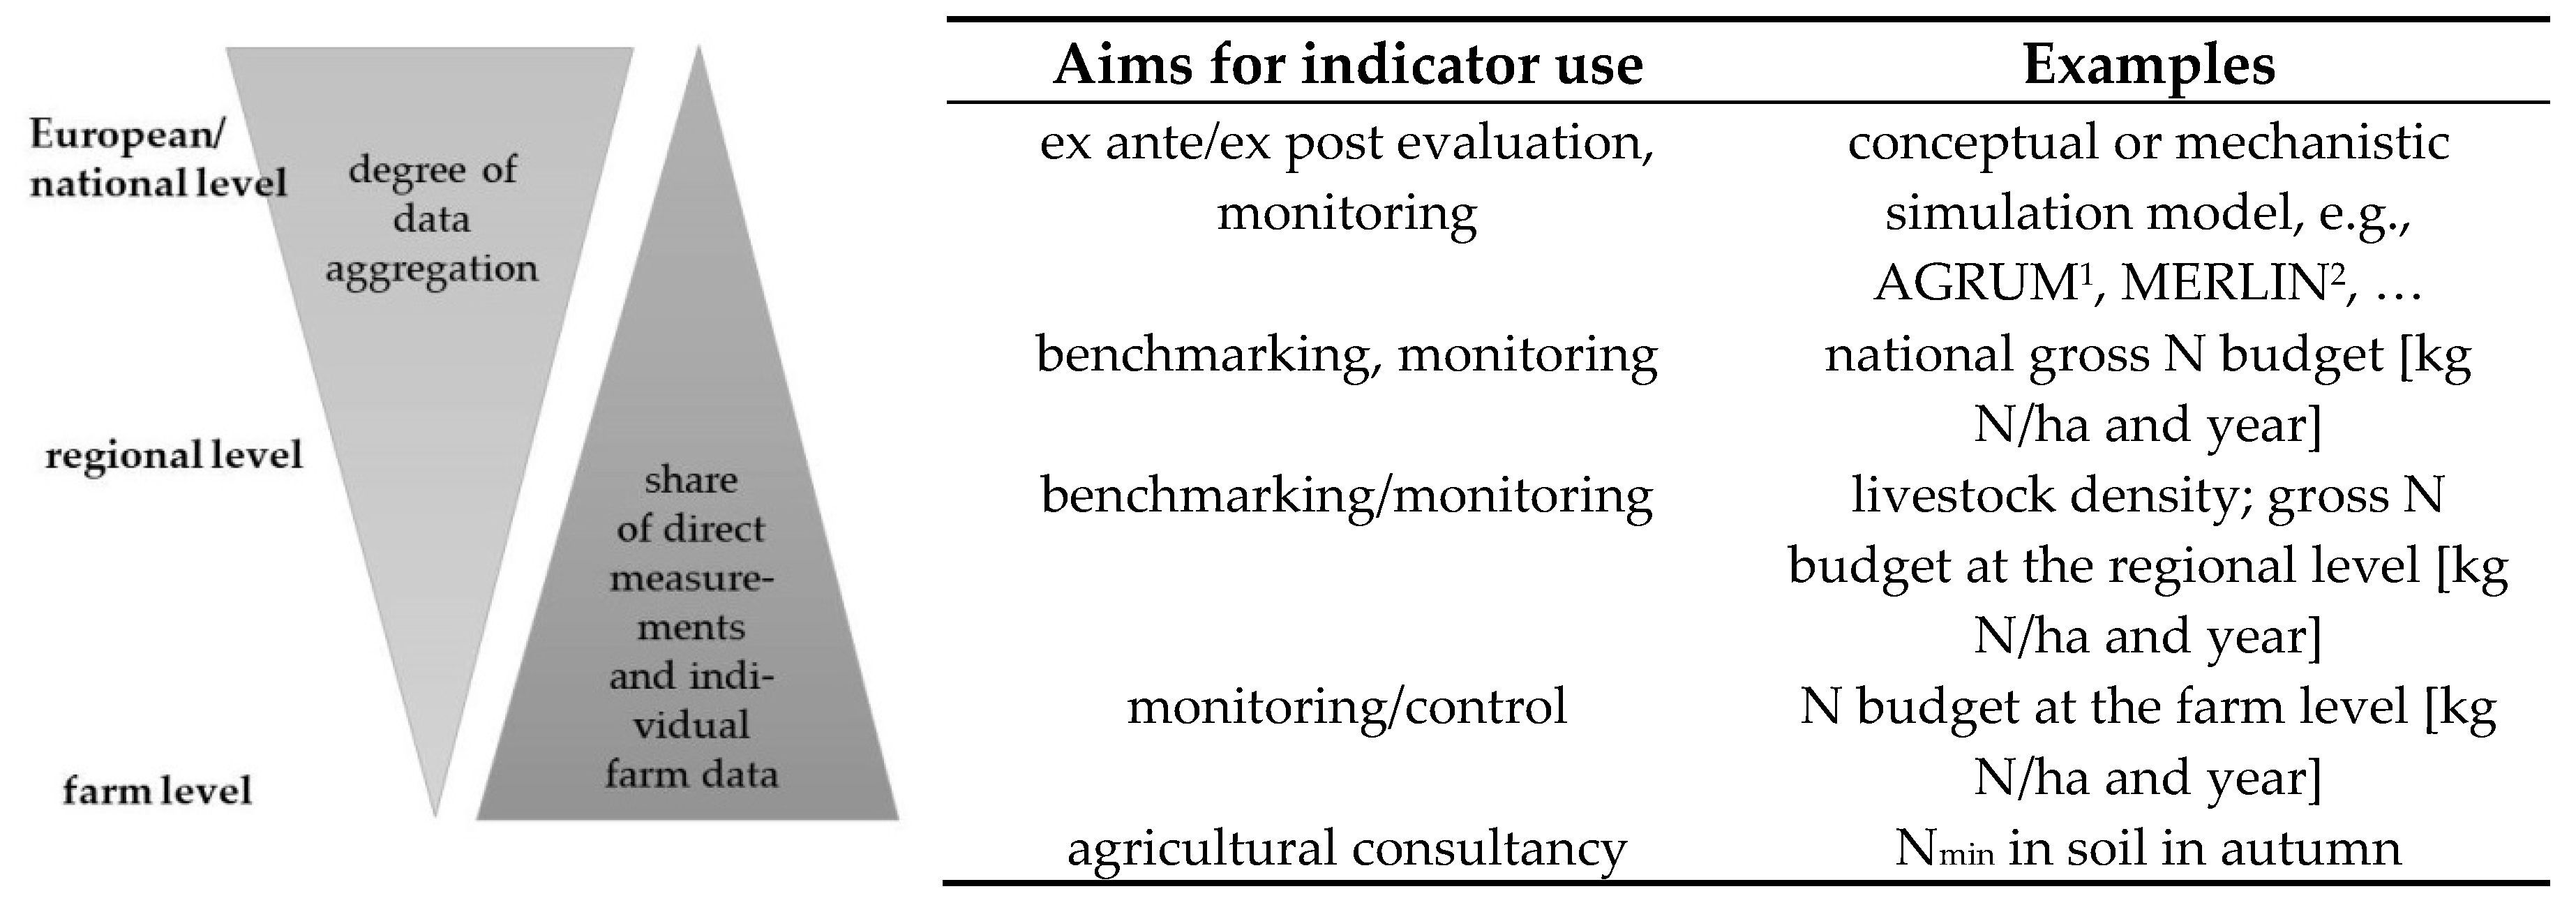
Nitrogen surplus is used as an indicator on different decision levels—at the national, regional, farm and even field levels—as a parameter in legislation, for consulting farmers, benchmarking, and monitoring, but also for taking political decisions and is thus quite a common indicator for land and water managers. Nitrogen surpluses are calculated from individual or standard data. From the field level or the farm level towards higher levels, the degree of data aggregation increases and the share of individual farm data and direct measurements decreases (Figure 3).
At the level of EU member states, the GNB is applied as the only agri-environmental indicator (AEI) for nitrogen efficiency and, consequently, as an indicator for the pollution of ground- and surface water with nitrogen [28]. Data from all EU member states, as well as Switzerland and Norway, are reported to the European Commission regularly, such as in the four-yearly report of the Nitrates Directive. However, Eurostat [3] points out that the current national budgets quoted are not comparable between different member states due to differences in the definitions, methodologies and data sources used. Budgets at the national level are also calculated in order to monitor the effect of the implementation of policies and measures [15,32].
At the regional level (for administrative districts or (sub) catchments), nitrogen budgets are calculated in order to indicate the regional nitrate leaching potential [6,14,16].
At the farm level, budgets are used to investigate farm performance [19,20,22,26,33] and are used as a tool for farm advice [21,25]. One aim of the survey conducted was to determine the prevalence of fertilization planning and budgeting as nutrient management tools at the farm level.

2.2. Survey on Nitrogen Budgets at the Farm Level

Fertilization planning and nutrient budgeting represent two different perspectives: while fertilization planning is performed ex ante in order to limit input of nitrogen and other plant nutrients both timely and according to plant needs, budgeting the inflow and removal of N or other nutrients from the system is applied ex post and reveals the efficiency of the process. Consequently, in this paper, we cover both perspectives.
We investigated to what extent and at which levels nitrogen budgets are applied in the different member states. We contacted experts of the following member states (contacts within the framework of the Horizon2020 project FAIRWAY are marked with *): Belgium (Flanders)-B(Flan), Denmark-DK*, England*, France*-FR, Germany*-GE, Greece*, the Netherlands*-NL, Northern Ireland*-UK-NI, Portugal*-PT, Romania*-RO, Republic of Ireland-IE, Slovenia*-Sl and from outside the European Union Switzerland-CH and Norway*.
Using an expert survey, we conducted a questionnaire to collect information on:
  • The type and elements of fertilization plans and budgets used at the farm and plot levels,
  • The type and elements of budgets used at the regional or national levels,
  • The legally binding procedures in connection with the use of fertilization plans and budgets,
  • The informative value of budgets, according to budget type, and
  • The barriers in the use/implementation of budgets according to the individual experience and the experience in the FAIRWAY case studies.
The results of the questionnaire were analyzed and compared, and then discussed in detail with the experts.

3. Results

3.1. Prevalence of Fertilization Planning and Budgeting at the Farm Level

In all countries participating in this survey, farmers regularly set up a fertilization plan ex ante fertilization (Table 1). In the Netherlands and Flanders (Belgium), the fertilization plan is compulsory for farms with derogation (higher amount of N from manure). In Flanders, the fertilization plan is also compulsory for farms with high soil mineral nitrogen (Nmin) values in autumn and after a bad audit. Fertilization between 1 September and 30 October is only allowed for horticultural crops and based on fertilization advice. In Regions 1–3, which have bad water quality, fertilization advice is needed for a portion of strawberry, vegetable and floricultural fields.
Within the 6th action program in Flanders, nutrient and mass balances are suggested for manure processing and anaerobic digestion facilities as risk analysis of the manure export of farms. In France and in Portugal, fertilization plans have to be calculated only on farms situated in NVZs. Farmers in France may deviate from the fertilization plan in cases where (1) they use a planning tool (2), their yields exceed the standards or (3) they had a problem on the particular plot. Fertilization plans are not generally legally binding in Switzerland and the Republic of Ireland. In the Republic of Ireland, farms with derogation, however, have to set up a fertilization plan based on soil analysis results and stocking rates. In Slovenia, fertilization plans have to refer to the exact field in case set target values for total N use on certain crops are exceeded.
Nitrogen budgets ex post fertilization are obligatory only in Switzerland, Germany and Romania. In the Netherlands, nitrogen budgets are calculated in the dairy sector at the farm level, but they are not compulsory in a legislative sense. In Slovenia, a simple N budget is calculated at the administrative level for the use of organic fertilizers based on livestock unit (LU) and land area (LU/ha). In order to receive subsidy payments, farmers need to prove that they comply with these cross-compliance standards linked to the Nitrates Directive.

3.2. Results on Fertilization Planning

3.2.1. Factors Considered in Fertilization Planning

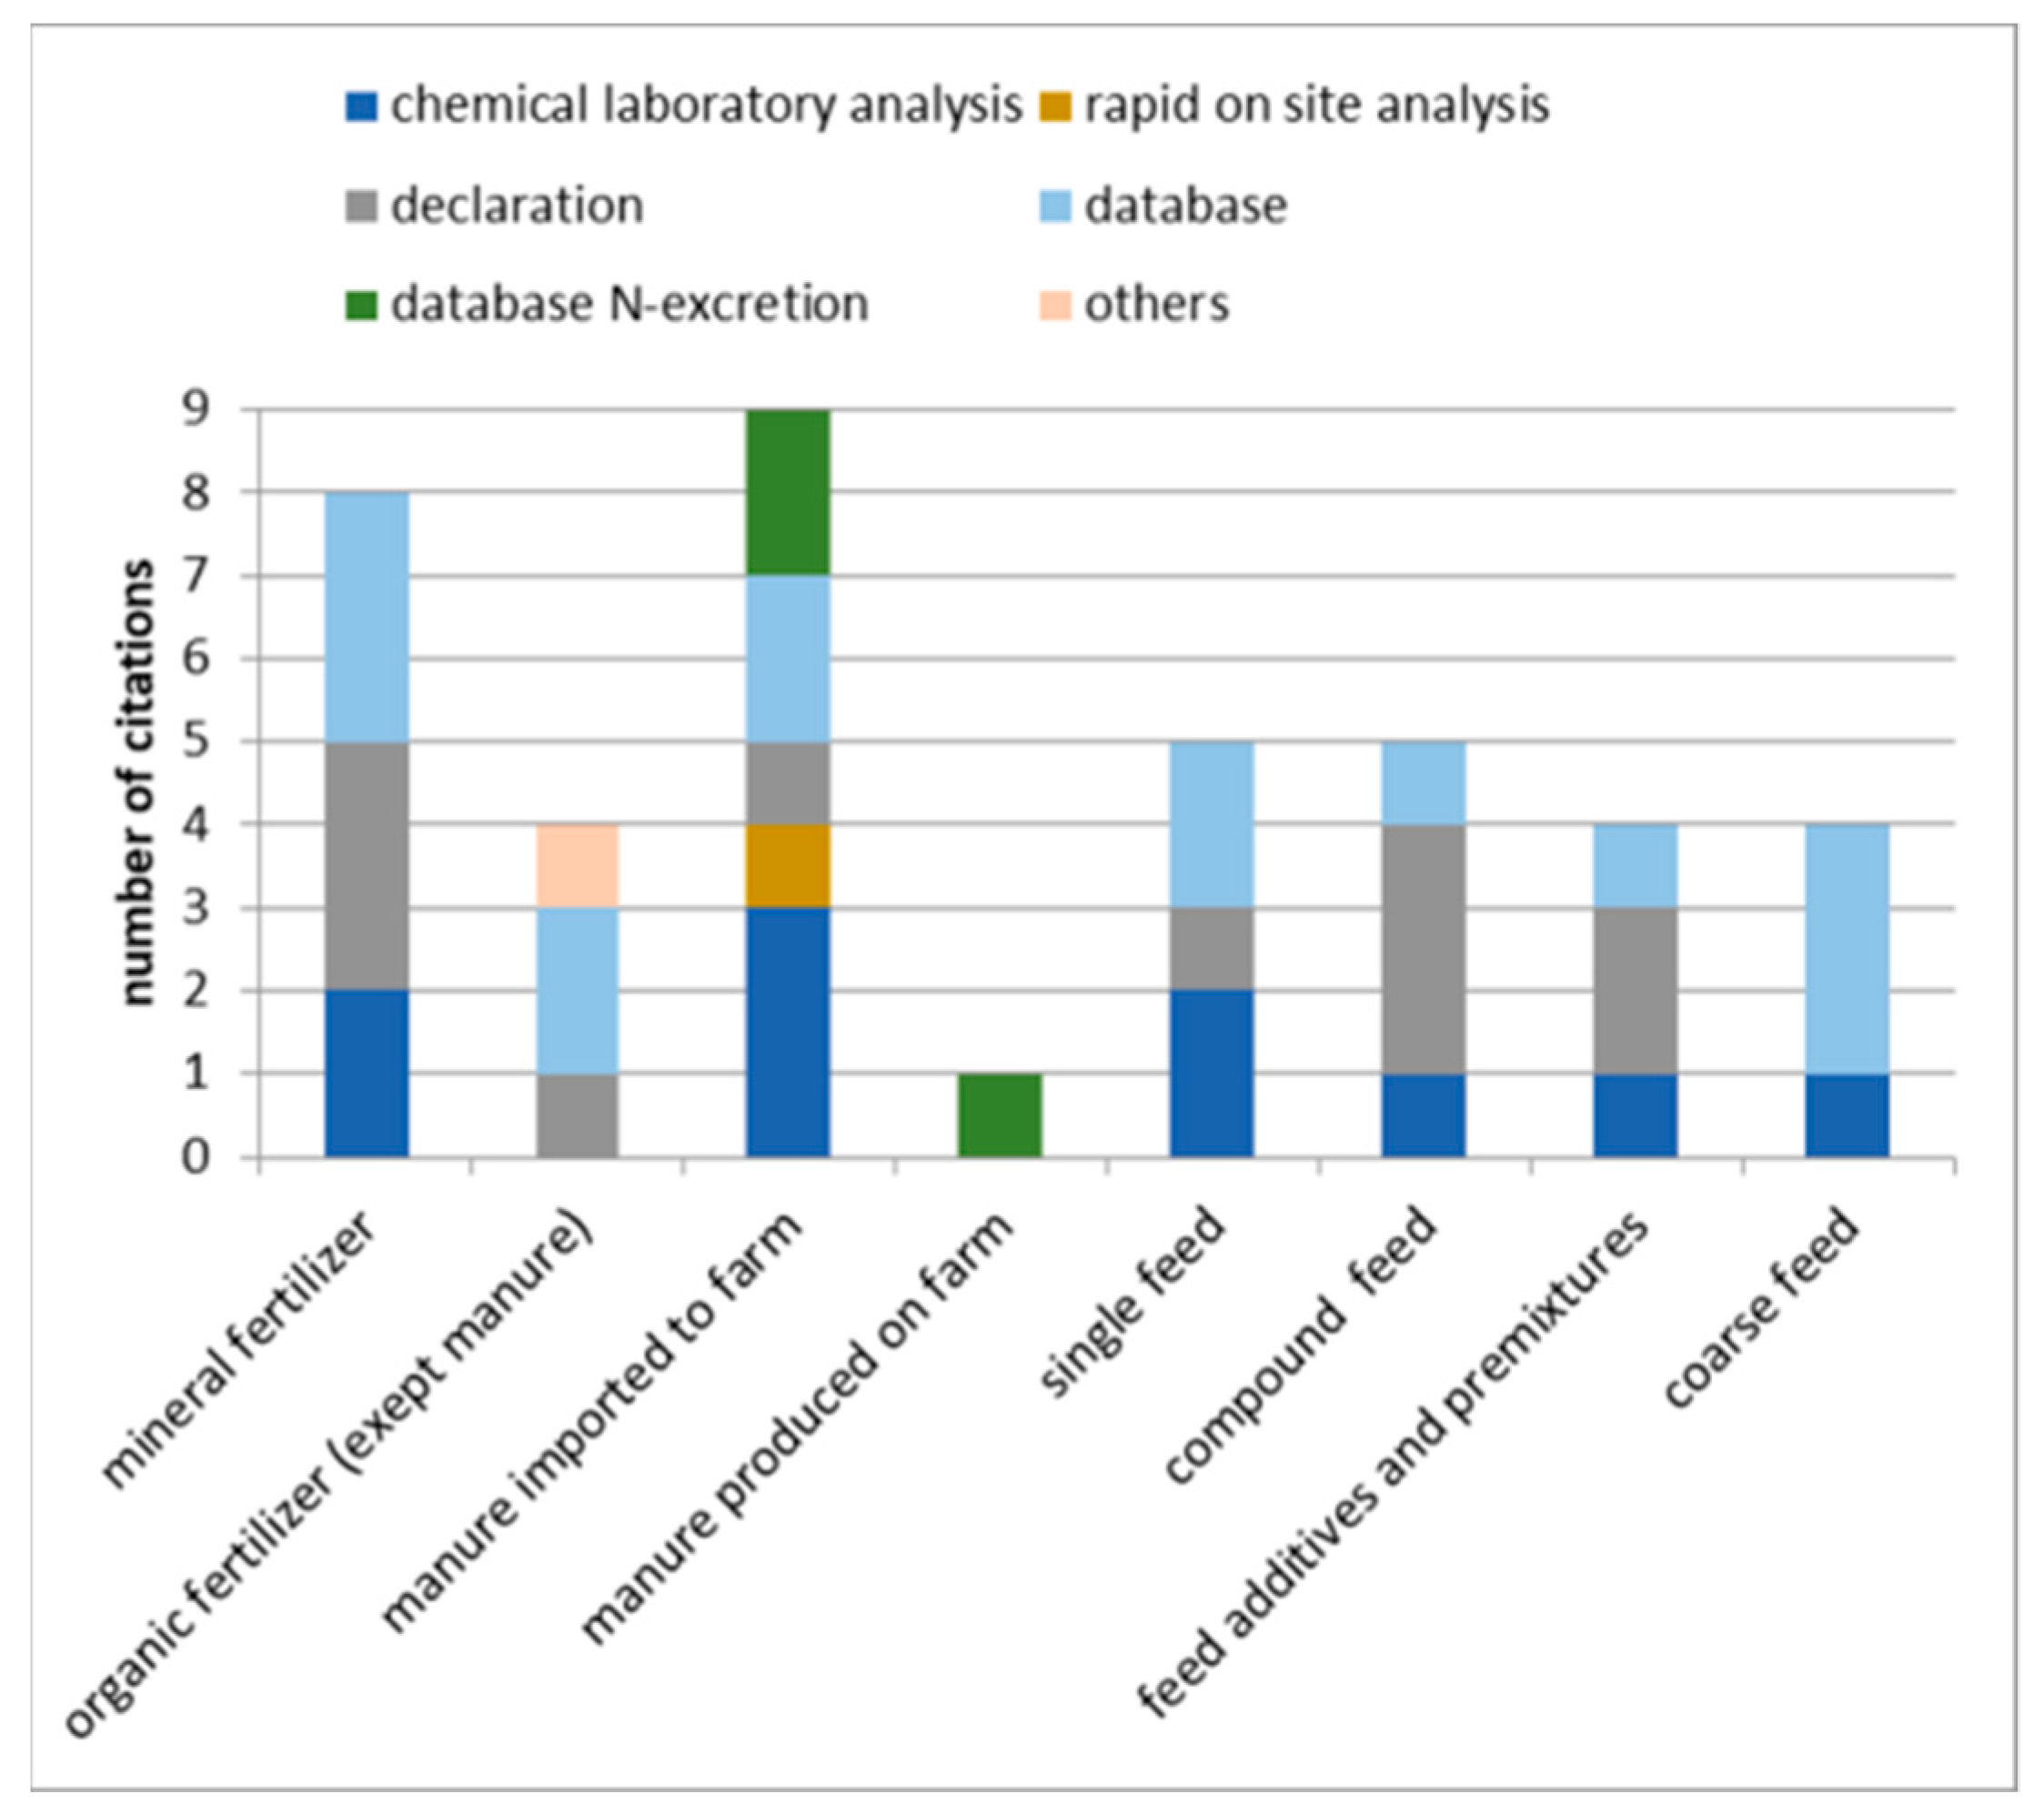
In different countries, the complexity of fertilization planning varies considerably (Figure 4). In most cases, basic information is drawn from databases. These figures are subsequently modified according to individually expected yields, qualities, plant varieties or whether grassland is grazed or cut. The fertilizing demand is subsequently further reduced according to the amount of Nmin available at the beginning of the vegetation period (Nmin), other residual effects (of preceding crop or previous organic fertilization) or the soil type. In Romania, certain basic information is aggregated to indices.

3.2.2. Impact of Technical Progress on Nitrogen Requirement of Crop

Technical progress may also increase nitrogen efficiency and thus reduce initial nitrogen requirements for the fertilization planning (Figure S1). Split application was quoted by five respondents of this survey, and low-emission application techniques particularly for liquid manure and fermentation residue (drag hose, trailing shoe, strip application and injection) by three respondents as a reason for reduced nitrogen emissions and, consequently, increased plant availability of nitrogen in fertilizers to crops. Precision farming techniques have not yet reached a wider practice level and, therefore, are not referred to in official guidelines for fertilization planning. However, in Denmark, there is a special demonstration scheme on this issue, which may develop into a permanent scheme. The Swiss fertilization guidelines (GRUD) [34] address fertilizer application according to “good agricultural practice”, meaning that fertilizer amounts per application are limited to certain thresholds and application should be performed in such a way that losses are minimized. Thus, N availabilities listed in the guidelines indirectly imply low-emission application techniques and/or rapid incorporation of organic fertilizers in order to minimize emissions.

3.2.3. Factors Used to Estimate Plant-Available Nitrogen in Manure and Other Organic Fertilizers

For the estimation of plant-available nitrogen, a range of variables is referred to in the different countries. In some member states, standard figures for gaseous nitrogen losses from stables and storages are deduced from standard excretion figures for the different animal categories. In other member states, only the available nitrogen as a percentage of the applied nitrogen to soil with the organic fertilizer (manure, biogas digestate or compost) is referred to.
The scales of reference for the calculation figures vary as well: in Denmark and in Slovenia, for example, the amount of manure, its dry matter content, nutrient concentration and corresponding N emissions are listed for different animal categories with reference to the head of animal. In Germany, nutrient excretions are listed for different animal categories and nutritional regimes, with reference to one animal place (i.e., head of animal per year).
Aerial nitrogen losses occurring during manure application in some member states are considered, with reference either to the excreted or to the applied N (Table 2). In Germany, ammonia emissions after fertilizer application are not taken into account for the calculation of the plant-available N, but for setting up the soil surface budget ex post fertilization.
Swiss fertilizer guidelines provide information on N excretion, the amount of manure and different nutrient concentrations with reference to different animal categories. Whether figures refer to animal head or animal places depends on the animal category. The data consider unavoidable losses in stables and storages. Emissions during/after application are not taken into account as application technique and timing should be chosen in such a way that NH3 losses are minimized.
Similarly, in Flanders, the measured or average N concentration in manure (after losses from stables) is considered as plant-available N. As manure has to be applied with low-emission techniques, it has to be worked into the soil within 2 h, and no further ammonia losses are taken into account, as they have to be minimized. In Slovenia and Portugal, there is also no deduction of gaseous emissions during manure application.

3.2.4. Emission Factors for Nitrogen

Standard emission factors for nitrogen (predominantly as ammonia) after organic fertilizer application were reported by five countries. The emission factors vary broadly between 5% and 30% of applied nitrogen for Germany and Romania, indicated as the % of excreted nitrogen. There is a slight tendency for solid organic fertilizers towards a higher standard excretion factor than for liquid organic fertilizers. However, based on the length of time the animals spend outside on the pasture, higher emissions can be considered in some countries, e.g., in Germany (Figure S2).

3.2.5. The Plant Availability of Nitrogen in Manure

Table 3 lists the reported values for the crop availability of nitrogen in manure according to Webb et al. [35]. The values of the current survey are inserted as red, bold figures. Nitrogen availabilities refer to the applied nitrogen on or into the soil. There are slight differences in the values reported by some of the countries in the present survey, but generally a higher nitrogen availability is assigned to liquid manure than to solid manure. The nitrogen availability in cattle manure is lower than in pig manure while the figures vary a lot for poultry manure. Anaerobic digestion results in an increased nitrogen availability of the digestate in comparison to the initial substrate (manure, renewable raw materials). Aerobic treatment, on the other hand, leads to a decreased and prolonged nitrogen availability of the compost in soil (figures on N availability in compost are not included in Table 3).
Slovenia recently updated the values on crop availability. Availabilities are defined for three consecutive years, there is no distinction between animal type, but between solid and liquid manure and between arable and grassland: the crop availability of nitrogen in solid manure on grassland is comparably low, at 50% [37]. For the Suisse Balance, farmers who receive subsidies for manure application by drag hose have to add 3 kg Navailable/ha to their Suisse Balance. By this, increased efficiency upon drag hose application is considered at least for the N budget, but not for the fertilization planning.
Countries which do not declare specific emission factors for nitrogen losses prior or during manure application (e.g., Flanders, Northern Ireland and the Republic of Ireland) do not stipulate lower nitrogen availabilities—the effect is a slight improvement in the legal requirements. However, the overall impact also depends on the underlying N excretion coefficients per head of animal.

3.3. Elements of Soil Surface Budgets

Five countries gave further information on the elements they include in their soil surface budgets (Germany, the Netherlands, Romania, Switzerland and Slovenia, although in Slovenia, the information required by law is limited to the relation of organic N production to land area (LU/ha). Nitrogen emissions from organic fertilizers and manure are considered in all above-listed practitioners of soil surface budgets, so the net budget is the more widely used budget version. The Suisse Balance, however, does not strictly follow a soil surface approach, but rather a combination between soil surface and farm gate balance. However, as it is more related to a soil surface budget, it was considered as such.
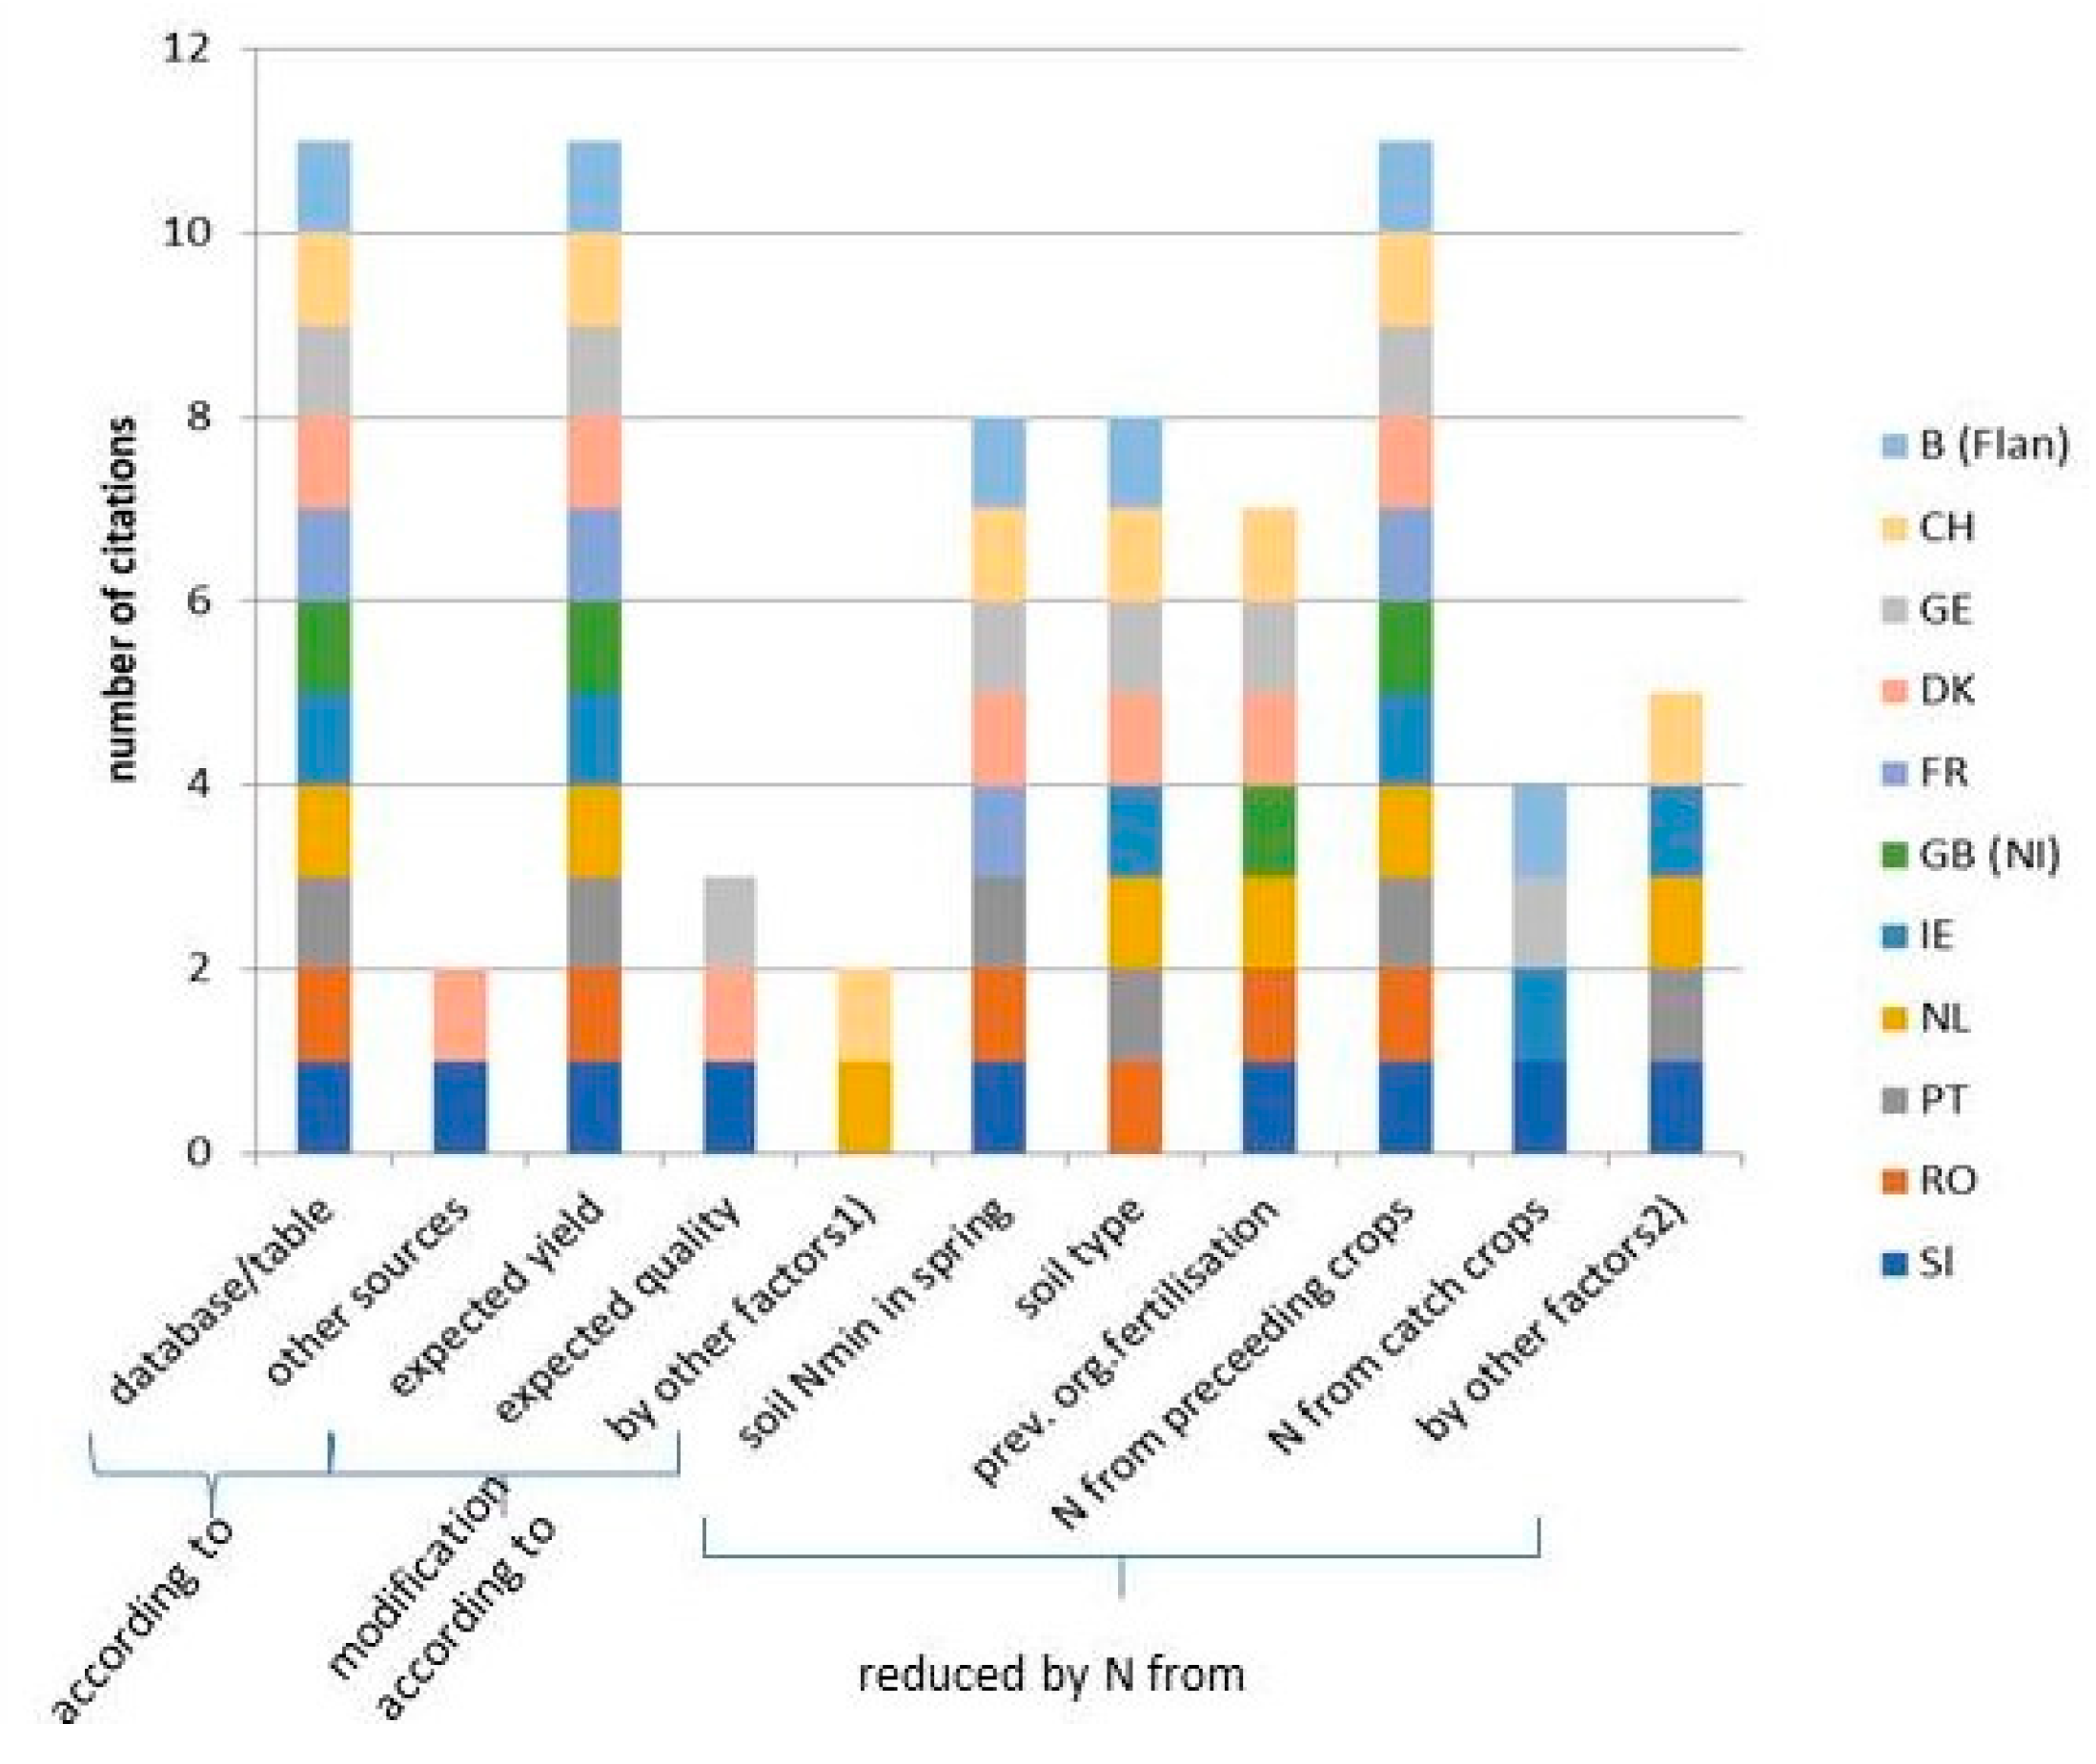
On the inflow side of the farm budget, the chemical composition of mineral fertilizers and traded organic fertilizers (other than manure) is mostly taken from product declarations or databases. For the determination of the nitrogen content in manure imported into the farm, various options are used, including chemical lab analysis and rapid on-farm analysis, declarations and databases on nitrogen concentration in manure and on nitrogen excretion of farm animals. Manure produced on the own farm is analyzed less frequently. Instead, in this case, databases are used to determine nitrogen concentration (Figure 5).
The quantity of fertilizers is mostly weighed, less frequently estimated or taken from the product declarations. Quantitative information on seeds and planting material mostly derives from product declarations. Quantification of leguminous nitrogen fixation and nitrogen deposition is mostly deduced from tables, or the amounts of nitrogen entering the system are estimated (Figure S3).
Nitrogen removal take places through various kinds of harvested crops. For arable crops which are regularly analyzed post-harvest as part of a quality assessment (e.g., for a payment according to their raw protein concentration), these data are used for the budgets—otherwise, the nitrogen concentration is deduced from databases. The same may be the case for harvested fodder plants. The largest uncertainty is related to the amount of nitrogen removed by grazing animals (Figure 6).
Quantities of cash crops and fodder harvests are weighed, but also estimated. The quantity of forage consumption by grazing animals is estimated, partly on the basis of tables and with reference to the particular animal performance (Figure S4).

3.4. Elements of Farm Budgets

Germany, Romania, Northern Ireland and the Netherlands reported on the elements used for farm budgets in their countries. On the inflow side of the farm budget, the sources of information on the chemical composition of the different elements of the budget are databases (and tables, respectively) and chemical laboratory analyses of the product, and the latter is also used for product declaration. The nitrogen concentration of manure imported to farms is analyzed with various methods. This is due to national legislation on the placement on the market of fertilizers. The actual nutrient concentration of manure imported to a specific farm determines its fertilizing value and its price; therefore, both seller and buyer are interested in reliable information on fertilizer value. Manure produced on the farm usually has to be taken into account if it is exported from the farm (Figure 7).
Concerning the quantitative registration of inflow elements of the farm budgets for those goods which are traded regularly with an accompanying goods receipt or a product declaration on the package, this declaration is used for budgeting. For elements that are difficult to estimate, e.g., animals entering the farm, listings of an estimation table are used (Figure S5).
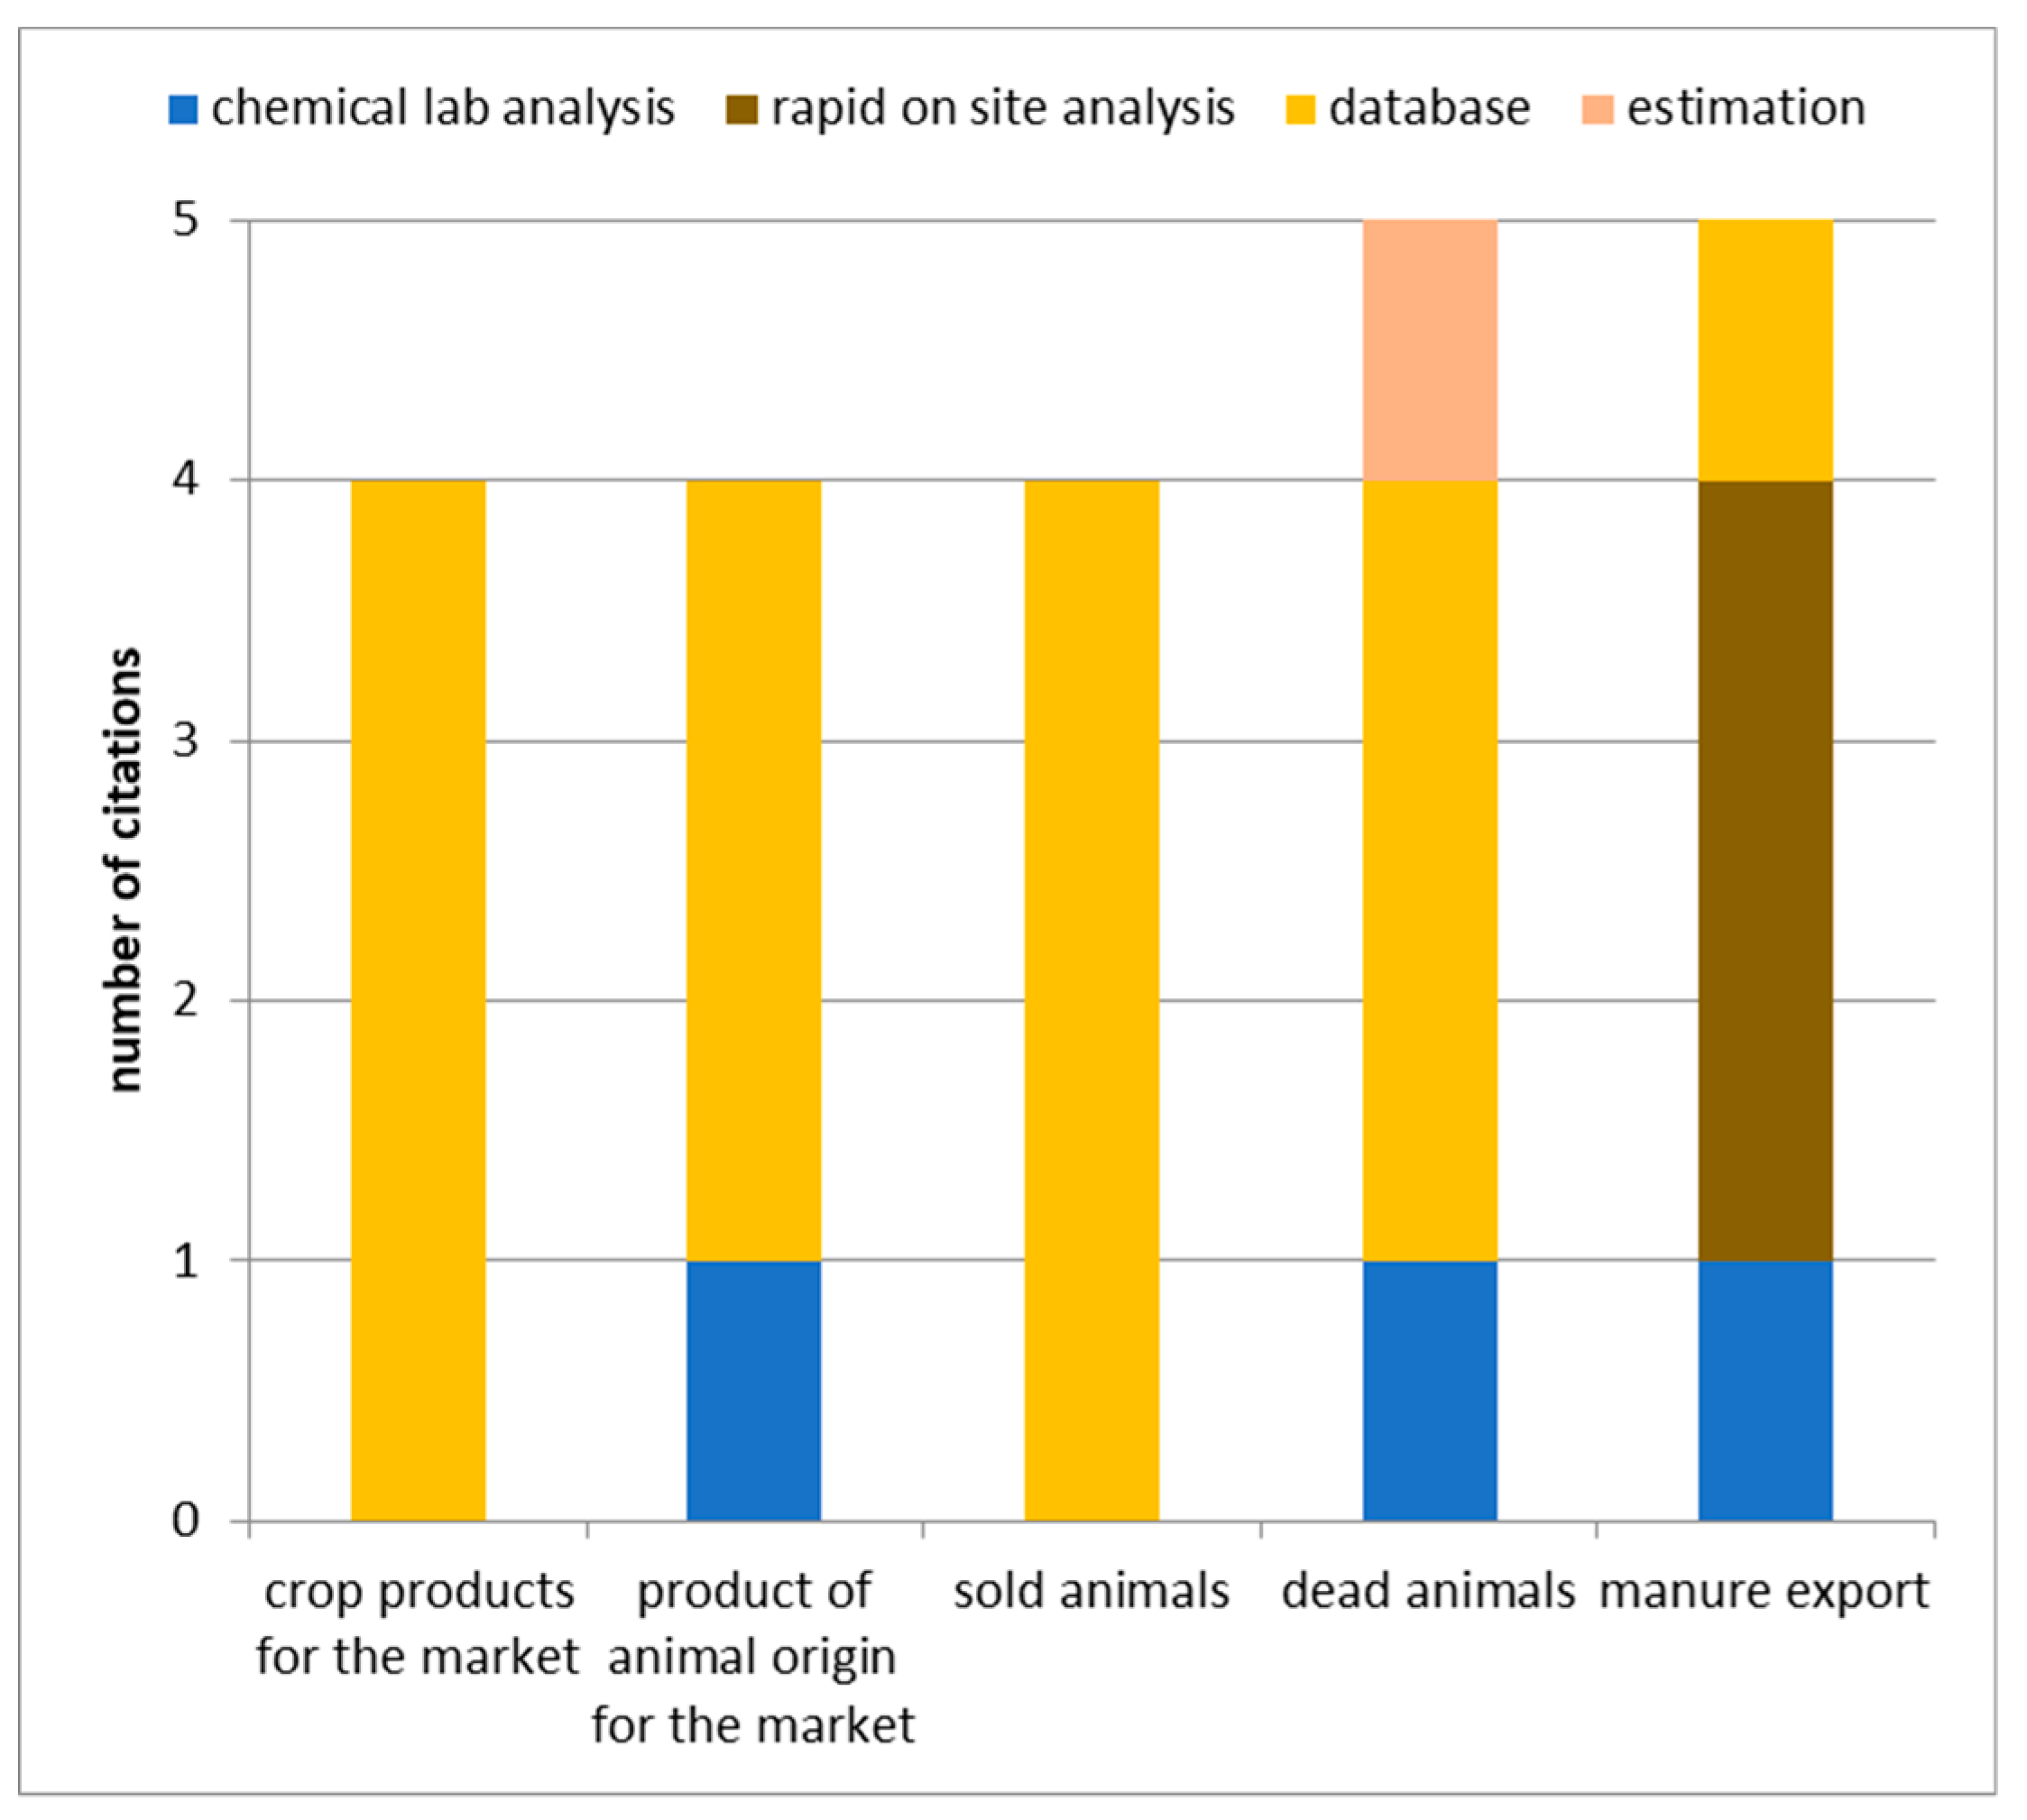
Concerning nitrogen removal from the farm, data on the nitrogen concentration of the harvested crops mostly derive from databases or tables (Figure 8), in contrast to the reports on soil surface budgets (Figure 6). Nitrogen removal by farm animals, sold or dead, leaving the farm is usually taken from databases. As an exemption, manure to be exported from the farm is also analyzed using rapid on-site analysis, e.g., near-infrared spectroscopy (NIRS) technology. So, in the Netherlands and Flanders, manure that is transported between farms has to be weighed and analyzed for N and P. Data of this origin are found in [38].
For the quantitative assessment of nitrogen removal, goods are often weighed or counted (Figure S6).

3.5. Comparison of Budgets in Different Countries

Below, five selected budget examples for the assessment of nitrogen flows at the farm level are presented and their characteristics are compared. The supplementary table gives an in-depth overview over the different budgets (Table S1).

3.5.1. Germany

The German fertilization ordinance [4] functions as the main legal act for the national implementation of the Nitrates Directive. Before the recent revision of the fertilization ordinance [18,39], all farmers were obliged to calculate a soil surface budget ex post fertilization (net budget, referring to total nitrogen inflow of applied fertilizer). After the EU court took legal action against Germany, the German fertilization ordinance [18] was revised and improved in March 2020 [39]. The nitrogen soil surface budget used as a control instrument against excessive use of N fertilizer is no longer compulsory—instead, a plotwise record of fertilizer use has now been introduced.
In addition, since 2018, intensive animal breeding farms and biogas production facilities using farm inputs are obliged to calculate a farm budget ex post [40]. By 2023, it is planned to include more farms into the obligation to calculate a farm budget. The aim of the farm budget is to transparently and verifiably monitor nutrient flows in breeding farms [41].
Standard values (e.g., excretion factors, nutrient concentrations in harvested crops and in animal products) have to be used for the farm gate budget and were also compulsory for the soil surface budget. Farmers also have to estimate individual calculation data, taking into account set minimum values (e.g., for nutrient concentration in roughages). For some data, nutrient declarations have to be used (e.g., for animal feed and for commercial fertilizers). For the soil surface budget, N removal of harvested roughage crops was estimated on the basis of animal categories and numbers. However, considerable losses could be added to the calculated N intake through roughage. The target value of the now abandoned net soil surface budget was a nitrogen surplus of less than 50 kg*ha−1, the so called control value, as the farm average over a three-year period [4]. The target value of the gross farm budget [40] is a surplus of less than 175 kg*ha−1, which is equivalent to the target value of the net soil surface budget of the former German fertilization ordinance for animal breeding farms [27]. In the course of the latest infringement procedure, the European Commission criticized the mandatory nitrogen soil (surface) budget in the German fertilization ordinance [4] and the uniform control value above zero, which furthermore is not adapted to different soil and climatic zones. The federal German agricultural ministry, therefore, in turn, replaced the soil surface budget by a precise, plot-wise record of all applied fertilizers [39].

3.5.2. Switzerland

A prerequisite for receiving subsidies for farmers in Switzerland is to present the Suisse Balance, an individual-farm nutrient budget for nitrogen and phosphorus as ‘proof of ecological performance’. It is a combination of the soil surface and farm gate budget in which manure produced within the farm plus fertilizer imports are balanced against the “net nutrient requirements” of the crops [42]. Approximately 90% of all Swiss farmers participate in this scheme. Farmers who do not use fertilizers containing nitrogen and phosphorus are exempted from this obligation in cases where in addition the animal densities on their farms are below certain thresholds, depending on defined land zones. The Suisse Balance is a net budget, since standard nitrogen emissions from stables and storages and from grazing animals are considered. Furthermore, the nitrogen availability of organic fertilizers is calculated as the farm-specific nitrogen use efficiency, also taking into account ammonia emissions and other losses upon application. The resulting nutrient supply from fertilizers (farm-own and farm-external) is compared to the standard nutrient requirement of crops. This means that plant residues which remain on the field, as well as biological nitrogen fixation, deposition and nitrogen release from soil, are indirectly taken into account. Nutrient removal from grassland is calculated indirectly by estimating feedstuff consumption of farm animals [43]. The target is that the nitrogen and phosphorus supply may exceed standard plant requirements for N and P by at maximum 10%, respectively. Although the Suisse cantons are responsible for the enforcement of the national legislation, there is no guideline on a unified implementation and execution at the canton level [44]. An evaluation of the Suisse Balance in 2011/2012 revealed the need for improvements with regard to method and administration [43].

3.5.3. The Netherlands

In the Netherlands, in 1998, the Mineral Accounting System (MINAS)—a gross farm budget—was fully introduced as a policy instrument. It was based on the principles that the nutrient surplus is an indicator for nutrient efficiency and that a certain nitrogen surplus is unavoidable. The remaining surplus was taxed. Although this approach was successful in the reduction of nitrogen and phosphorus surpluses, in 2003, the EU Court of Justice banned the Dutch farm-level budget system MINAS as, according to the Nitrates Directive, application standards are required while acceptable loss standards are rejected. Accordingly, at the legislative level, MINAS was replaced by a system of nitrogen and phosphorus application standards [45].
The Dutch Annual Nutrient Cycling Assessment (ANCA), a management tool for dairy farmers, was introduced parallel to legislation. Since 2016, the use of ANCA is, according to an agreement among representatives of the dairy processing industry and the farmers union, mandatory for all dairy farms. Farmers who do not join the ANCA scheme are not permitted to deliver milk to the milk-processing industries. As ANCA is a web-based tool, approximately 90% of the data can be directly supplied by the industry (milk processing, feedstuff, laboratories, etc.). It is a tool for benchmarking purposes. Data can be evaluated in different directions. The aim is to increase nitrogen use efficiencies (NUEs):
  • A farm with a high individual herd NUE produces less N in manure, and thus reduces the need for N-export;
  • A farm with a high individual herd NUE consumes less feedstuff;
  • A high NUE with respect to soil indicates a low farm N surplus;
  • A high NUE of grassland indicates a high N yield;
  • A high N input goes along with a lower NUE;
  • A high NUE, in turn, results in substantial savings for the farmer (expenses for fertilizer, feedstuff and for manure export) [46].

3.5.4. Romania

In order to receive subsidies, farmers in Romania have to comply with on-going legislation that transposes the EU Nitrates Directive. As in all EU member states, the legal Code of Good Agricultural Practices for water protection against nitrate pollution from agricultural sources and the corresponding action program have to be revised every four years. The rules of this program are mandatory for all farmers who request subsidies. Payment agencies for interventions in agriculture monitor a sample of farmers once a year (5% of all farms) for compliance with the applied standards related to maximum quantities of fertilizers or with the accomplished fertilization plans. Sanctions are applied if the farm does not comply with these requirements.
Farms which apply higher fertilizer quantities than the maximum standards have to complete an N budget and a fertilization plan. For the calculation of economic optimum fertilizer rates, the measured agrochemical soil indicators, costs of fertilizers, expected crop yields and the limits imposed by legislation are taken into account.
Each farm has to retain documents with evidence related to nutrient management at the farm/parcel level for the control authorities.

4. Discussion

4.1. Prevalence of N Fertilization Planning and N Budgeting at the Farm Level

Budgeting as ex post evaluation of the nitrogen use efficiency (NUE) at the farm level by determination of N surplus is practiced only in a minority of the participating countries in this survey (Table 1). At present, it is legally binding only in Germany, Romania and Switzerland (not an EU member state). In the Netherlands, the statutory anchoring of the farm budget MINAS was banned by the EU Court of Justice in 2003. In Germany, as a reaction to the pressure from the EU Commission to improve the implementation of the Nitrates Directive, the soil surface budgeting system, in effect since 2007 and amended in 2017 [4], has now been replaced by an improved mandatory fertilizer planning, with the duty to keep plotwise records on the applied fertilizers [40,41].
The limited legal anchoring of nitrogen (and phosphorus) farm-level budgets might be due to a lack of appreciation of the Commission for this indicator for evaluation and control of farm nutrient management. It is in any case surprising, as at the national, regional and even landscape level, the use of nutrient budgeting is well established and highly appreciated [3,5,6,13,15,16,19,26,28]. In particular, the OECD and EU institutions have highlighted the value of nutrient budgeting as an agri-environmental indicator [3,47].
Fertilization planning, on the other hand, “arrived” at the farm level in accordance with the requirements of the Nitrates Directive. It is no surprise that it is practiced in all participating countries of this survey, and it is a legally binding procedure for the farmer in the majority of countries (Table 1), although the complexity of the system varies a lot between the countries (Figure 4).

4.2. Need for the Standardization of Data Collection

This survey revealed that the methods used for nutrient budgeting at the farm level are far from harmonized (Figure 5, Figure 6, Figure 7 and Figure 8; Figures S3–S6). This refers to the budget type, the elements of the budgets considered as well as the data sources. There is a clear discrepancy between the precision of data needed to exactly interpret nutrient flows at the farm level (Figure 1) and the availability of data at this level. Generally, databases and tables play a dominant role in data generation. There seems to be no standard method for the assessment of chemical manure composition, both in soil surface and farm budgets. Quantitative estimations and weighing of N removal (yield) prevail for soil surface budgets, while counting and weighing is often used with N removal (products of animal and plant origin) in farm budgets. These findings are confirmed by other authors [21]. As an example, the assessment of the concentration of nitrogen in manure is discussed below.

4.2.1. Nitrogen Concentration in Different Manure Types

Nitrogen concentration in manure is specific for the type of animal and related to its concentration in the feedstuff used: matching the composition of the livestock diet to the nutritional demand thus reduces nitrogen excretion [35]. The composition of the liquid and solid manure types also differs according to housing system and manure management practices. Standard values for the different manure types in the member states often take into account the varying straw–water–dung relation and, therefore, differ in their nutrient concentrations [36,48]. In the framework of the Interreg/Baltic Sea Region project “Manure Standards,” the different mass-balance approaches to calculate manure composition in Denmark, Estonia, Finland, Sweden, Germany, Russia and Poland were investigated [49]. Luostarinen and Kaasinen [50] detected differences in the level of detail, in the algorithms applied, and in the background data used in the national calculation tools. Standards for manure quantity and composition are used, e.g., as the basis for fertilization planning or the calculation of manure storage capacity.
Nitrogen excretion is calculated in order to standardize nitrogen flows, budgeting the quantity of nitrogen fed (=input) and the amount of nitrogen in the products of animal origin, e.g., milk, meat or eggs (=output). However, N excretion factors for dairy cattle, other cattle, pigs, laying hens, broilers, sheep and goats differ significantly between policy reports (IPCC guidelines, the EMEP/EEA inventory guidebook, the EU Nitrates Directive, OECD/EUROSTAT, the GAINS model and the CAPRI model) and countries [38]. These differences can be related to disparities in animal production between the member states, but also to differences in the aggregation of livestock categories and in estimation procedures [38].

4.2.2. Analyses and Measurements versus Standard Data and Estimations

For the establishment of nitrogen budgets on farm level, apart from standard values as described previously in 4.2.1., sampling of in and outputs and direct (=on farm) measurements or analysis respectively laboratory analysis are possible. On-farm analysis possesses the advantage that the information on, e.g., nitrogen concentration in manure, is directly available and can be used to adjust supplementary mineral fertilization. Nevertheless, producing representative samples from heterogeneous substances is difficult and the accuracy of on-farm analytical methods is generally not very high [51]. Moreover, manipulative estimations by the farmer could result in voluntary unbalanced budgets (e.g., a higher than realistic yield, lower N concentration in manure) that are even more difficult to detect for control officers [44].
Near-infrared spectroscopy (NIRS technology) achieves satisfying results for the analysis of liquid manure. However, the technology is not yet widespread [51]. A new approach to calculate nutrient excretion more precisely was chosen for the Dutch Annual Nutrient Cycling Assessment (ANCA) tool. The online tool is fed in “real time” with data necessary to calculate farm-specific nutrient excretions. Therefore, with this tool, optimization of the milk production process is possible, increasing the farm-specific NUE [52] and reducing pollution potential and costs [53].

4.3. Detection of “Hidden” Surpluses Using N Budgets

While fertilization planning refers to the plant-available N in fertilizers, budgets take the total N amount into account. There are a range of factors influencing the level of “hidden” surplus in fertilizer use.

4.3.1. Nitrogen Losses during Housing and Storage and during/after Manure Application

Nitrogen losses from livestock housing and from manure storages are mainly in the form of NH3 emissions, but high N2 and N2O losses are also reported from solid manures [54]. For the calculation of the share of nitrogen emitted, emission factors are applied, referring to different livestock categories, manure types and diets. Emission factors are either based on total N excretion or N concentration, or on the total ammonia nitrogen (TAN) [55,56,57], resulting in considerable variation in emission factors for the same livestock categories among member states. Moreover, abatement measures in an “upstream part” of the manure management system (e.g., manure storage) affect downstream losses (e.g., during manure application) by increasing the TAN concentration of the manure, and thus have an impact on the emission factors of application [55].
In the countries participating in this study, the share of nitrogen in manure and other organic fertilizers actually incorporated into soil is calculated in different ways (Table 2). Nitrogen emitted as standardized gaseous losses from stables and storages is deduced from the N amount excreted by farm animals, as in B, CH, GE, NL, RO and Sl. Gaseous emissions after manure application are considered in GE, NL, PT, RO and Sl. The N surplus of gross budgets includes the share of nitrogen emitted via these paths.

4.3.2. The Plant Availability of Nitrogen in Organic Fertilizers and Soil Conditioners

In the framework of fertilization planning, the plant availability of nitrogen is a necessary variable for the calculation of the amount of organic fertilizer and soil conditioners to be applied and of supplementary mineral fertilization. Webb et al. [35] carried out a survey among all 27 member states on these availability factors for the liquid and solid manure of cattle, pigs and layers and for the solid manure of broilers and sheep. The availability factor is used throughout the member states, not only within the NVZs. It describes the manure N efficiency and is expressed as the percent of total nitrogen (Table 3, updated). In some member states, the availability factors include residual effects for one or several followings years. It is not only that these availability factors do not exist in every member state for all livestock categories, they also vary considerably between them.
What is listed in Table 3 is in fact the actual plant-available share of the fertilized nitrogen which can be considered for fertilization planning purposes. This share increases with a decrease in the C/N ratios in manure, respectively, in organic fertilizers or soil conditioners. Therefore, liquid manure and digestates which are characterized by comparably narrow C/N ratios show higher plant availabilities than, e.g., solid manure. The share of N unavailable to plants—together with organic carbon—accumulates in soils with repeated application of the organic fertilizers. The effect increases with the application rates (temporal and quantitative). In the long term, elevated organic matter concentrations in soils leads to an increase in the mineralization of soil organic matter and, consequently, higher Nmin concentrations in soil and soil water, particularly if the C/N ratio is—due to high application rates of liquid manure—narrow [58]. This mineralization effect of soil organic matter is expected to even increase with a prolongation of the cultivation season due to climate change [59].
Another effect of changing climate conditions is the unpredictability of growing conditions. Droughts, for example, can reduce yields considerably, and high rates of precipitation in the winter season can reduce mineral nitrogen in the root zone from the start of the growing season—an issue which may be corrected for by an annual prognosis and monitoring program, as implemented in Denmark. The gap between predicted and accomplished yields results in a gap between fertilized nitrogen and plant uptake of nitrogen. At best, nutrients that are not transferred into plant biomass remain in soil and are available in the following growing period—at worst, they are leached below the root zone and contaminate groundwater [60].
In soil surface budgets, gaseous nitrogen losses are excluded. This budget type is, therefore, particularly suitable for detecting the “hidden” surpluses of nitrogen, which increase the N stock in soil and might threaten the environment by leaching, erosion or denitrification.

4.4. Evaluation of the Presented Budget Types

The Suisse Balance compares the nitrogen supply by fertilizers with the standard nutrient requirement of crops. The soil surface budget of the German fertilization ordinance [4] compares nitrogen inflow by fertilization calculated from standard N animal excretion and fertilizer rates and concentrations with current nitrogen removal by crop, determined from yields and standard N concentrations. The farm gate budget of the German material flow ordinance (StoffBilV) [40] compares nitrogen inflow and output at the farm level, based on standards as well as product declarations. ANCA (the Netherlands) calculates more realistically, with up-to-date analysis data supplied from laboratories and the industry. While the ANCA evaluation is variable, referring to the farm level or in detail to the herd, manure, soil or crop, the budgets used in Romania, Germany and Switzerland have a fixed set up.
While nitrogen budgets in Germany [4,39], Romania and Switzerland (Suisse Balance) are statutory requirements, with de minimis limits for smaller and/or less intensive farms, the ANCA tool in the Netherlands is an agreement beyond the legal level, between dairy farmers and the dairy industry. This overall arrangement can be explained as a reaction to the decision of the EU Court of Justice stating that the previous tool, MINAS, is incompatible with the Nitrates Directive.
ANCA is a benchmarking tool for dairy farmers, aiming to increase N efficiency. The German StoffBilV [40] was installed to improve transparency on nutrient flows on intensive animal breeding farms. The German fertilization ordinance [4] and the Suisse Balance both have to be attained in order to receive subsidies, and both aim at the reduction of water pollution due to nitrates. In the federal structures of both Germany and Switzerland, control mechanisms at the federal state level or the canton level are not unified. In Romania and Germany, yearly increasing sanctions related to the rules of Cross Compliance (CC) according to the Common Agricultural Policy of the EU may be imposed. Additionally, legal fines for the violation of the rules of the German fertilization ordinance could amount up to 50,000 €. Sanctions in Switzerland are comparable to the CC sanctions in the EU member states—in the case of repeated violations, subsidies might even be cut completely.
In the German system, no third parties—such as farm advisors or control bodies—have unwanted direct access to farm data: farmers have to present the results and some of the basis of their calculations to the control authority on request. In Switzerland, at least some data on manure and organic fertilizer flow between farms or from/to biogas plants are stored centrally. In contrast, in the Netherlands, data for ANCA from different sources are collected centrally, evaluated by a farm advisor and communicated to and discussed with the farmers. In Denmark, the fertilizer accounts are publicly accessible.
Table S1 also lists the elements of the different budgets. As for ANCA, a range of data are processed, different budget types with different system boundaries can be calculated and internal data flows between the systems can be extracted and evaluated.
All systems except the farm budget StoffBilV use an indirect method to determine the uptake of roughages, particularly of grass, by the number of animals and the grazing hours. Although this is not a precise method, the alternative, estimating or measuring the grass growth and grass quality (protein concentration), is not yet standard practice among farmers.
The Suisse Balance and ANCA offer the possibility of using farm-specific excretion rates. This enables the possibility of increasing NUE by using selected N-reduced feeds.
The German budgets have to be interpreted versus the target values: 50 kg*ha−1*year−1 in 2020 for the soil surface budget [4] and 175 kg*ha−1*year−1 for the gross farm budget [40]. The difference between the two values can be explained by the sum of nitrogen losses from stables and storages, losses from roughages and ammonia deposition [27]. The ANCA benchmarks are calculated as the annual mean of all farms and amounted to 218 kg*ha−1*year−1 as the farm budget and to 158 kg*ha−1*year−1 as the soil surface budget in 2018 [47]. From these figures, it can be concluded that, in Dutch farms, the gap between gross and net value (60 kg*ha−1*year−1) is lower than between farm and soil surface budget in Germany (125 kg*ha−1*year−1). The target value of 175 kg*ha−1*year−1 of the StoffBilV in the German farm budget seems even more elevated with respect to the underlying N application standards. They amount to 250/230 kg*ha−1*year−1 with reference to manure in the Netherlands in comparison to 170 kg*ha−1*year−1 with reference to manure and other organic fertilizers, like compost and biogas effluent, in Germany. The target of the Swiss budget is to have less than 10% surplus in comparison to the standard nutrient requirement of the crop.

5. Conclusions

The harmonization of the methodology of nitrogen budgets as agri-environmental indicators at the farm level is limited due to European legislation. This was seen in the examples of the Netherlands (MINAS) and Germany (fertilization ordinance). European legislation does not accept N surplus as an indicator for the success of the implementation of the Nitrates Directive into national legislation. Our expert survey in several European member states and Switzerland reveals that, on the other hand, fertilization planning, defined as “good agricultural practice” in the Nitrates Directive, has clearly reached the farm level.
In most of the cases where budgets are in regular use at farm level (Germany, Romania, Switzerland), standard values for the chemical composition of feedstuff, organic fertilizers, and animal and plant products are applied. However, standard values cannot depict individual, farm-specific conditions. Therefore, further joint research activities and development of methods and/or products are necessary in order to carry out plausibility checks of the underlying nutrient flows at the farm level.
Consequently, nitrogen budgets are not yet fit to be applied as standard “ready to use” “agri-drinking water indicators (ADWIs)” for the pollution of waters with nitrates, which would produce comparable results across Europe. Further, the comparability of soil surface and farm nutrient budgets used in the different countries is rather limited. However, nitrogen budgets at the farm level can serve as a comparably simple benchmark instrument, next to autumn Nmin values of the soil, in order to identify best management practices under defined environmental and farming conditions.
The example of the Dutch Annual Nutrient Cycling Assessment (ANCA) tool (and partly of the Suisse Balance) shows that it is only by using farm-specific “real” data that budgeting can be successfully applied to optimize nutrient flows and increase N efficiencies at the farm level. However, this approach is more elaborate and requires centralized data processing where data protection concerns are considered. The detailed data analysis does not correspond with governmental control and sanctions.
The Dutch example also shows that in intensive dairy production, even when comparatively high N use efficiencies of slightly below 40% are attained at the farm level, large amounts of nitrogen, approximately 200 kg N per ha and year, are still released into the environment, questioning the livestock density and intensity level of dairy production.

Supplementary Materials

The following are available online at https://www.mdpi.com/2073-4441/12/4/1197/s1: Figure S1. Impact of technical progress on N-requirement of the crop according to national fertilization planning systems; Figure S2. N emissions during and after organic fertilizer application in % of applied N in % of excreted N; Figure S3. Quantitative determination of elements of nitrogen inflows of soil surface budgets; Figure S4. Quantitative determination of elements of nitrogen removal of soil surface budgets; Figure S5. Quantitative determination of elements of nitrogen inflows of farm budgets; Figure S6. Quantitative determination of elements of nitrogen removal of farm budgets; Table S1. Characteristics of five budgets from four countries practiced on farm level.

Author Contributions

Conceptualization: S.K. and B.O.; methodology: S.K. and C.H.; formal analysis: S.K.; investigation and data curation: J.B., I.C., C.C., T.D., H.F., M.G., K.D., G.H., I.A.L., N.S. and K.V.; writing—original draft preparation: S.K.; writing—review and editing: G.V.; visualization: S.K.; supervision: B.O.; project administration: C.H. All authors have read and agreed to the published version of the manuscript.

Funding

This project was funded from the European Union’s Horizon 2020 project FAIRWAY (https://www.fairway-project.eu/) under grant agreement No. 727984.

Conflicts of Interest

The authors declare no conflict of interest.

References

  1. OECD. OECD Core Set of Indicators for Environmental Performance Reviews. A Synthesis Report by the Group on the State of the Environment; Environment Monographs No 83; OECD Publishing: Paris, France, 1993. [Google Scholar]
  2. Kremer, A.M.; Methodology and Handbook—Eurostat/OECD—Nutrient Budgets EU-27, Norway, Switzerland. European Commission, Eurostat. 2017, 112p. Available online: https://ec.europa.eu/eurostat/documents/2393397/2518760/Nutrient_Budgets_Handbook_%28CPSA_AE_109%29_corrected3.pdf/4a3647de-da73-4d23-b94b-e2b23844dc31 (accessed on 28 January 2020).
  3. Eurostat Nutrient Budgets—Methodology and Handbook; Version 1.02.; Eurostat and OECD: Luxembourg, Luxembourg, 2013.
  4. Düngeverordnung (DüV) vom 26. Mai 2017. Verordnung über die Anwendung von Düngemitteln, Bodenhilfsstoffen, Kultursubstraten und Pflanzenhilfsmitteln nach den Grundsätzen der guten fachlichen Praxis beim Düngen. BGBl.I, 1305 pp. Available online: https://www.gesetze-im-internet.de/d_v_2017/D%C3%BCV.pdf (accessed on 20 April 2020).
  5. Leip, A.; Britz, W.; Weiss, F.; de Vries, W. Farm, land, and soil budgets for agriculture in Europe calculated with CAPRI. Environ. Pollut. 2011, 159, 3243–3253. [Google Scholar] [CrossRef] [PubMed]
  6. Wick, K.; Heumesser, C.; Schmid, E. Groundwater nitrate contamination: Factors and indicators. J. Environ. Manag. 2012, 111, 178–186. [Google Scholar] [CrossRef] [PubMed] [Green Version]
  7. de Ruijter, F.J.; Boumans, L.j.M.; Smit, A.L.; von den Berg, M. Nitrate in upper groundwater on farms under tillage as affected by fertilizer use, soil type and groundwater table. Nutr. Cycl. Agroecosyst. 2007, 77, 155–167. [Google Scholar] [CrossRef]
  8. Lord, I.; Antony, S.G. Agricultural nitrogen balances and water quality in the UK. Soil Use Manag. 2002, 18, 362–369. [Google Scholar] [CrossRef]
  9. Sieling, K.; Kage, H. N balance as an indicator of N leaching in an oilseed rape—Winter wheat—Winter barley rotation. Agric. Ecosyst. Environ. 2006, 115, 261–269. [Google Scholar] [CrossRef]
  10. Buczko, U.; Kuchenbuch, R.O. Environmental indicators to assess the risk of diffuse nitrogen losses from agriculture. Environ. Manag. 2010, 45, 201–1222. [Google Scholar] [CrossRef]
  11. Rankinen, K.; Salo, T.; Granlund, K.; Rita, H. Simulated nitrogen leaching, nitrogen mass field balanes and their correleation on four farms in south-western Finland during the peeriod 2000–2005. Agric. Food Sci. 2007, 16, 98–107. [Google Scholar]
  12. Hansen, B.; Thorling, L.; Schullehner, J.; Termansen, M.; Dalgaard, T. Groundwater nitrate response to sustainable nitrogen management. Sci. Rep. 2017, 7, 1–12. [Google Scholar] [CrossRef]
  13. Dalgaard, T.; Bienkowski, J.F.; Bleeker, A.; Dragosit, U.; Drouet, J.L.; Durand, P.; Frumau, A.; Hutchings, N.J.; Kedziora, A.; Magliulo, V.; et al. Farm nitrogen balances in six European landscapes as an indicator for nitrogen losses and basis for improved management. Biogeosciences 2012, 9, 5303–5321. [Google Scholar] [CrossRef] [Green Version]
  14. Andelov, M.; Kunkel, R.; Uhan, J.; Wendland, F. Determination of nitrogen reduction levels necessary to reach groundwater quality targets in Slovenia. J. Environ. Sci. 2014, 26, 1806–1817. Available online: https://www.sciencedirect.com/science/article/pii/S1001074214000734 (accessed on 16 April 2020). [CrossRef]
  15. Spiess, E. Nitrogen, phosphorus and potassium balances and cycles of Swiss agriculture from 1975 to 2008. Nutr. Cycl. Agroecosyst. 2011, 91, 351–365. [Google Scholar] [CrossRef]
  16. Poisvert, C.; Curie, F.; Moatar, F. Annual agricultural N surplus in France over a 70-year period. Nutr. Cycl. Agroecosyst. 2017, 107, 63–78. [Google Scholar] [CrossRef]
  17. Oenema, O.; Kros, H.; de Vries, W. Approaches and uncertainties in nutient budgets. Implications for nutrient management and environmental policies. Eur. J. Agron. 2003, 20, 3–16. [Google Scholar] [CrossRef]
  18. Cameira, M.R.; Rolim, J.; Valente, F.; Faro, A.; Dragosits, U.; Cordovil, C.M.d.S. Spatial distribution and uncertainties of nitrogen budgets for agriculture in the Tagus river basin in Portugal—Implications for effectiveness of mitigation measures. Land Use Policy 2019, 84, 278–293. [Google Scholar] [CrossRef]
  19. Gourley, C.J.P.; Aarons, S.R.; Powel, M. Nitrogen use efficiency and manure management practices in contrasting dairy production systems. Agric. Ecosyst. Environ. 2012, 147, 73–81. [Google Scholar] [CrossRef]
  20. D’Haene, K.; Magyar, M.; Mulier, A.; De Neve, S.; Pálmai, O.; Nagy, J.; Németh, T.; Hofman, G. Comparison of N and P farm gate balances between the intensive agriculture in Flanders and the extensive agriculture in Hungary. In Proceedings of the 14th World Fertilizer Congress of the International Centre for Fertilizers, CIEC Chiang Mai, Thailand, 22–27 January 2006. [Google Scholar]
  21. Mulier, A.; Hofman, G.; Baecke, E.; Carlier, L.; De Brabander, D.; De Groote, G.; De Wilde, R.; Fiems, L.; Janssens, G.; Van Cleemput, O.; et al. A methodology for the calculation of farm level nitrogen and phosphorus balances in Flemish agriculture. Eur. J. Agron. 2003, 20, 45–51. [Google Scholar] [CrossRef]
  22. D’Haene, K.; Salomez, J.; De Neve, S.; De Waele, J.; Hofman, G. Environmental performance of the nitrogen fertiliser limits imposed by the EU Nitrates Directive. Agric. Ecosyst. Environ. 2014, 192, 67–79. [Google Scholar] [CrossRef]
  23. De Waele, J.; D’Haene, K.; Salomez, J.; Hofman, G.; De Neve, S. Simulating the environmental performance of post-harvest management measures to cope with the Nitrates Directive. J. Environ. Manag. 2017, 187, 513–526. [Google Scholar] [CrossRef]
  24. Frei, J. ZA-AUI: Jüngste Entwicklungen und Resultate. BLW, Fachbereich Agrarumweltsysteme und Nährstoffe, 2017. Available online: https://2017.agrarbericht.ch/de/umwelt/agrarumweltmonitoring/agrarumweltindika torenaui (accessed on 16 April 2020).
  25. CORPEN Des Indicateursd’azotepourgérer des Actions de Maîtrise des Pollutions à L’échelle de la Parcelle, de L’exploitation et du Territoire. Ministère de l’Écologieet du Développement Durable, Paris, France, 2006. Available online: http://www.developpement-durable.gouv.fr/IMG/pdf/DGALN_2006_09_azote_indicateur.pdf (accessed on 25 July 2018).
  26. Schröder, J.J.; Aarts, H.F.M.; van Middelkoop, J.C.; de Haan, M.H.A.; Schils, R.L.M.; Velthof, G.L.; Fraters, B.; Willems, W.J. Permissible manure and fertilizer use in dairy farming systems on sandy soils in The Netherlands to comply with the Nitrates Directive target. Eur. J. Agron. 2007, 27, 102–114. [Google Scholar] [CrossRef]
  27. Klages, S.; Osterburg, B.; Hansen, H.; Betriebliche Stoffstrombilanzen für Stickstoff und Phosphor—Berechnung und Bewertung. Dokumentation der Ergebnisse der Bund-Länder-Arbeitsgruppe "Betriebliche Stoffstrombilanzen" und der Begleitenden Analysen des Thünen-Instituts 2017. Johann Heinrich von Thünen-Institut, Braunschweig, Germany, 108p. Available online: https://literatur.thuenen.de/digbib_extern/dn059490.pdf. (accessed on 28 January 2020).
  28. Eurostat—Agri-Environmental Indicator—Gross Nitrogen Balance. 2018. Available online: https://ec.europa.eu/eurostat/statistics-explained/index.php/Agri-environmental_indicator_-_gross_nitrogen_balance#Key_messages (accessed on 9 March 2020).
  29. Brandt, J. Review Report of Agri-Drinking Water Quality Indicators and IT/Sensor Techniques, on Farm Level, Study Site and Drinking Water Source; Brandt, J. FAIRWAY Project Deliverable 3.1; 2018; 180p, Available online: https://fairway-is.eu/index.php/farm-management/workpackages/agri-drinking-water-quality-indicators (accessed on 16 April 2020).
  30. Hirt, U.; Mahnkopf, J.; Venohr, M.; Kreins, P.; Heidecke, C.; Schernewski, G. How can German river basins contribute to reach the nutrient emission targets of the Baltic Sea Action Plan. In Environmental Science and Technology: Proceedings from the Fifth International Conference on Environmental Science and Technology, Houston, TX, USA, 25–29 June 2012; Sorial, G.A., Hong, J., Eds.; American Science Press: Houston, TX, USA, 2012. [Google Scholar]
  31. Aimon-Marie, F.; Angevin, F.; Guichard, L. MERLIN: Une Méthode Agronomique Pour Apprécier les Risques de Pollution Diffuse par les Nitrates D’origine Agricole; Agrotransfert: Lusignan, France, 2001; 27p. [Google Scholar]
  32. Häußermann, U.; Bach, M.; Klement, L.; Breuer, L. Stickstoff-Flächenbilanzen für Deutschland mit Regionalgliederung Bundesländer und Kreise—Jahre 1995 bis 2017; Methodik, Ergebnisse und Minderungsmaßnahmen. Abschlussbericht TEXTE 131/2019. 2019. Available online: https://www.umweltbundesamt.de/publikationen/stickstoff-flaechenbilanzen-fuer-deutschland (accessed on 20 April 2020).
  33. BLW Weisungen und Erläuterungen 2019. Verordnung über die Direktzahlungen an die Landwirtschaft (Direktzahlungsverordnung, DZV; SR 910.13; Bundesamt für Landwirtschaft: Bern, Switzerland, 2018. [Google Scholar]
  34. Richner, W.; Sinaj, S. Grundlagen für die Düngung landwirtschaftlicher Kulturen in der Schweiz (GRUD 2017). Agrarforschung Schweiz 2017, 8, 276. [Google Scholar]
  35. Webb, J.; Soerensen, P.; Velthof, G.; Amon, B.; Pinto, M.; Rodhe, L.; Salomon, E.; Hutchings, N.; Burczyk, P.; Reid, J. An assessment of the variation of manure nitrogen efficiency throughout Europe and an appraisal of means to increase manure-N efficiency. Adv. Agron. 2013, 119, 371–441. [Google Scholar]
  36. Lund, P.; Frydendahl Hellwing, A.L.; Børsting, Ch.F. (Eds.) Normtal for husdyrgødning 2019, 38.Institut for husdyrvidenskab, Aarhus Universitet, Tjele, Denmark. Available online: http://anis.au.dk/normtal/ (accessed on 28 January 2020).
  37. Anonymous Decree on the Protection of Waters against Pollution Caused by Nitrates from Agricultural Sources. 2009. Available online: http://www.pisrs.si/Pis.web/pregledPredpisa?id=URED5124 (accessed on 9 March 2020).
  38. Velthof, G.L.; Hou, Y.; Oenema, O. Nitrogen excretion factors of livestock in the European Union: A review. J. Sci. Food Agric. 2015, 95, 3004–3014. [Google Scholar] [CrossRef] [PubMed]
  39. Verordnung zur Änderung der Düngeverordnung und Anderer Vorschriften. Bundesrat Drucksache 98/20,20.02.20. Available online: https://www.bundesrat.de/SharedDocs/drucksachen/2020/0001-0100/98-20.pdf?__blob=publicationFile&v=2 (accessed on 8 April 2020).
  40. Stoffstrombilanzverordnung (StoffBilV) vom 14. Dezember 2017. Verordnung über den Umgang mit Nährstoffen im Betrieb und betrieblichen Stoffstrombilanzen. BGBl.I, pp. 3942; 2018 I pp. 360. Available online: https://www.gesetze-im-internet.de/stoffbilv/StoffBilV.pdf (accessed on 20 April 2020).
  41. BMEL Stoffstrombilanz: Mehr Transparenz über Nährstoffe in Landwirtschaftlichen Betrieben. Available online: https://www.bmel.de/DE/Landwirtschaft/Pflanzenbau/Ackerbau/_Texte/Stoffstrombilanz.html (accessed on 27 January 2020).
  42. Avater-Esper, S.; Neue Düngeverordnung soll ab April 2020 Gelten. Top Agrar. Available online: https://www.topagrar.com/acker/news/neue-duengeverordnung-soll-ab-april-2020-gelten-11837988.html (accessed on 27 January 2020).
  43. Agrida, B.L.W. Wegleitung Suisse-Bilanz; Auflage 1.13; Agridea und Bundesamt für Landwirtschaft: Bern, Switzerland, 2016. [Google Scholar]
  44. Bosshard, C.; Spiess, E.; Richner, W. Überprüfung der Methode SuisseBilanz; Schlussbericht. Forschungsanstalt Agroscope, Reckenholz-Tänikon ART: Zurich, Switzerland, 2012. [Google Scholar]
  45. Gassner, A. Gewässerschutzbestimmungen in der Landwirtschaft. Ein internationaler Vergleich. In Umwelt-Wissen 2006, Nr. 0618; Bundesamt für Umwelt: Bern, Switzerland, 2006; 76p. [Google Scholar]
  46. Poppe, K.J. MINAS—The Dutch Mineral Accounting System For the California Department of Food and Agriculture. LEI Wageningen, 2013. Available online: https://www.cdfa.ca.gov/is/ffldrs/frep/pdfs/6_Poppe.pdf (accessed on 28 January 2020).
  47. EEA (2005): Agriculture and Environment in EU-15—The IRENA Indicator Report. Agriculture and Environment. p. 128. Available online: https://www.eea.europa.eu/publications/eea_report_2005_6 (accessed on 9 March 2020).
  48. Menzi, H. Manure management in Europe: Results of a recent survey. In Proceedings of the 10th International Conference of the RAMIRAN Network, High Tatras, Strbské Pleso, Slovak Republic, 14–16 May 2002; pp. 93–102. [Google Scholar]
  49. Kaasik, A.; Lund, P.; Damgaard Poulsen, H.; Kuka, K.; Lehn, F.; Kuoppala, K.; Rinne, M.; Nousiainen, J.; Perttilä, S.; Koivunen, E.; et al. Overview of Calculation Methods for the Quantity and Composition of Livestock Manure in the Baltic Sea Region. Report on Current National Manure Calculation Systems Produced in Manure Standards Work Package 3: Guidelines for Calculated Manure Systems. 2019. Available online: https://www.luke.fi/manurestandards/wp-content/uploads/sites/25/2019/06/WP3-report_ManureStandards_Final2.pdf (accessed on 28 January 2020).
  50. Luostarinen, S.; Kaasinen, S. Manure Nutrient Content in the Baltic Sea Countries; Natural Resource Institute: Helsinki, Finland, 2016; 45p, Available online: http://urn.fi/URN:ISBN:978-952-326-272-0 (accessed on 28 January 2020).
  51. Snauwaert, E.; Forrestal, P.; Bonmati, A.; Riiko, K.; Klages, S.; Brandsma, J.; Provolo, G.; Bernard, J.-P.; Mini-Paper—On Farm Tools for Accurate Fertilization. EIP-AGRI Focus Group—Nutrient Recycling. 2016. Available online: https://ec.europa.eu/eip/agriculture/sites/agri-eip/files/2_mp_on_farm_tools_final.pdf (accessed on 28 January 2020).
  52. Daatselaar, C.H.; Reijs, J.R.; Oenema, J.; Doornewaard, G.J.; Aarts, F.M. Variation in nitrogen use efficiencies on Dutch dairy farms. J. Sci. Food Agric. 2015, 95, 3055–3058. [Google Scholar] [CrossRef] [PubMed]
  53. Oenema, J. ANCA: The Dutch way. Wageningen University & Research Denmark cattle congress, Herning, Denmark, 26.02. 2019. Available online: https://www.landbrugsinfo.dk/Kvaeg/Dansk-Kvaeg-kongres/Filer/kk19_57_Jouke_Oenema.pptx (accessed on 28 January 2020).
  54. Shah, G.M.; Shah, G.A.; Groot, J.C.J.; Oenema, O.; Raza, A.S.; Lantingal, E.A. Effect of storage conditions on losses and crop utilization of nitrogen from solid cattle manure. J. Agric. Sci. 2016, 154, 58–71. [Google Scholar] [CrossRef]
  55. Velthof, G.L.; Lesschen, J.P.; Webb, J.; Pietrzak, S.; Miatkowski, Z.; Kros, J.; Pinto, M.; Oenema, O. The Impact of the Nitrates Directive on Gaseous N Emissions—Effects of Measures in Nitrates Action Programme on Gaseous N Emissions; Final Report 2010. Contract ENV.B.1/ETU/2010/0009; Alterra: Wageningen, The Netherlands, 2011; 58p. [Google Scholar]
  56. Reidy, B.; Dämmgen, U.; Döhler, H.; Eurich-Menden, B.; van Evert, F.K.; Hutchings, N.J.; Luesink, H.H.; Menzi, H.; Misselbrook, T.H.; Monteny, G.-J.; et al. Comparison of models used for national agricultural ammonia emission inventories in Europe: Liquid manure systems. Atmos. Environ. 2007, 42, 3452–3464. [Google Scholar] [CrossRef]
  57. Reidy, B.; Webb, J.; Monteny, G.-J.; Misselbrook, T.H.; Menzi, H.; Luesink, H.H.; Hutchings, N.J.; Eurich-Menden, B.; Döhler, H.; Dämmgen, U. Comparison of models used for national agricultural ammonia emission inventories in Europe: Litter-based manure systems. Atmos. Environ. 2009, 43, 1632–1640. [Google Scholar] [CrossRef]
  58. Gebauer, W.-G.; Pfister, P.; Schaaf, H.; Homm-Belzer, A.; Fischer, S. Humus—Chancen und Risiken für den Grundwasserschutz (Ergebnisse aus der Praxis). In Verbraucherschutz als Herausforderung für die landwirtschaftliche Produktion; VDLUFA Kongress, Kurzfassungen; Verband Deutscher Landwirtschaftlicher Untersuchungs- und Forschungsanstalten e.V.: Darmstadt, Germany, 2019; pp. 13–14. [Google Scholar]
  59. Schimmelpfennig, S.; Heidecke, C.; Beer, H.; Bittner, F.; Klages, S.; Krengel, S.; Lange, S. Klimaanpassung in Land- und Forstwirtschaft—Ergebnisse eines Workshops der Ressortforschungsinstitute FLI, JKI und Thünen-Institut. In Thünen Working Paper 2018, 86; Johann Heinrich von Thünen-Institut: Braunschweig, Germany, 2018; 110p. [Google Scholar]
  60. Klages, S.; Heidecke, C.; Osterburg, B. The impact of agricultural production and policy on water quality during the dry year 2018. Water 2020. under review. [Google Scholar]
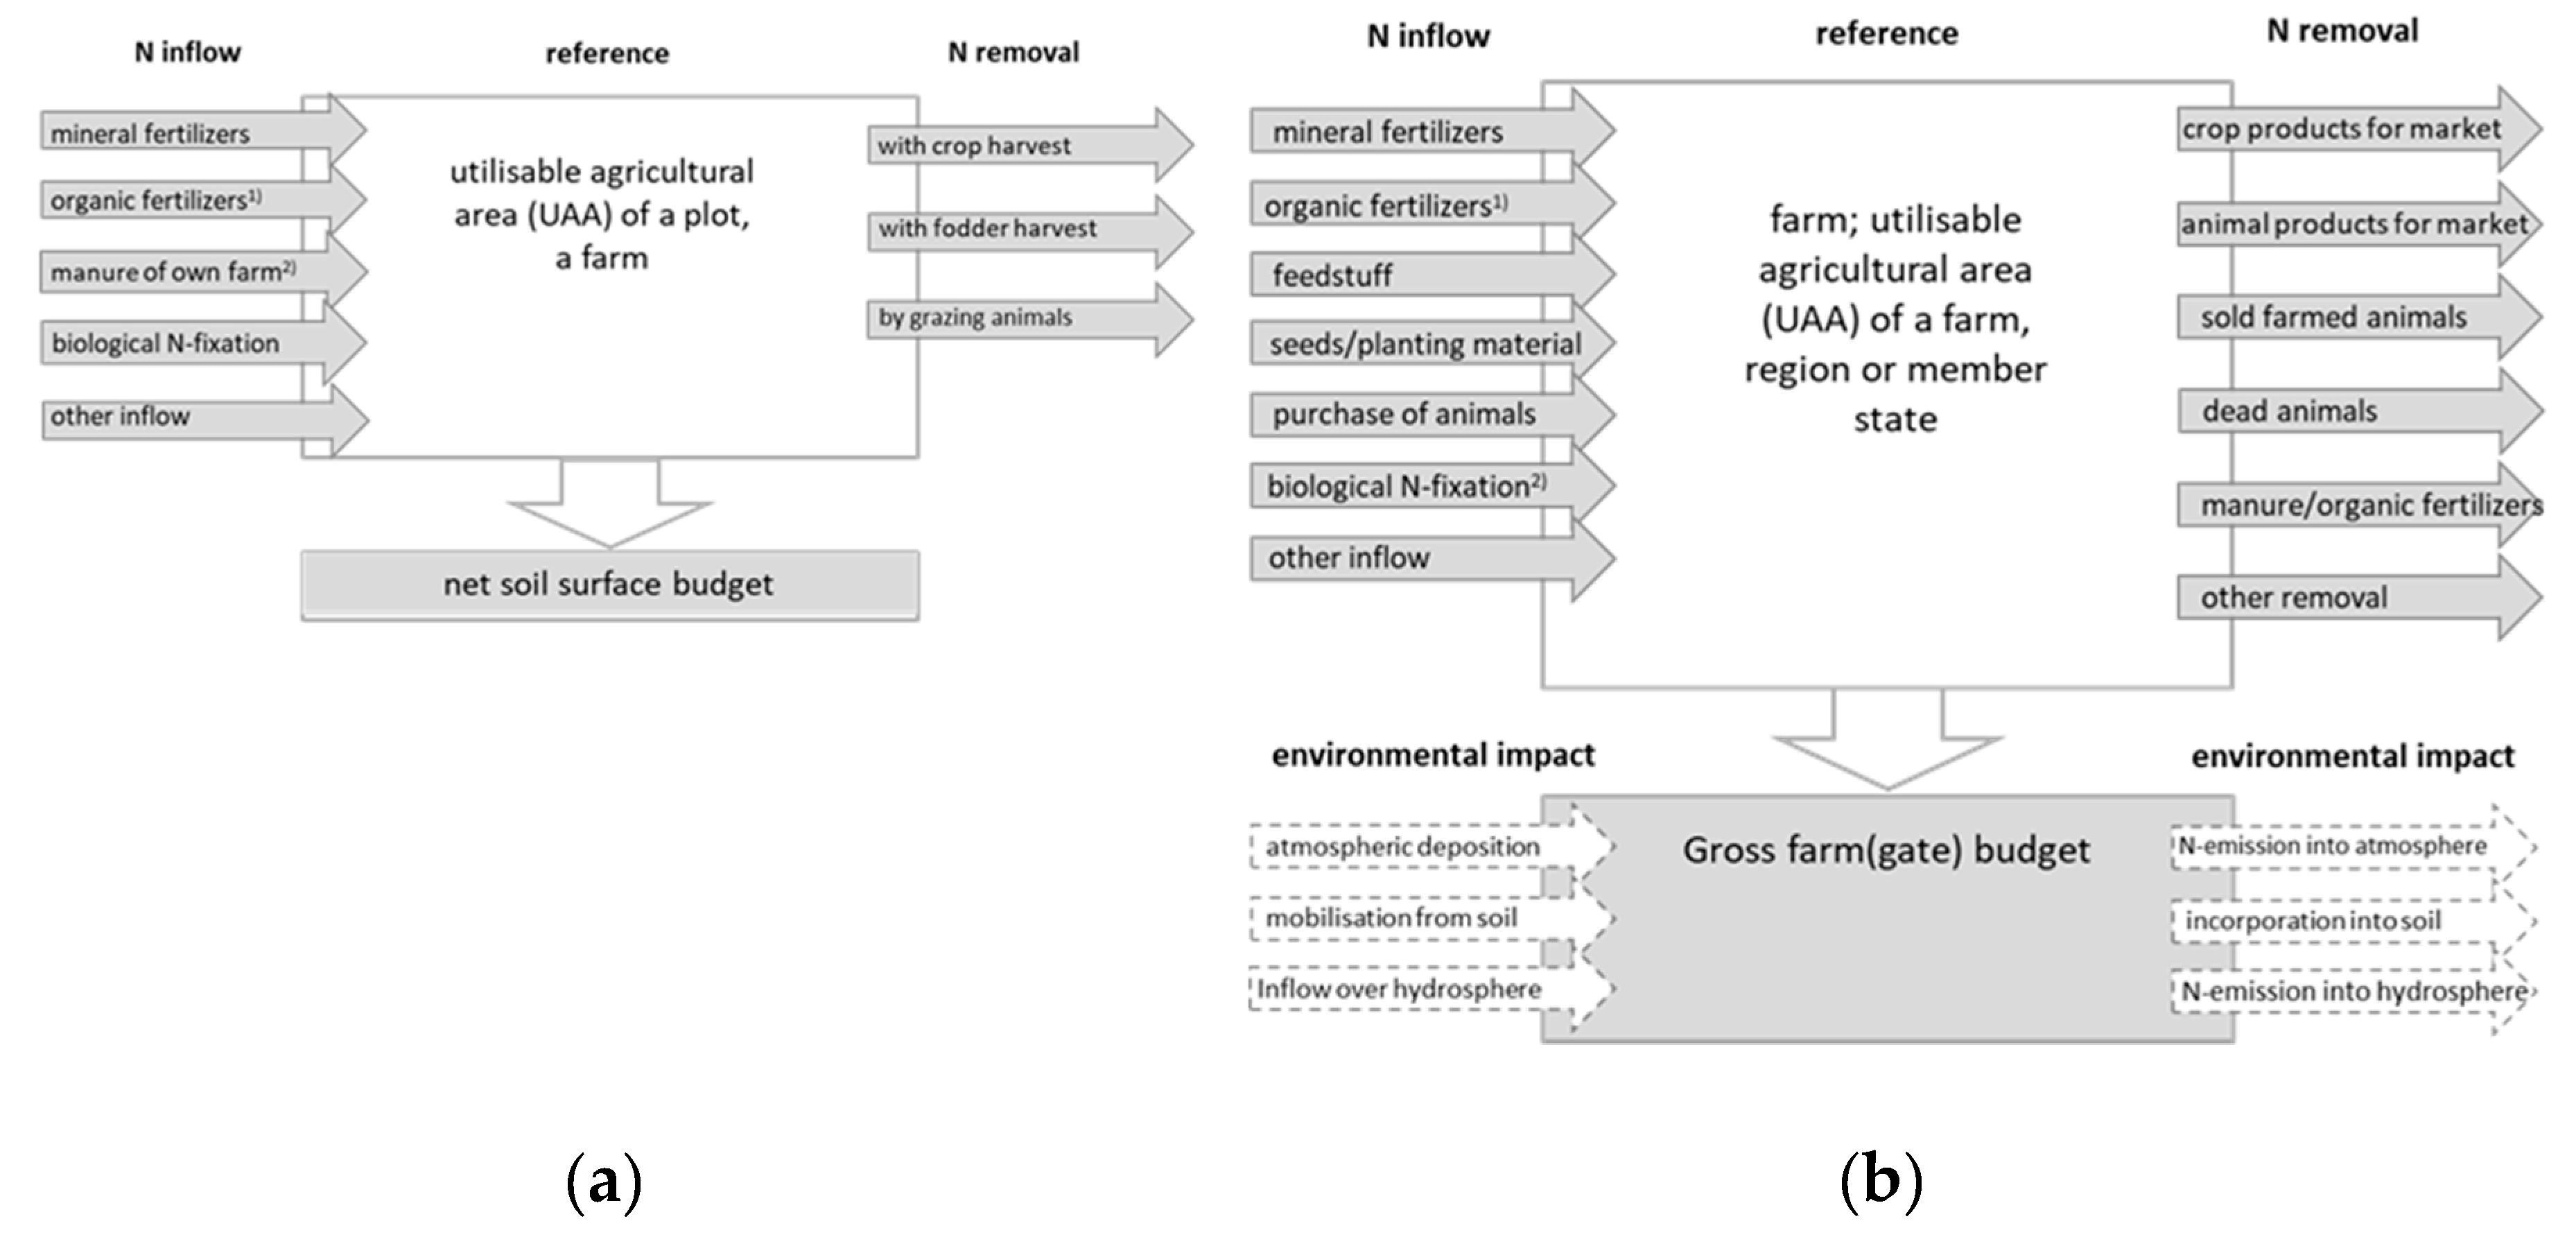
Figure 1. (a) Net (soil) surface budget [3,27]: (1) manure from other farms, organic and organic-mineral fertilizers: reductions are made for nitrogen losses due to a volatilization during fertilizer application to the land; (2) N in manure production by livestock, calculated by N excretion (using standard coefficients), reductions are made for nitrogen losses due to volatilization in stables, storages and with application to the land. Source: [3,27], translated. (b) Gross farm (gate) budget [27,28]: (1) all kinds of organic fertilizers including manure. Source: [27,28], translated.
Water 12 01197 g001
Figure 2. The gross nitrogen budget (GNB) [3]: (1) according to the current methodology, no reductions are made for nitrogen losses due to volatilization in stables, storages and with application to the land; (2) “manure”: total manure production by livestock (calculated by N excretion) minus manure withdrawals, plus manure import, plus change in manure stocks. Source: own design, according to [3].
Water 12 01197 g002
Figure 3. Degree of aggregation and individualization in relation to the operational level of agri-environmental indicators (with selected examples related to N assessment); Source: [29], with modifications. 1 Agricultural and Environmental Measures for Agricultural Water Protection [30], 2 Méthode de hiErarchisation du Risque de LIxiviation du Nitrate [31].
Water 12 01197 g003
Figure 4. Factors of fertilization planning at the farm level in different member states and Switzerland; (1) NL: grazing or cutting; CH: variety (e.g., for potatoes); DK: soil type and irrigation; (2) PT: N available in irrigation water; IE: nitrogen index. Source: expert survey results.
Water 12 01197 g004
Figure 5. Qualitative determination of elements of nitrogen inflows of soil surface budgets; multiple answers are possible (Source: expert survey results).
Water 12 01197 g005
Figure 6. Qualitative determination of elements of nitrogen removal of soil surface budgets; multiple answers are possible (Source: expert survey results).
Water 12 01197 g006
Figure 7. Qualitative determination of elements of nitrogen inflows of farm budgets; multiple answers are possible (Source: expert survey results).
Water 12 01197 g007
Figure 8. Qualitative determination of elements of nitrogen removal of farm budgets; multiple answers are possible (Source: expert survey results).
Water 12 01197 g008
Table 1. Fertilization planning and budgeting at the farm level in EU member states and Switzerland in 2019.
CountryFertilization Plan (y/n)Legally Bound (y/n)N Budgets (y/n)Legally Bound (y/n)
B (Flan)(y)(y)(1)(y)(y)(2)
CH(y)(y)(3)yy
DKyyN(4)-
FRy(y)(5)n-
GEyyyy
NLy(y)(6)yn
PT(y)(y)(5)n-
IEy(y)(7)n-
ROyyyy
Slyy(y)(8)-
UK-NI yyn-
(1) B (Flanders), fertilization plan compulsory only for farms with derogation (higher amount of N from manure) and with high soil Nmin values in autumn and after a bad audit. Fertilization between 1 September and 30 October is only allowed for horticultural crops and based on fertilization advice. In Regions 1–3, which have bad water quality, fertilization advice is needed for a portion of strawberry, vegetable and floricultural fields. (2) B (Flanders), 6th action program: nutrient and mass balances of manure processing and anaerobic digestion facilities as risk analysis. (3) CH: fertilization plans are not mandatory, but can be requested upon control of the Suisse Balance; in general, fertilization has be performed according to Swiss fertilization guidelines. (4) Danish farmers are legally bound to make an ex post fertilizer account, with updated information on the fertilizer plan. (5) PT, FR: fertilization plans are mandatory only in NVZ and for certified agriculture. (6) NL: fertilization plans are mandatory only for dairy farms with derogation. (7) IE: fertilization plans are mandatory only for farms with derogation. (8) Sl: in the framework of farm advice.
Table 2. Methods applied for the calculation of plant-available nitrogen in organic fertilizers.
N emissions From Stables and StoragesAvailability of Applied N in Soil for CropsN Emissions during/after Organic Fertilizer Application
% of N excretion% of applied N% of N excretion% of applied N
B (Flan)(1)yynn
CHyynn
DKy(4)y(3,4)nn
FRnn.a.(2)nn
GEyyy(5)y(6)
IEnynn
NLyyn(7)y(8)
PTnyny
ROyyyn
Slyyny
UK-NInynn
(1) B: no regulation on determination of N concentration in manure; (2) FR: manure N availability is expressed qualitatively with respect to N concentration and the C/N ratio in the manure [35]; (3) DK: [35]; (4) DK: [36]; (5) GE: farm-own manure; (6) GE: manure or other organic fertilizers imported to farm; (7) NL: excretion not calculated; (8) NL: depending on crop, method and TAN concentration.
Table 3. Reported values of crop available % of total nitrogen (=manure N efficiency) [35], supplemented by data from the current survey (red, bold figures).
Crop Available % of Total Nitrogen (=Manure N Efficiency)
CattlePigsLayerBroilerSheep
CountrySlurrySolidSlurrySolidSlurrySolid
AT505/15655/15603030
B(Flan)60
60
60
30
60
60
30
30
60
60
30
30
30
30
30
30
BG20–352040–452040–5040–5040–50
CH(1)45205035 353530
CZ6040604060404040
DK(2)7065756570656565
EE5025502550252525
GE(2)50
60
25
35
60
70
30/40
40
60
70
60
70
25
35
FR4510/156020/3045453510
GR20–351020–451020–3020–3020–3010
IE4030
40
5050
50
5050
50
50
50
30
40
IT(3)24–6224–6228–7328–7332–8432–8432–84
LV50255025302525
LT 35 35 35
LU25–5030–5030–6030–50 5050
NL60/4040/2560–705560/705555
PL50–603050–603050–60303030
PT55–75
60
30–60
20
50–80
80
40–6050–7040–60
90
40–60
90
40–60
RO50305030 3050
SE40–5036–415747 4847/57
SI50
75–85
30
50–70
50
75–85
30
50–70
30
75–85
50
50–70
50/
50–70
SK50305030305050
UK20/351025/5010 20/3520/3010
UK-NI
38
30
30
50
50

30
30
30

30
(1) Values referred to are reported as N availability in the year of application for arable farming; for forage production, 5%–10% higher availabilities are assumed. (2) Also includes residual N effects in the following years after application. (3) Availabilities are presented as a matrix according to soil type and time of application.