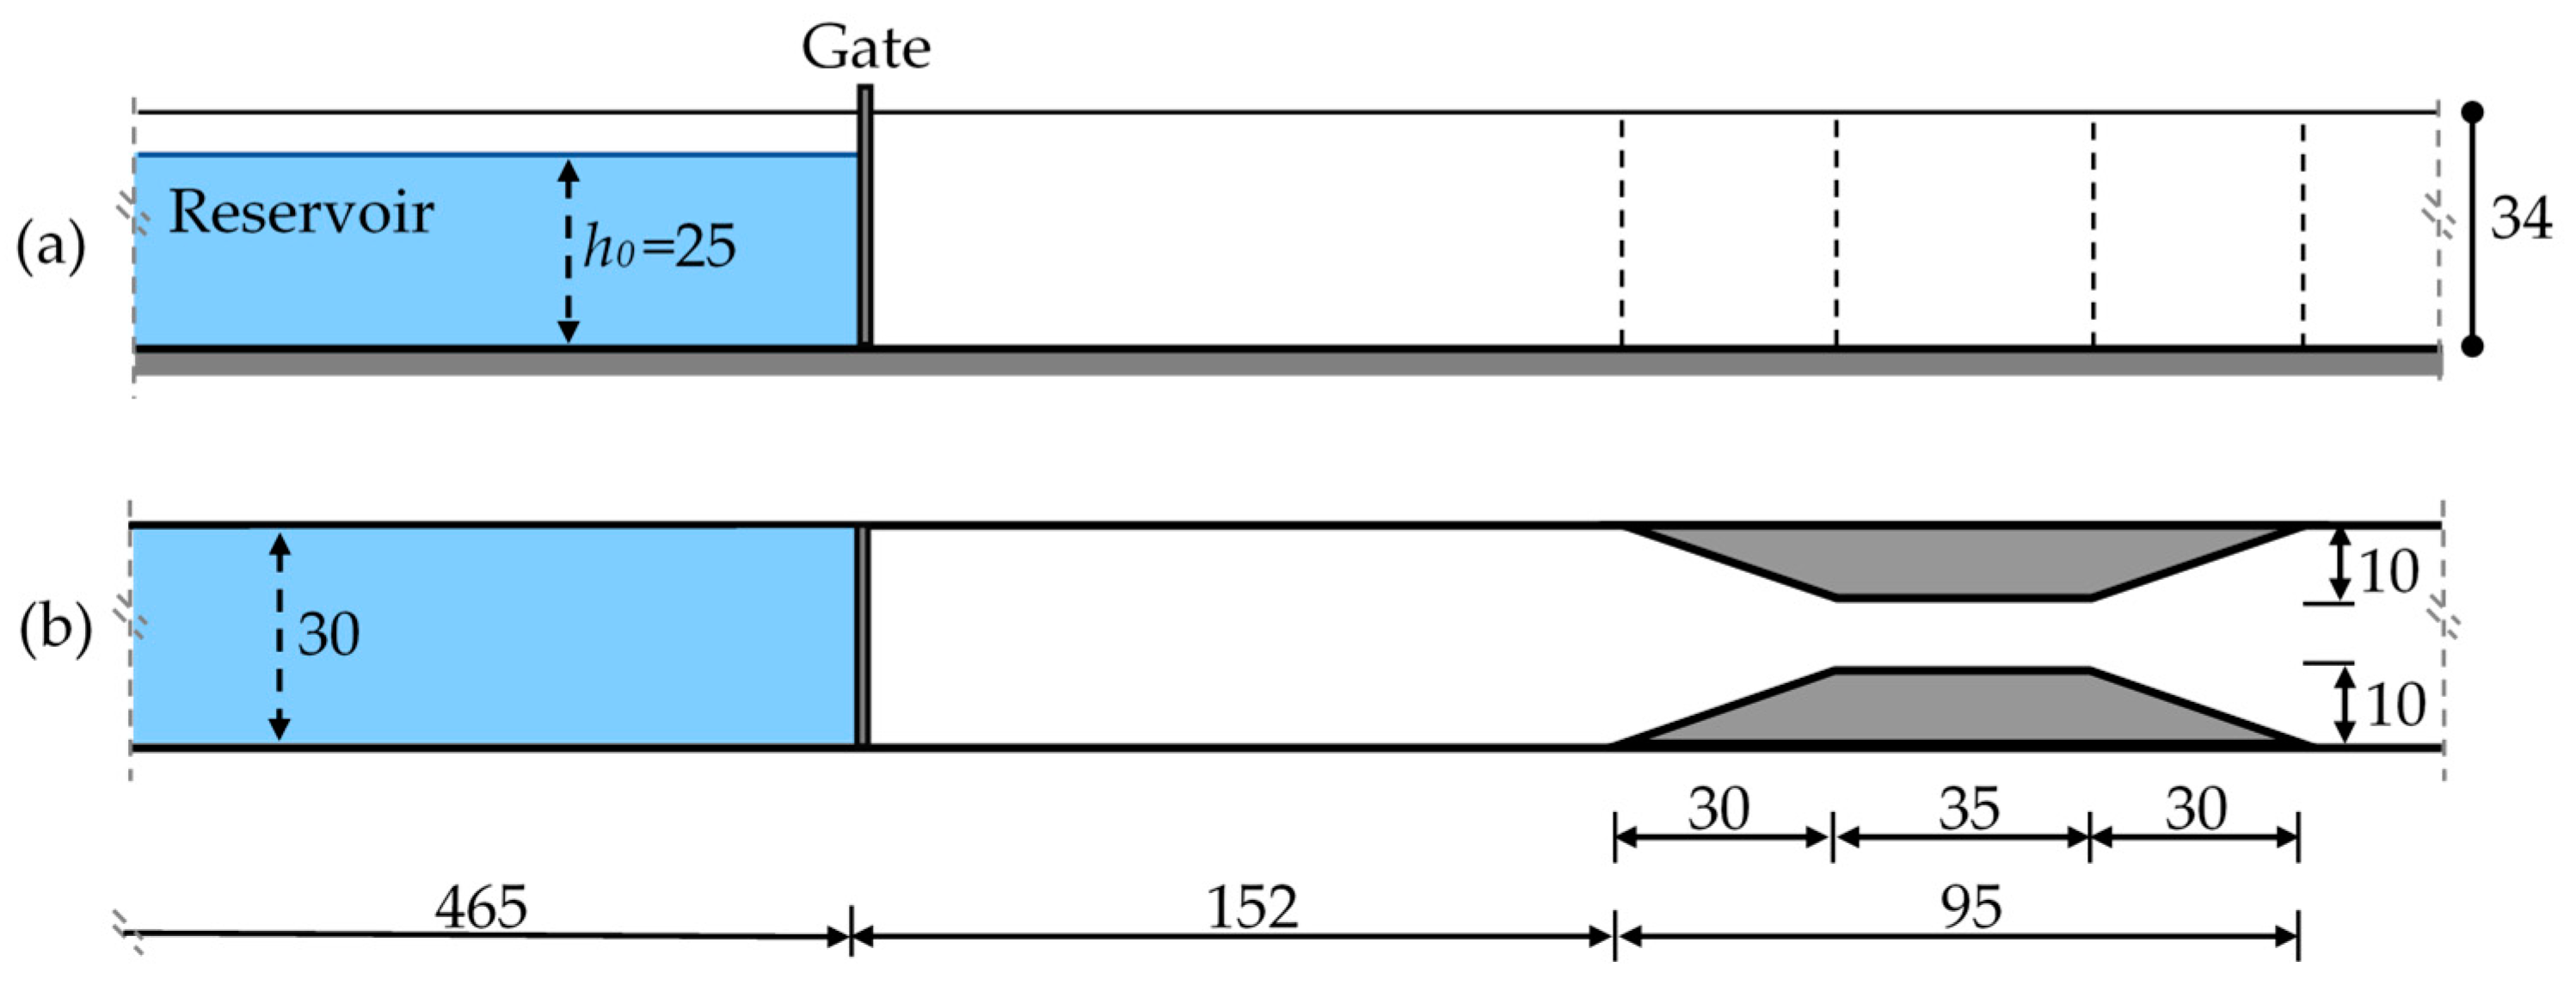
4.1. Comparison of Experimental data for Different Contraction Geometries
The dam-break flow originates right after the gate lifting, when it starts rapidly propagating on the dry channel, recorded all along the channel through the transparent glass walls by the three synchronous CCD cameras. Once the wave reaches the contracted section, the wave is partially reflected, thus inducing the formation of a negative bore moving upward, while the rest of the flow moves downward. In
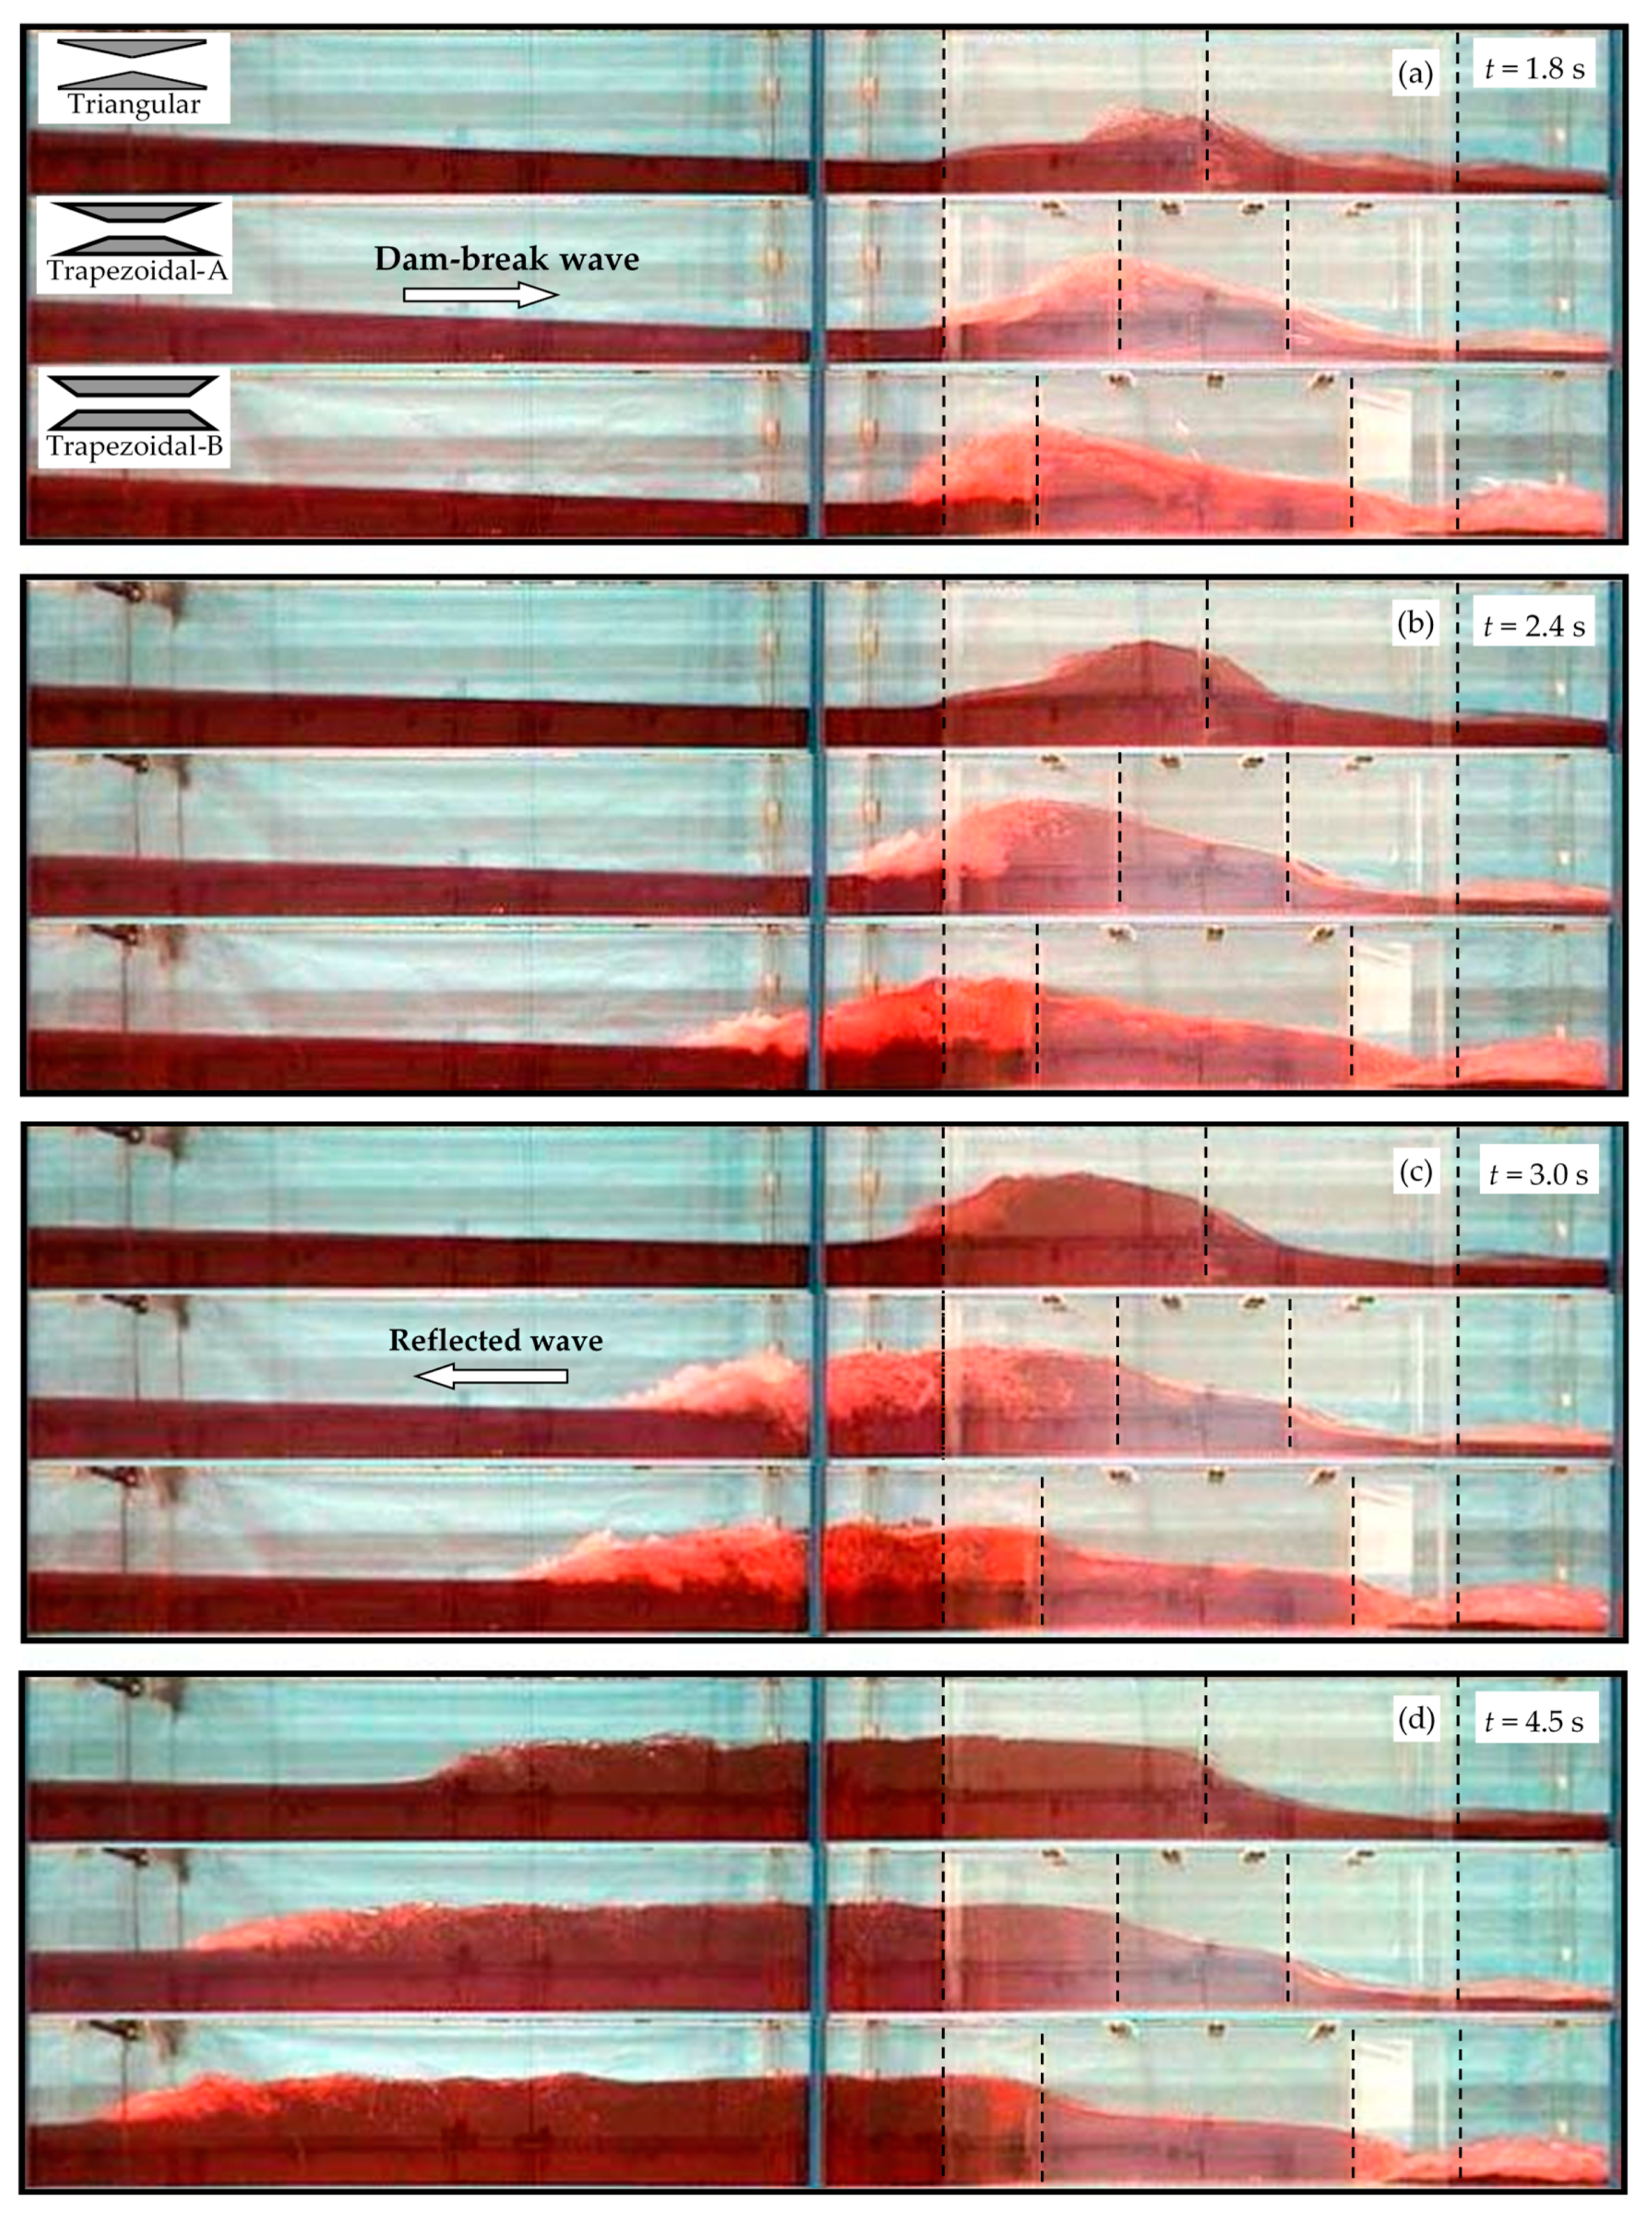
Figure 3, images obtained from the experiments conducted for the three different contractions, respectively, at different times after the gate opening are compared. The dashed lines indicate the borders of the contraction zone for all three cases. The blue line in the pictures is the supporting strut for the glass channel walls.
As shown in the images at
t = 1.8 s (
Figure 3a), the water level starts to rise at the points where the flood wave encounters the narrowest section, being it constricted by the local contraction; intense turbulence mixing is evident on the free surface, with strong air entrainment into the flow, and a negative bore of water-air swelling starts to move upward with rising depth. In the case of Trapezoidal-B contraction, for which the minimum section is reached earlier than with the other contractions, the water level rises faster. In addition, as a result of the flow sudden expansion downstream of the contraction, a significant formation of air bubbles is detected, differently from the other cases. On the other side, for the Triangular contraction, the rise in the water level is slower, being the narrowest section reached at a bigger distance, and a very small amount of air bubbles forms. At
t = 2.4 s (
Figure 3b), the negative wave is moving upward with rising water depth. In the case of Trapezoidal-B contraction, the surge wave moves upward with significant air entrainment in front of the wave. For the Triangular case, the water surface slope continues to increase in the narrowing section and there is almost no air entrainment. For the Trapezoidal-A contraction, the water surface has a bumpy shape with a maximum water level in the middle of the narrowing section, and significant air entrainment occurs in front of the reflected wave. At
t = 3.0 s (
Figure 3c), the water surface has a bumpy appearance at the narrowing section for the Triangular contraction, but there is still no significant air entrainment at the upfront wave surface. The reflected wave in the Trapezoidal-B case moves little ahead and strong air entrainment is observed compared to Trapezoidal-A. These reflection waves can be considered a moving hydraulic jump. At
t = 4.5 s (
Figure 3d), for the Triangular case, the reflected wave is still propagating, with still little air entrainment in front of the wave compared to Trapezoidal-A and Trapezoidal-B; the reflected water wave moves slowly compared to the others. In all three cases, the water surface has a horizontal profile between the wave front and the first narrowed section, and the water level decreases rapidly after the contraction zone. In addition, the water surface slope in the narrowest region decreases from Triangular to Trapezoidal-B contraction, i.e., with the slope of the contraction. As a result, in the case of Trapezoidal-B, it can be said that stronger reflections occur with the passage of the flood wave, there is significant air entrainment in front of the surge wave, and the wave front moves faster upward, compared to Trapezoidal-A and even more compared to Triangular contractions. The reason for this behavior can be ascribed to the fact that in the Trapezoidal-B case, the flow cross-section has a more rigid transition due to the higher slope of the contracting obstacles and the shorter tapered upstream section, resulting in an earlier encounter with the narrowest opening, compared to the other cases. On the other hand, in the Triangular contraction case, the transition from the full cross-section to the narrowest section is smoother, the flow is more slowly constricted at the local contraction entrance, the wave front jams and runs up the channel sidewalls with less impact, and the water reflection remains smaller.
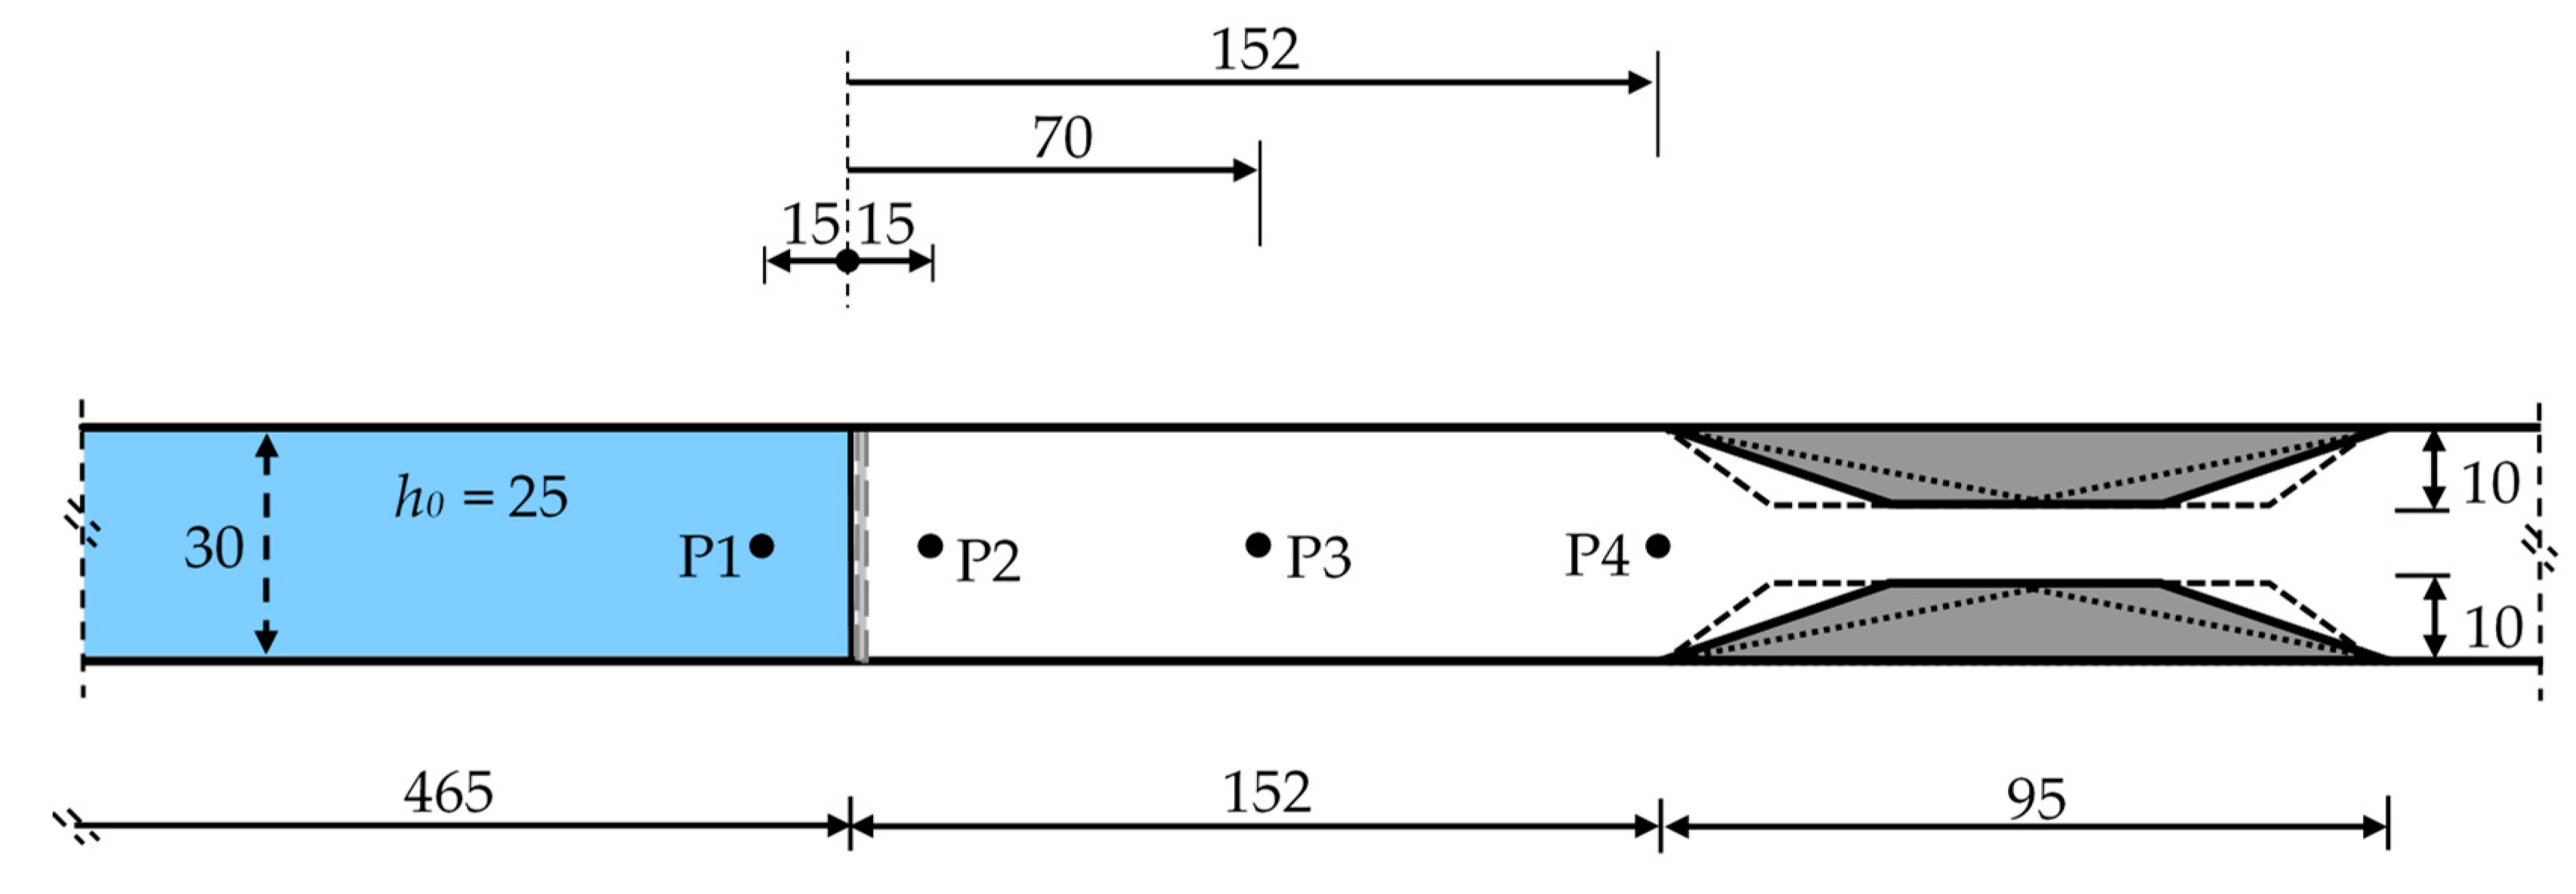
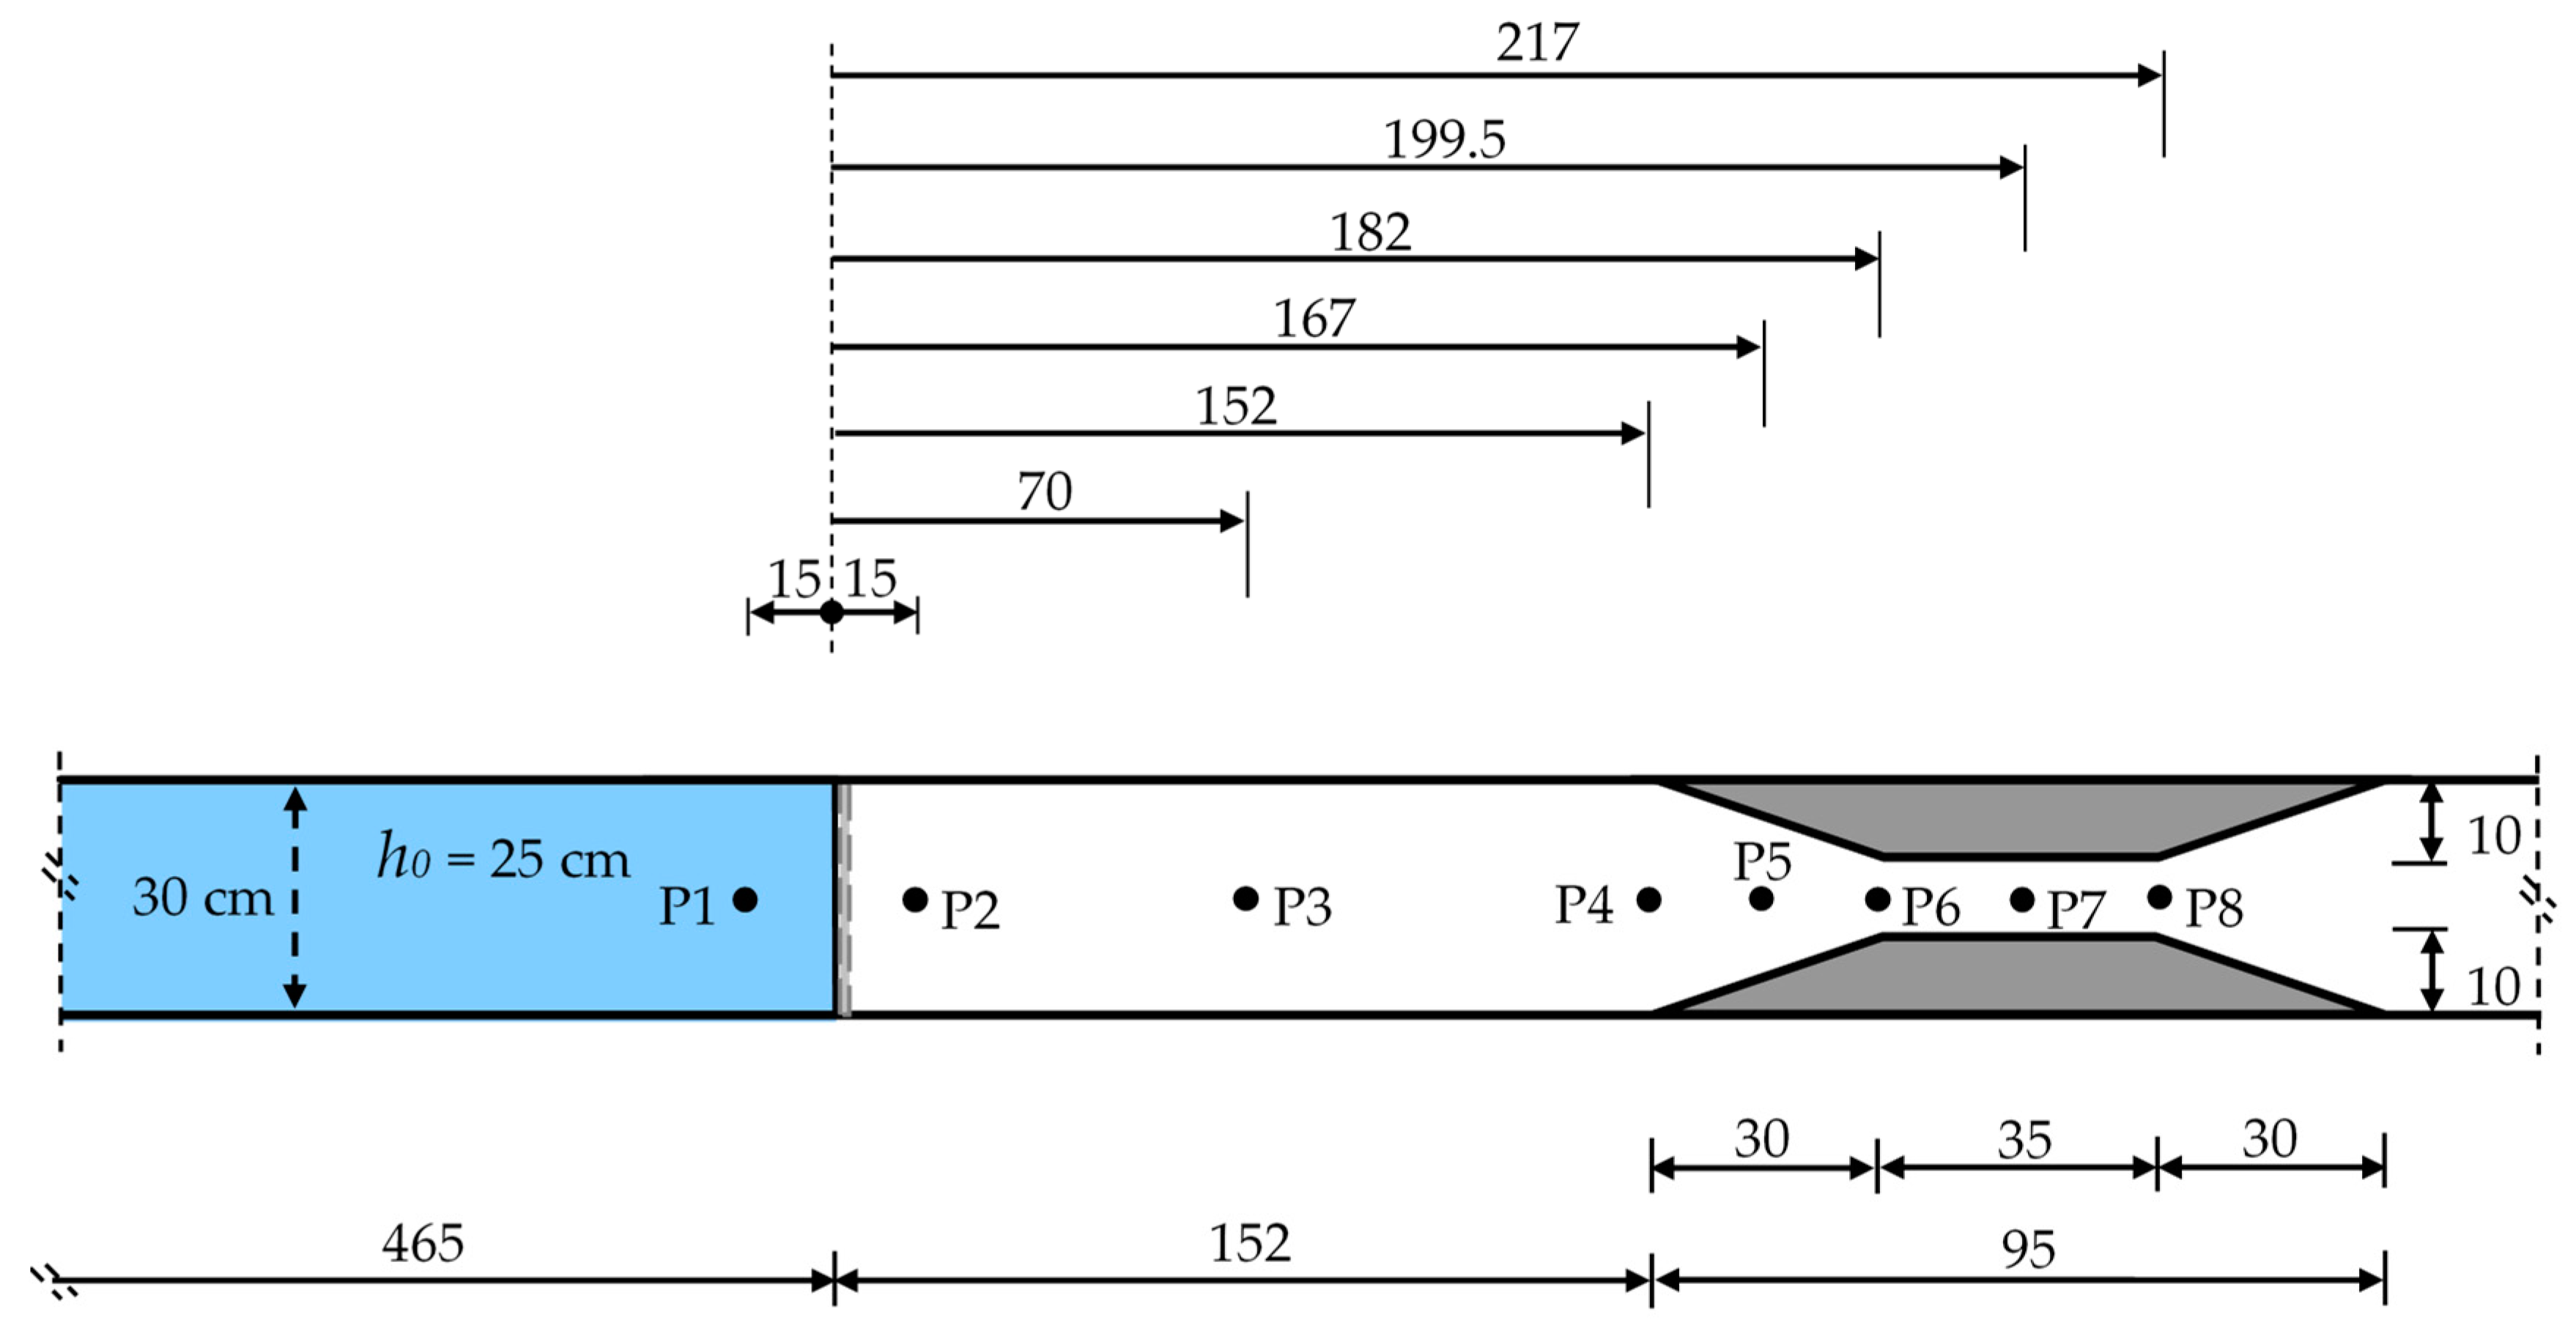
Besides the water surface profiles at different times, time variation of water levels was also measured at four different points in the three cases using the virtual wave probe. The measurement points (
Figure 4) were selected, respectively as follows: right upstream of the dam (P1), right downstream of the dam (P2), at half distance between the dam location and the contraction (P3), and at the starting point of the contraction (P4).
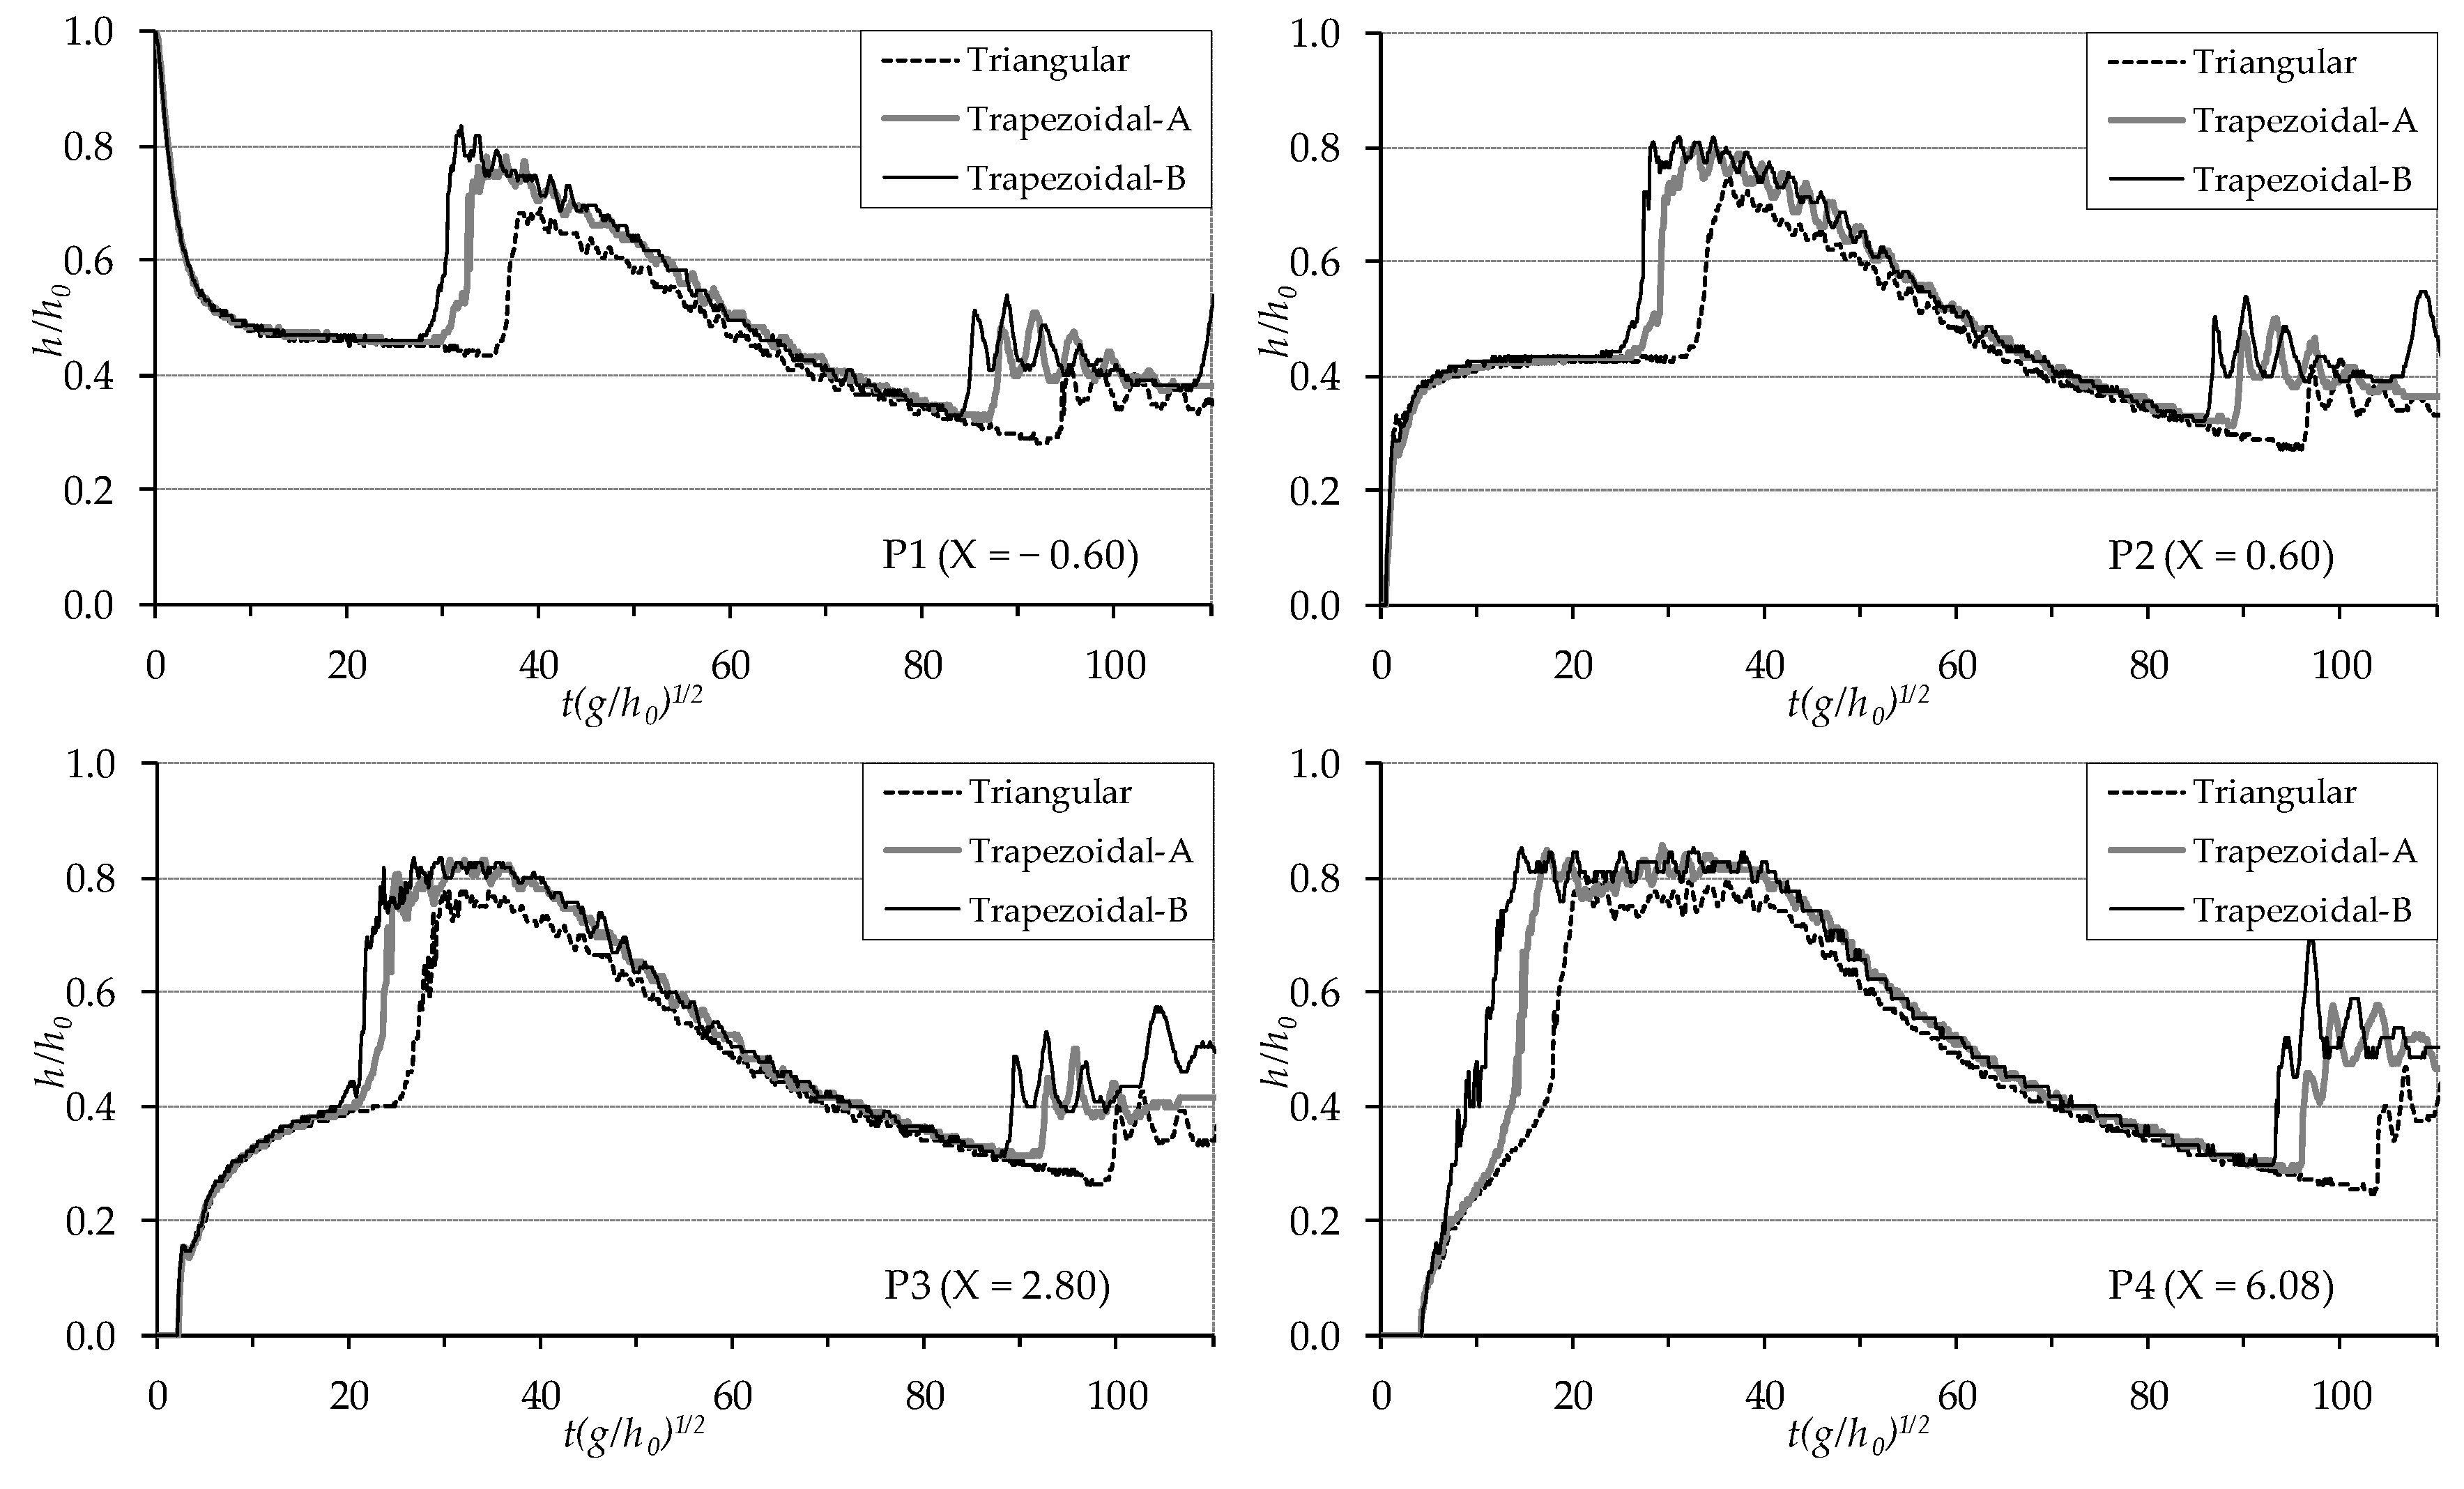
Figure 5 displays a comparison of the time variation of the water level for all the contraction cases in non-dimensional form: the initial water depth
h0 was used as denominator of horizontal distance (
X = x/h0) and flow depth (
h/h0), whereas time
t was multiplied by (
g/h0)
1/2, with
g gravity acceleration, to get the non-dimensional form of time
T = t (
g/h0)
1/2.
Since the initial water level in the reservoir is the same (
= 0.25 m), with the opening of the vertical gate simulating the dam-break, the rapid decrease in water level at point P1 and the rapid increase in water level at points P2 and P3 at initial stages coincide for all three cases. At point P4 where the contraction begins, the differences between the water levels are remarkable, since the time between the arrival of the flood wave and the formation of the reflected wave is very short. Since the distance between the measurement point P4 and the narrowest section is very short for Trapezoidal-B, the water level rises continuously and rapidly with the flood wave reaching and reflecting, whereas for the Triangular contraction, the narrowing distance is little longer and the difference in the rise of water due to the incoming and reflected waves is more pronounced. In addition, at point P4, the non-dimensional time
T to reach the maximum height of water level is 10.52 for the Trapezoidal-B, 13.53 for the Trapezoidal-A and 16.91 for the Triangular case, respectively, i.e., in the Triangular contraction is longer than in the other cases. The maximum water levels were observed at the narrowest section for all cases. The measured non-dimensional maximum water height
h/h0 is 0.85 for Trapezoidal-B, 0.84 for Trapezoidal-A and 0.81 for Triangular contraction, i.e., it is higher, since it is reached with more abrupt contraction, in the Trapezoidal-B case. Similar results are obtained observing the graphs of P1, P2 and P3 points. With the Trapezoidal-B contraction, the reflected wave reaches these points earlier and the measured maximum height is higher compared to the other cases; the water level in the upstream sections of the contraction increases significantly with the formation of a negative surge (reflected) wave in all cases. Due to finite reservoir length, the flow rate of the incoming flow decreases after a while and the water accumulated upstream of the contraction also gradually decreases. The reflected wave moving upwards is again reflected from the vertical wall at the upstream end of the channel, and a wave train which moves again downstream is formed. In the plots, while water levels are decreasing, a sudden rise and fluctuation of water levels are observed. The comparison of the reflected waves for all cases shows that the wave reflected in the Trapezoidal-B case is faster than in the other cases. In addition, during the passage of the wave reflected from the upstream channel boundary through the contracted section, the water level increases considerably, especially for the Trapezoidal-B case (before
T = 100). Then, the wave reflected from the upstream end of the channel is reflected again from the narrowed sections and starts to move again in the upstream direction. This situation can be seen in the Trapezoidal-B curve at
T = 105 for points P2 and P3. In general, when the dam-break wave encounters a cross-sectional change during its propagation, while a part of the flow passes through the existing opening, the rest of it is reflected in the contracted section and forms a reflected wave moving upward between the contraction and the upstream end of the channel until the water completely discharges. As a result, when the dam-break flood wave encounters quite abrupt transitions along its path, stronger reflections, higher water levels and mixed flow conditions occur upstream of the narrowing section. The small oscillations observed in the experimental reconstruction of the water level time histories (
Figure 5) with the specific image analysis measuring technique described above are not only the result of the strong reflections of propagating waves upward and downward and their interferences, but even more a result of the mixed flow conditions which occur in such strongly unsteady flows.
4.2. Comparison between Experimental and Numerical Results for Trapezoidal-A Case
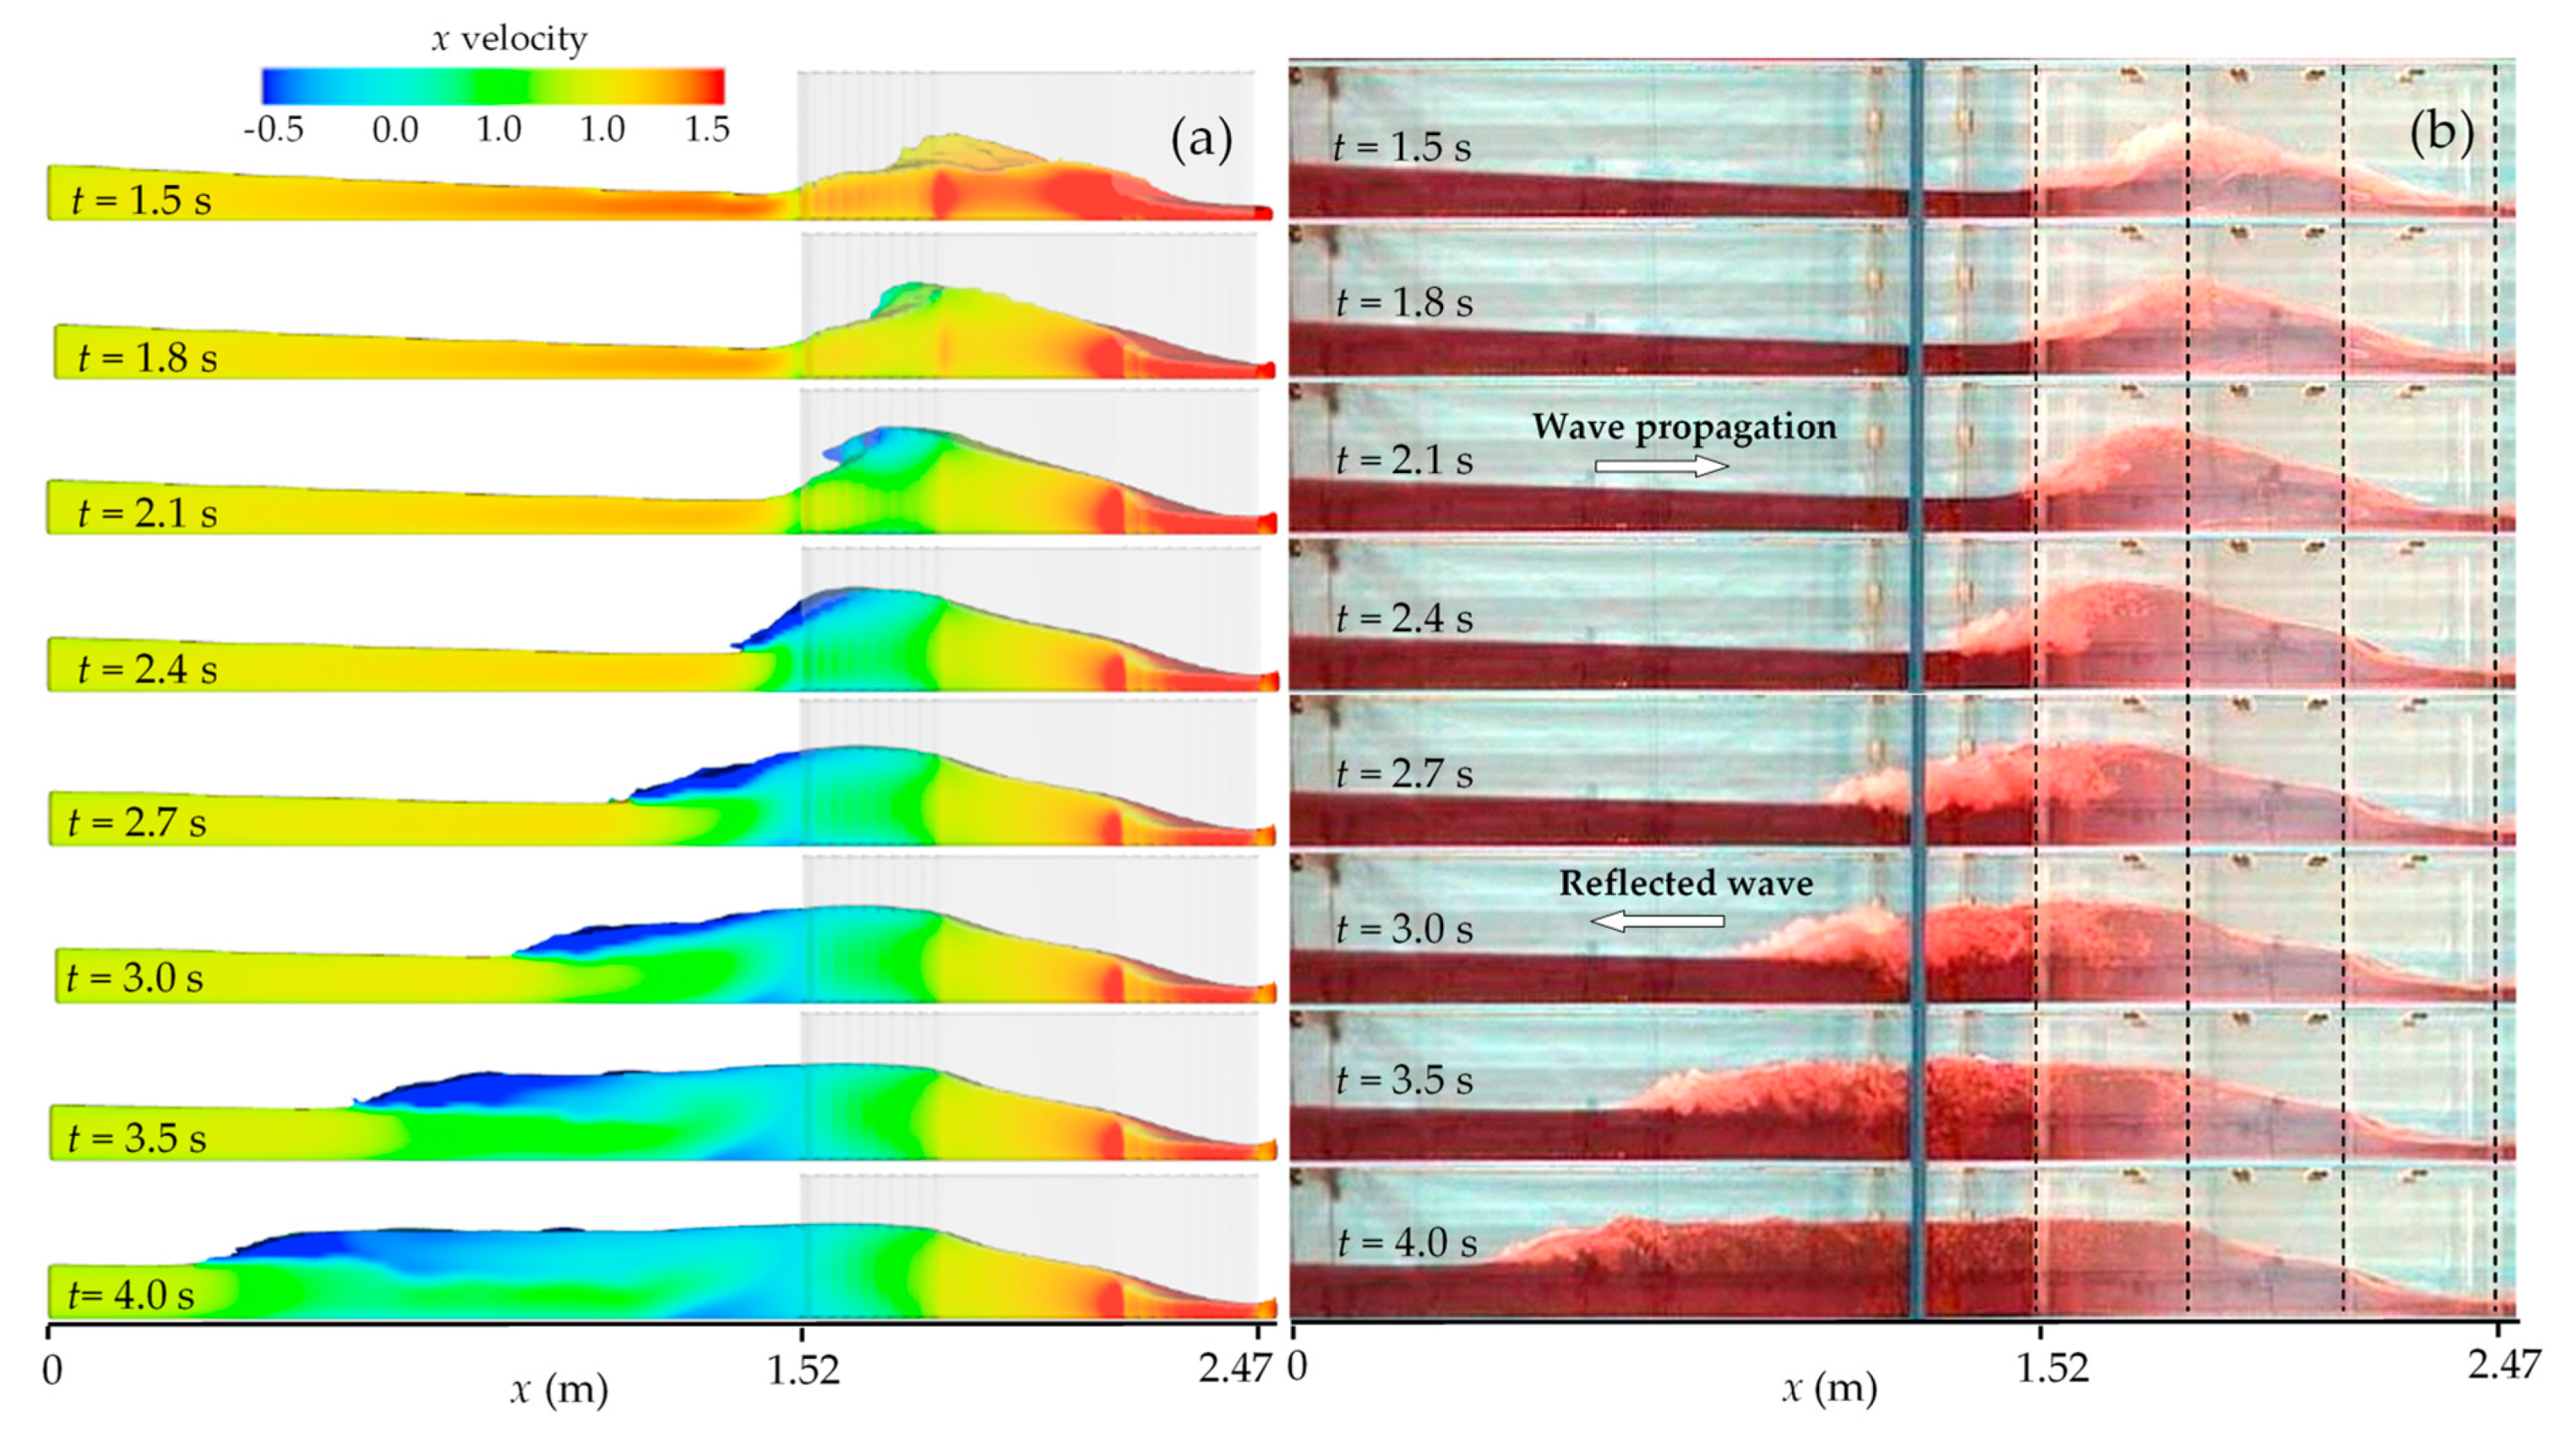
Figure 6 displays, for the Trapezoidal-A case, the comparison between the numerical results obtained by CFD simulation of RANS (
Figure 6a) and the experimental flow picture frames captured for the time interval 1.5–4.0 s (
Figure 6b). The two frames at corresponding times are in good agreement.
The selected times from 1.5 s to 4.0 s permit one to analyze the formation and propagation of the negative bore. The dashed lines indicate borders of the local contraction and of the 0.65 m long narrow throat. As already seen in
Figure 3 for all cases, with the sudden opening of the gate, the flow starts propagating; when the traveling wave front reaches the local contraction, at first the flow cross-section is constricted at the entrance before jamming and running up the sidewalls (
t = 1.5 s). The water level sharply increases up to the entrance of the narrow throat at times
t = 1.5–1.8 s, and intense turbulence mixing, with air entrainment into the flow, is noticed on the free surface. At time
t = 2.1 s, the negative bore crest starts moving upstream with rising depth. When the bore crest leaves the contraction region (
t = 2.4 s), a reflected negative wave moving upwards forms (
t = 2.7 s). In this way, the flood wave moving downwards encounters the negative wave, thus forming a prominent hydraulic jump at the contraction entrance.
The rapid rise in water level right upstream of the contraction entrance and the formation of the negative bore can be justified by the relationship between instantaneous specific energy and minimum energy of the propagating wave. The specific energy of the flow is smaller than the minimum energy necessary to pass through the contraction. Considering an upstream supercritical flow, a channel contraction induces an increase in flow depth to gain potential energy. Then, the flow transcends abruptly to subcritical with consequent formation of a hydraulic jump and a negative wave. This hydraulic jump moves upward as a rolling negative bore due to transient flow conditions [
50]. In the narrowest section, the water depth decreases rapidly and the flow passes through the critical depth. Once passed over the narrowest section, the flow becomes supercritical and cross waves form downstream due to the new expansion of the cross section along the final part of the obstacle. This analysis is also well represented in
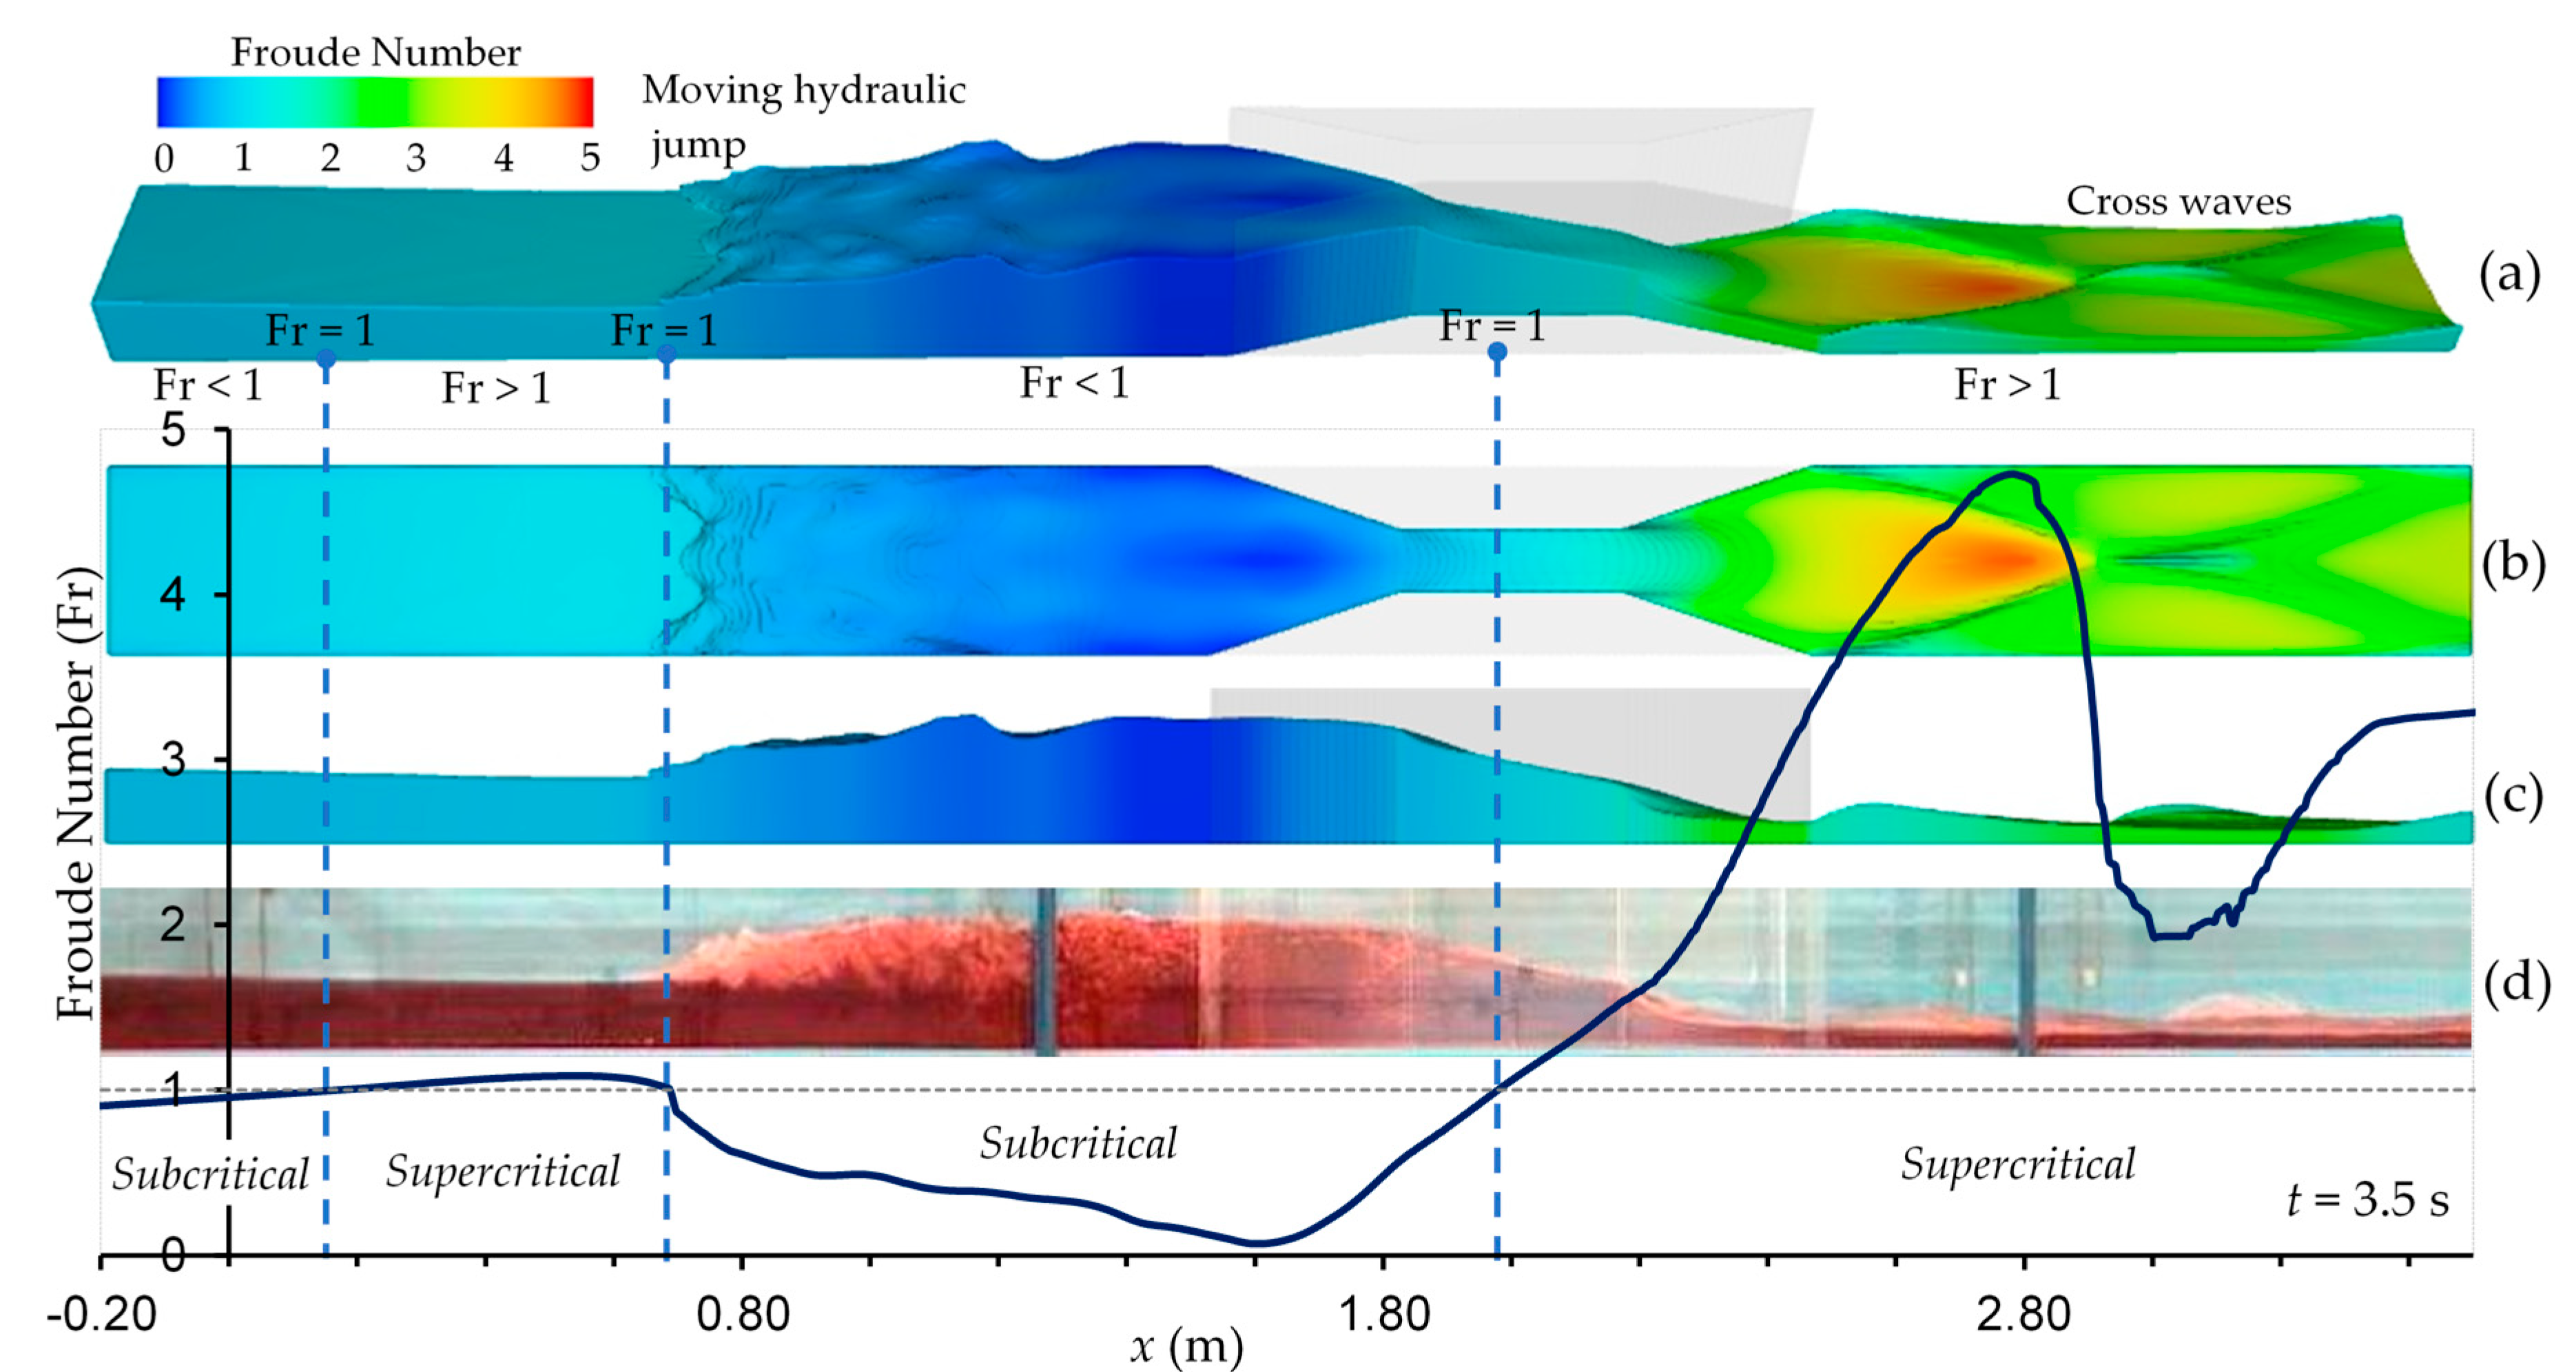
Figure 7, in which at a given time (
t = 3.5 s) the variation of Froude number (Fr) values along the channel is superimposed on the numerical solution (given as 3D view in
Figure 7a, plan view in
Figure 7b, and front view in
Figure 7c) and on the experimental captured image as water longitudinal profile (in
Figure 7d). The values of Fr number in the plot are those at the centerline of the cross section along the channel. As shown in the figure, critical regimes (Fr = 1) can be observed at three different sections: at
x = 0.18 m (just downstream of the dam),
x = 0.69 m (near half-distance of the throat) and
x = 1.98 m (at reflected wavefront with moving hydraulic jump), respectively, having regimes from subcritical (Fr < 1) to supercritical (Fr > 1) and vice-versa. Minimum Fr number was observed right after the flow enters the throat (at
x=1.60 m as Fr = 0.067). Maximum Fr number was observed downstream of expansion (
x = 2.78 m as Fr = 4.72), coinciding with the location where the cross wave first occurs. At the location where the cross wave intersects (
x = 3.00 m as Fr = 1.92), Fr number value decreases, still staying in supercritical flow regime. However, as the flow accelerates, Fr number increases again due to cross wave. It can be said that when the flood wave encounters a contraction while propagating downstream, flow regimes rapidly change from supercritical to subcritical and vice versa due to obstacle and mixed flow conditions occurring along the channel. Modeling of the mixed flow regimes requires special attention due to the different directions of wave propagation in subcritical and supercritical flows, as they contain shocks [
23]. Similar mixed flow conditions are observed when the dam-break wave encounters a bottom obstacle [
27].
Figure 8 shows flow depths along the contracting and expanding part of the channel at initial stages of the dam-break flow obtained from SWEs and RANS approaches of FLOW-3D, respectively. The direction of the unsteady flow is from left to right; the view is from the top of the channel in
Figure 8a,b, whereas
Figure 8c displays a 3D view.
The formation of negative waves due to the channel contraction, and their propagation upward are clearly observed for both models. Moreover, because of the expansion in the terminal part of the obstacles, cross waves appear downstream of the contraction [
42]. After
t = 2.5 s, the sharp border between the two colors (blue and red) in
Figure 8a represents the discontinuity at the negative wave front in the SWEs solution, which is also observed in the 3D view in
Figure 8c for
t = 3.0 s.
Figure 8b evidently mirrors the formation of the hydraulic jump produced by the channel contraction and the occurrence of supercritical flows after the narrow throat.
Whenever a supercritical flow encounters any obstacle, such as expansion or contraction, a surface wave moving across the flow forms. The contraction forces the flow to pass through the critical depth; thus, oblique jumps arise at the end of the contraction where the diffraction angles start, and they are carried downward as cross waves. Interferences between waves result in a disturbance pattern of cross waves, which can be qualitatively observed in
Figure 8. Wave fronts generated by the oblique jumps on both walls bounce back and forth between the side walls, with subsequent formation of an oblique jump moving toward the centerline and, the flow pattern being symmetric, generating a backward wave front toward the wall, as if there is a solid wall in the centerline. These continuous oblique jumps produce turbulent disturbances in the water surface [
42].
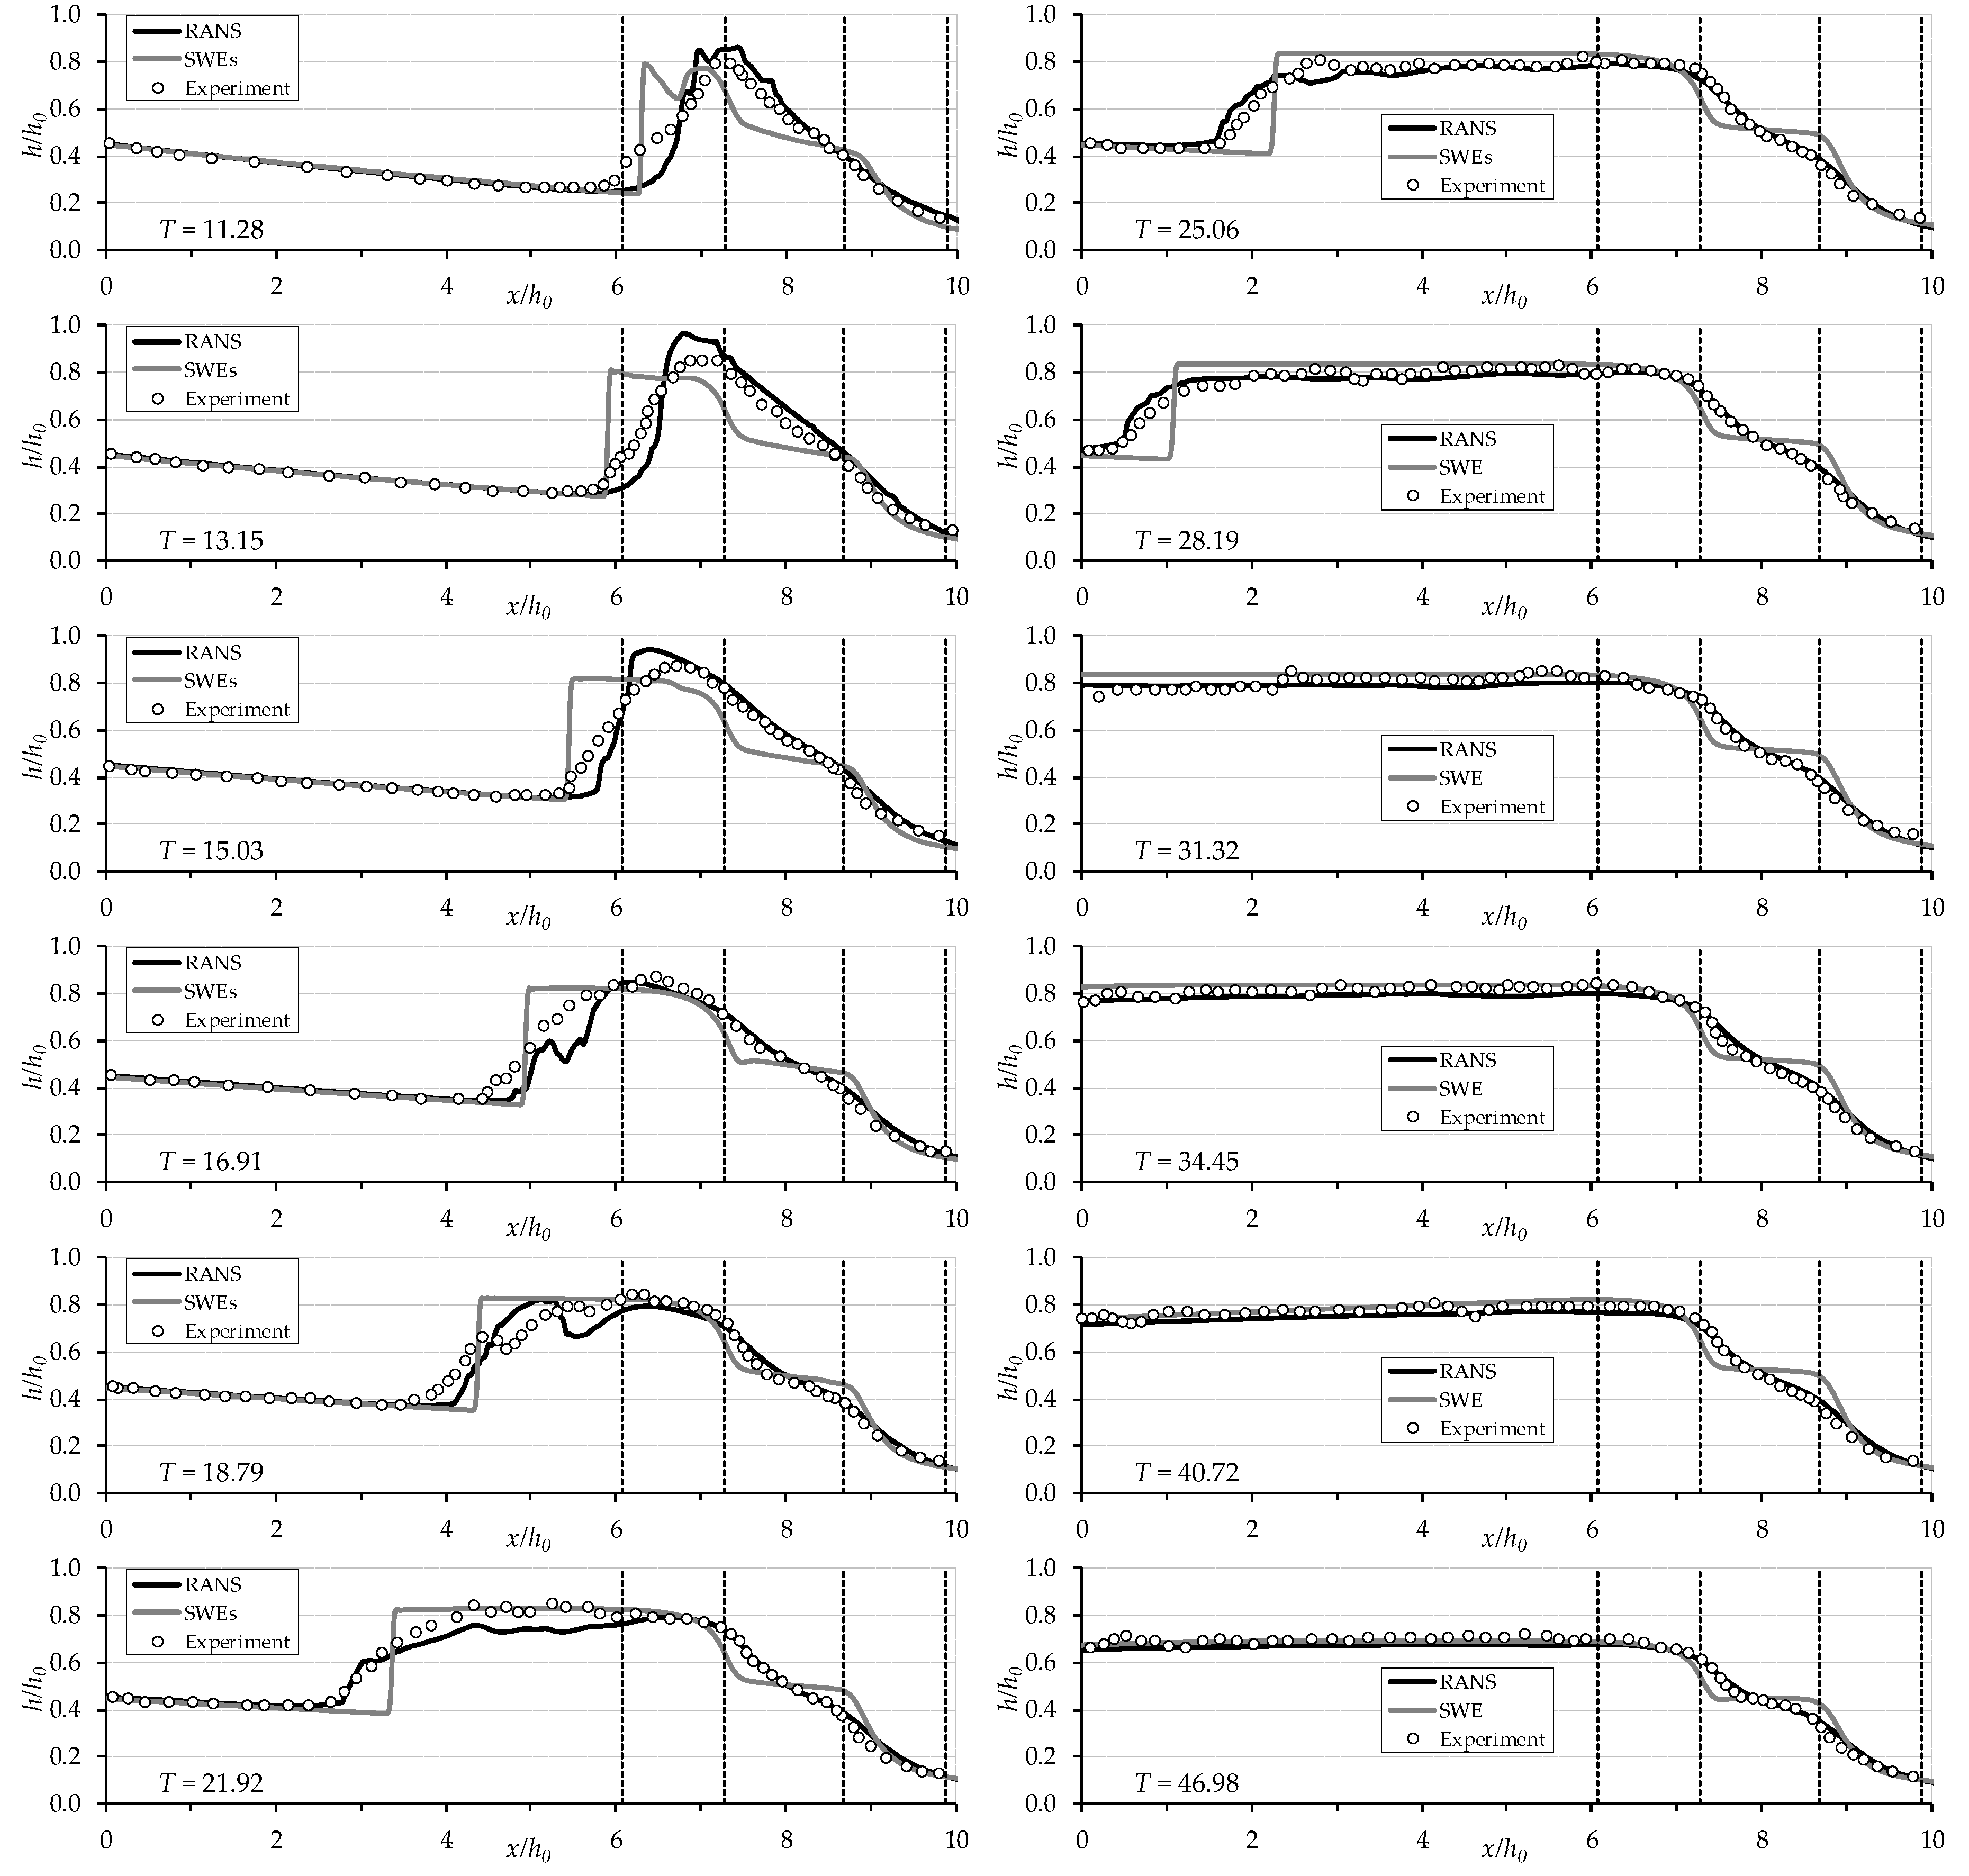
Figure 9 shows the comparison between the computed and the measured free surface profiles at various times after the gate removal in the Trapezoidal-A contraction case.
The borders of the contraction region are
X = 6.08 and
X = 9.88, indicated with dashed lines on the graphs, together with the borders of the throat. Again, it can be noticed that when the propagating dam-break wave approaches the contraction (
T = 11.28), the water level upstream rises abruptly and a negative wave is formed. A satisfactory accordance between measured and both computed profiles can be observed at
X < 5 at times
T = 11.28–15.03. A little discrepancy is noticed between experimental and RANS solved numerical free-surface profiles between
X = 6 and about
X = 9, whereas the SWEs solution shows more discrepancies and underestimates water depths as well as the negative wave front speed. The formation of the strong hydraulic jump causes here random oscillations. Free surface profiles can be nearly predicted by both numerical simulations after
T = 18.79, except for the appearance of a discontinuity on the negative wave front in the SWEs solutions. The overall disagreement of the SWEs solution is most probably caused by the assumption of neglectable vertical acceleration and hydrostatic pressure distribution [
2].
When the formation of the negative wave is fully completed (i.e., at times T ≥ 21.92), the free surface becomes more stable and a better correspondence is observed between the measured profiles and those computed by RANS. While the RANS model slightly underestimates the maximum water levels for T ≥ 21.92, the SWEs solution overestimates them.
The present investigation analyzes the capability of the two models to simulate dam-break flows in real-case topography. It is shown that the solution of the VOF-based RANS numerical model well describes well the propagation of the negative wave induced by the strong reflection of the dam-break flow against the abruptly changing topography with a reasonable accuracy, but it needs more computational time. On the other hand, the SWEs simulation shows a little disagreement but it provides an advantage in requiring less computational time, which would be even more important for real-case real-scale applications. The run-times were approximately 53 min in SWEs and 46 h in RANS for 20 s solution time, respectively, on a computer equipped with Intel Core i7 2.8 GHz 16 GB RAM. Hence, SWE-based numerical models are still preferable over RANS-based models for large computational domains where the vertical acceleration is insignificant compared to the less computational efforts and time. Fine meshes can be necessary in numerical simulations to represent irregular topographies and to obtain more accurate results. On the other hand, more computational efforts and times are required for 3-D solutions of large-scale real-case dam-break problems in the presence of artificial and natural obstacles such as bridges, buildings, dikes, and trees [
39,
51,
52]. In order to model flow around 3D structures such as bridges using fine mesh to capture localized flow details, the hybrid models combining RANS-based 3D flow and shallow water models in one simulation can also be used to reduce the computation time [
44].
Figure 10 shows the location of eight measurement points (P1–P8) for a further analysis, in which time histories of water levels using virtual wave probes were obtained and compared with SWEs and RANS results for the Trapezoidal-A case.
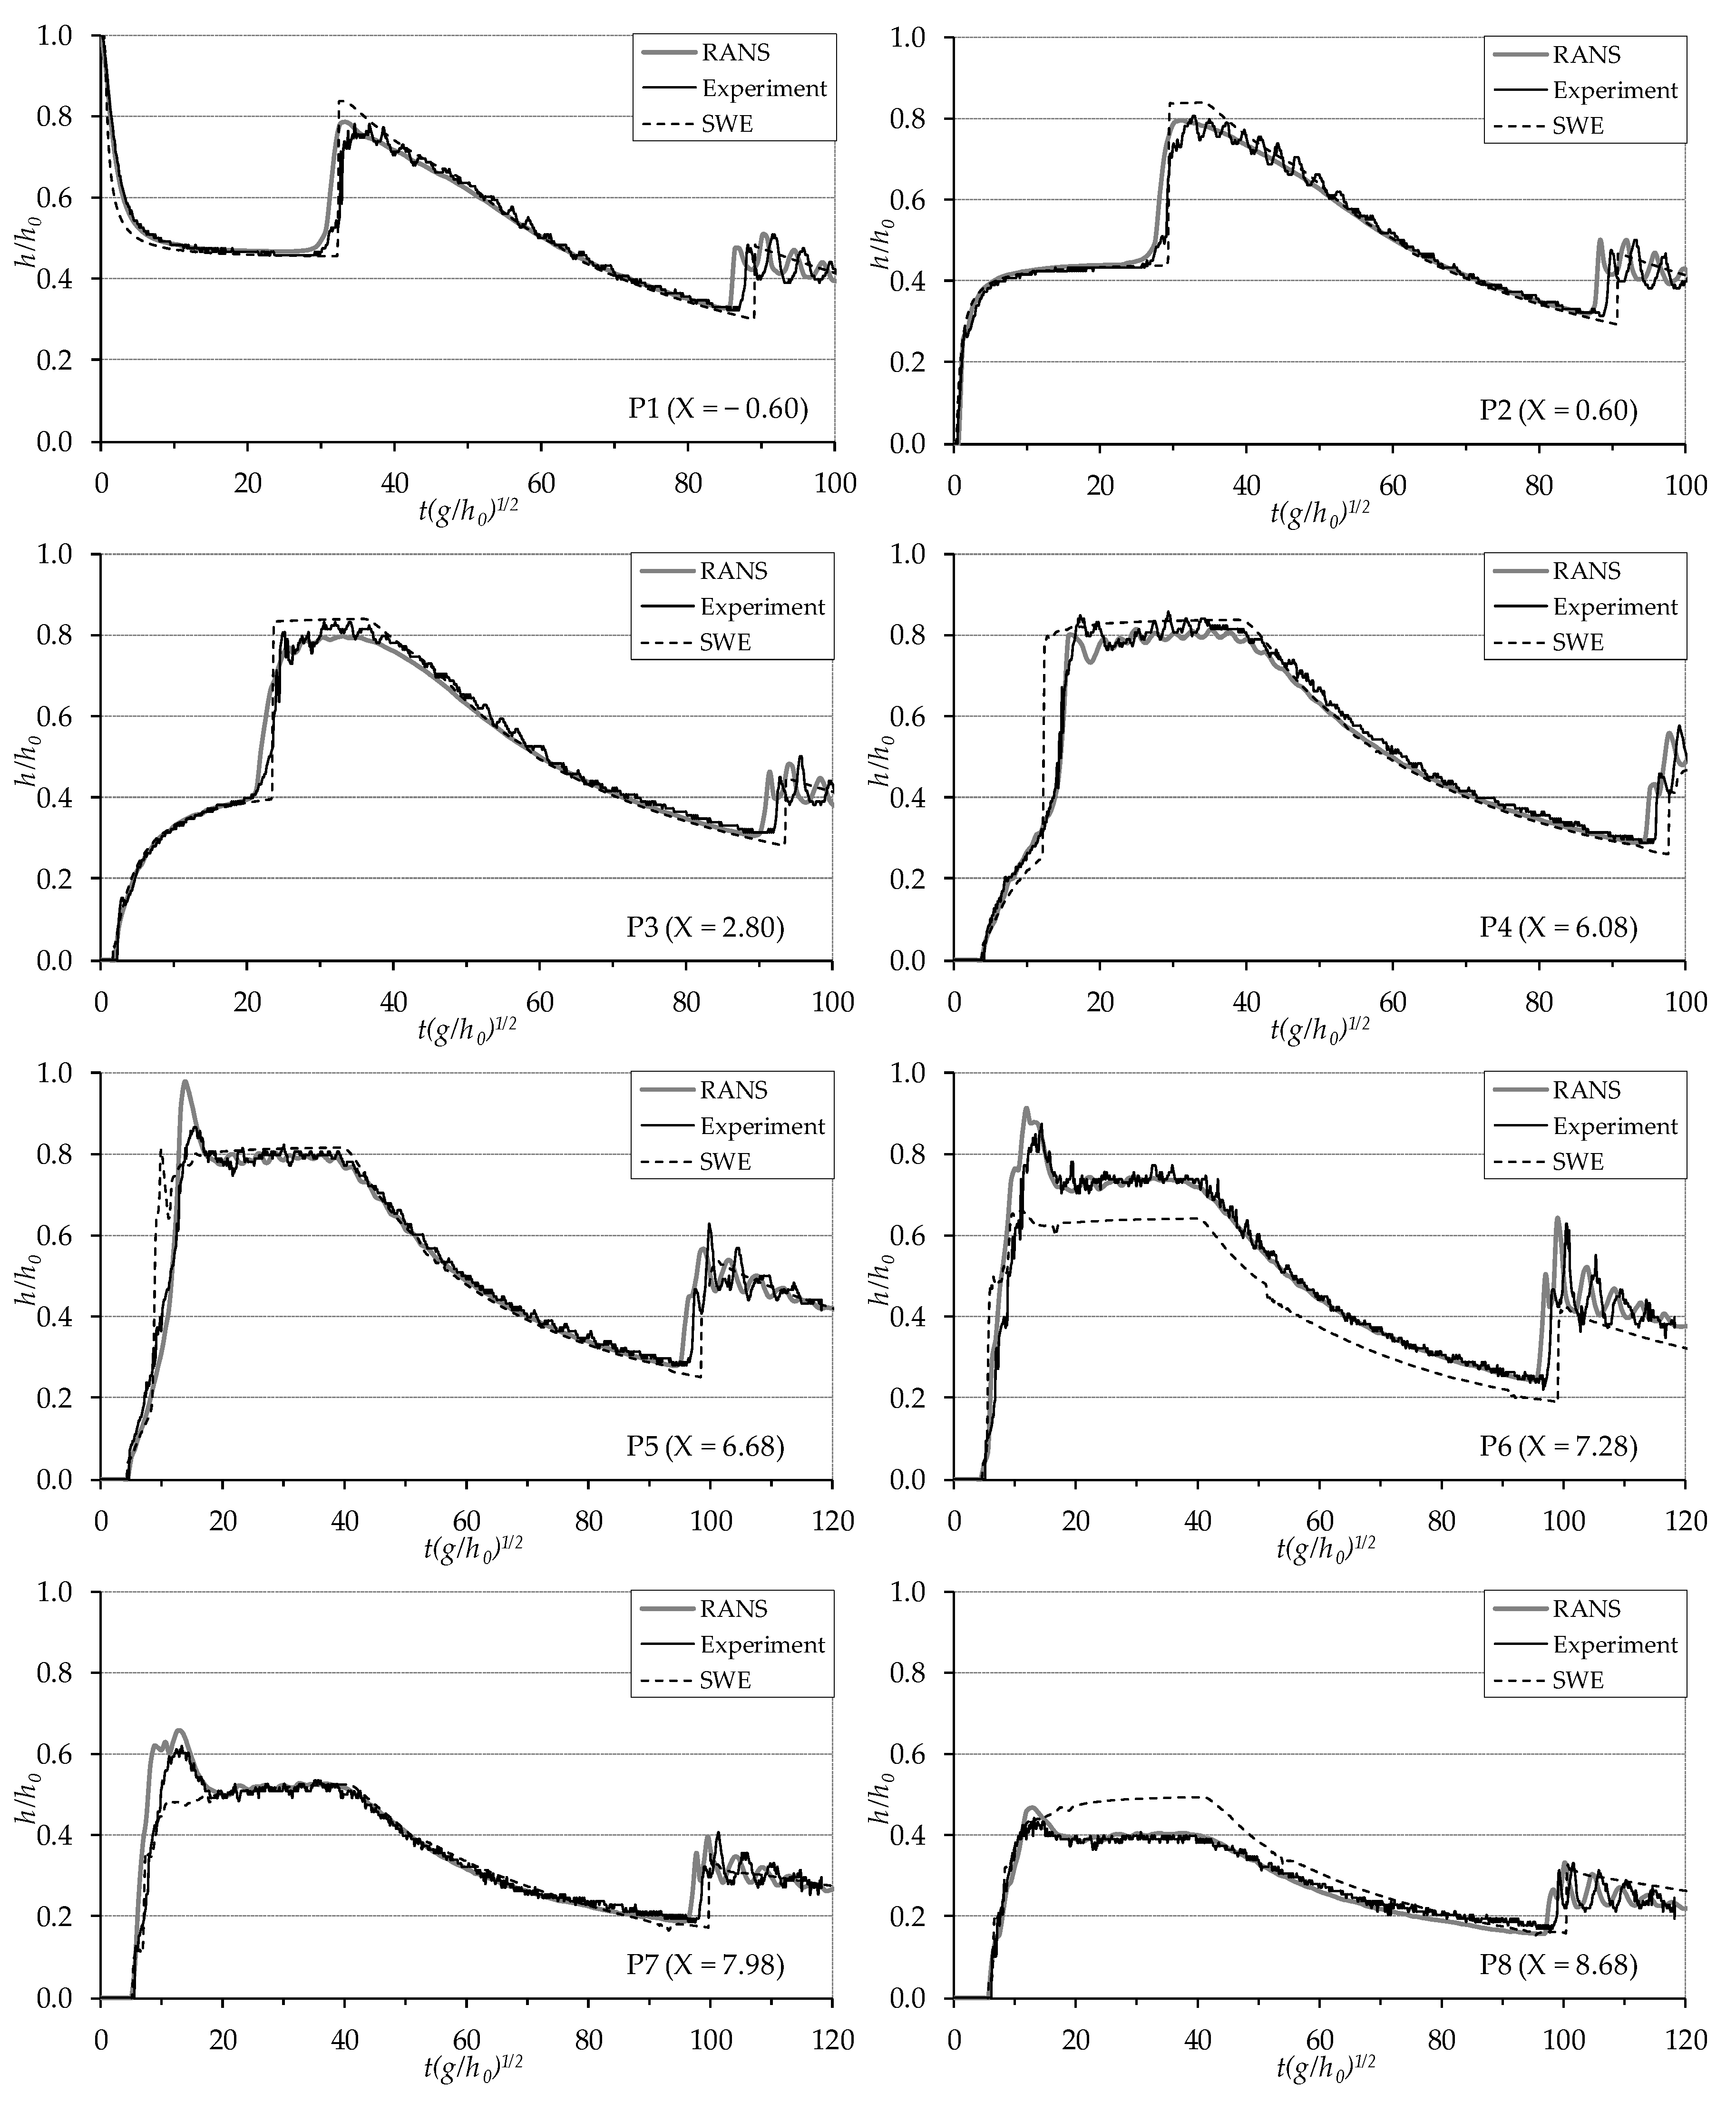
Figure 11 shows the comparison between numerical (RANS and SWEs) and experimental results in terms of non-dimensional water level changes with time at all measurement points (P1 to P8) for the Trapezoidal-A case.
Once the gate representing the dam is instantaneously lifted, a sudden drop for P1 and rise for P2 in water levels are observed up to
T = 5, with the two measuring points located just upstream and downstream of the dam, respectively. In these sections, a very little variation in water levels is observed between
T = 5–30. At point P3 (
X = 2.80), the rise in the water level is slower as the dam-break flood wave passes until
T = 20. Until the wave reflected from the contraction reaches the measurement points, at
T = 30 for P1 and P2 and at
T = 20 for P3, a good correspondence is observed between experimental and numerical results both for the RANS and the SWEs solutions. Only the SWEs profile is slightly lower during the decrease of the water level in the reservoir at P1. When the reflected wave reaches the measuring points, the water level increases suddenly at this point. If the RANS-calculated maximum water levels are in good accordance with the experiments, the results are overestimated by the SWEs. At the entrance of the contraction (at
X = 6.08 for P4 and at
X = 6.68 for P5), an abrupt rising in water level, due to the very short time between the arrival of the flood wave and the formation of the reflected wave, is accurately simulated in the RANS solution except for the peak level at P5. Similarly, due to the absence of any reflection, a continuous rapid rise in water level was observed at P6, P7 and P8 points. Water-level changes were also accurately predicted by the SWEs, except for when the reflected wave forms and propagating wave passes through the contraction, because of neglecting the vertical acceleration and assuming hydrostatic pressure distribution in the SWEs approach. Therefore, the water levels having more water surface curvature at both ends of the throat at points P6 (
X = 7.28) and P8 (
X = 8.68) were significantly underestimated and overestimated, respectively. A similar situation can also be clearly seen at the beginning and end of the narrowest section in
Figure 9 for times
T = 16.91–46.98. When the reflected wave moving upward reaches the dam axis, the water level gradually drops due to the finite reservoir length. The flow transcends to subcritical at the downstream of the reflected wave front due to the hydraulic jump and flows freely through the opening of the contraction. At this stage, the correspondence between experimental and both computational results are quite satisfactory. Unlike the numerical simulations, in the experiments, minor fluctuations occur on the water surface in all graphs at the stages in which the maximum water levels occur and water level decreases. This situation is due to the moving hydraulic jump caused by the flow transition from supercritical to subcritical at the wave front after reflection of the dam-break wave from the contraction. Some undulations also emerge from the difficulty in determining the free-surface edge in experiments due to the foaming in proximity to the wave front [
15,
21]. The computed water levels, wave front velocities and amplitude of the wave train formed by the reflection of the negative wave against the upstream end wall are also in good agreement with experimental results. However, the speed of the wave train is slightly faster for all measurement points in experiments than the SWEs but lower than the RANS.
The RANS model uses the sum of viscous and turbulent shear stresses with turbulence models, whereas the SWEs use an empirical equation to calculate bottom shear stress for turbulent flows. Therefore, when comparing RANS and SWEs results in terms of water-level measurements, it should be taken into consideration that energy losses between the two models are handled with different approaches. The SWEs in FLOW-3D do not include any viscosity term nor use any of the turbulent models, but rely on the empirical expression based on a quadratic law given in Equation (10) to calculate energy loss for turbulent flow. The calculation of bottom shear stress requires the definition of a drag coefficient , which can be selected as a constant (as we did, assigning the value of 0.0026, according to the manual suggestions) or let it be calculated from the software for a component, based on its surface roughness, using Equation (11). Preliminary sensitivity studies showed that the use of a constant value = 0.0026 or of a value of calculated based on the surface roughness ks = 0.00015 cm did not change much the results in terms of water depths. A sensitivity analysis of the calibration parameter, evaluating the effect of different values, was also performed, proving no significant effects in maximum wave heights and speed of reflected wave fronts. This is probably due to the low roughness of bottom and walls of the channel, which were made of glass. An accurate determination of the coefficient might be necessary for surfaces with different roughness.
The dam-break wave propagation analyzed here is a strongly unsteady flow characterized by high turbulence, mixed flow and steep water surface fronts (shocks). In this situation, the hypotheses of hydrostatic distribution of pressures and neglectable vertical components of both velocity and acceleration, on which the SWEs are based, are not satisfied and can lead to not completely satisfactory results, differently from a fully 3D model like RANS, which is certainly more suitable. However, during the transition of the wave, water levels are excessive only in a certain period of time in the SWEs results. In the 3D RANS model energy losses are fully calculated via shear stress expressions with viscosity and turbulent viscosity by using k-ε turbulent model. For a more coherent comparison between SWEs and RANS, which is not a priority here, it might be better to evaluate at each time step water levels also in the SWEs model, including the period of time in which the hydraulic jump (shock) occurs.
Error analysis was performed making use of the three following measures of the differences between model (RANS and SWEs) predicted and experimental observed values for n samples:
Root Mean Square Error (RMSE)
Mean Absolute Percent Error (MAPE)
Mean Absolute Error (MAE)
Referring, for example, to the data reported in
Figure 11 (water level time histories), the three errors are reported for the measuring points P1–P8 in
Table 2. Errors were calculated for 900 (18/0.02) different values for a total of 18 s at 0.02 s intervals.
In general, the error rates in SWE were higher than RANS for all of the methods. As mentioned above and observed in
Figure 11, the absolute highest error rate for SWE was observed at the entrance and exit of the contraction zone (P6 and P8), equal to 18.14% and 13.80%, respectively (MAPE calculation). In the same contraction zone, the highest error was also obtained for RANS (7.67 with MAPE calculation). The lowest errors were reached for the more upstream measurement points, as 4.22% for SWEs and 3.50% for RANS. In addition, similar results were observed for RMSE and MAE, especially with respect to the highest error at P6 for RANS and SWEs.
As a result, for all sections, both RANS’s and SWEs’ numerical simulations were able to successfully reproduce variation of the water levels over time. However, the peak water levels on the reflected wave crest are overestimated in the SWEs results. Reflected wave propagation velocity is slightly faster in the RANS than in both experiments and SWEs simulations. The flow is truly 3D, with significant air entrainment, which cannot be entirely captured by the 2D SWEs numerical model. Better results can be obtained by RANS with turbulence closures, but requiring more computational effort for the 3D dam-break flow, whereas the SWEs-based numerical models need less computing power and shorter computational time in large-scale problems with reasonable accuracy. If the flow, in fact, is truly 3D just upstream of the contraction, then it can be assumed to be 2D except at the converging part of the obstacle and for the initial stage of the dam break; therefore the SWE approach can be accepted overall for the reasonable prediction of the dam-break flow [
31,
53,
54].
