Article

Microplastics Removal from Treated Wastewater by a Biofilter

1
Department of the Built Environment, Aalborg University, Thomas Manns Vej 23, 9220 Aalborg Øst, Denmark
2
Department of Environmental Science, Aarhus University, Frederiksborgvej 399, 4000 Roskilde, Denmark
*
Author to whom correspondence should be addressed.
Water 2020, 12(4), 1085; https://doi.org/10.3390/w12041085
Submission received: 18 March 2020 / Revised: 9 April 2020 / Accepted: 9 April 2020 / Published: 11 April 2020
(This article belongs to the Section Wastewater Treatment and Reuse)

Abstract

:
Microplastic (MP) pollution is a global environmental issue, and traditionally treated wastewater has been identified as a source of land-based microplastics into the aquatic environment. This study evaluated the performance of a pilot-scale biofilter to polish wastewater treatment plant (WWTP) effluent before it enters the environment. The filter was divided into four zones, allowing the concentration of microplastics to be followed through the filter. It was fed with secondary effluent from a conventional WWTP in Denmark. The raw effluent from the WWTP contained 917 items m−3 which corresponded to a mass concentration of 24.8 µg m−3. After the top layer of the biofilter, the concentration had decreased to a median value of 197 item m−3 and 2.8 µg m−3, indicating an overall removal efficiency of 79% in terms of particle number and 89% in terms of particle mass. We also observed a tendency that MP of larger size and higher particle mass were more likely to be retained. After the last filtration zone, all MP larger than 100 µm had been removed. The results of this study demonstrate that biofilters are able to lower the MP abundance in treated wastewater significantly, but a complete removal is not ensured, hence some MP, particularly small-sized ones, can still be discharged into the receiving environment.

1. Introduction

Plastic litter is a global pollution issue both in the aquatic and terrestrial environment [1,2,3]. Microplastics (MP), often defined as plastic particles <5 mm in length [4], are of particular concern due to their persistence in the environment, and their potential to transport and release chemical compounds [5]. Nowadays, MP has been detected not only in various water bodies [6,7,8], soils and sediments [9,10,11], but also in indoor air [12], table salts [13], and even in the atmosphere in remote areas [14]. More recently, ingestion and entanglement of MP was also found by freshwater and deep-sea organisms [15,16,17,18], which raised a concern that the human food chain is under risk of MP contamination [19,20].
Land-based sources such as households, industries, and mismanaged plastic waste have been suggested as the main cause of plastic pollution of the aquatic environment, the atmosphere, and the terrestrial environment [16]. The pathways for the plastic pollution includes stormwater runoff, municipal and industrial wastewater, and wind [8,21,22]. Here wastewater plays an important role, as it receives and conveys plastic litter from residences, industries, agriculture, and commercial activities. Several studies have shown that wastewater treatment plants (WWTPs) designed for removal of organic matter and nutrients are efficient in removing MP, with reported efficiencies generally above 90% [23,24,25,26]. Despite this, large amounts of MP are still released with the effluents [27,28].
Some tertiary treatment technologies can further polish the effluent from WWTPs, for instance, membrane bioreactors, rapid sand filters, and disc filters [28,29,30]. Another technology which potentially can polish WWTP effluents are biofilters, designed to degrade specific dissolved pollutants such as pharmaceuticals [31]. Their efficiency in retaining MP has though not yet been studied. The aim of this study was to contribute knowledge on the performance of biofilters in removing MP from effluents of nutrient removing WWTPs. A pilot-scale biofilter designed to remove pharmaceuticals, personal care products, and other organic micropollutants from WWTP effluents was chosen for the study. The evaluation includes the removal efficiency in terms of MP mass and number, as well as details on sizes, masses, and polymer composition of the particles retained by the filter.

2. Materials and Methods

2.1. Experiment Setup

A pilot-scale biofilter was set-up in the fall of 2017 at Avedøre WWTP in Hvidovre, Denmark. Avedøre WWTP applies biological nutrient removal and secondary clarifiers before discharging the effluents to the Oresund. The biofilters were packed in circular 1 m3 stainless steel tanks, and from top to bottom consisted of a drainage layer of approx. 1.1 m of stone wool (ROCKWOOL®, Hedehusene, Denmark), 40 cm of Filtralite® CLEAN HR 3-6 (Leca Rælingen, Norway), and 10 cm of granite gravel (11–15 mm grain size). The stone wool filling consisted of 6 separate stone wool boards, where the top board was 0.1 m thick and the following 5 boards were 0.2 m. Each stone wool board was cut into four even pie-shaped pieces, and rotated relatively to each other to avoid preferential flow through the filter (Figure 1). The different materials (stone wool, Filtralite, gravel), and sampling valves on the side of the column were separated/covered by a layer of glass fiber mat (CSM 300 gr. Emulision m−2, Lintex) to avoid migration of materials. Four sampling valves were mounted on the side of the tank, each covering different levels of the inside material (Figure 1). Valve 1, 2, and 3 allowed sampling of the effluents which passed through the filtration of the top, middle and bottom part of the stone wool layer, respectively. Valve 4 allowed sampling after the stone wool and the Filtrilate layer. As the layer below valve 4 consisted of gravel, which was unlikely to further retain microplastics, the water sampled at level 4 represents the effluent of the biofilter.
Prior to the experiments, the setup was fed with raw effluent for 2.5 months to ensure that biofilms had sufficiently matured. The filter was kept submerged at all times due to a higher inlet flow than the outlet (Figure S1). The flow through the setup was driven by gravitation.

2.2. Sampling

Samples for quantifying retainment of microplastics were collected in June 2018, by means of a custom-made filtering device. The device was constructed of stainless steel, and equipped with a removable 10 μm stainless steel filter of 100 mm effective diameter. Samples were drawn one at the time from the 4 levels of the biofilter and from the outlet by a plastic-free positive displacement pump (Creusen Roermond, Dordrecht, The Netherlands). A pressure gauge was placed between the pump and the filter to indicate the hydraulic capacity of the filter. The pump was stopped when the pressure had risen to 2 bar, and the filter changed. Further details on the filtering devise are found in Simon et al. [30] and Liu et al. [8].
The water at each level was sampled successively, with only the valves at the inlet, outlet and the corresponding sampling level kept open. The samples were collected over 3 days as it took several hours to filter one sample. Before sampling, the three valves were kept open for 20 min and the inflow adjusted to ensure that the water level at the top of the biofilter was stable and no overflow occurred. For each level, the sampling was continued till three filters had clogged, which corresponded to sample volumes between 509 and 995 L. The three filters were then combined and stored in a glass jar and immediately filled with sodium dodecyl sulphate solution (SDS, 0.15 g L−1) to cover the filters [8]. The jar was sealed with a glass lid and wrapped with aluminum foil to prevent contamination by air-borne MPs. The biofilter inlet (the raw effluent from the treatment plant) was sampled by filtering the water directly without passing through the biofilter. The final sampled volume at each filtration level is given in Table S1. All samples were transferred to the lab and stored at 5 °C until analysis.

2.3. Sample Processing

The processing of the samples followed the method described in Liu et al. [8]. Briefly, the filters containing the samples were wet-oxidized by adding 50 mL 50% H2O2 in 500 mL of SDS solution and left for 2 days, followed by Cellubrix (500 μL, Sigma-Aldrich, Denmark), Viscozyme (350 μL, Sigma-Aldrich), and Alcalase (500 μL, Novozymes, Denmark) enzyme treatment for 6 days. A Fenton oxidation was then carried out to further reduce the remaining organic matter. The reactors were kept in a water bath where the temperature was monitored and maintained at 15–25 °C. In order to separate MP from inorganic particles, the oxidized samples underwent a density separation in a zinc chloride solution (1.8 g cm−1). The separation was done in a 200 mL glass funnel. Dust-free nitrogen gas was used to mix the sample by bubbling it through the solution for 30 min. The solution was left for 2 h after the first mixing, and the settled particles drained off through the bottom of the funnel. The funnel was topped off with clean zinc chloride solution to 200 mL, upon which it underwent a second floatation for 30 min and left overnight. The settled particles were again drained off, and the upper 2 cm of the separation liquid was collected. The inner wall of the funnel above the separation liquid was gently flushed with clean zinc chloride solutions and mixed with the collected liquid. The combined liquid was filtered through a 10 μm stainless steel filter, and concentrated in a 5 mL 50% ethanol solution.

2.4. Microplastic Identification and Quantification

The identification of MP followed a method previously described in Simon et al. [25], Liu et al. [8], and Vianello et al. [12]. Briefly, a subsample of 600 μL was deposited onto a circular 13 mm zinc selenide transmission window, which was restricted to 10 mm using a compression cell. The window was dried at 50 °C and scanned with a FPA (Focal Plane Array) based FTIR imaging technique (Agilent Cary 620 microscope equipped with a 128 pixel FPA and combined with a Cary 670 spectrometer). The resulting FTIR imaging map was analyzed with MPhunter, a freeware developed at Aalborg University [8]. MPhunter identifies the material of particles, particle sizes, and the area that a particle covers on the image. It estimates particle mass assuming that the MP particle is shaped as an ellipsoid, and that the third dimension is a fixed fraction (0.6 in this case) of the minor dimension [8,25]. If MPhunter identified an MP of dimension larger than 500 μm, the particle was collected from the window with ultra-fine micro forceps and further investigated visually under a stereomicroscope (Stereo Discovery V8, Zeiss, Oberkochen, Germany) to reduce the risk of underestimating its size due to the saturation of μFTIR imaging spectra that occurs for thick particles.

2.5. Experimental Quality Control

Precautions were taken to reduce potential contaminations during the sample processing. Cotton lab coats were worn at all times when handling the samples. Only glass, stainless steel, or Teflon-coated labware was used. Teflon was excluded from the data analysis, as its density (2.2 g cm−3) exceeds that of the ZnCl2 solution and particles hence will settle during the density separation and be discharged together with inorganics [8]. All steel filters had been muffled at 500 °C and all labware was rinsed with Milli-Q water three times before use. To avoid airborne contamination, all open containers were covered with aluminium foil or Watch glass dishes (Sigma-Aldrich) during transportation and immediately after use. Furthermore, an air treatment device (Dustbox® Hochleistungsluftreininger, Halle, Germany) with a HEPA filter (H14, 7.5 m2) was applied in the µFTIR scanning room to continuously filter the air.
However, contamination can still originate from the sample processing. Hence, three blanks were processed to quantify the background contamination. MP-free blanks were made by filtering 20 L Milli-Q water through 1.2 µm GF filters. The MP-free water was then pumped through the sampling device holding a 10 µm steel mesh, and the filter processed the same way as the effluent samples.

2.6. Statistical Analyse

All statistical analysis was performed in R (3.5.1). The removal efficiency was calculated as MP concentration in the inlet minus MP concentration after treatment, divided by the MP concentration in the inlet.

3. Results and Discussion

3.1. Background Contamination

For each of the three blanks, 600 µL was sub-sampled from the 5 mL of concentrate, corresponding to 12% of the blanks being deposited and analysed. Twelve particles in total were in this way identified as MP, with an estimated total particle mass of 932 ng. Polyester constituted over half of these MP (7 items), followed by PE (polyethylene, 4 items) and PS (polystyrene, 1 item). Since the water used for the blanks was MP-free, the potential source of the contamination was related to the sample handling during analysis. Hence the contamination was not normalized against the filtered water volume, but against the sample processing. Taking the sub-sampling rate into account, the MP identified in the blanks corresponded to 33.3 items, or 2597 ng, per processed sample. The average amount of filtered water at each treatment level was 749 L, which lead to an average contamination of 4.4 item m−3, or 3.4 µg m−3. Compared to studies with a similar MP extraction and analysis approach, the contamination of this study was comparably low with respect to the number of MP, but the MP mass was slightly higher. Liu et al. [11] found for instance 20.8 items per sample processed, but with the MP mass being 72.9 ng. This can be explained by the presence of larger-sized polyester particles in the blanks (averaged major dimension of 87 µm and estimated density of 1.38 g cm−3) compared to the other studies. To avoid statistical biases when interpreting the data with respect to size distribution and polymer types, the results were not corrected for background contamination.

3.2. MP Abundance and Removal Efficiency

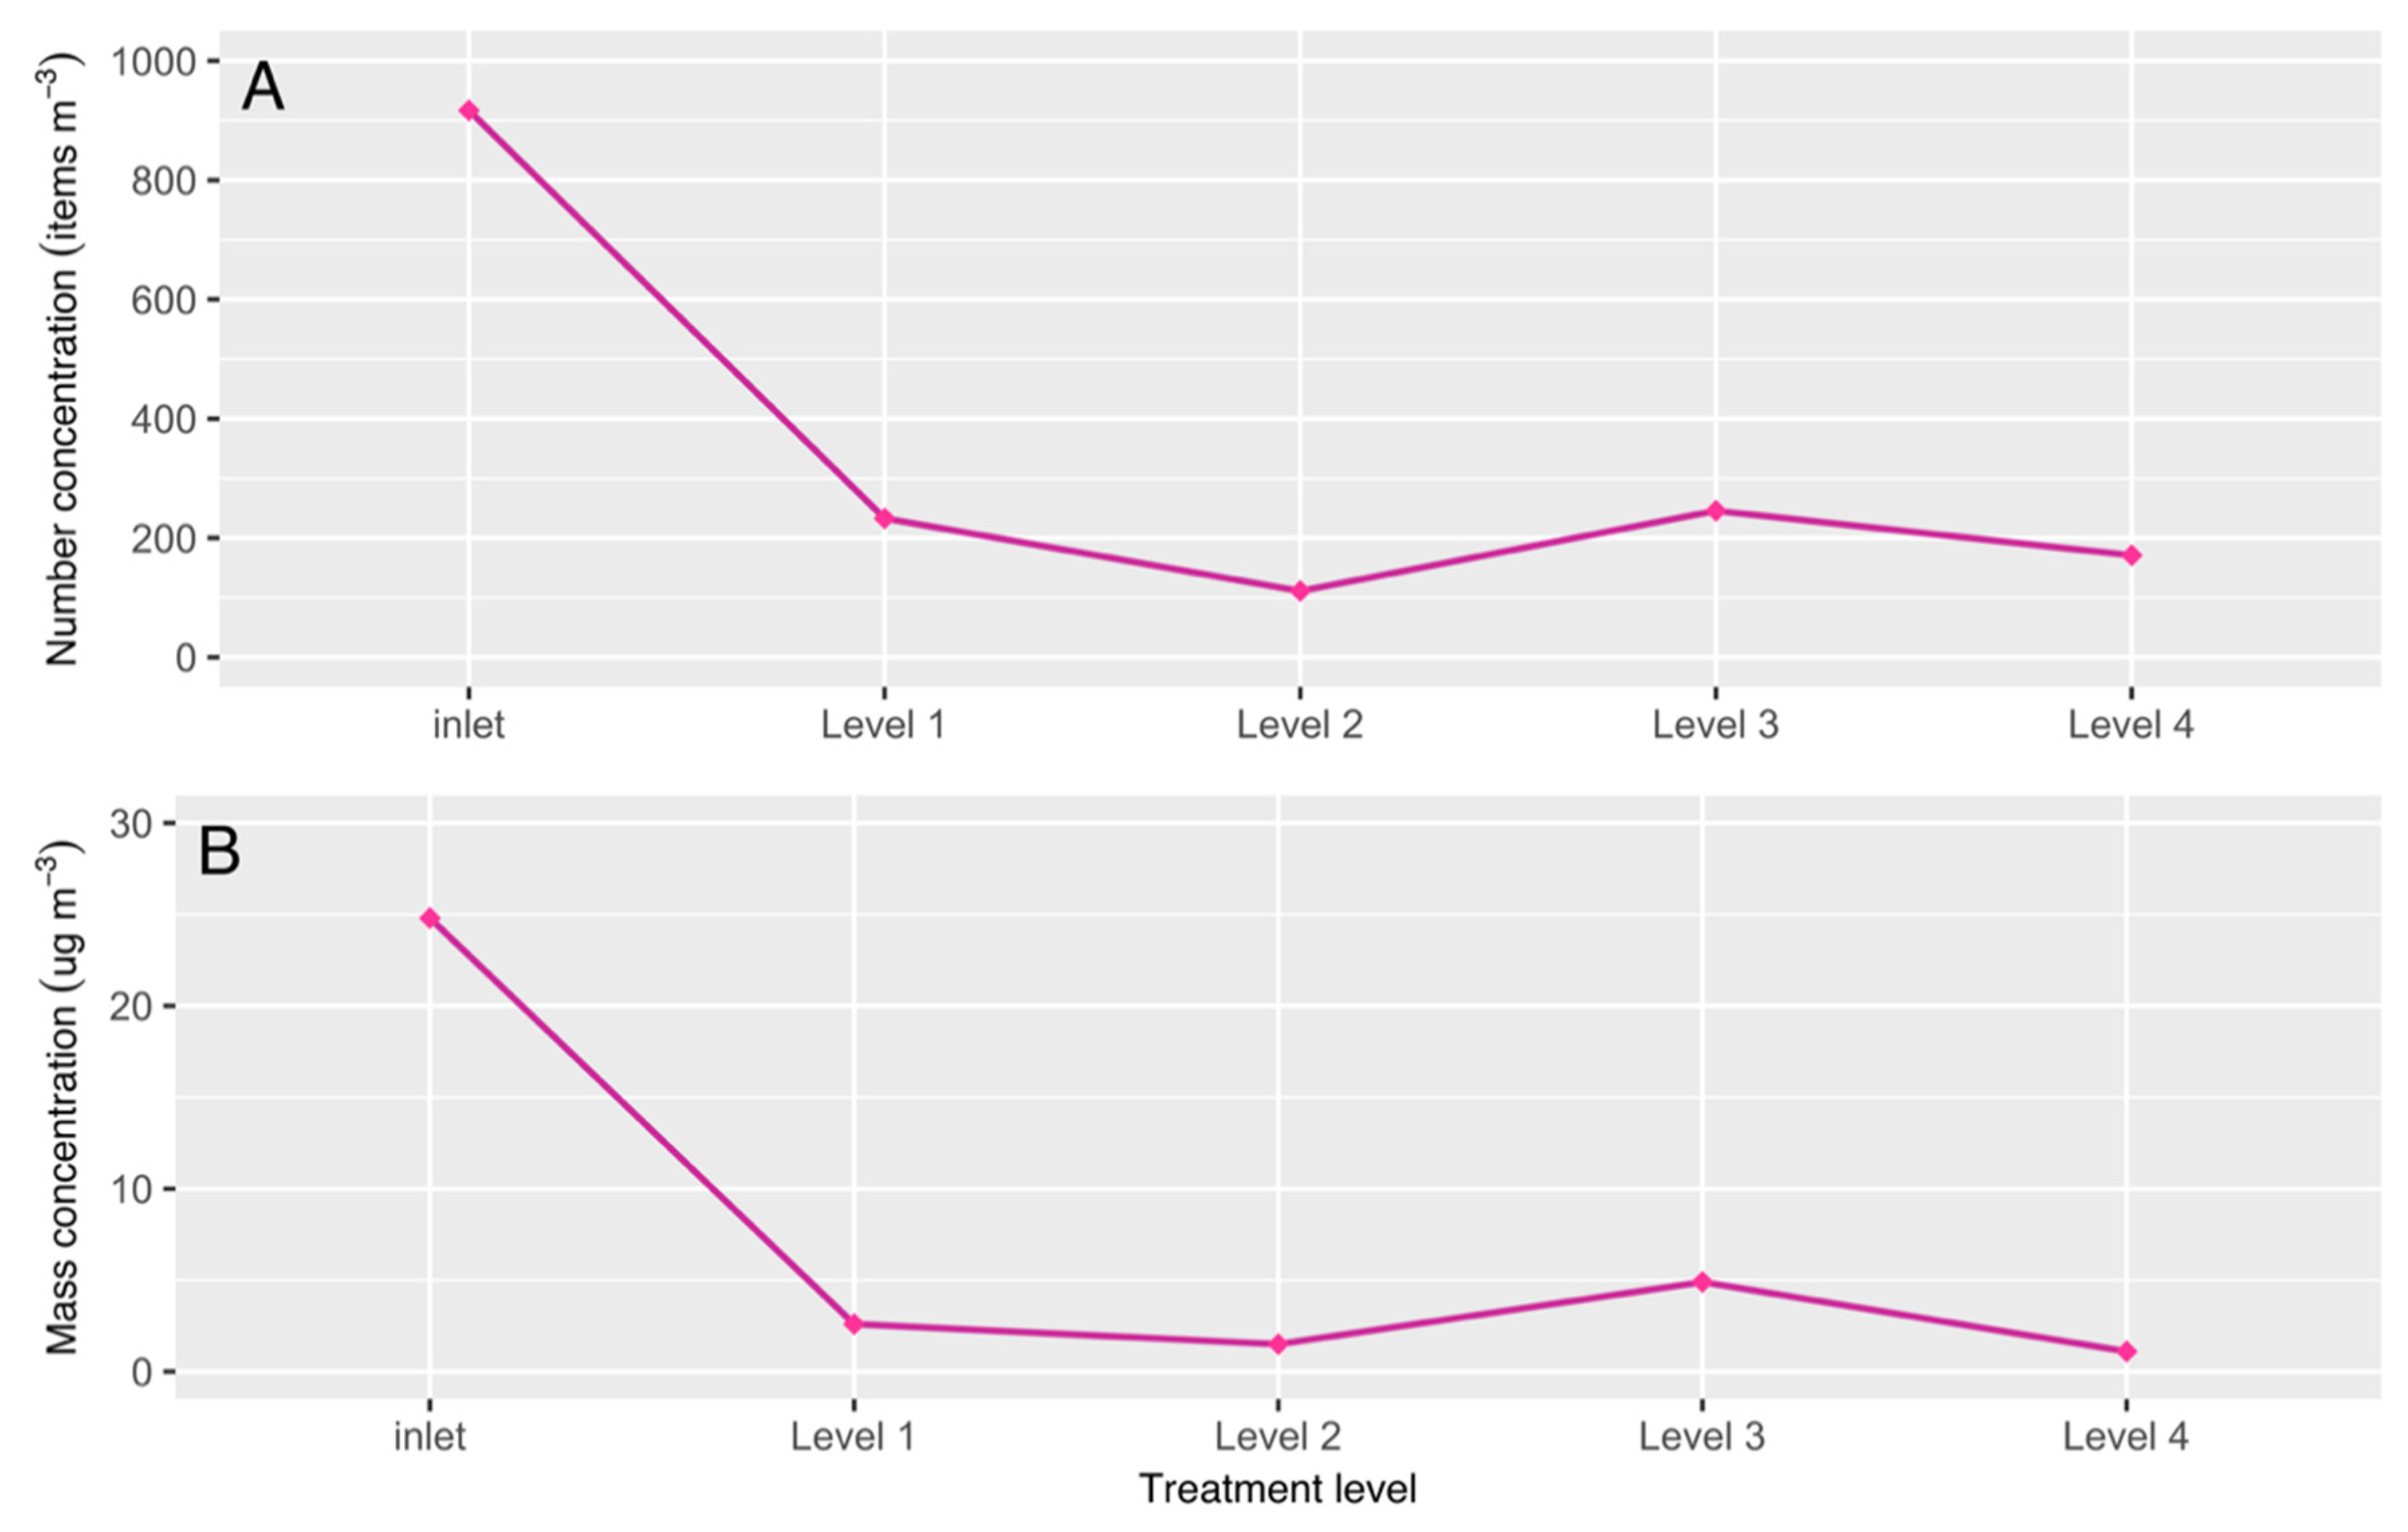
A total of 199 particles were identified as MP at the 5 sampling locations, of which the 84 were from the inlet to the biofilter (i.e., untreated effluents from the treatment plant) (Table S1). The MP concentration in the inlet and at each sampling level is shown as particle mass and particle number in Figure 2. In terms of MP items found, the concentrations were all well above the content found in the blanks. With respect to MP mass, however, only the inlet concentration was significantly above the blank values. In other words, the MPs identified in the samples were significantly smaller than those identified in the blanks. There was a clear tendency of decrease in the MP concentration from the inlet to the four sampled levels. Although there was a slight variation in concentration between the four levels inside the biofilter, no trend could be observed and the variation hence most likely caused by random variations in the MP content of the sampled water. One possible source of the variation is that the samples were taken in a sequential order over three days, and the MP concentrations hence likely to vary somewhat [24]. Another explanation is that the low plastic number identified in the samples may introduce higher uncertainties in the statistical analysis.
The highest MP abundance was found in the inlet (24.8 μg m−3 and 916.8 item m−3), and the lowest was at the second sampling level (1.5 μg m−3 and 111.1 item m−3, Table S1). When the removal efficiency was calculated for each sampling level individually, the highest efficiency was at level 2 in terms of particle number (87.9%) and level 4 in terms of particle mass (95.6%) (Table S1). When lumping the four levels and considering them as one, the removal efficiency was 78.5% for particle number and 88.9% for particle mass (Table S2). For the measured MP concentrations inside the filters it must though be kept in mind that the average contamination determined by the blanks was 4.4 item m−3 and 3.4 µg m−3. While the contamination in terms of MP items hence was far below what was measured, the same was not the case for the mass, and the latter results must hence be interpreted with caution, as must the derived removal efficiencies.
The top filtration layer of the biofilter was stone wool, a material which is made from heated basalt rock. Like other mineral wools, stone wool consists of fibers that are closely packed during manufacturing [32]. Stone wool has a high surface to volume ratio and can hence provide a large surface area for biofilm formation. The biofilm on the stone wool fibers can increase the capture area of the filter and reduce the in-between pore space, hereby increasing the potential capacity for retaining particles [33]. Besides, studies have shown that there also is a rapid development of microbial biofilms on the surface of plastic particles [33,34], meaning that the retained MP particles also can have developed biofilms, further increasing the possibility of capture by biofilm covered stone wool fibers.
The removal efficiency of the biofilters were comparable to what was found by Simon et al. [30] for disc filters polishing WWTP effluents. They found removal rates of 90% for particle numbers and 76% for particle mass. Talvitie et al. [29] tested four final-stage polishing techniques: Membrane bioreactor, disc filter, rapid sand filtration, and dissolved air floatation, for removal of MP from treated wastewater. There the membrane bioreactor achieved the highest efficiency (99.9%), closely followed by the rapid sand filter (97%), the dissolved air flotation (95%), and the disc filter (40–98.5%). A good performance of membrane bioreactors in removing MP from effluents was also observed by Lares et al. [35] and Lv et al. [36], with efficiencies of 99.4% and 99.5%, respectively.

3.3. Polymer Composition

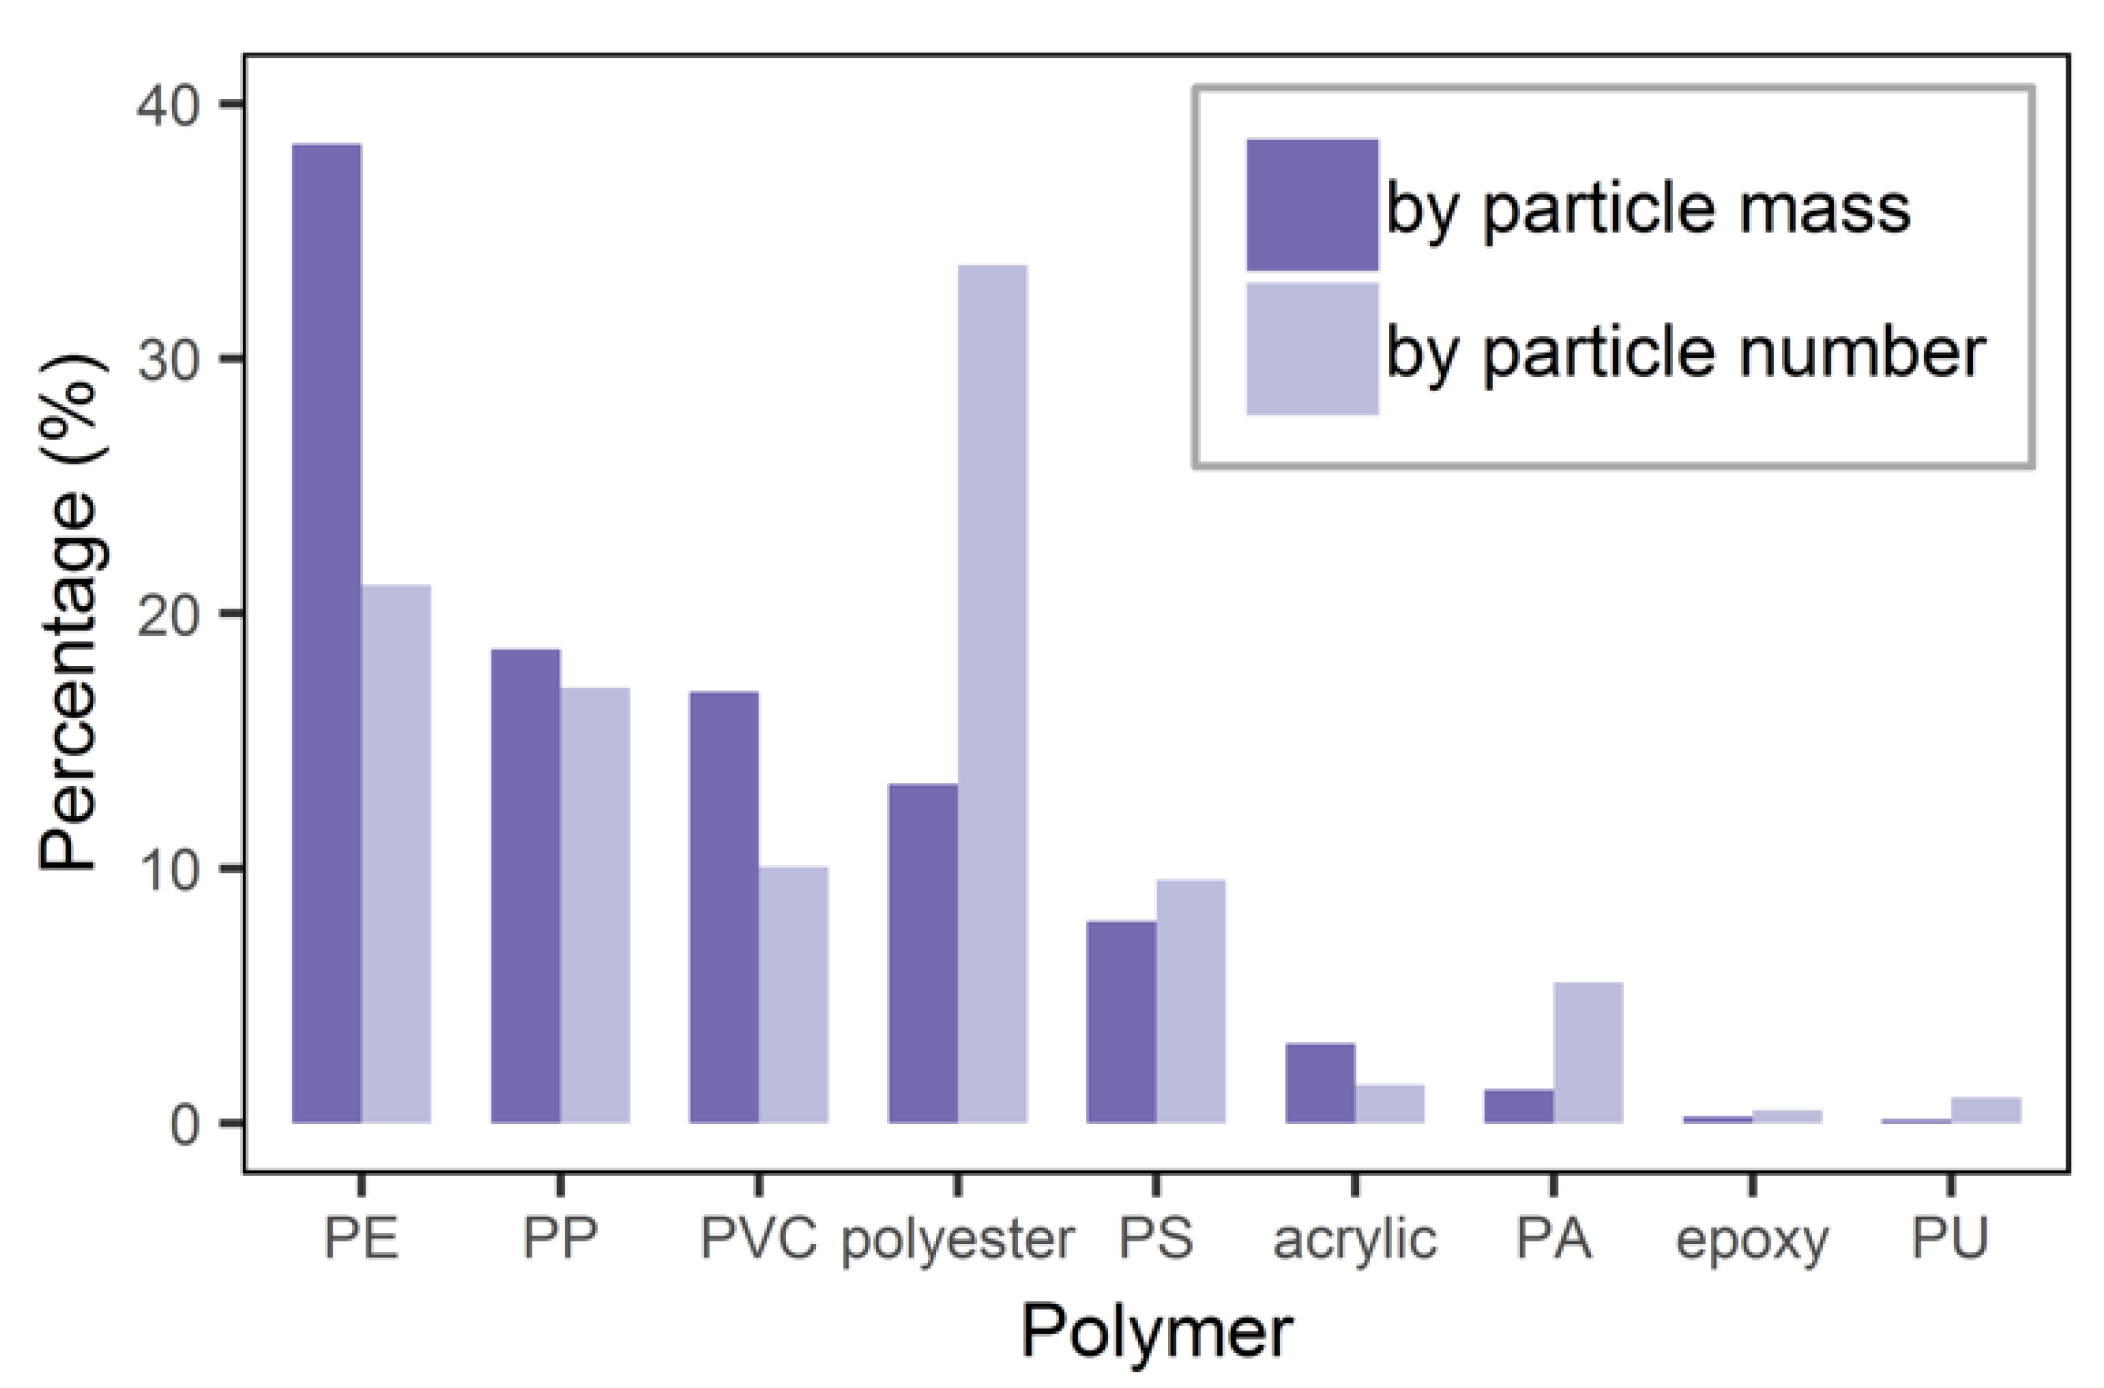
Of all the polymers identified, PE was most abundant in terms of particle mass (38%), followed by PP (polypropylene), PVC (polyvinyl chloride), polyester, PS, acrylic, and PA (polyamide). Polyester, on the other hand, dominated the particle numbers (34%) (Figure 3), followed by PE, PP, PVC, PS, PA, and acrylic. Epoxy and PU (polyurethane) were rare and below 1%, both when measured as particle mass and number.
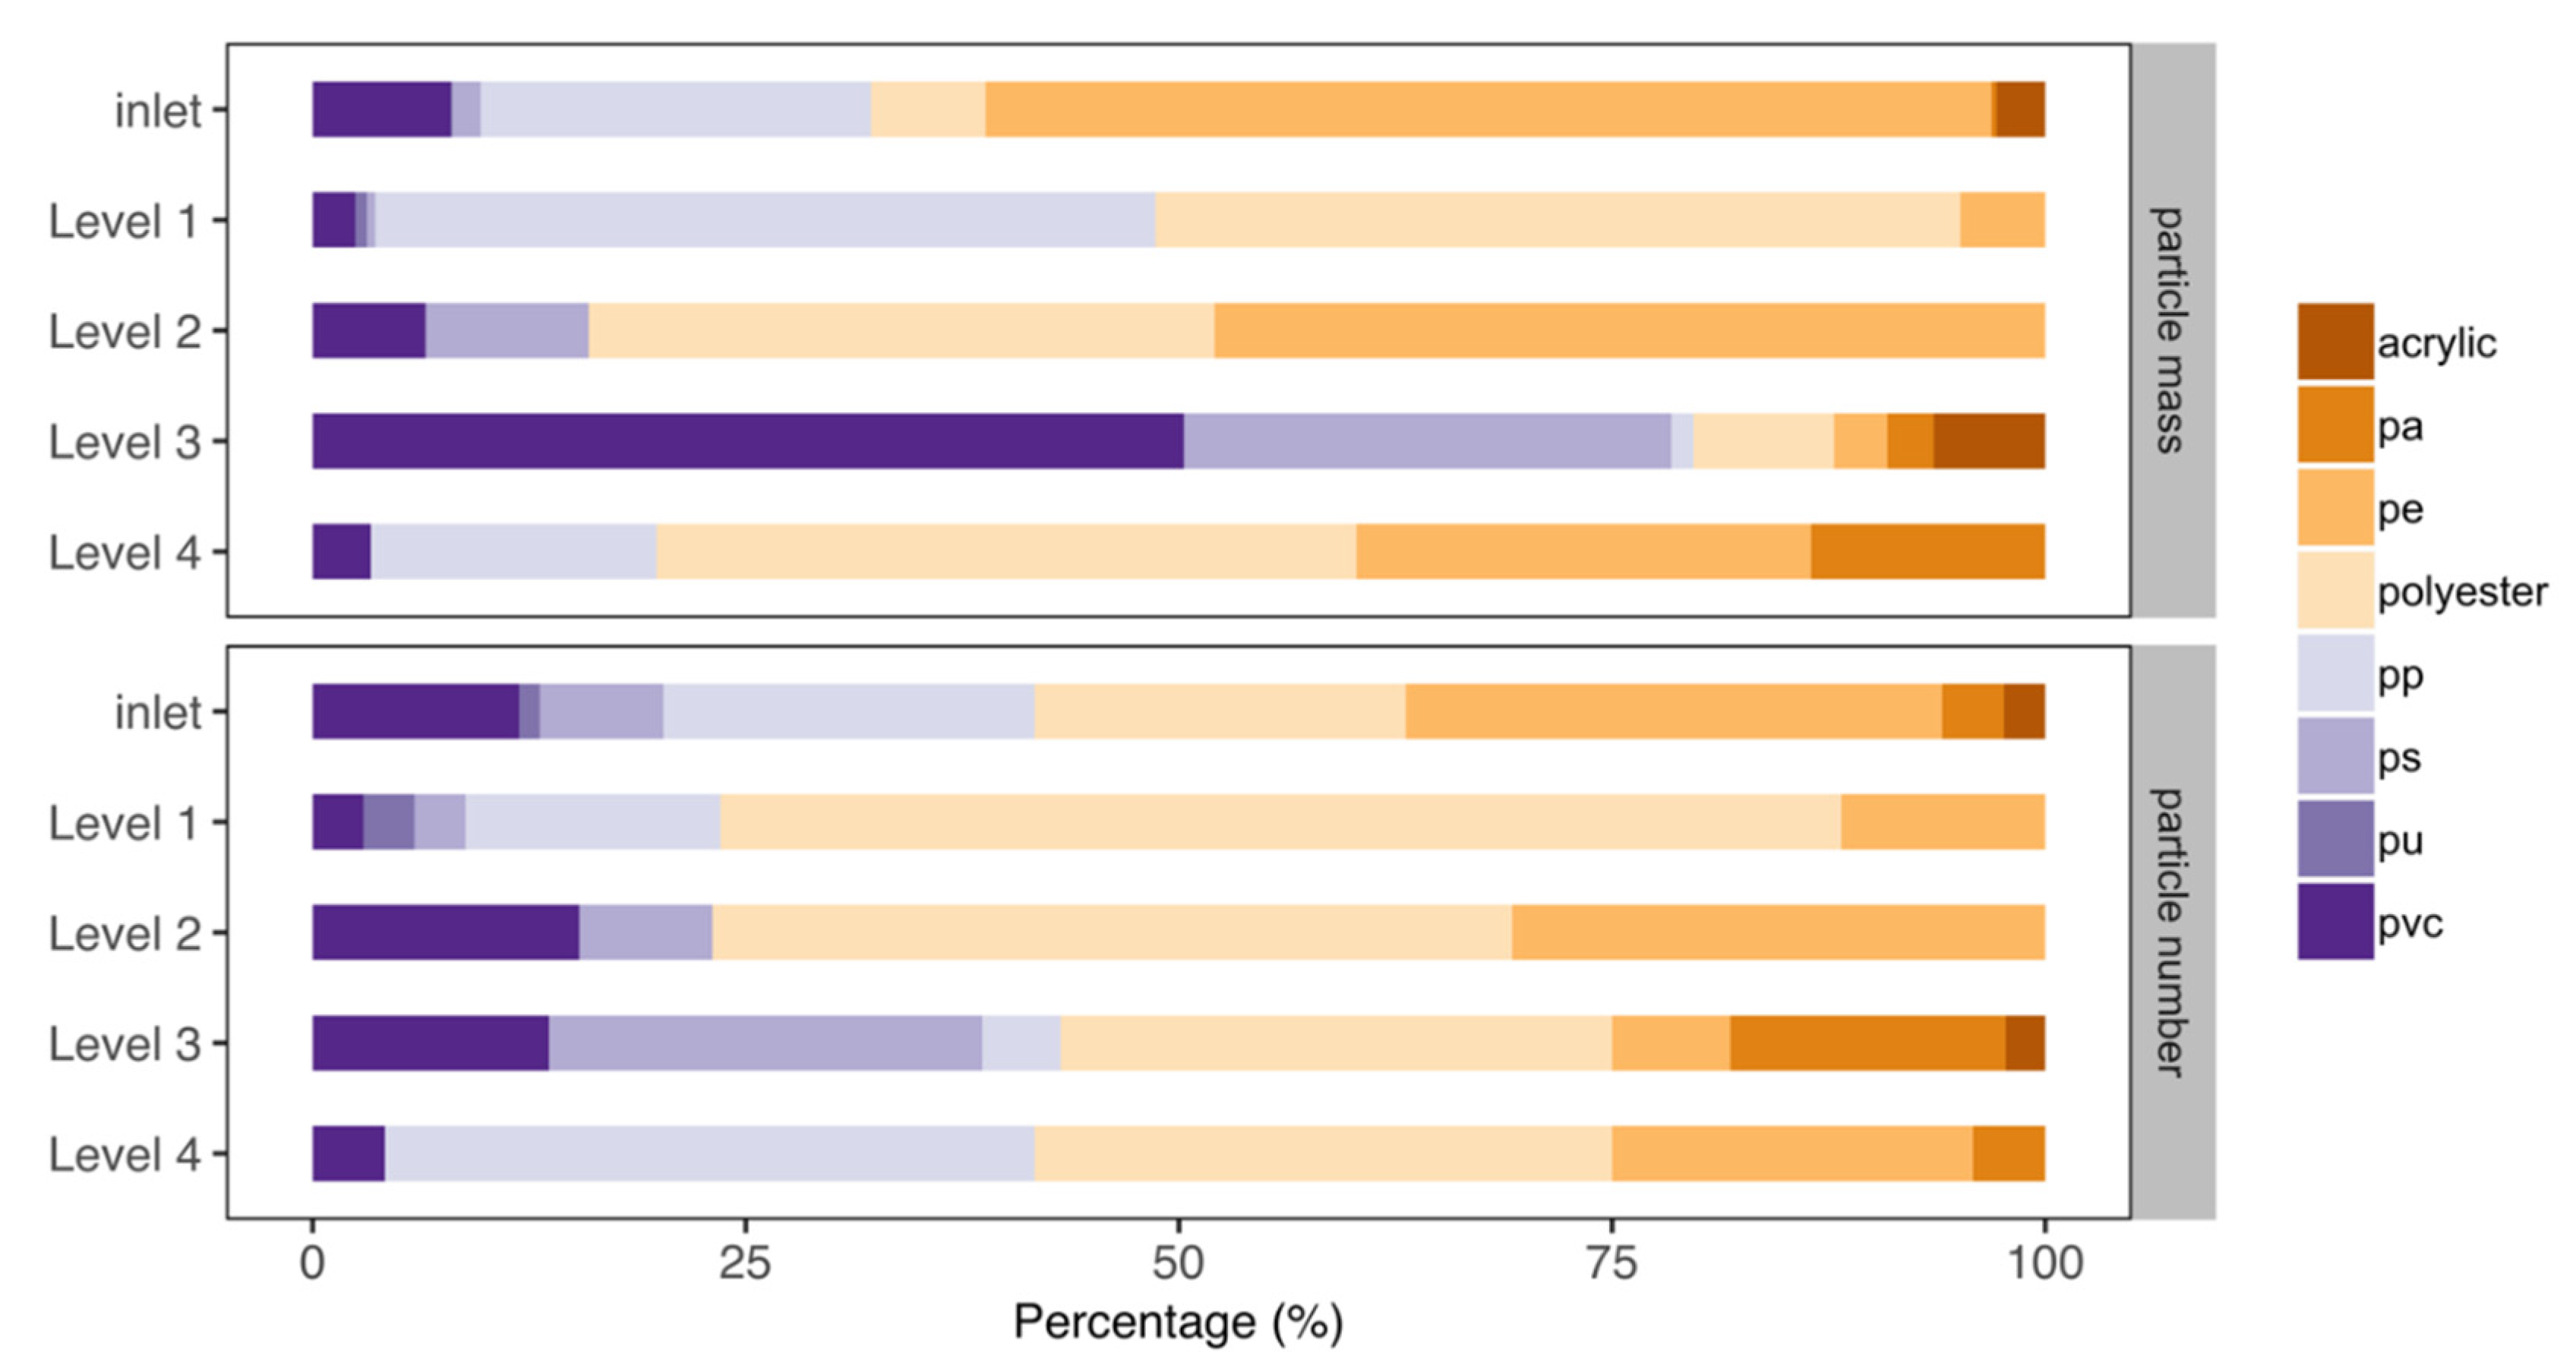
When looking at the polymer distribution between the inlet and the different sampling levels, no trend was observed for any identified polymer type (Figure 4). The main difference was that the inlet held a more diverse polymer composition. The reason here for might simply be that less particles were identified in the samples taken inside the filter than were identified in the inlet water, and that the statistical probability of encountering a rare polymer inside the filter hence was lower than for the inlet. PE, PP, and polyester were the most common polymer types, both in terms of particle number and mass (Figure 4). The high presence of these polymer types were also reported in other wastewater treatment plant effluents [35,36,37] and also in urban stormwater runoff [8,38]. This is not surprising, since these are the polymers in the most demand [39], and wastewater has been identified as an important vector to transport MP to the environment [23,26,37].
The distribution of MP in the water between the four filtration levels varied; however, with no specific trend in terms of the polymer distributions. Comparing the polymer type of the inlet and the effluents at the four sampling levels, less polymer types were detected at the bottom of the biofilter, level 4 (Figure 4). More specifically, PU, PS, and acrylic were all removed by the filter.

3.4. Particle Size and Mass

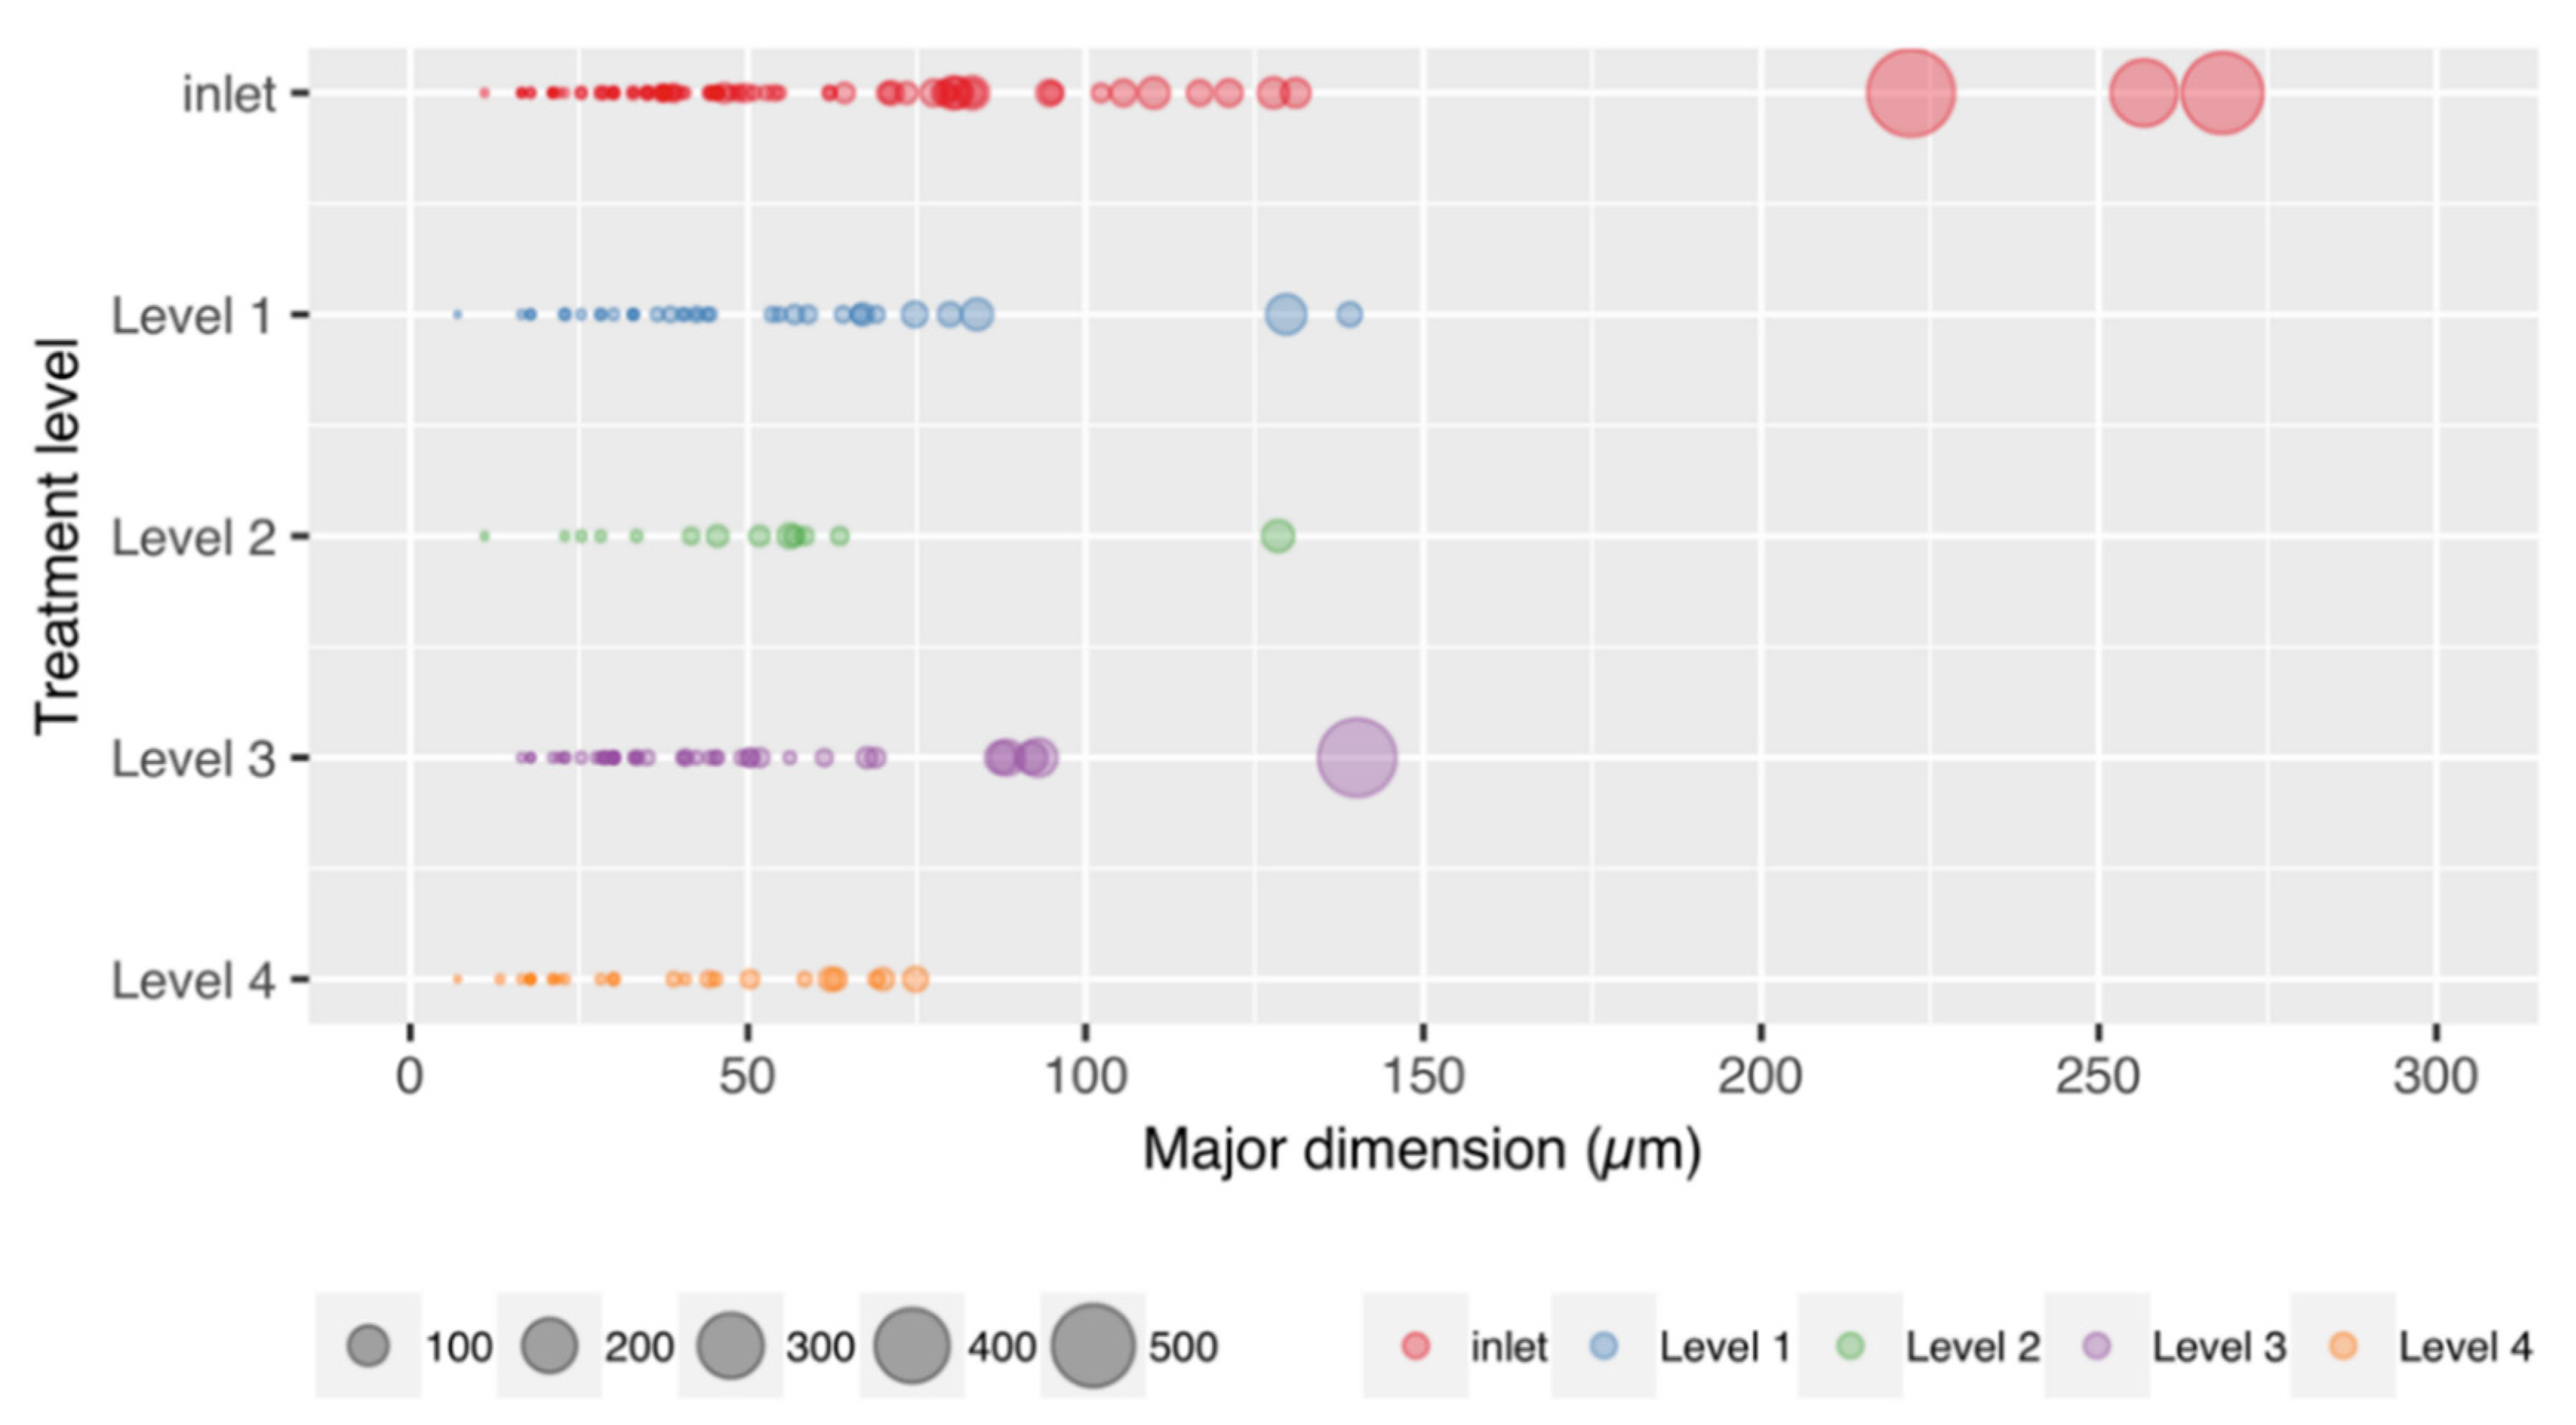
Among the identified polymers, acrylic had the largest median particle size, and PU had the smallest, while PS ranked in the middle (Table 1). Figure 5 shows the major dimension of each MP particle per sampling level, where the estimated mass is presented as the diameter of the circle. All the identified MPs were small-sized particles, with the major dimension below of 300 μm, and the minor below 100 μm. The absence of particles larger than 300 μm indicates that the conventional treatment of Avedøre wastewater treatment plant is efficient to remove large sized MPs, a finding which is in agreement with for example Talvitie et al. [24] and Magni et al. [37].
Despite the small sizes in general, there was still a tendency that larger-sized particles were retained by the filters, and the median value of particle size seemed to decrease with the depth into the biofilter (Figure 5, Table S1). It is expected that physical retainment is the removal mechanism of MP, since plastic biodegradation can be neglected within the hydraulic retention time of the system [2]. A similar conclusion was drawn by Talvitie et al. [29], where the discfilter and rapid sand filters achieved high MP removal applying physical separation. Carr et al. [23] found that biofilm formed on MP surfaces was able to change the physical properties of plastic particles, like their effective size. This could further enhance the physical retention by the biofilter.
Over 70% of particles larger than 100 μm were found in the inlet, (the untreated effluent of the treatment plant), while MP larger than 100 μm were absent after the final filtration step (Figure 5). Similarly, there was some indication of higher retainment of particles with higher mass, where the median value of estimated particle mass tended to decrease with the increase of treatment level (Figure 5). The above observations are though somewhat uncertain due to the low number of larger particles found, and might hence be due to natural statistical variability. Another factor contributing to the uncertainty is the likely day-to-day variation in MP concentrations in the effluent of the wastewater treatment plant, as reported by Talvitie et al. [29]. However, compared with other studies, the sampled volume in the present study was in general one order of magnitude higher [25,40,41], hence it is reasonable to assume that the impact from this type of variation was lower in this study.
The retention efficiencies between the four filtration levels were problematic to compare, partly because the variation caused by the sampling time could not be evaluated, and partly because of the statistical uncertainties involved in characterizing particulate pollutants. However, it was clear that most of the MP retention happened at the top of the biofilter and that MP of larger size and higher mass were more efficiently retained.

4. Conclusions

Wastewater effluents of nutrient removing treatment plants still contains MP, which potentially can have adverse impacts on the receiving environment. The studied biofilter, established as an advanced polishing step for treated wastewater, was able to reduce MP in wastewater treatment plant effluents by 79%–89%. The bulk of this removal occurred in the top of the biofilter, while the deeper layers yielded limited additional treatment efficiency. The biofilter was preferentially retaining large sized MP particles, and no particles larger than 100 μm were found in the final effluent from the filter. The biofilter was hence able to lower the MP abundance in the treated wastewater significantly, but did not ensure a complete retainment. Hence some MP will still become discharged to the environment, even after treatment in such polishing step.

Supplementary Materials

The following are available online at https://www.mdpi.com/2073-4441/12/4/1085/s1, Figure S1: Biofilm growth (photo taken from the top of the filter before the sampling); Table S1: MP concentration and removal efficiency for the inlet (raw effluent without passing through the biofilter and each filtration level); Table S2: MP concentration and removal efficiency when the four treatment levels are combined.

Author Contributions

Conceptualization, F.L., K.B. and J.V.; Data curation, F.L.; Formal analysis, F.L.; Funding acquisition, K.B. and J.V.; Investigation, F.L. and N.B.N.; Methodology, F.L. and N.B.N.; Project administration, K.B.; Resources, K.B. and J.V.; Software, F.L.; Supervision, J.V.; Validation, F.L.; Visualization, F.L.; Writing—original draft, F.L.; Writing—review and editing, F.L., N.B.N., K.B. and J.V. All authors have read and agreed to the published version of the manuscript.

Funding

The research was funded by the BONUS CleanWater project, granted by BONUS (Art 185), and funded jointly by the EU and Innovation Fund Denmark.

Conflicts of Interest

The authors declare no conflict of interest.

References

  1. Enders, K.; Lenz, R.; Stedmon, C.A.; Nielsen, T.G. Abundance, size and polymer composition of marine microplastics ≥10 μm in the Atlantic Ocean and their modelled vertical distribution. Mar. Pollut. Bull. 2015, 100, 70–81. [Google Scholar] [CrossRef]
  2. Horton, A.A.; Walton, A.; Spurgeon, D.J.; Lahive, E.; Svendsen, C. Microplastics in freshwater and terrestrial environments: Evaluating the current understanding to identify the knowledge gaps and future research priorities. Sci. Total Environ. 2017, 586, 127–141. [Google Scholar] [CrossRef] [Green Version]
  3. Strungaru, S.A.; Jijie, R.; Nicoara, M.; Plavan, G.; Faggio, C. Micro-(nano) plastics in freshwater ecosystems: Abundance, toxicological impact and quantification methodology. TrAC Trends Anal. Chem. 2019, 110, 116–128. [Google Scholar] [CrossRef]
  4. Arthur, C.; Baker, J.; Bamford, H. International research workshop on the occurrence, effects, and fate of microplastic marine debris. In Proceedings of the International Research Workshop on the Occurrence, Effects, and Fate of Microplastic Marine Debris, University of Washington Tacoma, Tacoma, WA, USA, 9–11 September 2008; Courtney, A., Joel, B., Holly, B., Eds.; National Oceanic and Atmospheric Administration: Silver Spring, MD, USA, 2009. [Google Scholar]
  5. Teuten, E.L.; Saquing, J.M.; Knappe, D.R.U.; Barlaz, M.A.; Jonsson, S.; Björn, A.; Rowland, S.J.; Thompson, R.C.; Galloway, T.S.; Yamashita, R.; et al. Transport and release of chemicals from plastics to the environment and to wildlife. Philos. Trans. R. Soc. B Biol. Sci. 2009, 364, 2027–2045. [Google Scholar] [CrossRef] [PubMed]
  6. Dris, R.; Gasperi, J.; Rocher, V.; Tassin, B. Synthetic and non-synthetic anthropogenic fibers in a river under the impact of Paris Megacity: Sampling methodological aspects and flux estimations. Sci. Total Environ. 2018, 618, 157–164. [Google Scholar] [CrossRef] [PubMed] [Green Version]
  7. Wang, J.; Peng, J.; Tan, Z.; Gao, Y.; Zhan, Z.; Chen, Q.; Cai, L. Microplastics in the surface sediments from the Beijiang River littoral zone: Composition, abundance, surface textures and interaction with heavy metals m-FTIR. Chemosphere 2017, 171, 248–258. [Google Scholar] [CrossRef]
  8. Liu, F.; Olesen, K.B.; Borregaard, A.R.; Vollertsen, J. Microplastics in urban and highway stormwater retention ponds. Sci. Total Environ. 2019, 671, 992–1000. [Google Scholar] [CrossRef]
  9. Scheurer, M.; Bigalke, M. Microplastics in Swiss Floodplain Soils. Environ. Sci. Technol. 2018, 52, 3591–3598. [Google Scholar] [CrossRef]
  10. Horton, A.A.; Svendsen, C.; Williams, R.J.; Spurgeon, D.J.; Lahive, E. Large microplastic particles in sediments of tributaries of the River Thames, UK—Abundance, sources and methods for effective quantification. Mar. Pollut. Bull. 2017, 114, 218–226. [Google Scholar] [CrossRef] [Green Version]
  11. Liu, F.; Vianello, A.; Vollertsen, J. Retention of microplastics in sediments of urban and highway stormwater retention ponds. Environ. Pollut. 2019, 255, 113335. [Google Scholar] [CrossRef]
  12. Vianello, A.; Jensen, R.L.; Liu, L.; Vollertsen, J. Simulating human exposure to indoor airborne microplastics using a Breathing Thermal Manikin. Sci. Rep. 2019, 9, 8670. [Google Scholar] [CrossRef] [PubMed]
  13. Lee, H.; Kunz, A.; Shim, W.J.; Walther, B.A. Microplastic contamination of table salts from Taiwan, including a global review. Sci. Rep. 2019, 9, 10145. [Google Scholar] [CrossRef]
  14. Allen, S.; Allen, D.; Phoenix, V.R.; Le Roux, G.; Durántez Jiménez, P.; Simonneau, A.; Binet, S.; Galop, D. Atmospheric transport and deposition of microplastics in a remote mountain catchment. Nat. Geosci. 2019, 12, 339–344. [Google Scholar] [CrossRef]
  15. Taylor, M.L.; Gwinnett, C.; Robinson, L.F.; Woodall, L.C. Plastic microfibre ingestion by deep-sea organisms. Sci. Rep. 2016, 6, 1–9. [Google Scholar] [CrossRef] [PubMed] [Green Version]
  16. Windsor, F.M.; Durance, I.; Horton, A.A.; Thompson, R.C.; Tyler, C.R.; Ormerod, S.J. A catchment-scale perspective of plastic pollution. Glob. Chang. Biol. 2019, 25, 1207–1221. [Google Scholar] [CrossRef] [PubMed] [Green Version]
  17. Savoca, S.; Capillo, G.; Mancuso, M.; Faggio, C.; Panarello, G.; Crupi, R.; Bonsignore, M.; DUrso, L.; Compagnini, G.; Neri, F.; et al. Detection of artificial cellulose microfibers in Boops boops from the northern coasts of Sicily (Central Mediterranean). Sci. Total Environ. 2019, 691, 455–465. [Google Scholar] [CrossRef] [PubMed]
  18. Valente, T.; Sbrana, A.; Scacco, U.; Jacomini, C.; Bianchi, J.; Palazzo, L.; de Lucia, G.A.; Silvestri, C.; Matiddi, M. Exploring microplastic ingestion by three deep-water elasmobranch species: A case study from the Tyrrhenian Sea. Environ. Pollut. 2019, 253, 342–350. [Google Scholar] [CrossRef]
  19. Panel, E.; Chain, F. Presence of microplastics and nanoplastics in food, with particular focus on seafood. EFSA J. 2016, 14, 6. [Google Scholar]
  20. Toussaint, B.; Raffael, B.; Angers-Loustau, A.; Gilliland, D.; Kestens, V.; Petrillo, M.; Rio-Echevarria, I.M.; Van den Eede, G. Review of micro- and nanoplastic contamination in the food chain. Food Addit. Contam. Part A 2019, 36, 639–673. [Google Scholar] [CrossRef]
  21. Jambeck, J.R.; Geyer, R.; Wilcox, C.; Siegler, T.R.; Perryman, M.; Andrady, A.; Narayan, R.; Law, K.L. Plastic waste inputs from land into the ocean. Science 2015, 347, 768–771. [Google Scholar] [CrossRef]
  22. Lebreton, L.C.M.; Van Der Zwet, J.; Damsteeg, J.W.; Slat, B.; Andrady, A.; Reisser, J. River plastic emissions to the world’s oceans. Nat. Commun. 2017, 8, 15611. [Google Scholar] [CrossRef] [PubMed]
  23. Carr, S.A.; Liu, J.; Tesoro, A.G. Transport and fate of microplastic particles in wastewater treatment plants. Water Res. 2016, 91, 174–182. [Google Scholar] [CrossRef] [PubMed]
  24. Talvitie, J.; Mikola, A.; Setälä, O.; Heinonen, M.; Koistinen, A. How well is microlitter purified from wastewater?—A detailed study on the stepwise removal of microlitter in a tertiary level wastewater treatment plant. Water Res. 2017, 109, 164–172. [Google Scholar] [CrossRef] [PubMed] [Green Version]
  25. Simon, M.; Van Alst, N.; Vollertsen, J. Quantification of microplastic mass and removal rates at wastewater treatment plants applying Focal Plane Array (FPA)-based Fourier Transform Infrared (FT-IR) imaging. Water Res. 2018, 142, 1–9. [Google Scholar] [CrossRef] [PubMed]
  26. Sun, J.; Dai, X.; Wang, Q.; van Loosdrecht, M.C.M.; Ni, B.J. Microplastics in wastewater treatment plants: Detection, occurrence and removal. Water Res. 2019, 152, 21–37. [Google Scholar] [CrossRef] [PubMed]
  27. Mason, S.A.; Garneau, D.; Sutto, R.; Chu, Y.; Ehmann, K.; Barnes, J.; Fink, P.; Papazissimos, D.; Rogers, D.L. Microplastic pollution is widely detected in US municipal wastewater treatment plant effluent. Environ. Pollut. 2016, 218, 1045–1054. [Google Scholar] [CrossRef]
  28. Gatidou, G.; Arvaniti, O.S.; Stasinakis, A.S. Review on the occurrence and fate of microplastics in Sewage Treatment Plants. J. Hazard. Mater. 2019, 367, 504–512. [Google Scholar] [CrossRef]
  29. Talvitie, J.; Mikola, A.; Koistinen, A.; Setälä, O. Solutions to microplastic pollution—Removal of microplastics from wastewater effluent with advanced wastewater treatment technologies. Water Res. 2017, 123, 401–407. [Google Scholar] [CrossRef] [Green Version]
  30. Simon, M.; Vianello, A.; Vollertsen, J. Removal of >10 µm microplastic particles from treated wastewater by a disc filter. Water 2019, 11, 1935. [Google Scholar] [CrossRef] [Green Version]
  31. Zhanga, L.; Carvalho, P.N.; Bollmann, U.E.; EI-taliawy, H.; Brix, H.; Bester, K. Enhanced removal of pharmaceuticals in a biofilter: Effects of manipulating co-degradation by carbon feeding. Chemosphere 2019, 236, 124303. [Google Scholar] [CrossRef]
  32. Chapelle, L. Characterization and Modelling of the Mechanical Properties of Mineral Wool. Ph.D. Thesis, Technitical University of Denmark, Kongens Lyngby, Denmark, 2016. [Google Scholar]
  33. Lobelle, D.; Cunliffe, M. Early microbial biofilm formation on marine plastic debris. Mar. Pollut. Bull. 2011, 62, 197–200. [Google Scholar] [CrossRef] [PubMed]
  34. Miao, L.; Wang, P.; Hou, J.; Yao, Y.; Liu, Z.; Liu, S.; Li, T. Distinct community structure and microbial functions of biofilms colonizing microplastics. Sci. Total Environ. 2019, 650, 2395–2402. [Google Scholar] [CrossRef] [PubMed]
  35. Lares, M.; Ncibi, M.C.; Sillanpää, M.; Sillanpää, M. Occurrence, identification and removal of microplastic particles and fibers in conventional activated sludge process and advanced MBR technology. Water Res. 2018, 133, 236–246. [Google Scholar] [CrossRef] [PubMed]
  36. Lv, X.; Dong, Q.; Zuo, Z.; Liu, Y.; Huang, X.; Wu, W.M. Microplastics in a municipal wastewater treatment plant: Fate, dynamic distribution, removal efficiencies, and control strategies. J. Clean. Prod. 2019, 225, 579–586. [Google Scholar] [CrossRef]
  37. Magni, S.; Binelli, A.; Pittura, L.; Avio, C.G.; Della, T.C.; Parenti, C.C.; Gorbi, S.; Regoli, F. The fate of microplastics in an Italian Wastewater Treatment Plant. Sci. Total Environ. 2019, 652, 602–610. [Google Scholar] [CrossRef]
  38. Wagner, S.; Klöckner, P.; Stier, B.; Römer, M.; Seiwert, B.; Reemtsma, T.; Schmidt, C. Relationship between discharge and river plastics concentrations in a rural and an urban catchment. Environ. Sci. Technol. 2019, 53, 10082–10091. [Google Scholar] [CrossRef]
  39. PlasticsEurope. Plastics—The Facts; Association of Plastics Manufacturers: Brussels, Belgium, 2017. [Google Scholar]
  40. Yang, L.; Li, K.; Cui, S.; Kang, Y.; An, L.; Lei, K. Removal of microplastics in municipal sewage from China’s largest water reclamation plant. Water Res. 2019, 155, 175–181. [Google Scholar] [CrossRef]
  41. Wolff, S.; Kerpen, J.; Prediger, J.; Barkmann, L.; Müller, L. Determination of the microplastics emission in the effluent of a municipal waste water treatment plant using Raman microspectroscopy. Water Res. X 2019, 2, 100014. [Google Scholar] [CrossRef]
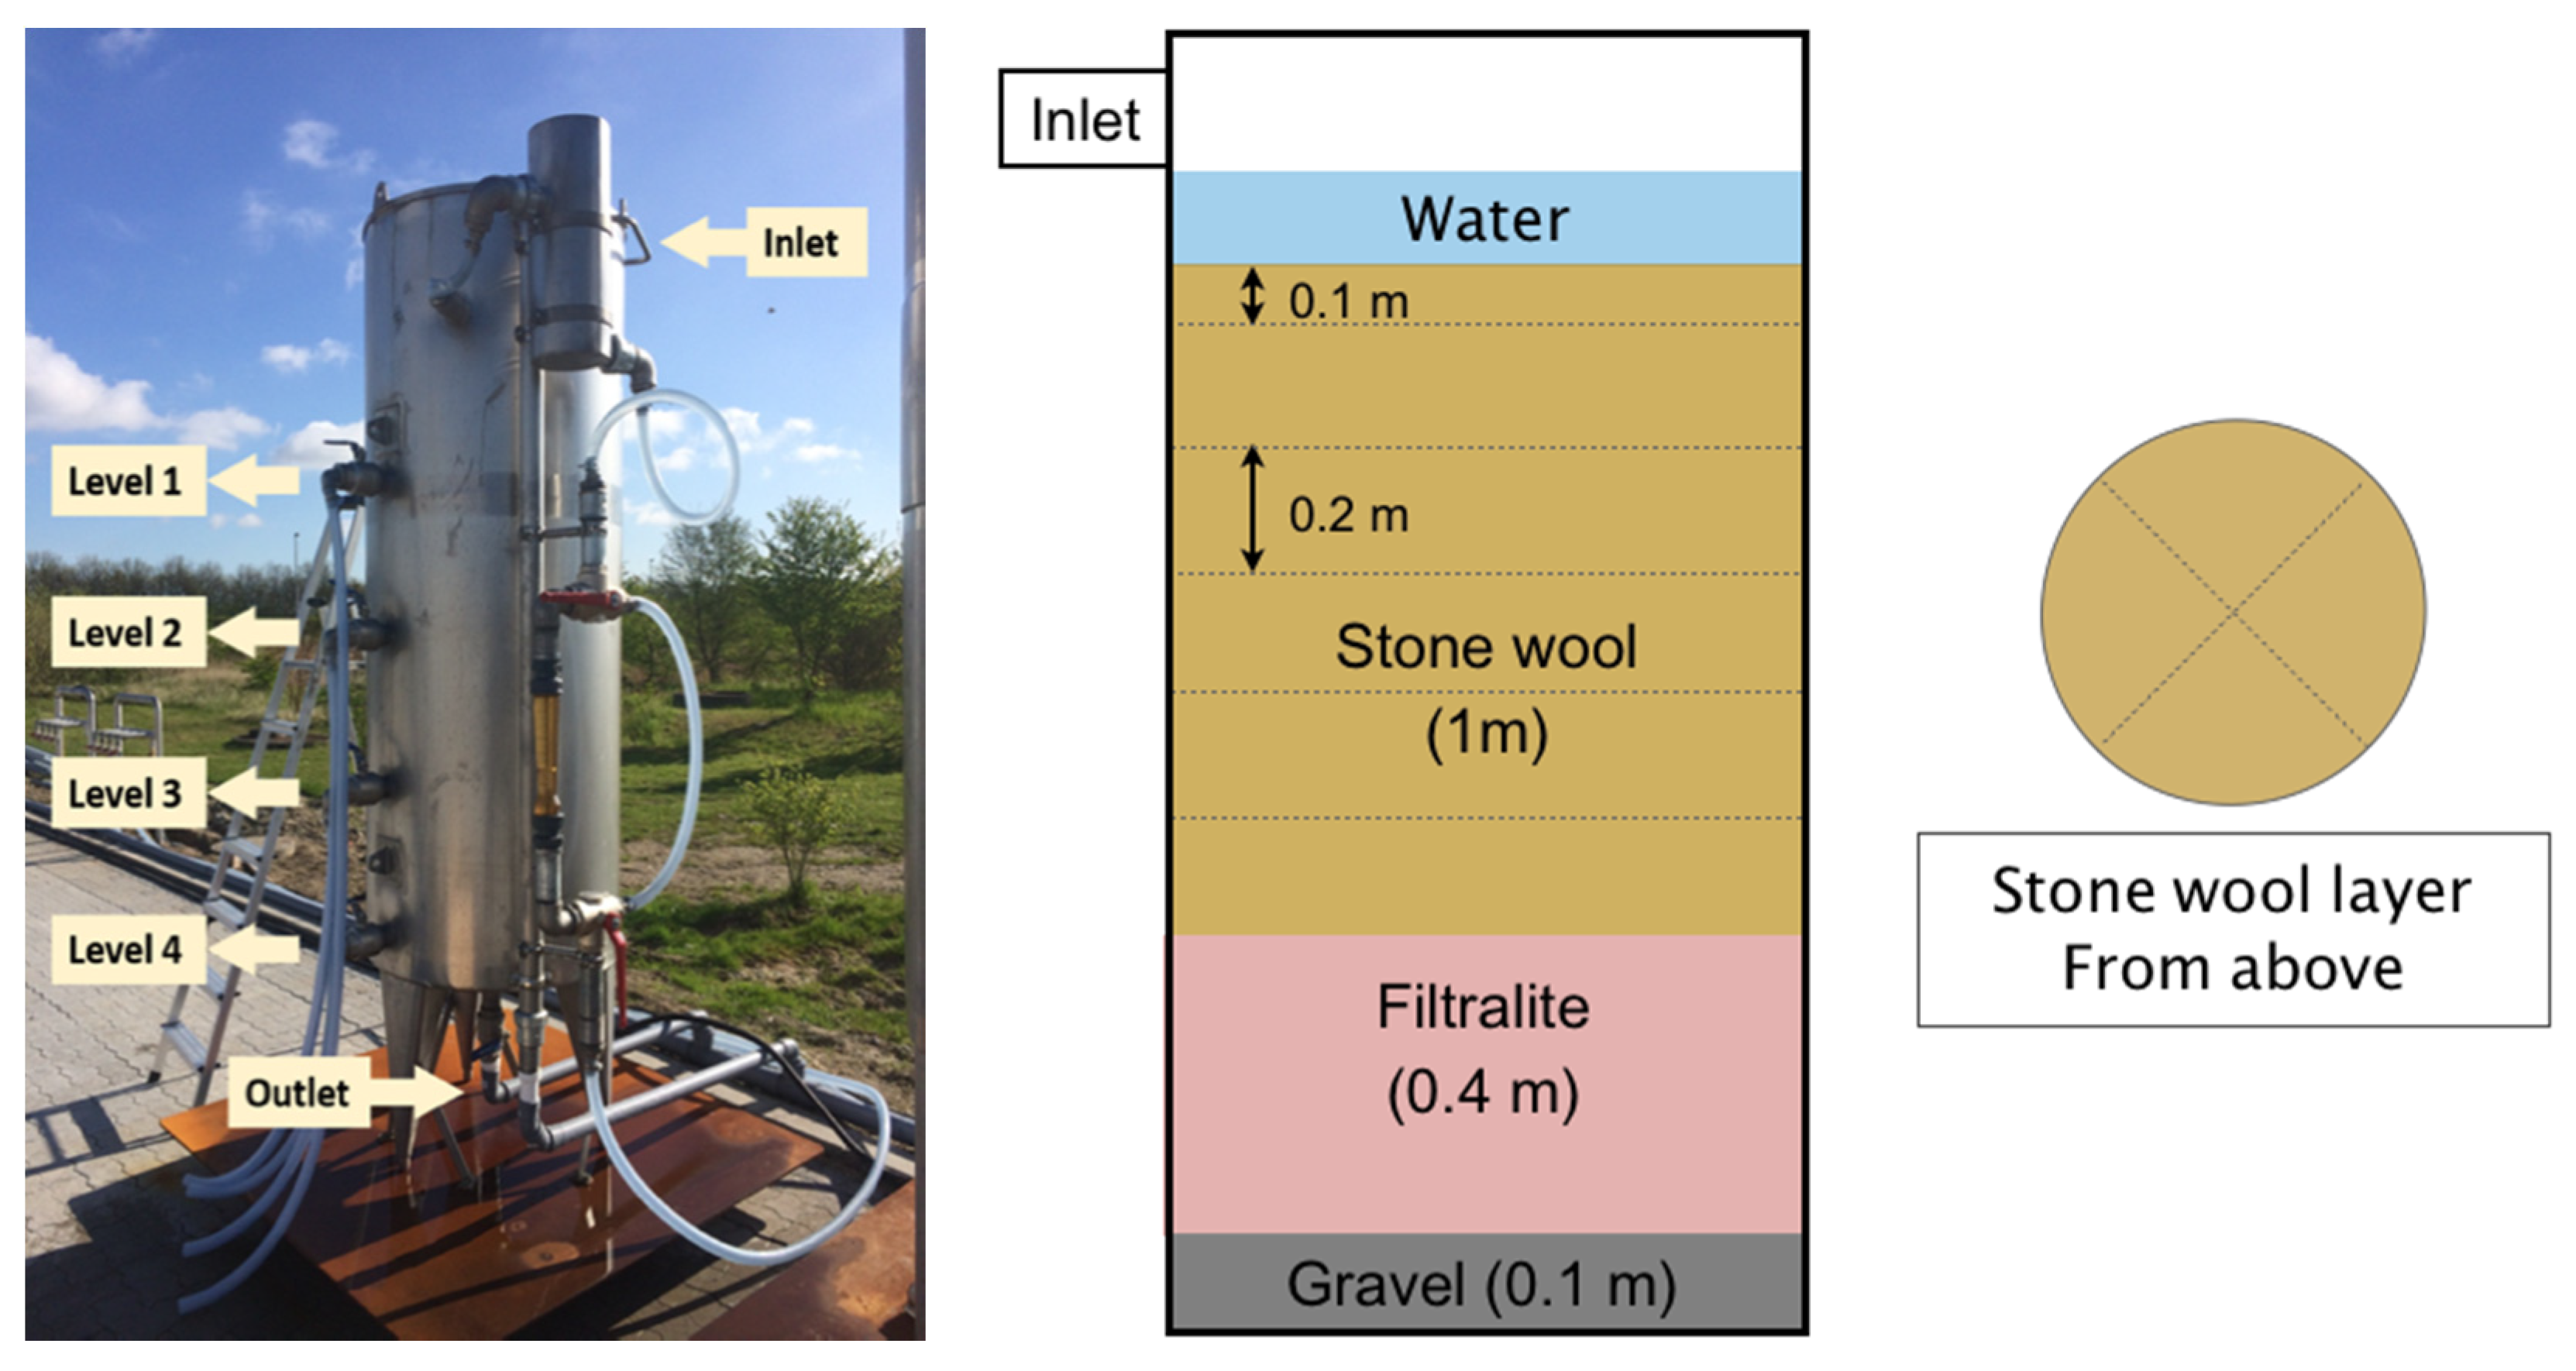
Figure 1. Overview of the biofilter. The effluent water from the treatment plant entered at the top (inlet), and was discharged at the bottom (outlet).
Water 12 01085 g001
Figure 2. Microplastic (MP) number concentration (A) and mass concentration (B) of inlet and four filtration levels.
Water 12 01085 g002
Figure 3. Polymer composition of the polymers detected in terms of the relative MP mass and MP number concentrations.
Water 12 01085 g003
Figure 4. Polymer distribution between the inlet and four filtration levels.
Water 12 01085 g004
Figure 5. The major dimension of MP particles versus their minor dimension. The size of the data points represents the estimated mass of the particle.
Water 12 01085 g005
Table 1. Median value of measured major dimension, estimated mass, and identified number of particles, in each polymer group. Sum of all particles identified excl. blanks.
PolymerMedian Major Dimension (µm)Median Estimated Particle Mass (ng)Identified Particle Number (Item)
Acrylic80.357.53
polyethylene (PE)47.96.742
epoxy40.79.71
polypropylene (PP)39.82.634
polystyrene (PS)37.64.419
polyester37.64.167
polyvinyl chloride (PVC)34.12.120
polyamide (PA)33.01.811
polyurethane (PU)29.12.52