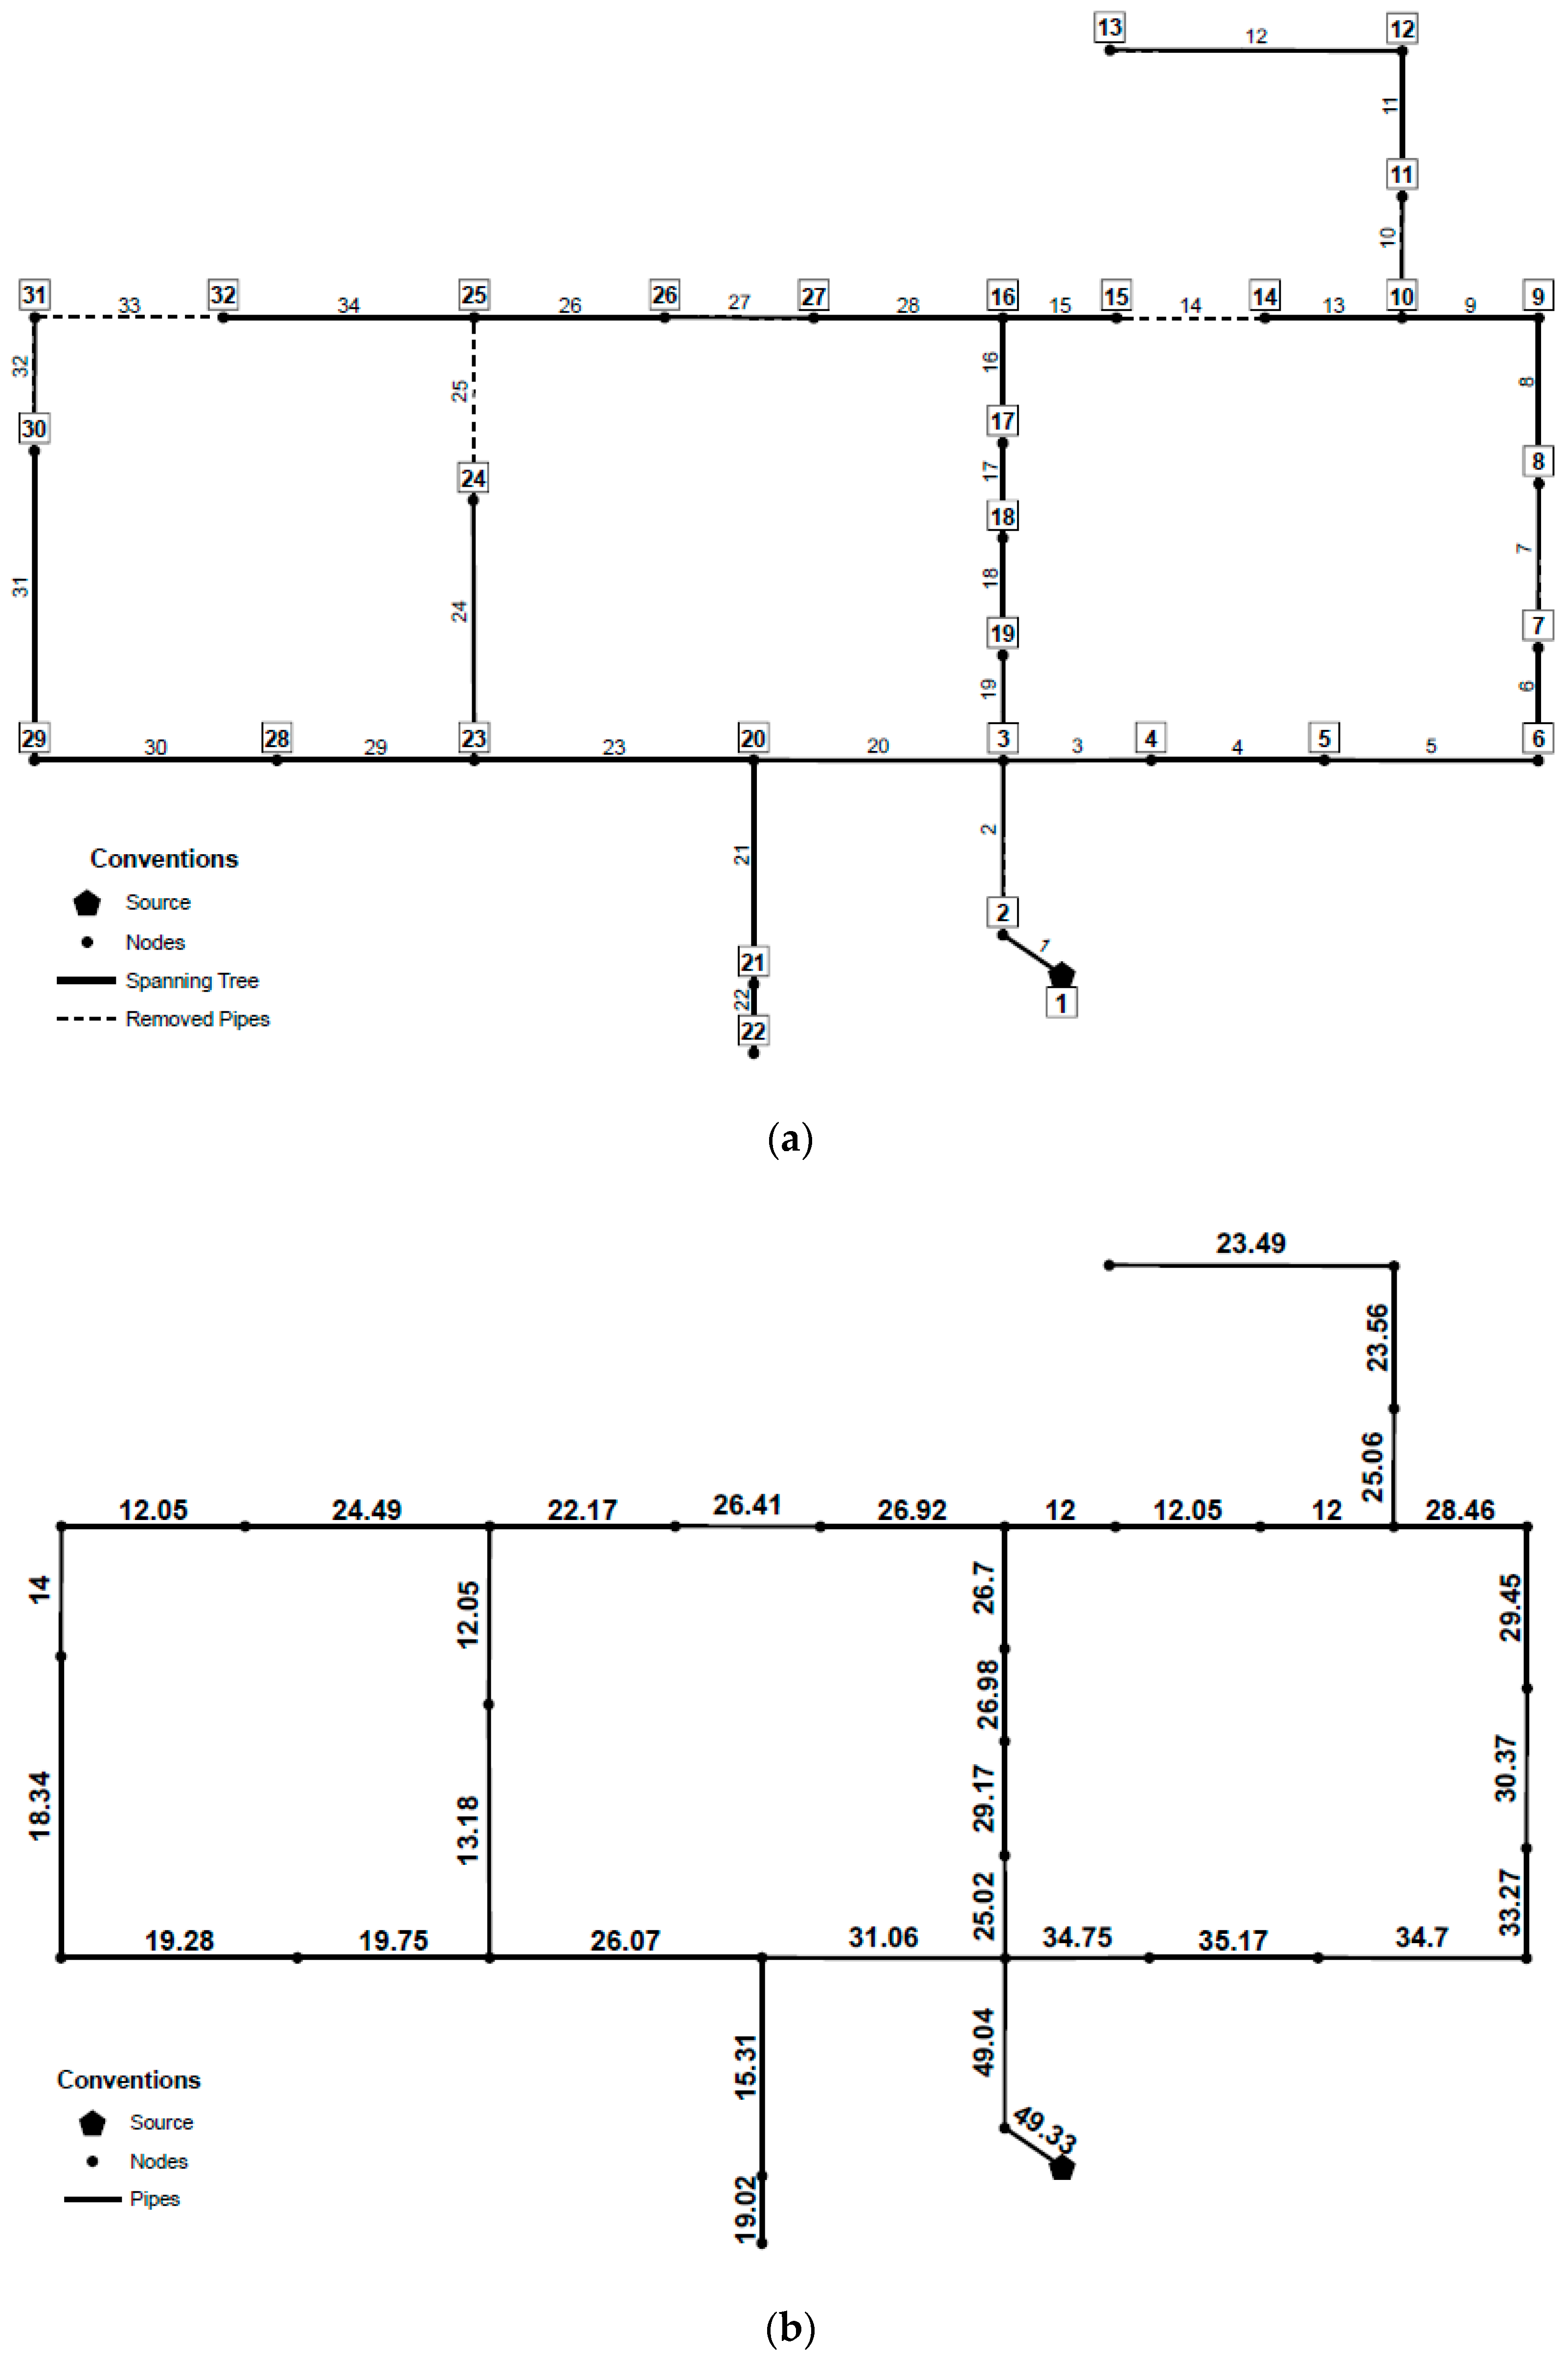
3.1. Sump Search or Spannin Tree Structure
The sump search, or the identification of the Spanning Tree structure, is based on two hydraulic principles: (1) In a least-cost WDS, the demand at the nodes should be supplied by transporting the water from the sources using a single route, and (2) As the pipes flow rates for design purposes increase, the marginal costs diminish.
For the first principle, it can be stated that redundancy is hydraulically inefficient, despite its benefits in terms of reliability. As a result, branched WDSs can manage to be less expensive compared to looped networks; thus, this step aims to decompose the looped system into an open tree-like structure. This leads to the identification of nodes in the original network that can be considered as sumps of a fictional branched network, meaning the nodes with the lowest hydraulic head among all its neighbors.
The second principle is based in the analysis of the relationship between the pipe diameter and its cost per length unit. A typical equation to represent the constructive cost of a pipe is given by Equation (2):
where,
is the cost of pipe
;
is the coefficient of the cost function;
is the length of pipe
;
is the diameter assigned to pipe
; and
is the exponent of the cost function [
21]. On the other hand, Hazen-Williams friction head losses equation relates to pipe diameters, friction head losses and flowrates as shown in Equation (3):
where,
is the head-loss along pipe
(m),
represents the volumetric flowrate on pipe
(
and
is the pipe roughness coefficient (dimensionless). Therefore, by solving Equation (3) for
and then replacing it in Equation (2), an expression for the cost of the pipe as a function of
is obtained, as shown in Equation (4):
where,
; and
is the friction slope for pipe
defined by
.
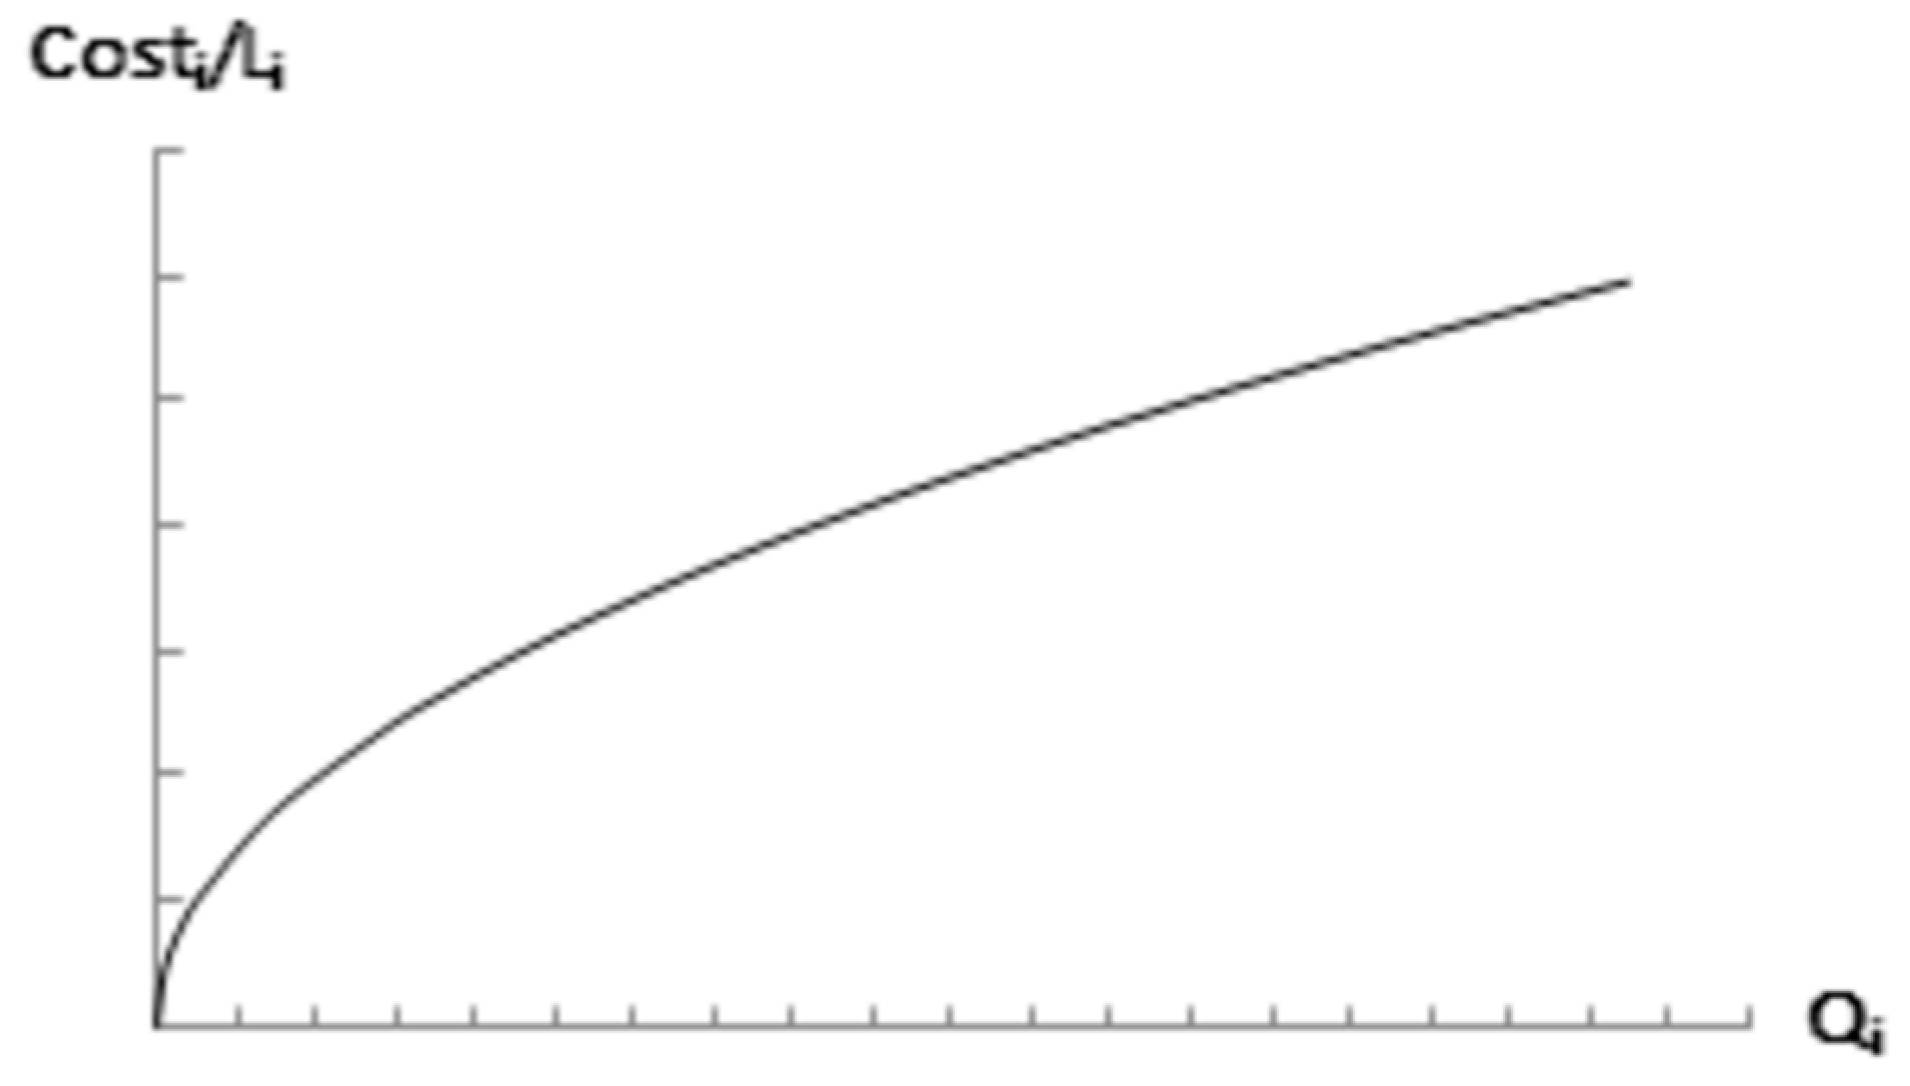
Figure 3 shows the trend of this new expression, where it is shown that for typical values of
(lower than 2.63), the marginal cost decreases as the design flowrate of a pipe increases.
Considering that WDS are represented as a set of junctions and links, the problem of obtaining a tree-like structure for the WDS is similar to the problem of finding a Minimum Spanning Tree (MST) for a weighted undirected graph. In this problem, the vertices of the graph are the nodes of the WDS, while the edges of the graph are the pipes (links) in the WDS. Prim [
27] proposed an algorithm to find the MST that minimizes the sum of link lengths. For the OPUS methodology, Prim’s Algorithm can be modified to maximize a recursively updated Benefit-Cost (
) value for every link in the minimum spanning tree. This is equivalent to finding the MST for a graph weighted with the
values, but with the
values updated at each iteration of Prim’s Algorithm.
The spanning tree is initialized at the water source and grows by incorporating nodes from the selection front (set of adjacent nodes that are not yet connected to the spanning tree), ensuring the connection performed reaches the highest value possible among its set. This procedure is repeated until every node (demand and not demand nodes) in the network is connected to the tree.
If there is more than one water source in the network, there will be the same number of trees as sources in the system, since there should exist only one route to supply each node in the spanning tree structure. In that case, a tree will be initialized per water source, and the selection front will include any node not yet connected to a tree but adjacent to one.
The
function of adding a pipe-node pair
in the selection front, is calculated as the ratio between the demand of the node added to the tree and the marginal cost associated with its connection to the source [
26], as shown in Equation (5). This marginal cost is computed as the sum of the total cost of the pipe
and the cost difference related to the transportation of the additional flow through all of the upstream pipes [
28].
where,
is the Benefit–Cost value of adding the attached pipe-node pair
.
is the flow demand of node
, which is the additional flow conveyed through the network, if pair
was added to the tree.
is the flow that goes through pipe
of the tree before inserting any adjacent pipe-node pairs. The first term in the denominator of Equation (5) stands for the cost of the new included pipe, while the sum corresponds to the marginal cost upstream [
26]. This expression is computed using Equation (4) as the function
.
Given Pescara [
29], the Italian WDS benchmark shown in
Figure 4a, the sump search procedure will be developed as follows: Starting from the three sources (identified as 15, 43 and 65), each selection front is analyzed. In other words, the possible link-node pairs that can be added to Reservoir 65 are <90,76> (i.e., junction 90 and link 76) and <6,89>. Respectively, the link-node pairs <42,54> and <14,11> could be added to sources 43 and 15. To decide which source will be the root of the first tree, and consequently, which link–node pair will be added initially to the tree, the
value is computed for each link–node pair, selecting the one that maximizes this criterion. This procedure is repeated until every node is connected to a tree. In
Figure 4b, the minimum cost-spanning tree is shown for Pescara WDS, where each link maximized the
value at each selection front. Dashed links are those who were not included in the spanning tree, but are present in the original WDS.
In particular, it must be noted that as the Pescara network is supplied by three different sources, it is expected that this tree-structure identification step will reach three different branched sub-systems, each one fed by a unique source. In general terms, for systems with n sources, the nodes in the original network will be grouped into a maximum number of n different tree structures. This is accomplished by seeking to maximize the relationship and ensuring that every node in the original network is assigned to a tree, except for the reservoirs that can be isolated given their relationship. Hence, for further steps in this methodology, the obtained trees are considered simultaneously.
Moreover, the values involved in this step are not actual costs, but values obtained proportionally from the relation presented in
Figure 3. Configuring the tree using this cost-benefit function has an O(NN
2) time complexity, where NN is the number of nodes. At the end, the status of the last nodes in each branch is set to ‘sumps’, which will be useful for the rest of the methodology [
28].
3.2. Optimal Power Use Surface (OPUS)
The entire methodology is named after this specific step due to the close relation with the work developed by Wu [
21]. This step consists of assigning a target
HGL to each node in the network, which determines the head-losses for each pipe in advance [
26].
In the proposed algorithm, the OPUS is computed using the tree structure, described in the previous section. Here, the Wu [
21] concept of target
HGL is used by setting the pressure of all of the sump nodes to the minimum admissible value [
26], and calculating the intermediate nodes’ head for each path knowing the head in each reservoir. For this purpose, each node’s topological distance, measured along the path of pipes that connect the node with the source, must be computed previously. Then Equation (1) is used to compute the target
HGL at every node.
Since Equation (1) depends on the parameter
(sag), a sensitivity analysis to evaluate its effect in the final design cost was performed. The evaluated range was
. In order to represent a straight
HGL, the minimum value was set to 0, since a negative sag results in a concave down parabolic
HGL, opposite to Wu’s criterion [
26]. The maximum value of the sag was obtained by finding the maximum
in Equation (1) that produces a monotonically decreasing
HGL for
. It can be shown that a value of 0.25 is the maximum sag under this consideration (no increasing
HGL).
The results of the sensitivity analysis showed that a second-order polynomial could be adjusted to the cost vs.
relationship. Therefore, the design must be done three times with continuous diameters and the costs must be calculated to find the optimal target sag of a network. The criteria considered for the three designs are identical, apart from the general sag used. Subsequently, taking into account that cost vs. sag is a parabola, the optimal sag is determined by finding the minimum cost of a second-order polynomial regression obtained by the three cost vs. sag points previously calculated [
26].
If the three designs are made using
then the optimal target sag can be computed using Equation (6):
where,
is the cost of the architecture obtained using a sag
[
26]. The procedure corresponding to this step is described in the pseudo-code shown in
Figure 5.
The target sag
must be recalculated at each intersection in an upstream analysis through the network, where the branches converge. In order to do so, the flow is weighted on each downstream course. It is essential to analyze the nodes with a high elevation, in order to avoid the assignment of a head value that does not fulfill the pressure demand [
26].
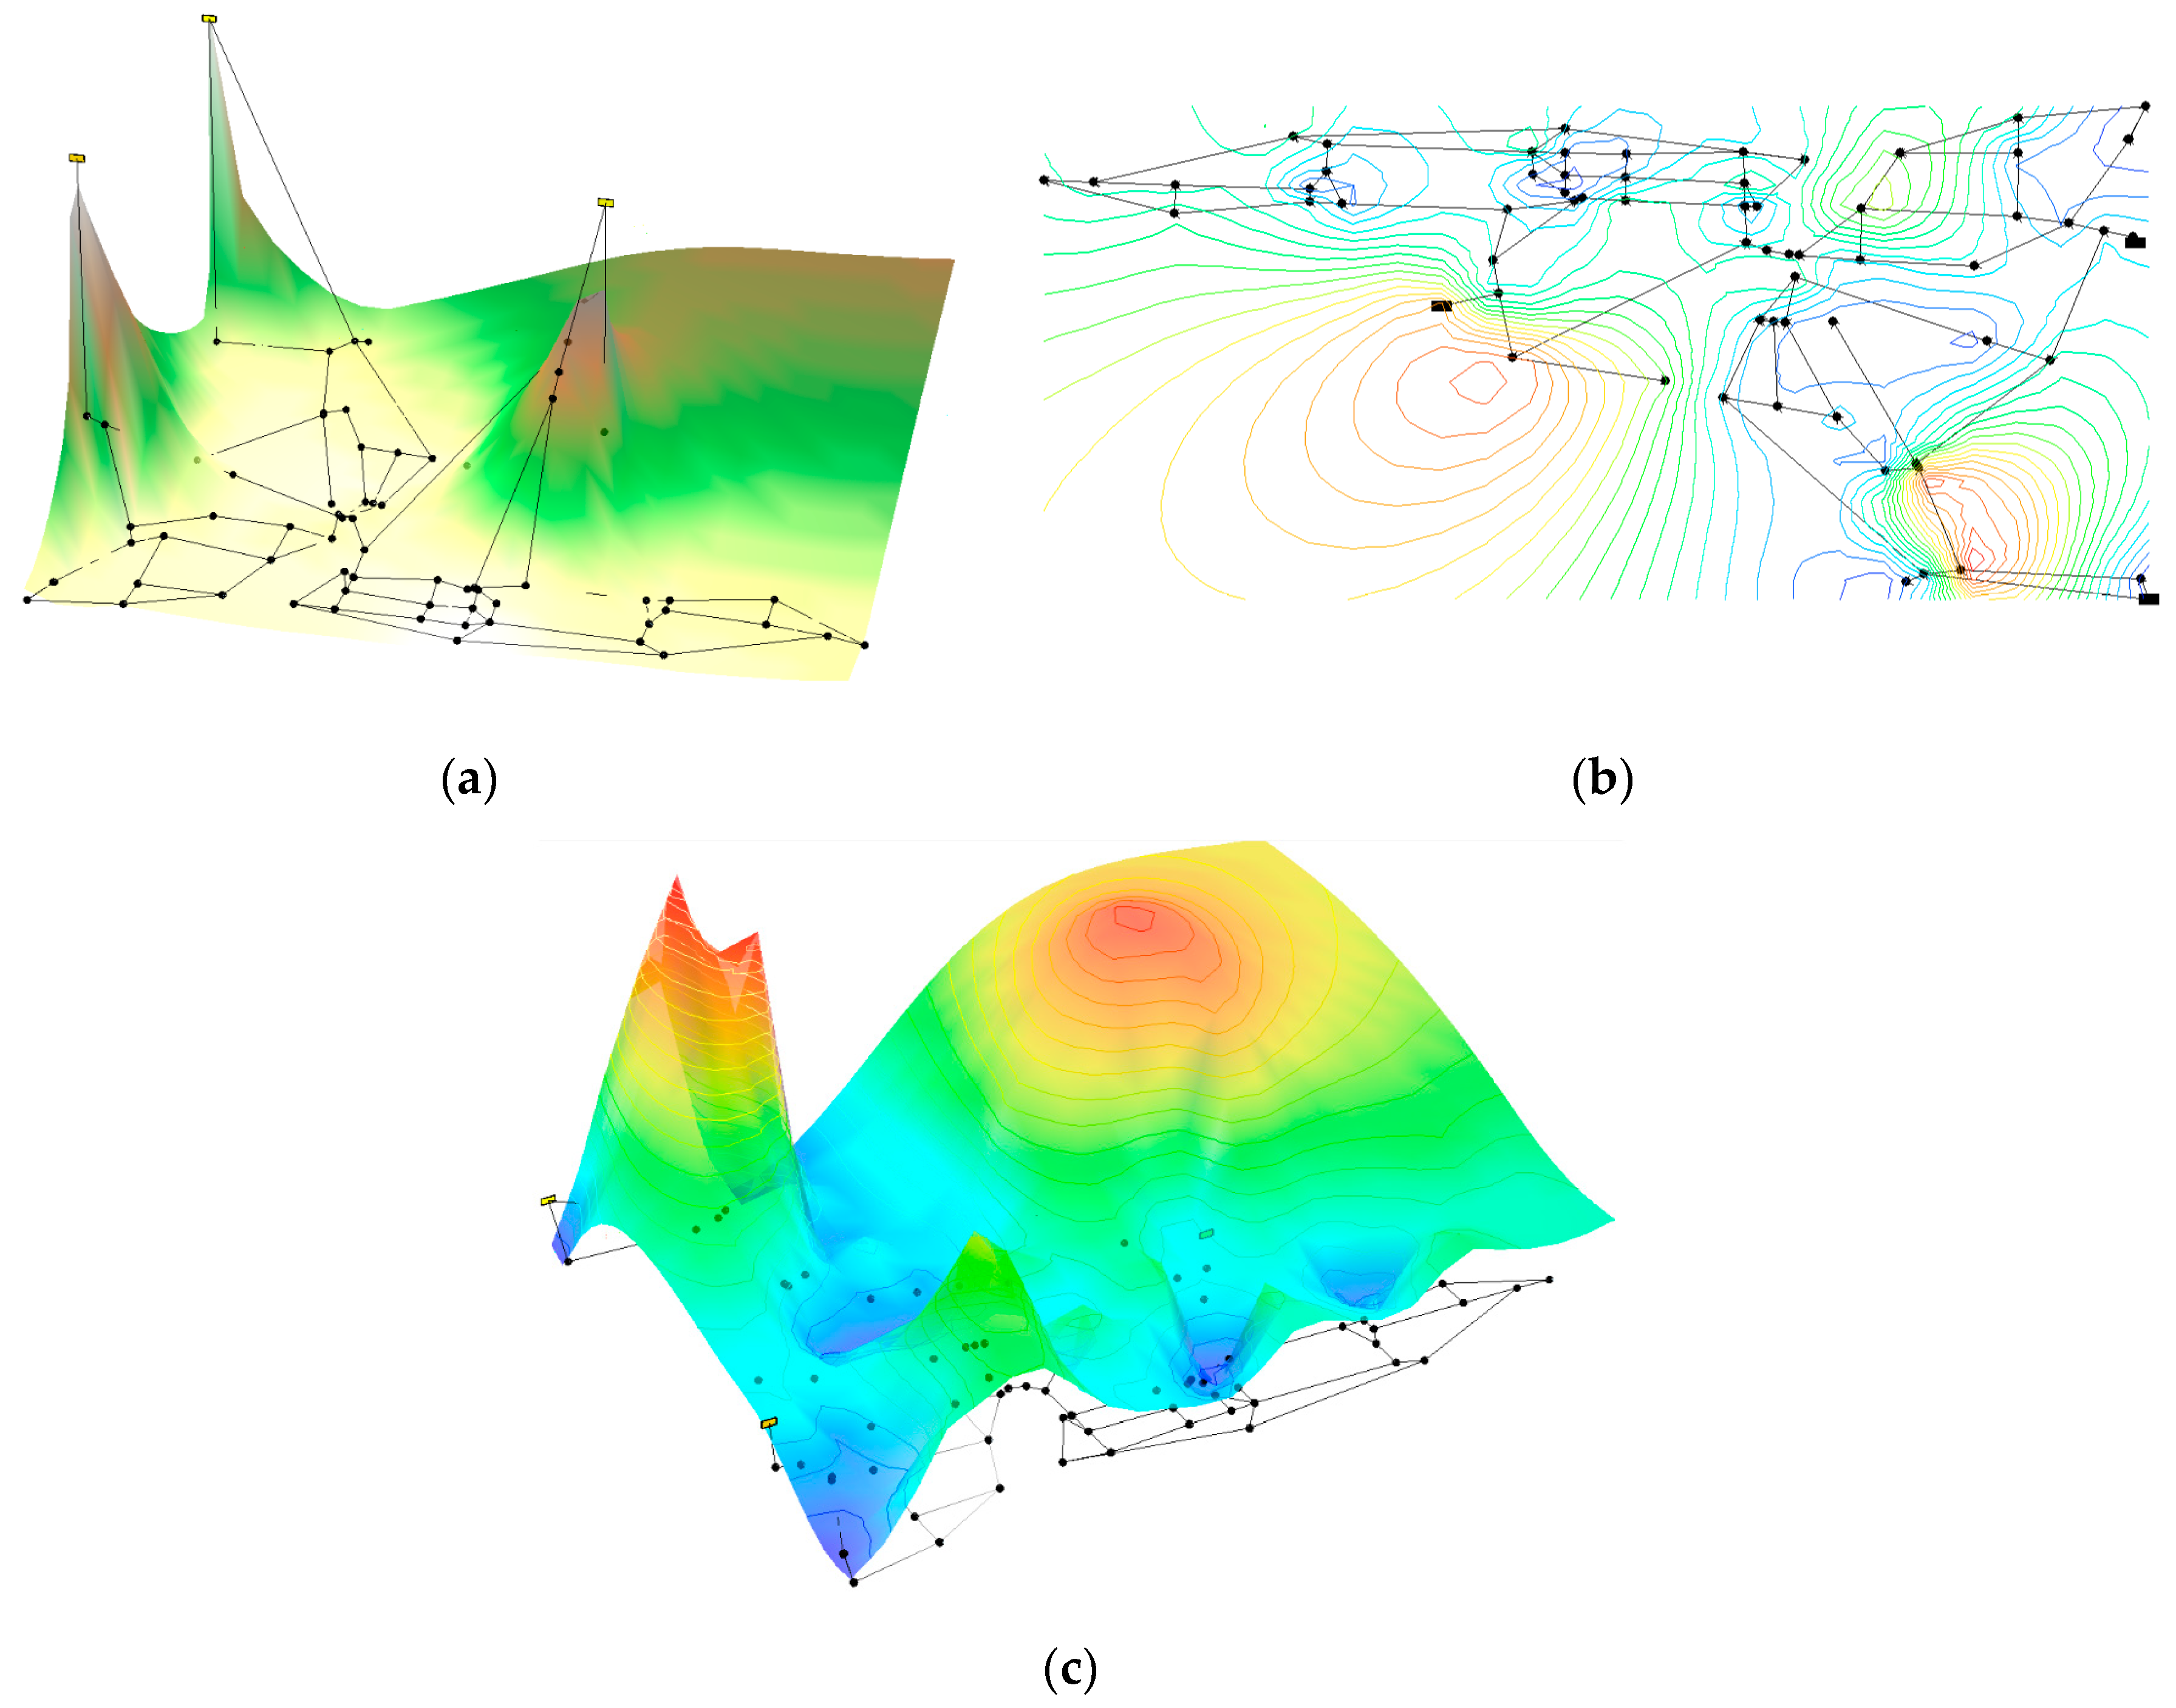
The optimal power use surface for the Pescara network is shown in
Figure 6 as an example. The terrain of the network is shown in
Figure 6a, while subsequent figures show the level curves for the
HGL (
Figure 6b), and its corresponding surface (
Figure 6c). Note that, as mentioned before, for the water source, the
HGL corresponds to the total head available in the reservoir, while in the sump nodes its value was assigned equal to the minimum pressure.
Once this step is concluded, all nodes must have an objective head value assigned. Thus, a flow value is required in order to calculate the diameter of each pipe in the network, using the process explained in the next section.
3.3. Optimal Flow Distribution
In a looped network, the same hydraulic gradient surface can be obtained by combining different configurations of diameters when the set of allowable pipe sizes is R
+ (positive real numbers) [
24]. Thus, this step is intended to find a unique flow distribution in the network that fits to the Optimal Power Use Surface (OPUS) previously defined, ensuring it satisfies the mass conservation at each node.
Since at this point the objective
HGL has been assigned using Wu’s [
16] criteria with the topological distance, the spanning tree structure is no longer required. Therefore, for further steps, the described procedures are done using the original graph (network).
The determination of the optimal flow distribution consists of the division of the flow demand into the upstream pipes, starting from the sumps. Three different criteria were explored for this procedure by Saldarriaga et al. [
19]:
- (1)
Uniform distribution: It assumes that all pipes have the same flow, which is calculated by dividing the total flow demand of each node into the number of upstream pipes connected to it [
26].
- (2)
Proportional distribution: For each pipe, the flow distributes proportionally to H/L2, where H stands for the head losses in the pipe and L for its length.
- (3)
All-in-one distribution: The conveyance capacity for all the pipes upstream of the analyzed node is computed assuming they have the minimum diameter available (dmin), and they are assigned as the design flows. If this is insufficient to transport the total flow demand, the residual flow is assigned to the one pipe with highest hydraulic favorability.
Depending on the used criterion, the reliability of the network varies. In this context, the reliability can be defined as the ability of the system to handle failures, and it can be measured through several approaches such as the Network Resilience Index (NRI), proposed by Prasad and Park [
30]. Saldarriaga et al. [
24] proved that the reliability of the network is magnified when the uniform distribution is used, contrasted to the other two criteria. However, in this paper only the
All-in-one distribution is considered as it was found to be the one that produced least-cost networks [
21].
There are multiple criteria to analyze the appropriateness of different pipes in order to define the main pipe, which is the one that transports the largest portion of the total flow demanded. Similar to the tree structure step, the pipe with the highest flow is determined through a function. This expression is Equation (7), which refers to the Hydraulic Favorability, where the pipe with the maximum value of this parameter is chosen. For nonsump nodes, the total demand is computed by adding its flow to the one required downstream. An Iterative-Recursive Algorithm (IRA) can be applied to perform all of the calculations with an O(NN) time complexity [
26].
where,
is the hydraulic grade line of the upstream node of pipe
,
is the
HGL of the downstream node of pipe
, and
is the length of pipe
[
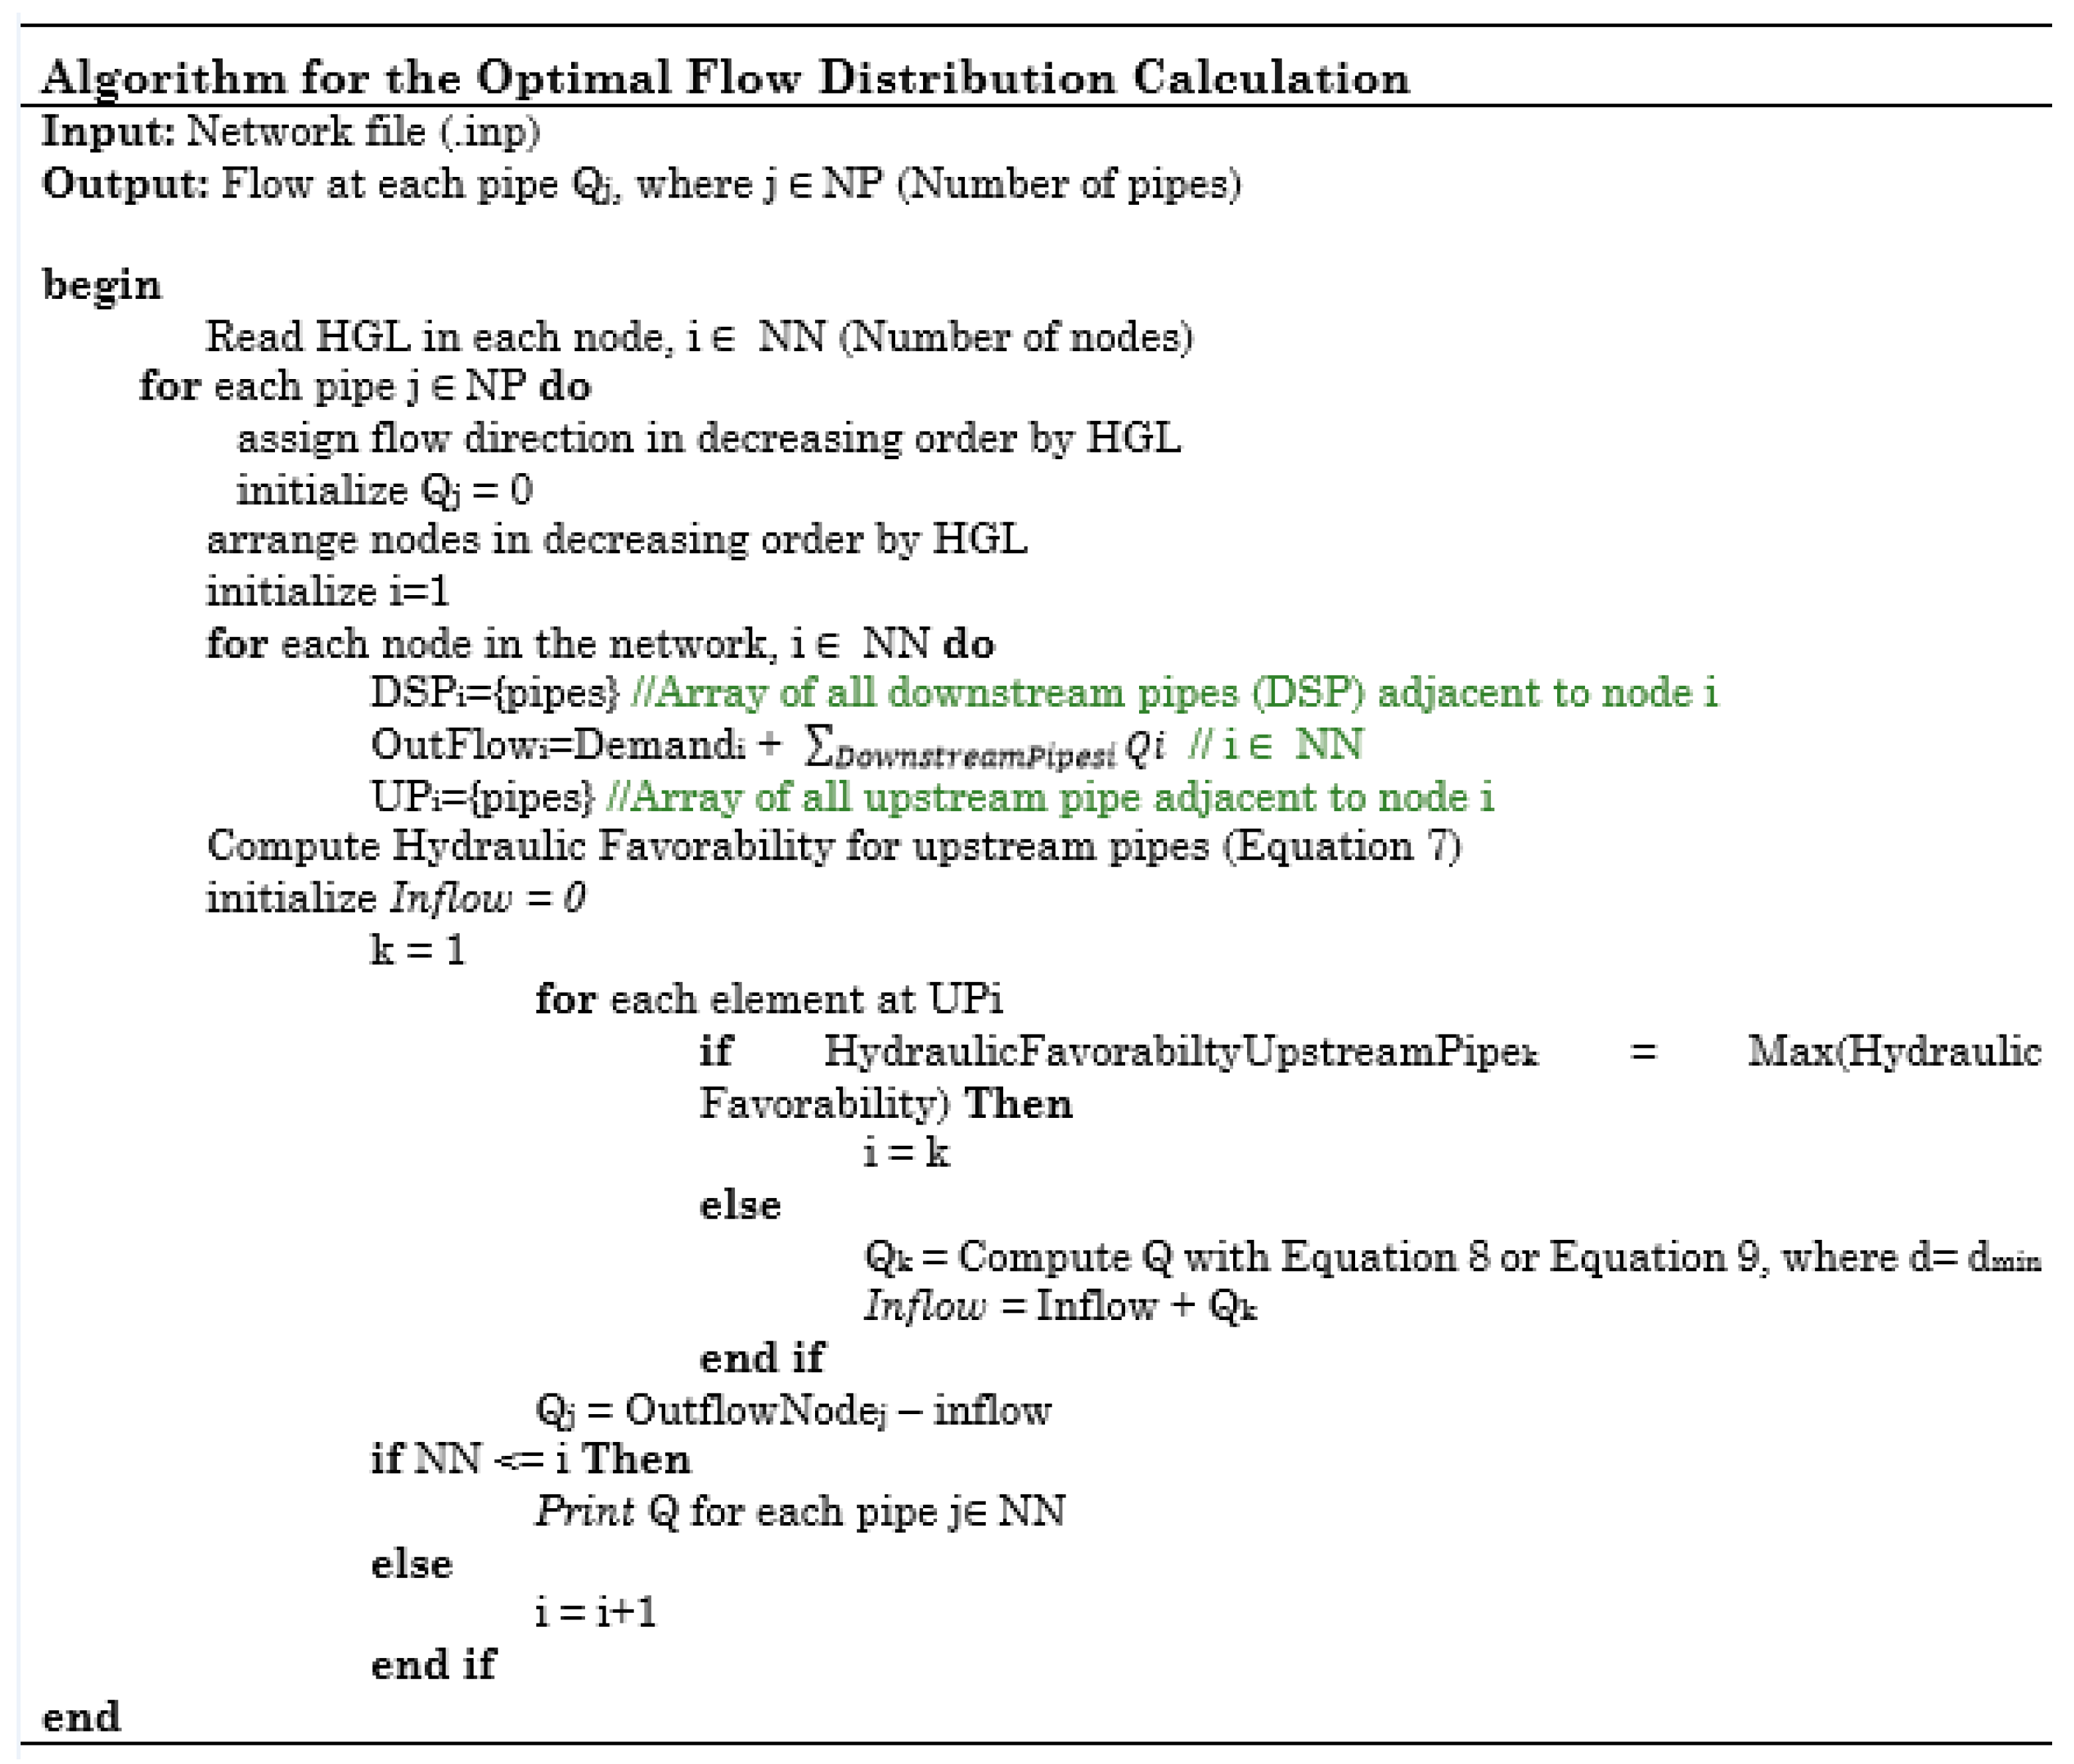
26]. At the end of the process, all of the pipes in the system must have been assigned an objective flow value. The subprocess is explained in detail in
Figure 7.

