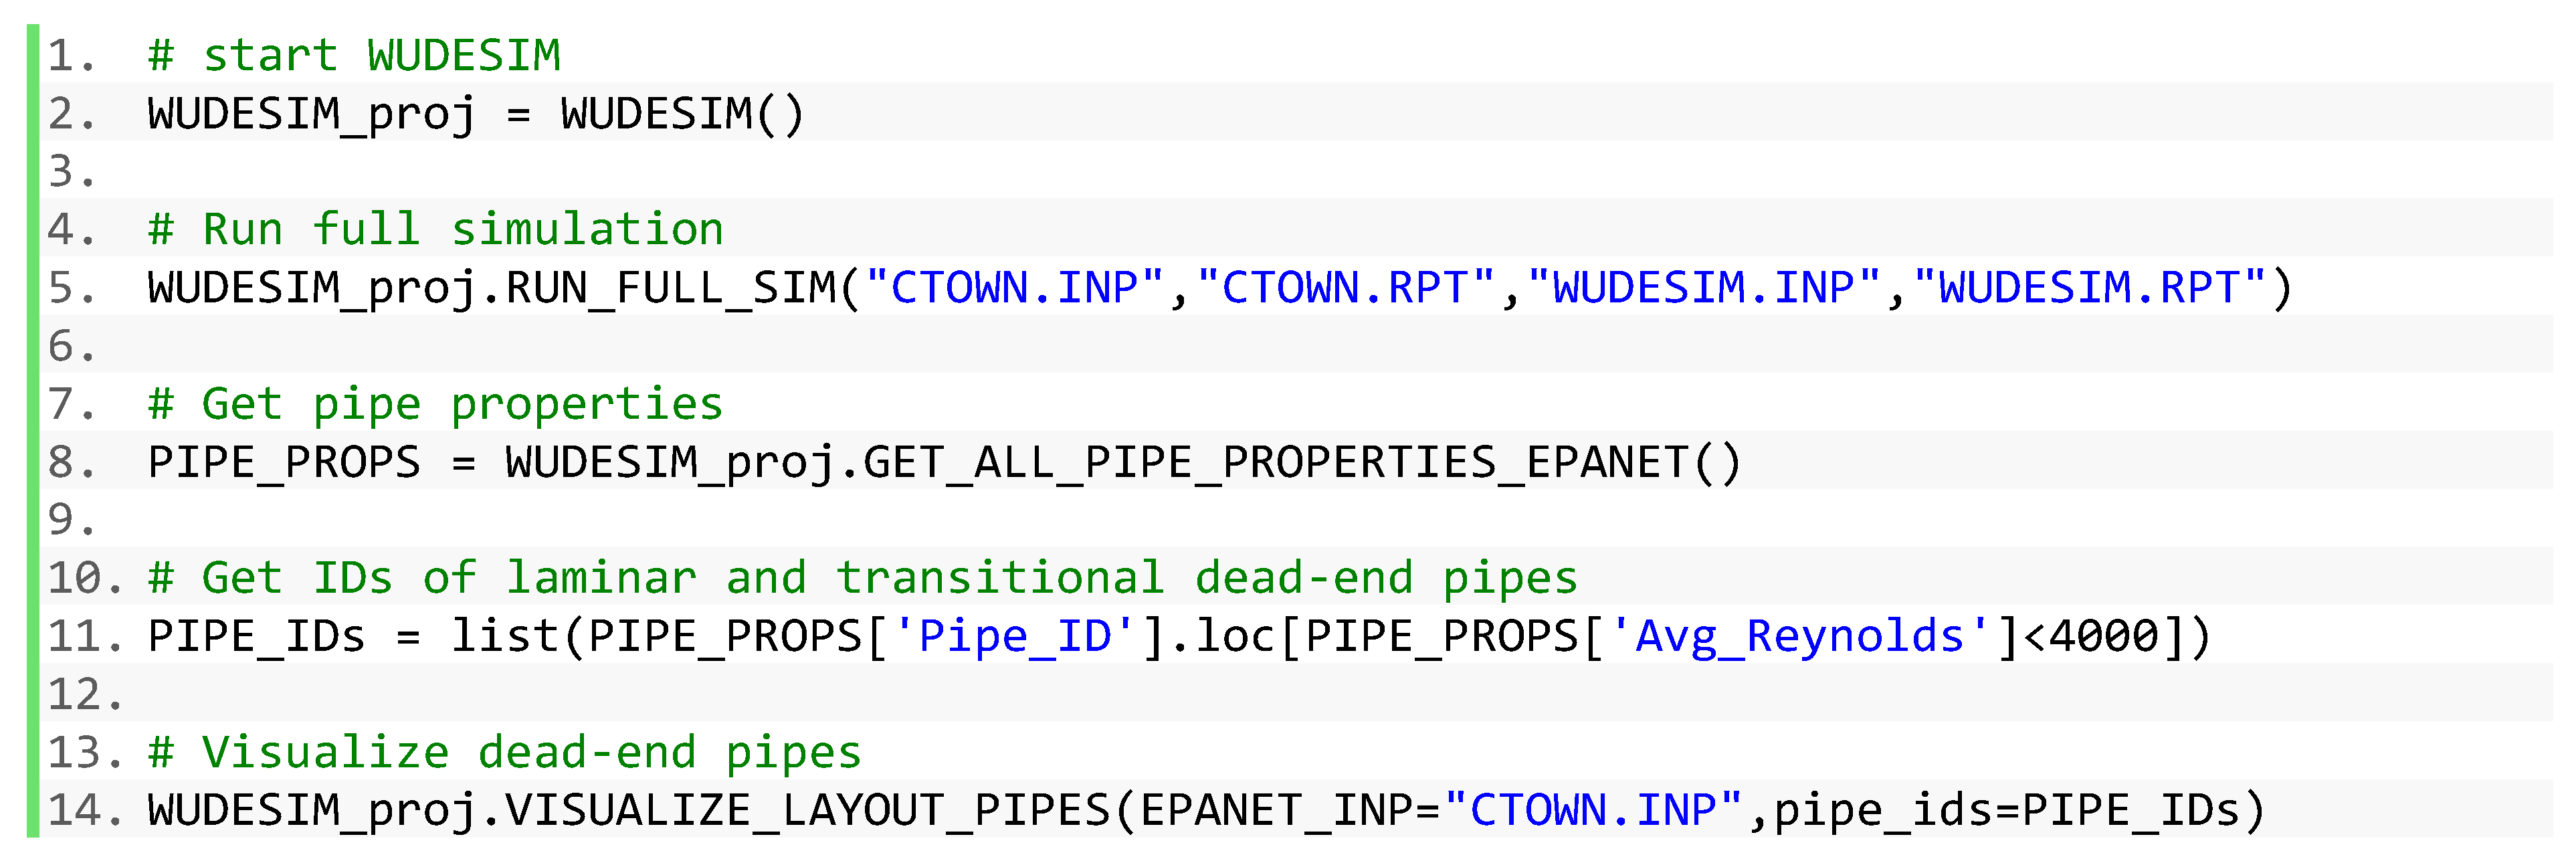
To systematically evaluate the impact of demand reduction and implementing different WQ models (i.e., EPANET and WUDESIM) on the levels of disinfectant residuals in the WDN, publicly available models of eight WDNs were tested [
49]. All hydraulic and WQ settings, including pump operation rules, time steps, and reaction parameters, were set to the same values for the simulations conducted using both EPANET and WUDESIM. First-order rate constants for chlorine decay in the bulk phase and at the pipe wall were set to
and
, respectively. The simulation duration was set to 2 weeks (336 h) to allow WQ in the system to stabilize. For the same reason, the first 100 h of the simulation was not included in the evaluation period based on which the performance metrics were calculated. The hydraulic and WQ time steps were chosen to be 1 h and 5 min, respectively. Source concentration at all reservoirs was set to 4 mg/L. For WUDESIM simulations, a global segment length of 15 m, which is typical of the spacing between consecutive premises in suburban cul-de-sacs in the US [
50], was selected to correct for the errors caused by spatial demand aggregation. The concentration threshold,
, was set to 0.2 mg/L, which is the threshold typically used by water utilities in the US to ensure sufficient protection against microbial recontamination in WDNs [
51].
3.1. Benchmark Network Analysis
The results of WQ modeling using EPANET and WUDESIM, as well as the impact of demand reduction on network performance, were first demonstrated using a benchmark network, Net 6 [
49]. Net 6, depicted in
Figure 5, comprises 541 nodes, 642 pipes, 1 reservoir, 3 tanks, and 1 pump. In this benchmark network, 162 nodes were located in dead-end branches, making up approximately 30% of all network nodes. The network was supplied by a single reservoir with a chlorine concentration of 4 mg/L.
First, hydraulic and WQ simulations were performed under the nominal demand scenario. The hydraulic simulation in EPANET showed that 128 out of the 642 pipes were operating under laminar flow conditions, which indicates that the advection-reaction transport model embedded in EPANET was inappropriate for simulating these low-flow pipes. Instead, dispersive transport needs to be considered for these pipes to give accurate results since transport under laminar flow is dispersion-dominated. Hence, in addition to EPANET, WQ simulations were conducted in WUDESIM where solute dispersion was considered.
Chlorine residual concentrations at the dead-end nodes simulated by both EPANET and WUDESIM are shown in
Figure 5a and
Figure 5b, respectively, where the green markers represent high chlorine concentrations, and the red markers represent low concentrations. For EPANET simulation, 22 (14%) of the dead-end nodes had an average chlorine concentration below 0.2 mg/L, while in WUDEM simulation, 36 (22%) of the dead-end nodes had an average concentration below the threshold. The discrepancy in the simulation results indicates that EPANET overestimates chlorine concentrations at the dead-end nodes, thus yielding overly optimistic results when assessing the WQ compliance in WDNs.
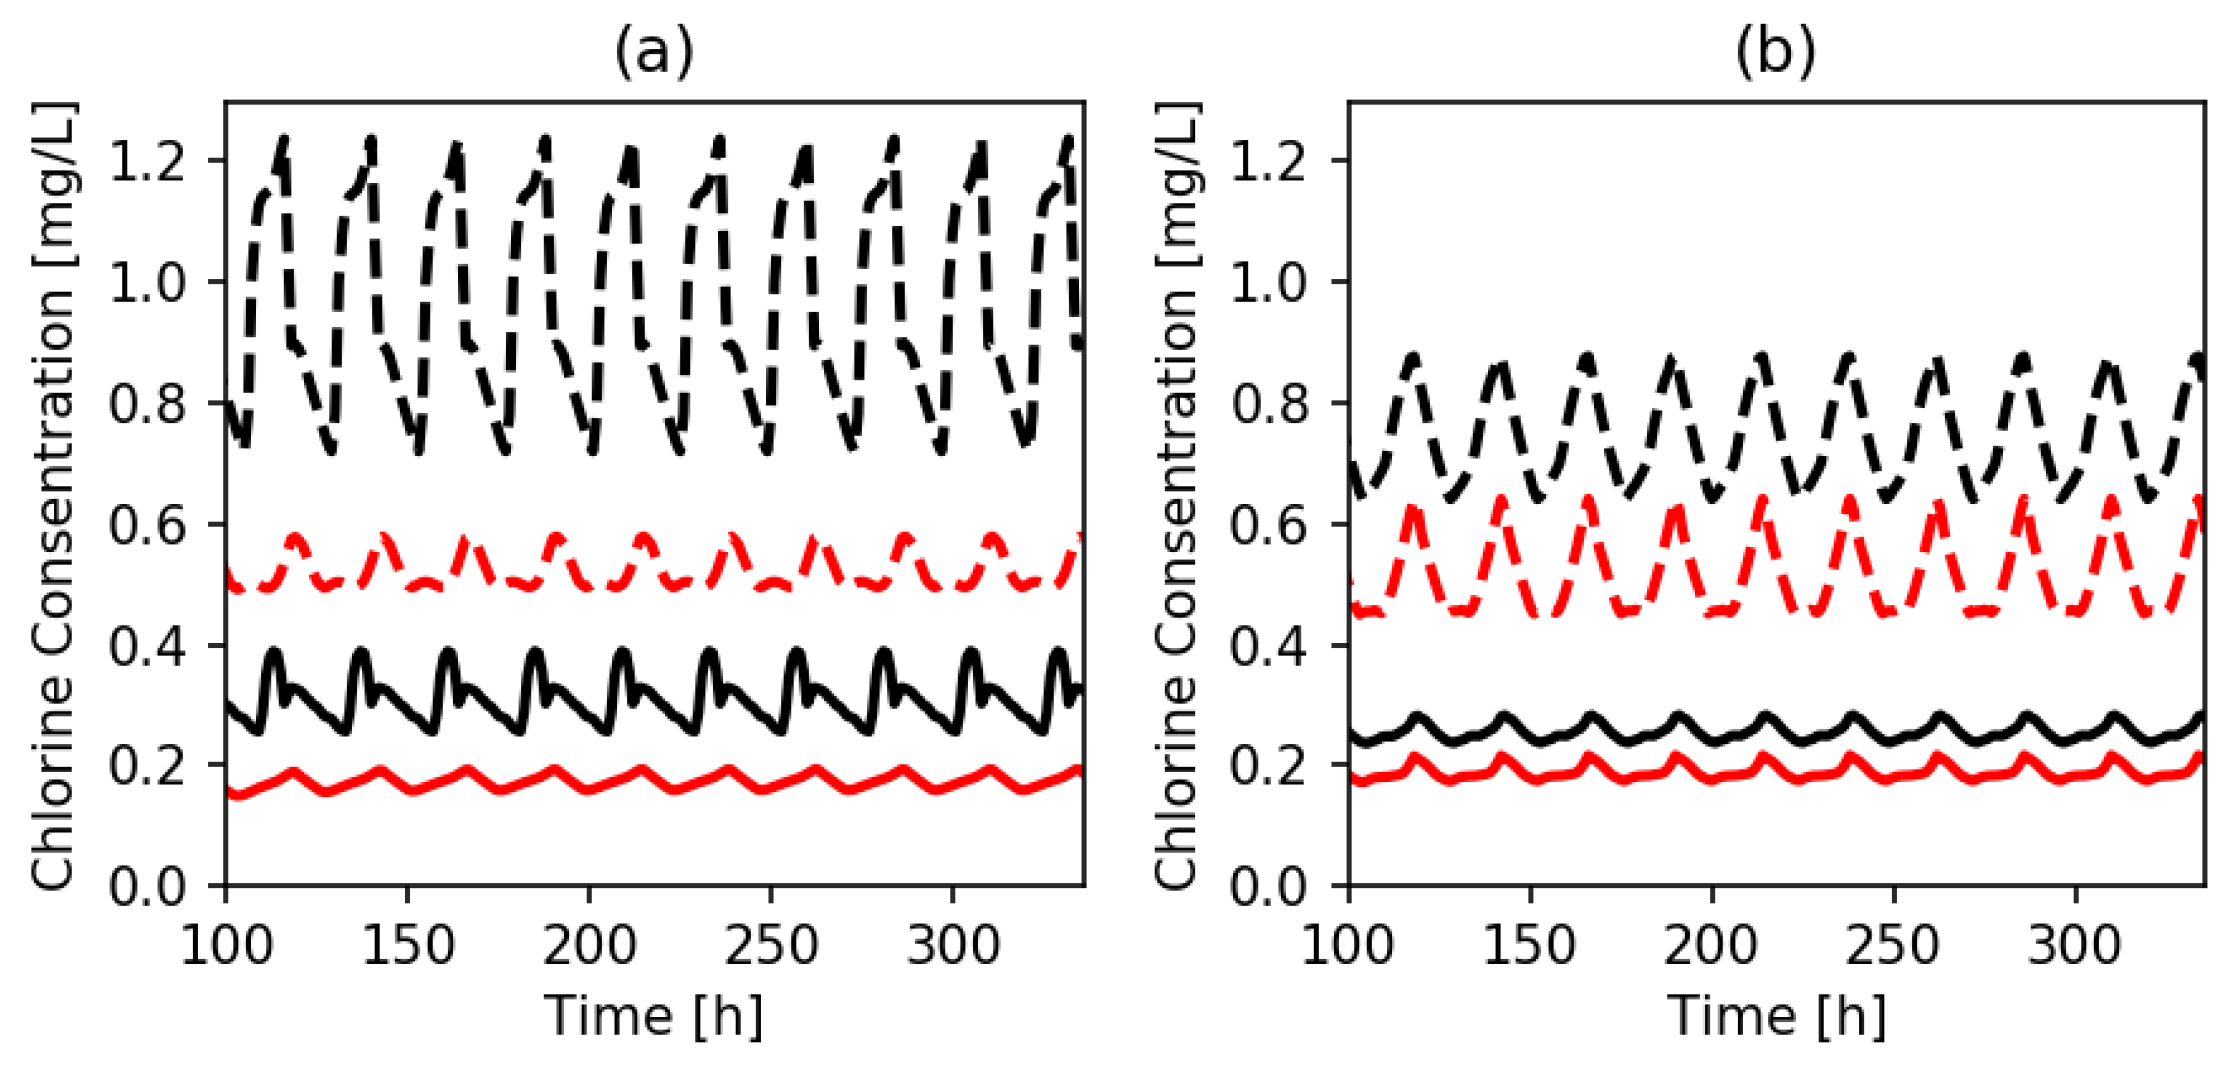
The overestimation in predicting chlorine concentrations by EPANET was further elucidated by comparing the concentration time-series during the evaluation period under both nominal and reduced demand scenarios. In
Figure 6, black and red lines represent EPANET and WUDESIM simulation results, respectively, while dashed and solid lines symbolize the simulated concentrations under the nominal and reduced demand scenarios, respectively.
Figure 6a illustrates the concentration profiles at an example dead-end node, J-169, while
Figure 6b shows the average concentration profiles among all dead-end nodes during the evaluation period. It can be noticed from the figures that EPANET (black lines) overestimates the concentrations compared to WUDESIM (red lines) under both demand scenarios.
The overestimation of chlorine concentrations by EPANET is due to two reasons, namely neglecting dispersive transport and spatially aggregating water demands [
38]. WUDESIM overcomes these errors by taking into account solute dispersion and correcting for the spatial distribution of flow demands along dead-end pipes [
38]. Yet, it is crucial to note that in addition to considering a more advanced transport model, accurate simulation of disinfectant decay requires a more sophisticated reaction model than the simplistic first-order decay kinetics model that has been widely used in the literature [
38]. Since chlorine is a highly reactive oxidant, it reacts with a variety of chemical and microbiological species as it transports through the pipes of the WDN. Hence, accurately accounting for the consumption of chlorine as a result of these parallel reactions would provide a better description of the decay kinetics, which was beyond the scope of this study.
As shown in
Figure 6, chlorine concentrations in the dead-end nodes under reduced demand (solid lines) were significantly lower than those under nominal demand (dashed lines). The reduction percentage in chlorine concentration using both EPANET and WUDESIM was well above 60%. These results suggested that the potential risk of violation (i.e., chlorine residuals falling below the threshold) increased with the widespread implementation of water conservation and demand reduction practices. Thus, more attention should be paid to amending chlorine injection rates in order to account for the additional consumption in the WDN that takes place due to the increased residence time.
Since WUDESIM provides more accurate WQ predictions for the dead-end branches, it was utilized to evaluate the performance metrics under nominal and reduced demand scenarios in the subsequent analysis.
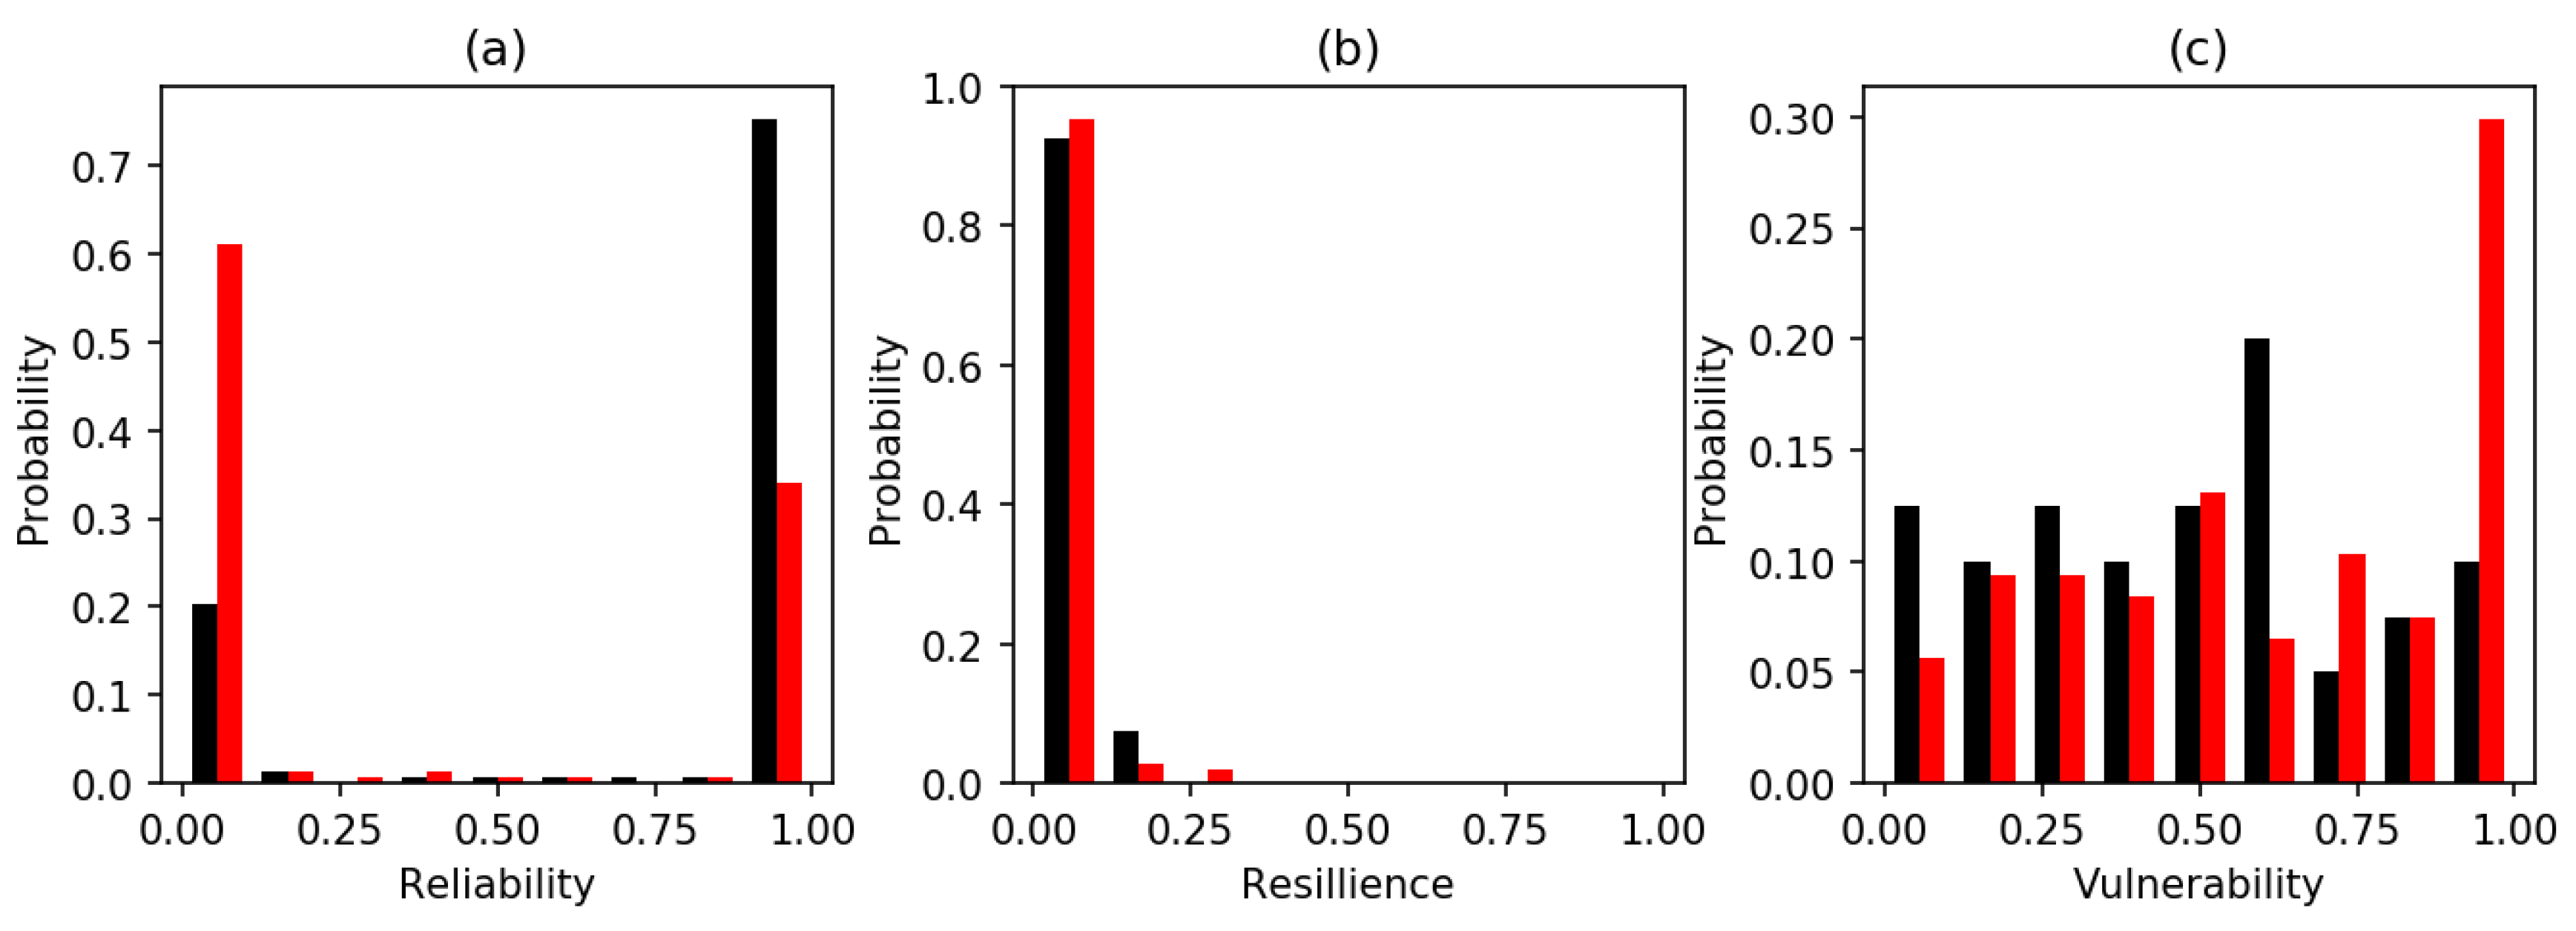
Figure 7 shows the distributions of reliability, resilience, and vulnerability (
) of the nodes in Net6 under the nominal and the reduced demand scenarios (applied to all network nodes).
Figure 7a demonstrates that under nominal demand, approximately 75% of the dead-end nodes exhibited reliability higher than 0.9, while 20% of the dead-end nodes had reliability lower than 0.1. This distribution implied that the dead-end nodes were considerably polarized in terms of reliability, where the chlorine concentration requirement was usually satisfied at 75% of the dead-end nodes and was rarely met at most of the remaining dead-end nodes. Moreover, when the demands were reduced, the portion of unreliable nodes increased significantly from 20% to 60%, while the reliable portion significantly decreased from 75% to 35%, thus resulting in a substantially less reliable system.
Figure 7b shows that the resilience of the benchmark network was rather low under both scenarios, which indicated that once a dead-end node failed to meet the chlorine concentration threshold, it typically remains in a failure state and rarely recovers. Under the reduced demand scenario, the resilience reaches a lower value compared to the nominal demand scenario, though the difference was not considerable. The vulnerability of dead-end nodes is shown in
Figure 7c. Compared with the nominal demand scenario (black bars), the vulnerability of the reduced demand scenario (red bars) was relatively higher on the right-end and lower on the left end of the figure. This suggests that the magnitudes of violation instances were higher under the reduced demand scenario compared with the nominal demand scenario.
The average performance metrics for the benchmark network under both demand scenarios using EPANET and WUDESIM are summarized in
Table 11. Taken together, the results showed that without proper adjustment of the chlorine dosage, demand reduction can exacerbate network performance in terms of chlorine residual by deteriorating reliability and resilience as well as increasing its vulnerability. Additionally, using EPANET WQ simulation model overestimates the WQ performance of the WDN.
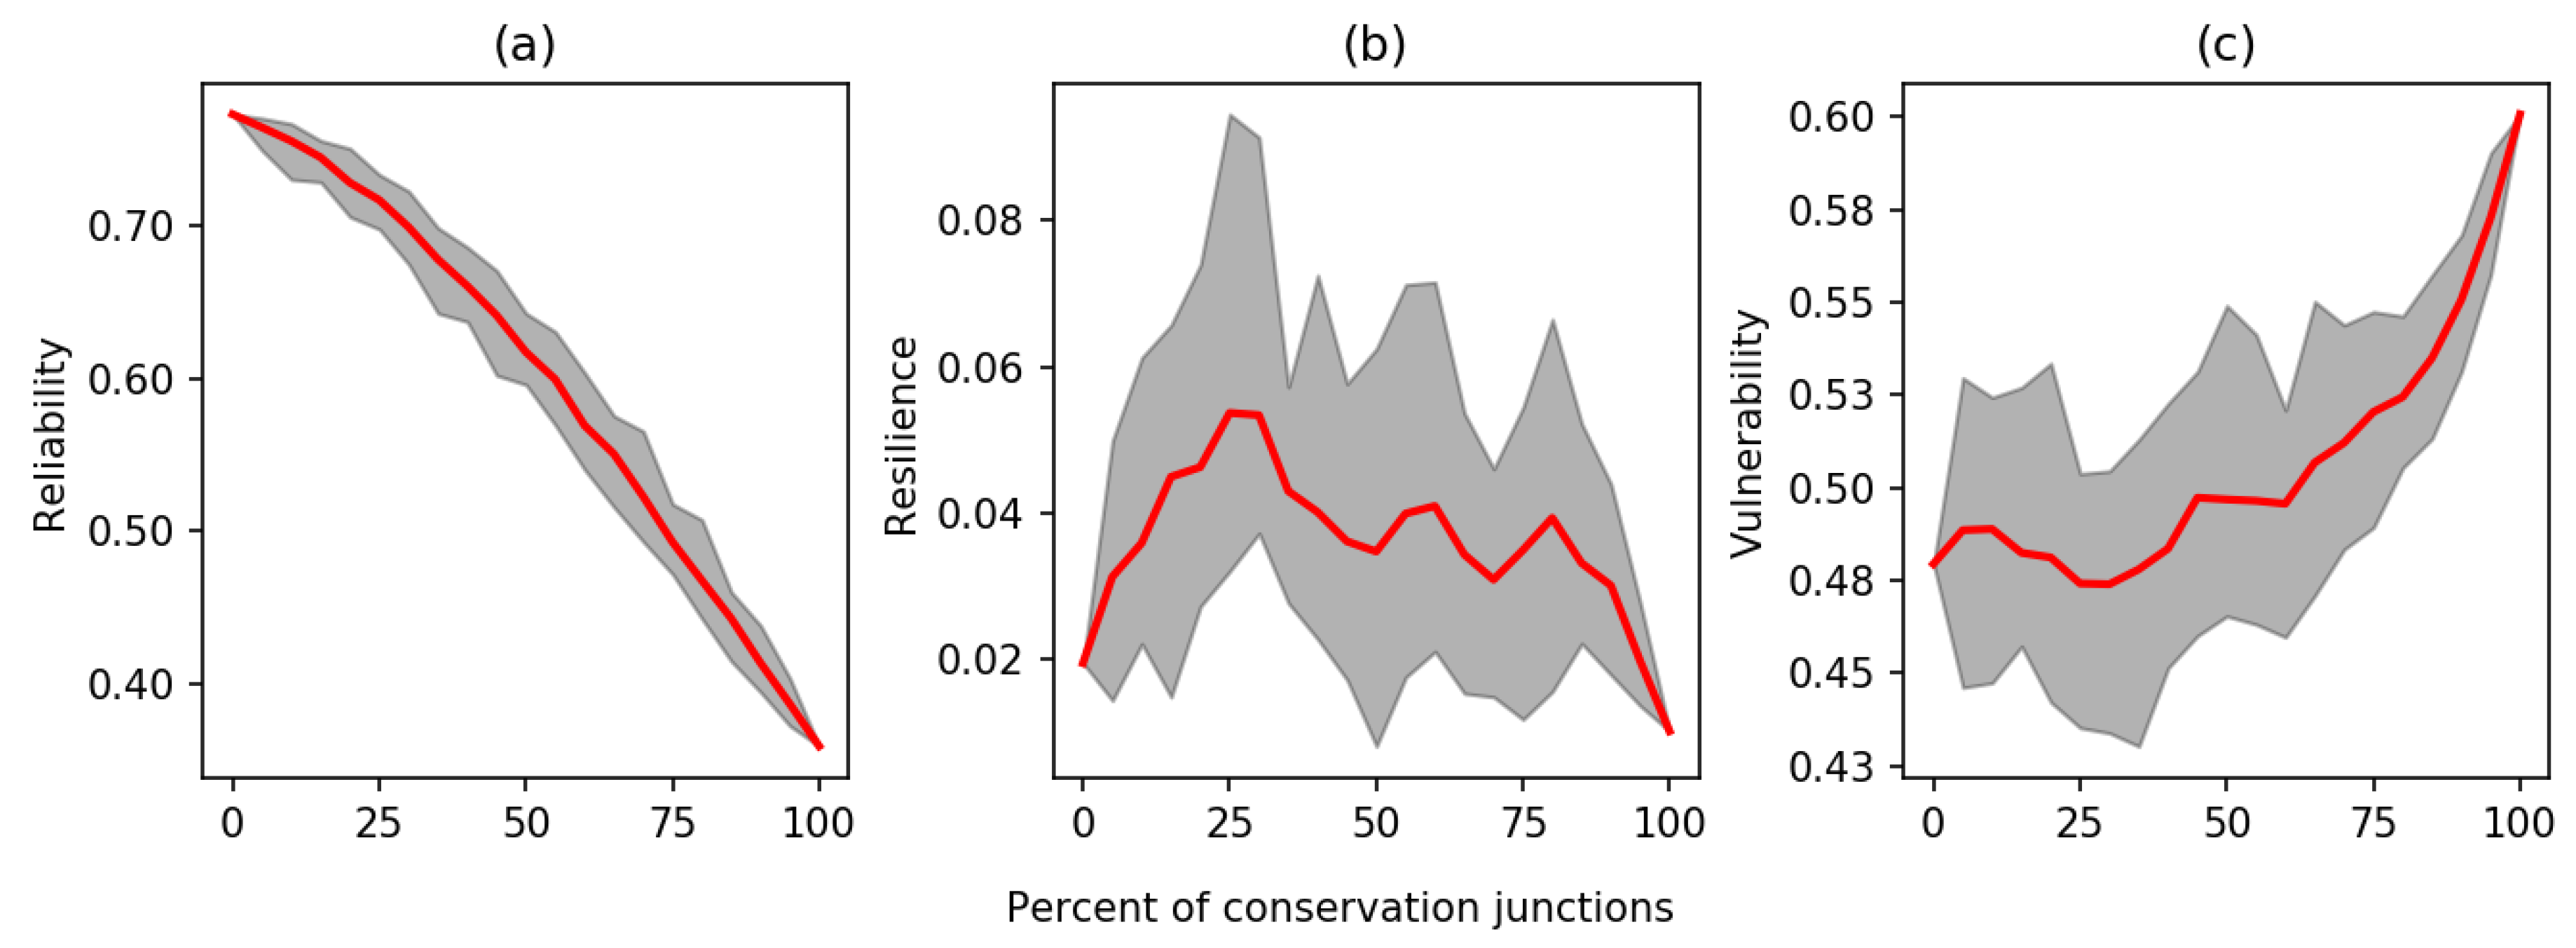
Previous analysis has demonstrated the deterioration of the WQ under the reduced demand scenario in which all nodes in the network adopt conservation strategies. Here, we evaluated the network response to the gradual adoption of the reduced demand, as shown in
Figure 8 The response curve for each metric was attained by assigning conservation demand to a randomly selected set of nodes changing gradually from 0% to 100% of the total number of nodes in the network. To acquire representative samples of network responses, 30 random realizations were stimulated for each percentage of network users conforming to the reduced demand. In
Figure 8, the red lines represent the average performance metrics of the 30 random realizations, and the shaded envelopes encompass the results from all 30 realizations. As expected, network reliability and vulnerability worsen as the number of consumer nodes experiencing reduced demand increases. Noticeably, the response curves were nonlinear with respect to the percentage of consumers with reduced demand. For example, the reduction in reliability (
Figure 8a) and the increase in vulnerability (
Figure 8c) were marginal when the percentage of the consumers with reduced demand increased from 0% to 25% compared to 75% to 100%. Interestingly, while reliability and vulnerability exhibited monotonic trends, the response of resilience to demand reduction was not monotonic, and the resilience scores remained low with very little variation. This observation could potentially suggest an intrinsic network property, indicating that targeted actions needed to be taken to recover chlorine residuals at dead-end nodes.
3.2. Global Analysis
The simulations and analyses conducted for the benchmark network were repeated herein for 7 additional WDNs to cover a wide range of network characteristics [
49]. A summary of the network properties of all 8 WDNs simulated in this study is presented in
Table 12, including the number of dead-end nodes and pipes operating under the laminar regime. The number of nodes in the networks ranged from 366 to 1614, while dead-end nodes accounted for 14% (Net 3) to 36% (Net 1) of the total nodes in the network. The EPANET simulation results suggested that under nominal demand, approximately 5% (Net 3) to 26% (Net 1) of the pipes had laminar flow; however, when operated under reduced demand, the number of pipes having laminar flow conditions increased to 9% for Net 3 up to 30% for Net 1. The differences in the number of dead-end nodes and laminar pipes reflected the difference in the topology of the networks, the magnitude of the user demands, and the operating rules of the network pumps.
The system performance metrics, i.e., RRV, of all the simulated networks under nominal and reduced demand scenarios using both EPANET and WUDESIM are summarized in
Table 3. For Net 3 and Net 5, the reliability scores under the nominal demand scenario were 1, implying that all dead-end nodes satisfy the concentration threshold at all-time steps. Thus, the resilience and vulnerability scores, which are defined only for failure instances, have no entries in
Table 3 for Net 3 and Net 5.
Additionally,
Table 13 confirms the two observations made previously for the benchmark network. Firstly, under the same demand scenarios, WUDESIM predicts lower reliability and higher vulnerability than EPANET, indicating that EPANET overestimates the chlorine concentration at the dead-end nodes. Moreover, resilience scores, calculated based on EPANET and WUDESIM simulations, were low, which implies the inability of the dead-end nodes to recover after violating the chlorine residual requirement. Secondly, both EPANET and WUDESIM demonstrated a decrease in network performance, i.e., lower reliability and resilience, as well as high vulnerability, under reduced demands as compared to nominal demands. Overall, the results showed that reducing the demand across all tested WDNs caused a 5% to 42% decrease in network reliability, 0% to 9% decrease in resilience, and 5% to 33% increase in vulnerability. Taken together, these results revealed that the widespread adoption of water conservation practices could potentially pose a risk to public health due to the significant degradation of chlorine residuals, particularly in the dead-end branches.


