Article

Concentrations and Loads of Dissolved and Particulate Organic Carbon in Urban Stormwater Runoff

1
Former Soil and Water Quality Laboratory, Gulf Coast Research and Education Center, University of Florida, Wimauma, FL 33598, USA
2
Department of Environmental Science and Technology, University of Maryland, College Park, MD 20742, USA
*
Author to whom correspondence should be addressed.
Current Address: Charlotte County Community Development Department, Port Charlotte, FL 33948, USA.
Water 2020, 12(4), 1031; https://doi.org/10.3390/w12041031
Submission received: 6 March 2020 / Revised: 29 March 2020 / Accepted: 1 April 2020 / Published: 4 April 2020
(This article belongs to the Section Water Quality and Contamination)

Abstract

:
Urban landscapes are significant contributors of organic carbon (OC) in receiving waters, where elevated levels of OC limit the light availability, increase the transport of pollutants, and result in high costs of potable water treatment. Our objective in this study was to investigate the concentrations, fractions (dissolved and particulate), and loads of OC in a residential catchment (3.89 ha drainage area) located in Florida, United States. The outlet of the stormwater pipe draining the residential catchment was instrumented with an automated sampler, a flowmeter, and a rain gauge. The rainfall and runoff samples collected over 25 storm events during the 2016 wet season (June to September) were analyzed for dissolved organic carbon (DOC) and total organic carbon (TOC), with particulate OC (POC) calculated as the difference between TOC and DOC. Mean concentration of DOC was 2.3 ± 1.7 mg L−1 and POC was 0.3 ± 0.3 mg L−1 in the rainfall, whereas DOC was 10.5 ± 6.20 mg L−1 and POC was 2.00 ± 4.05 mg L−1 in the stormwater runoff. Concentrations of DOC were higher during the rising limb of the hydrograph in 15 out of 25 storm events, suggesting flushing of DOC, with an increase in the amount of runoff, from the landscape sources in the residential catchment. The estimated total export of OC during the 2016 wet season was 66.0 kg ha−1, of which DOC was 56.9 kg ha−1 (86.2% of TOC), and POC was 9.1 kg ha−1 (13.8% of TOC). High concentrations and loads of OC, especially DOC, in the stormwater runoff imply that residential catchments in urban watersheds are hot-spots of DOC influx to water bodies. Reducing DOC transport in the urban landscapes is complex and require identifying the origin of DOC and then using site-specific targeted approaches to mitigate DOC loss.

1. Introduction

Urbanization affects nutrient retention and transport to water bodies due to the alteration of the hydrologic flow patterns [1,2]. Many urbanized areas are designed to capture and transport stormwater runoff via hydraulically connected storm network systems [3]. These, in turn, result in altering the structure and function of the urban landscapes and lead to physical, chemical, and biological modifications, eventually affecting downstream ecosystems [4]. These modifications are the primary driver of reduced infiltration, increased stormwater runoff, decreased biodiversity, and increased transport of pollutants [5]. Furthermore, urban development can contribute to a significant influx of organic carbon (OC) due to the contribution from additional sources, such as lawn grass clippings, leaves, eroded sediments, atmospheric deposition [3], and wastewater flows from sewage and septic systems [6]. An increase in OC concentrations in water bodies can intensify the binding and co-transport of pollutants, reduce light penetration, lessen vertical heat distribution, and diminish oxygen mixing and production [7].
The OC in water bodies can be operationally classified based on the size of the filter paper to dissolved organic carbon (DOC) and particulate organic carbon (POC) [8]. The DOC is a product of a diverse mixture of organic material and depends on soil composition, hydrology, watershed size, and proximity of surface water to nearby wetlands [7]. Fungi and microbes break down OC into small labile forms and, ultimately, to carbon dioxide (CO2). POC is similar in origin to DOC; however, it is generally more readily available as a food source to higher organisms, such as macroinvertebrates and fish, rather than microbes and fungi. Although POC can move downstream with excessive runoff, it usually remains closer to the site of production, unlike DOC, which is easily transported downstream with flowing waters [3].
Previous research has identified several functions of OC in surface water bodies. For example, Rodriguez-Cardona et al. [9] suggested that identifying OC and nutrient interactions within urban stormwater systems is vital for recognizing the overall risk of surface water pollution. Recent studies have concluded that the mineralization of DOC can cause elevated levels of nutrients and inorganic C in aquatic ecosystems [7]. In surface waters, OC increases turbidity and light attenuation in the water column [10], which can impact fish ecology and behavior, including avoiding predation, capturing food, growth, and reproduction [7]. This effect is exacerbated when macrophyte growth is reduced via light constraints, limiting essential fish spawning habitats [11]. Urbanization has been found to enhance DOC lability up to four times as compared to forested areas [6]. In the Chesapeake Bay, a significant increase in DOC was documented, following 30 years of suburban development, and DOC lability was altered due to increases in impervious surface areas; these changes then affected biological metabolism, oxygen demand, alkalinity, and CO2 production [12]. Furthermore, OC in surface water bodies is linked to climate and air quality, where the fate of OC in water bodies can be oxidization to CO2. Some bacteria, especially heterotrophic, consume DOC and generate CO2 as a waste product in the aquatic systems [13].
Atmospheric deposition is one of the sources of OC in surface water bodies [14], with the majority of OC flux in wet deposition (60%), of which −90% is water soluble [15]. Historical research data on the wet deposition of OC indicates increasing concentrations in coastal areas [15]. There is a need for more research in identifying the effect of stormwater runoff and land use on the timing and magnitude of OC transport. Previous research has investigated OC in streams and rivers [3] and urban areas [16]; however, there is a knowledge gap in OC dynamics in stormwater runoff originating from residential catchments. This research is of critical importance, since more land areas are being continuously developed to accommodate population growth, which can impact downstream aquatic ecosystems. Such urban water bodies can become polluted with metals and pesticides, partially due to the sorption of these compounds to OC [7]. Increased concentrations of pollutants, such as hydrocarbons in urban waters, have the potential to alter biochemical oxygen demand [17].
There is limited research on fluxes of OC in stormwater runoff originating in urban residential catchments. The specific objective of this study was to determine the concentrations, dissolved and particulate fractions, and loads of OC in stormwater runoff from a residential catchment, over a wet season (June to September), in Florida, United States.

2. Materials and Methods

2.1. Study Site Description

The study site is located in Manatee County, Florida, United States, and is a part of the increasingly urbanized west–central region of the state (Figure 1). The total land area of Manatee County is 2312.9 km2, of which 16.9% is water. The study site is a low-density residential catchment of 3.89 ha (or 38,900 m2) and includes 13 single-family homes (see Supplementary Information Figure S1). The research catchment drains to the Braden River, which is a tributary of the Manatee River and flows 72.4 km toward the Southern Tampa Bay, forming the Manatee River Watershed [18]. Geographic information system (GIS) was supplemented with ground-truthing, to calculate the surface area coverage of the residential catchment (Table S1). In the catchment, total pervious area is 57.1% (2.22 ha), which includes green space that consists of tree canopy (6.2%) and lawns that consist of turfgrass (50.9%). Similar to other developed suburban areas in Florida, the turfgrass in the residential catchment is predominantly St. Augustine (Stenotaphrum secundatum). On the other hand, the total impervious surface in the catchment is 42.9% (1.67 ha), which includes the area under single-family homes, i.e., rooftops, patios, driveways (18.5%), and roads and sidewalks (24.4%). The residential catchment is managed by the Lakewood Ranch Homeowners’ Association (HOA).
The soils in the catchment consist of Myakka-Myakka wet fine sands and Wabasso fine sands soil series. These are poorly drained sandy soils, with an organic layer and limited vertical water movement. Most of the soils within the area are classified as very likely to cause stormwater runoff due to the shallow water table (15–47 cm) [18]. The climate in the region is humid and subtropical, with a mean annual temperature of–22 °C and predominantly hot and humid summers (low to middle 30 °C), with frequent afternoon thunderstorms. Meanwhile, the winter temperature varies from near freezing at night to warm in the afternoon [18].
Approximately 50–60% of precipitation in Florida is derived from thunderstorms during the wet season, which begins from June 1 and ends on September 30. It is estimated that approximately 70% of the stormwater is lost via evapotranspiration, and the remainder (30%) of the stormwater is carried into the Gulf of Mexico, due to the shallow groundwater and limited deep soil infiltration capacity [18]. Unlike the wet season, the dry season (October to May) receives minimal rain and, in some instances, does not receive measurable precipitation for over 60 days [18].

2.2. Sample Collection

In this study, stormwater flow data values in the stormwater outlet pipe of a residential catchment were recorded at 1 min intervals during the wet season (June–September). Rainfall and runoff samples were collected at 10 min intervals during the storm events. The residential catchment (drainage area: 3.89 ha) channels the surface runoff into a stormwater retention pond through a network of storm drains and pipes. An automated refrigerated sampler (Model 6710, Teledyne Technologies Inc, Lincoln, Nebraska, US) was installed at the outlet of the stormwater pipe, approximately 30 m upstream from the stormwater retention pond (Figure 1). Suction tubing from the ISCO sampler was extended into the storm pipe, to collect stormwater runoff. The main storm pipe, which is 76 cm in diameter, was equipped with a LaserFlow non-contact velocity sensor (Model 2160, Teledyne Technologies Inc, Lincoln, Nebraska, US), to measure water level, flow rate, and total flow, at 1 min intervals, during the wet season. The laser flowmeter has an accuracy of ± 0.6 cm at < 30 cm level change and ± 1.2 cm at > 30 cm level change. The sampler was connected with a rain gauge module (Model 674, Teledyne Technologies Inc, Lincoln, Nebraska, US) for measuring local precipitation. A solar-panel-backed battery system was used to supply and power the autosampler and flowmeter. The system (comprising of the autosampler, flowmeter, and rain gauge) was equipped with a web-based telemetry system, which was designed and programmed to notify the operator when sampling was initiated. All data were downloaded remotely and analyzed, using the FlowLink 5.1 software (Teledyne Technologies Inc, Lincoln, Nebraska, US).
The autosampler was programmed to collect runoff samples during rainfall events with a minimum of 0.254 cm of rainfall in 10 min intervals, or when stormwater flows within the storm pipe exceeded a height of 1.905 cm for 5 min. The collection of runoff samples was not possible if one of these two parameters were not met during the small rainfall events. Once the programmed conditions were met, runoff samples were collected until rainfall or flow declined, or all sampling bottles in the sampler were full. Based on the rainfall intensity and duration, the automated sampler collected up to 14 samples (−700 mL) and kept them refrigerated at 4 °C. Overall, 75 storm events occurred during the wet season, of which 25 storm events were sampled for this study. The rainfall and flow characteristics associated with 25 storm events can be found in Table S2. From the 25 captured storm events, 10 or more samples were collected in 11 storm events, 5–9 samples were collected in 6 storm events, and < 4 samples were collected in 8 storm events.

2.3. Sample Analyses

The collected samples (218 samples in 25 storm events) were transported to the laboratory and analyzed within 24 h of collection, using EPA method 415.3 [19]. In all samples, the DOC was separated from POC via filtration through a 0.45 μm glass fiber filter paper (Pall Corporation, Ann Arbor, Michigan, US) [20]. A sub-sample was kept unfiltered for TOC analysis. A Total Organic Carbon Analyzer (TOC-L CPH/CPN, Shimadzu Corp., Columbia, Maryland) was used for TOC and DOC analysis. All rainfall samples were also analyzed for TOC and DOC. Concentrations of POC were calculated as the difference between TOC and DOC. Quality control and assurance were conducted, including triplicate analysis of each sample, recovery test, reagent blanks, and continuous verification. These were completed for each analysis batch to ensure the accuracy and precision of the method (within 5% for triplicate sample analysis). Reagent blanks were run with each batch, to determine any potential errors with the analytical measurements.

2.4. Statistical analysis

Flow-weighted mean concentration (FWMC) (mg L−1) for each storm event was computed, by multiplying concentrations and corresponding flow, using the following equation:
FWMC = Σn + 1(concentration × flow × time)/Σn + 1(flow × time).
Loads of TOC, DOC, and POC for each event were calculated as the product of the concentration of each sample (mg L−1) and the total associated sample flow (L) and dividing by 1,000,000 to obtain the value in kg. The export of OC from all captured runoff events was calculated by summing the load from each of the 25 storm events. We also estimated the loads for non-captured events during the wet season, using overall FWMC values of OC fractions for 25 storm events and the flow determined during the non-captured events. By summing the loads for captured and non-captured events, we estimated the total load for the wet season. Loading of OC forms over 25 storm events, and wet season was presented as kg ha−1 by dividing the total load (kg) with the drainage area (3.89 ha).
Microsoft Excel 2013 was used for part of the descriptive statistical analysis for the 25 stormwater events. This included the mean, median, minimum, maximum, range, and standard deviation of DOC, POC, and TOC. Statistical analysis methods in Prism (Version 7.03, GraphPad Software) were used to determine correlation (r) among rainfall, flow, and concentrations. The potential correlation between DOC concentrations in rain and stormwater was determined by using the same software at p value of < 0.05. Correlation coefficients were established for hydrograph lag time, rainfall duration, and total precipitation for each event.
Rainfall DOC concentrations data were tested for normality and analyzed for outliers, using the ROUT statistical method, with a conservative False Discovery Rate of 0.1% [1]. From the 16 collected rainfall samples, six samples were identified as high-probability outliers [21] and were removed from the dataset, as they failed the normality test, likely due to the contamination with organic debris (bird fecal matter and insects in the rain gauge).
The stormwater flow measurements were plotted for each event in a standard runoff hydrograph. The graph includes (1) rising limb—the initial part of the hydrograph reflecting increasing discharge over time; (2) crest segment—peak of the hydrograph; and (3) recession limb— water withdrawal of the hydrograph. Each of the 25 storm events were plotted as a hydrograph, to gain insights on stormwater progression. The shape of the hydrograph depends on the drainage area, slope, and hydraulic roughness. Residential watersheds exhibit steeper and shorter hydrographs due to the higher impervious coverage compared to natural and agricultural areas [22]. Storm hydrographs can also be influenced by the height of the water table and the saturation capacity of the soil. The higher the water table, the quicker the soil will drench, leading to faster overland flow. The lower saturation capacity of the soil will cause less water to infiltrate during a storm event, causing more runoff. Therefore, the longer a rainy season perseveres, the flashier and higher hydrographs occur [23].

3. Results

3.1. Summary of Rainfall and Flow in Residential Catchment

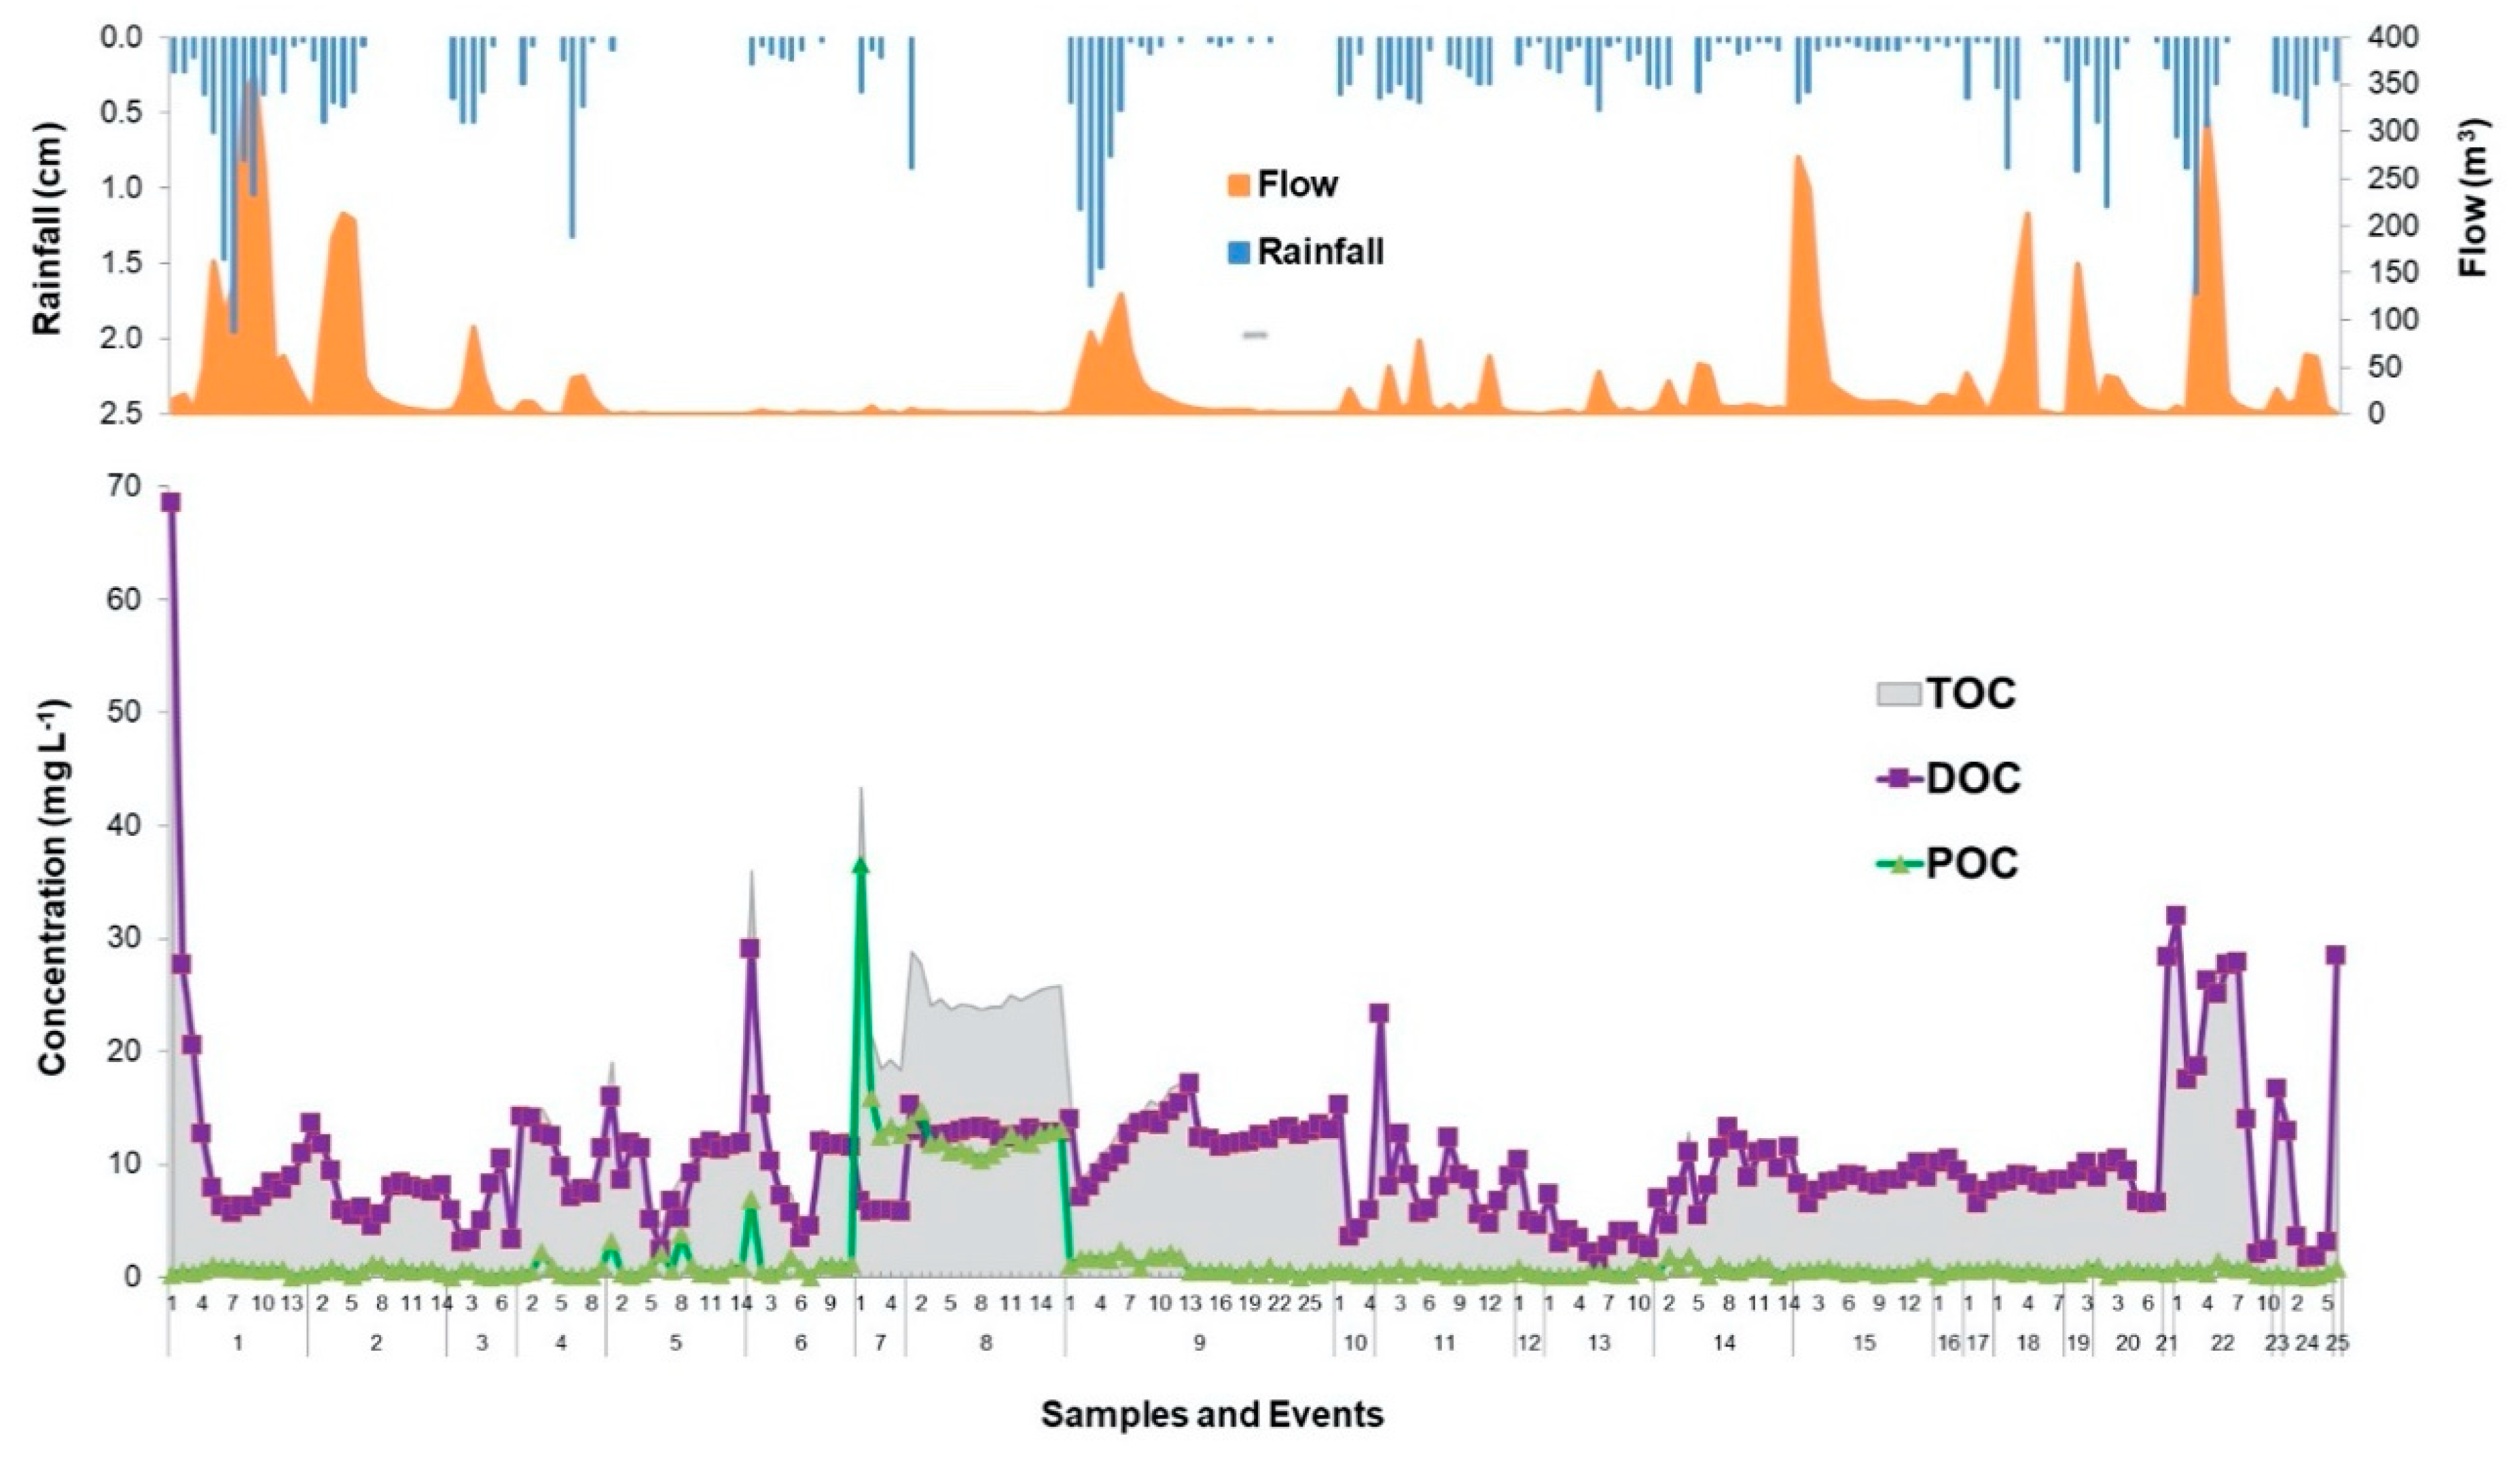
The total amount of rainfall was 28.3 cm during the 25 storm events and 65 cm during the wet season (June to September 2016). The sampled rainfall represented 44% of the wet season rainfall. The amount of rainfall varied over the 25 storm events, from 0.08 cm in event 5 to 7.80 cm in event 9 (Figure 2). Total runoff in the stormwater outlet pipe from the residential catchment during the wet season was 21,540 m3, of which 6684 m3 occurred in the captured 25 storm events, which is equivalent to 31.1% of total wet season flow. Total runoff during the individual storm events ranged from 1.39 m3 in event 21 to 639.05 m3 in event 9, indicating high fluctuation in runoff amount, as driven by seasonal rainfall variability (Figure 2).

3.2. Concentrations of Organic Carbon Forms in Rainfall and Stormwater Runoff

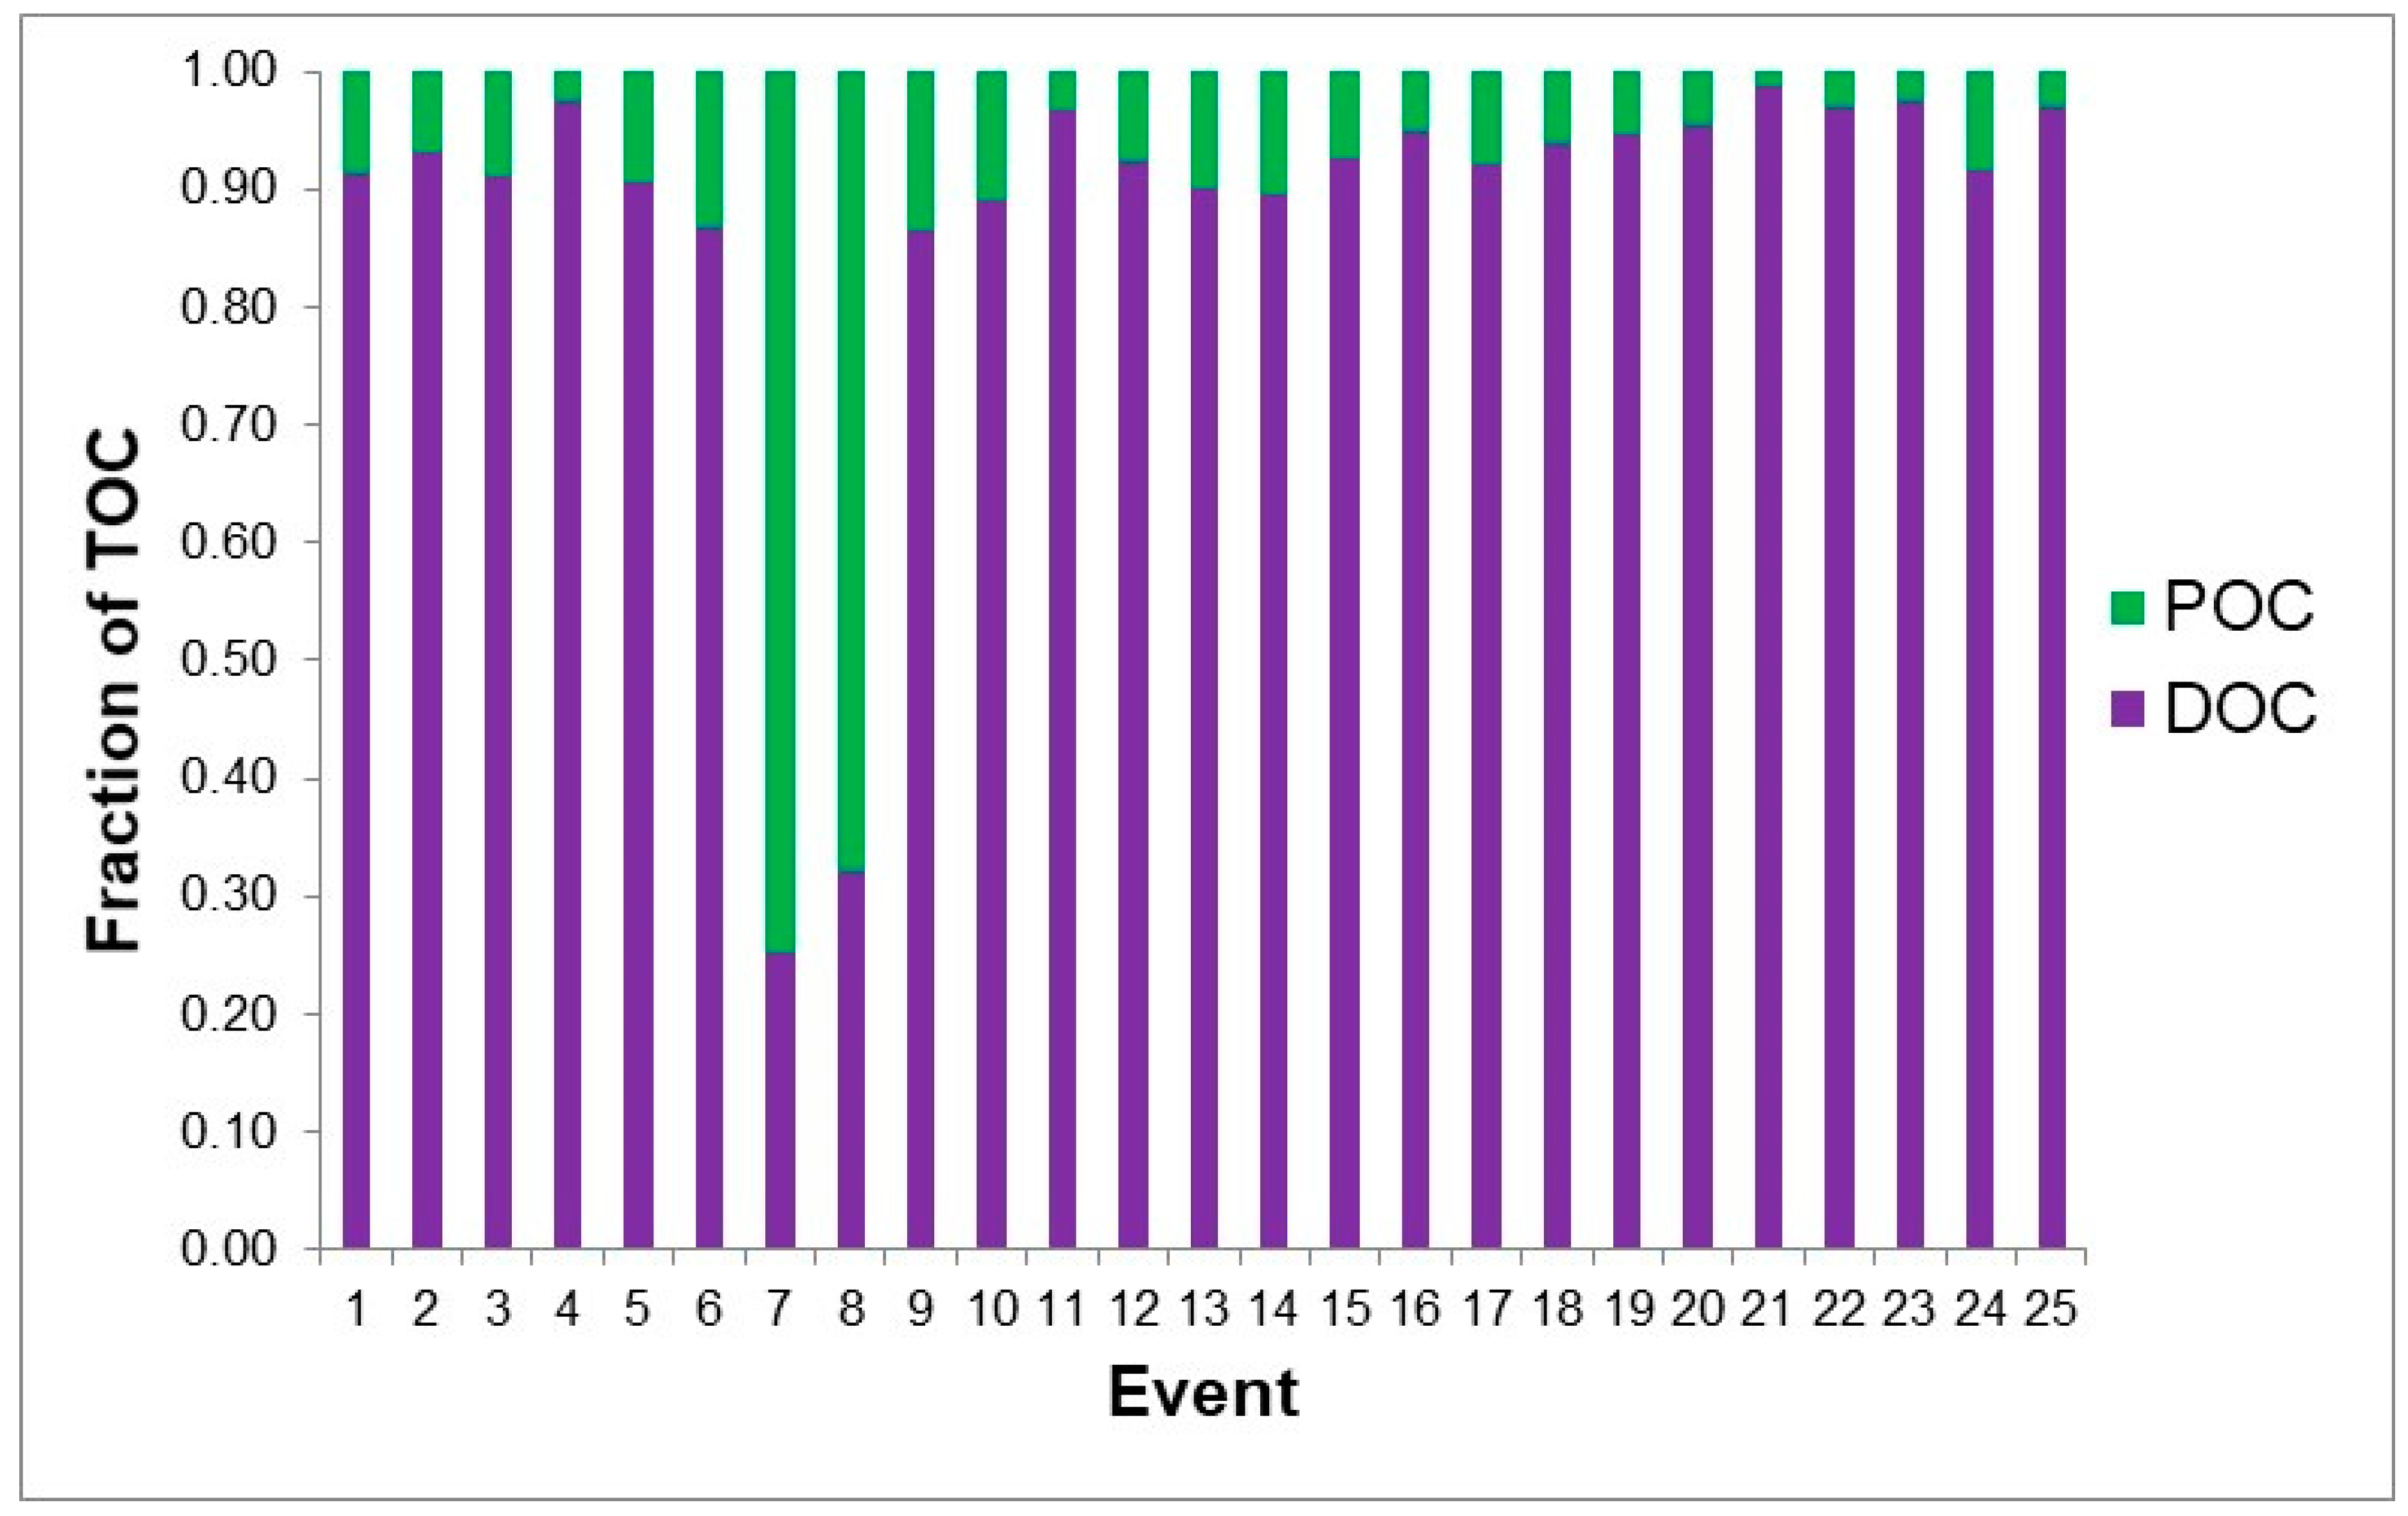
Rainfall samples collected from May 4 to September 25 (n = 10) showed high fluctuations in OC concentrations (Figure S2), where mean TOC was 2.60 mg L−1 (range: 0.93−7.18 mg L−1), DOC was 2.27 mg L−1 (range: 0.83–7.00 mg L−1), and POC was 0.33 mg L−1 (range: 0.03–0.81 mg L−1). Over the wet season, stormwater runoff FWMC TOC was 12.52 mg L−1 (range: 3.78–29.28), DOC was 10.51 mg L−1 (range: 3.37–28.40), and POC was 2.01 mg L−1 (range: 0.41–18.23) (Table 1). These values of DOC were approximately five times greater than POC, with more than 90% of storm events with average DOC: POC of 9:1 (Figure 3). Higher concentrations of POC in events 7 and 8 were observed and likely due to the runoff of particulates from the residential catchment. Our research on nitrogen dynamics in this residential catchment also found greater concentrations of particulate organic nitrogen in two events, where low rain and runoff resulted in concentrating particulates [24]. The DOC concentration in the rainfall ranged from 9% to 49% (mean: 23%) of stormwater runoff DOC (Table 2). Concentrations of DOC in rainfall and stormwater runoff were positively correlated (r = 0.72, p < 0.05) at a 95% two-tailed confidence interval, suggesting that rainfall was a source and contributor of DOC in stormwater runoff.

3.3. Temporal Pattern of Organic Carbon Concentrations in Stormwater Runoff

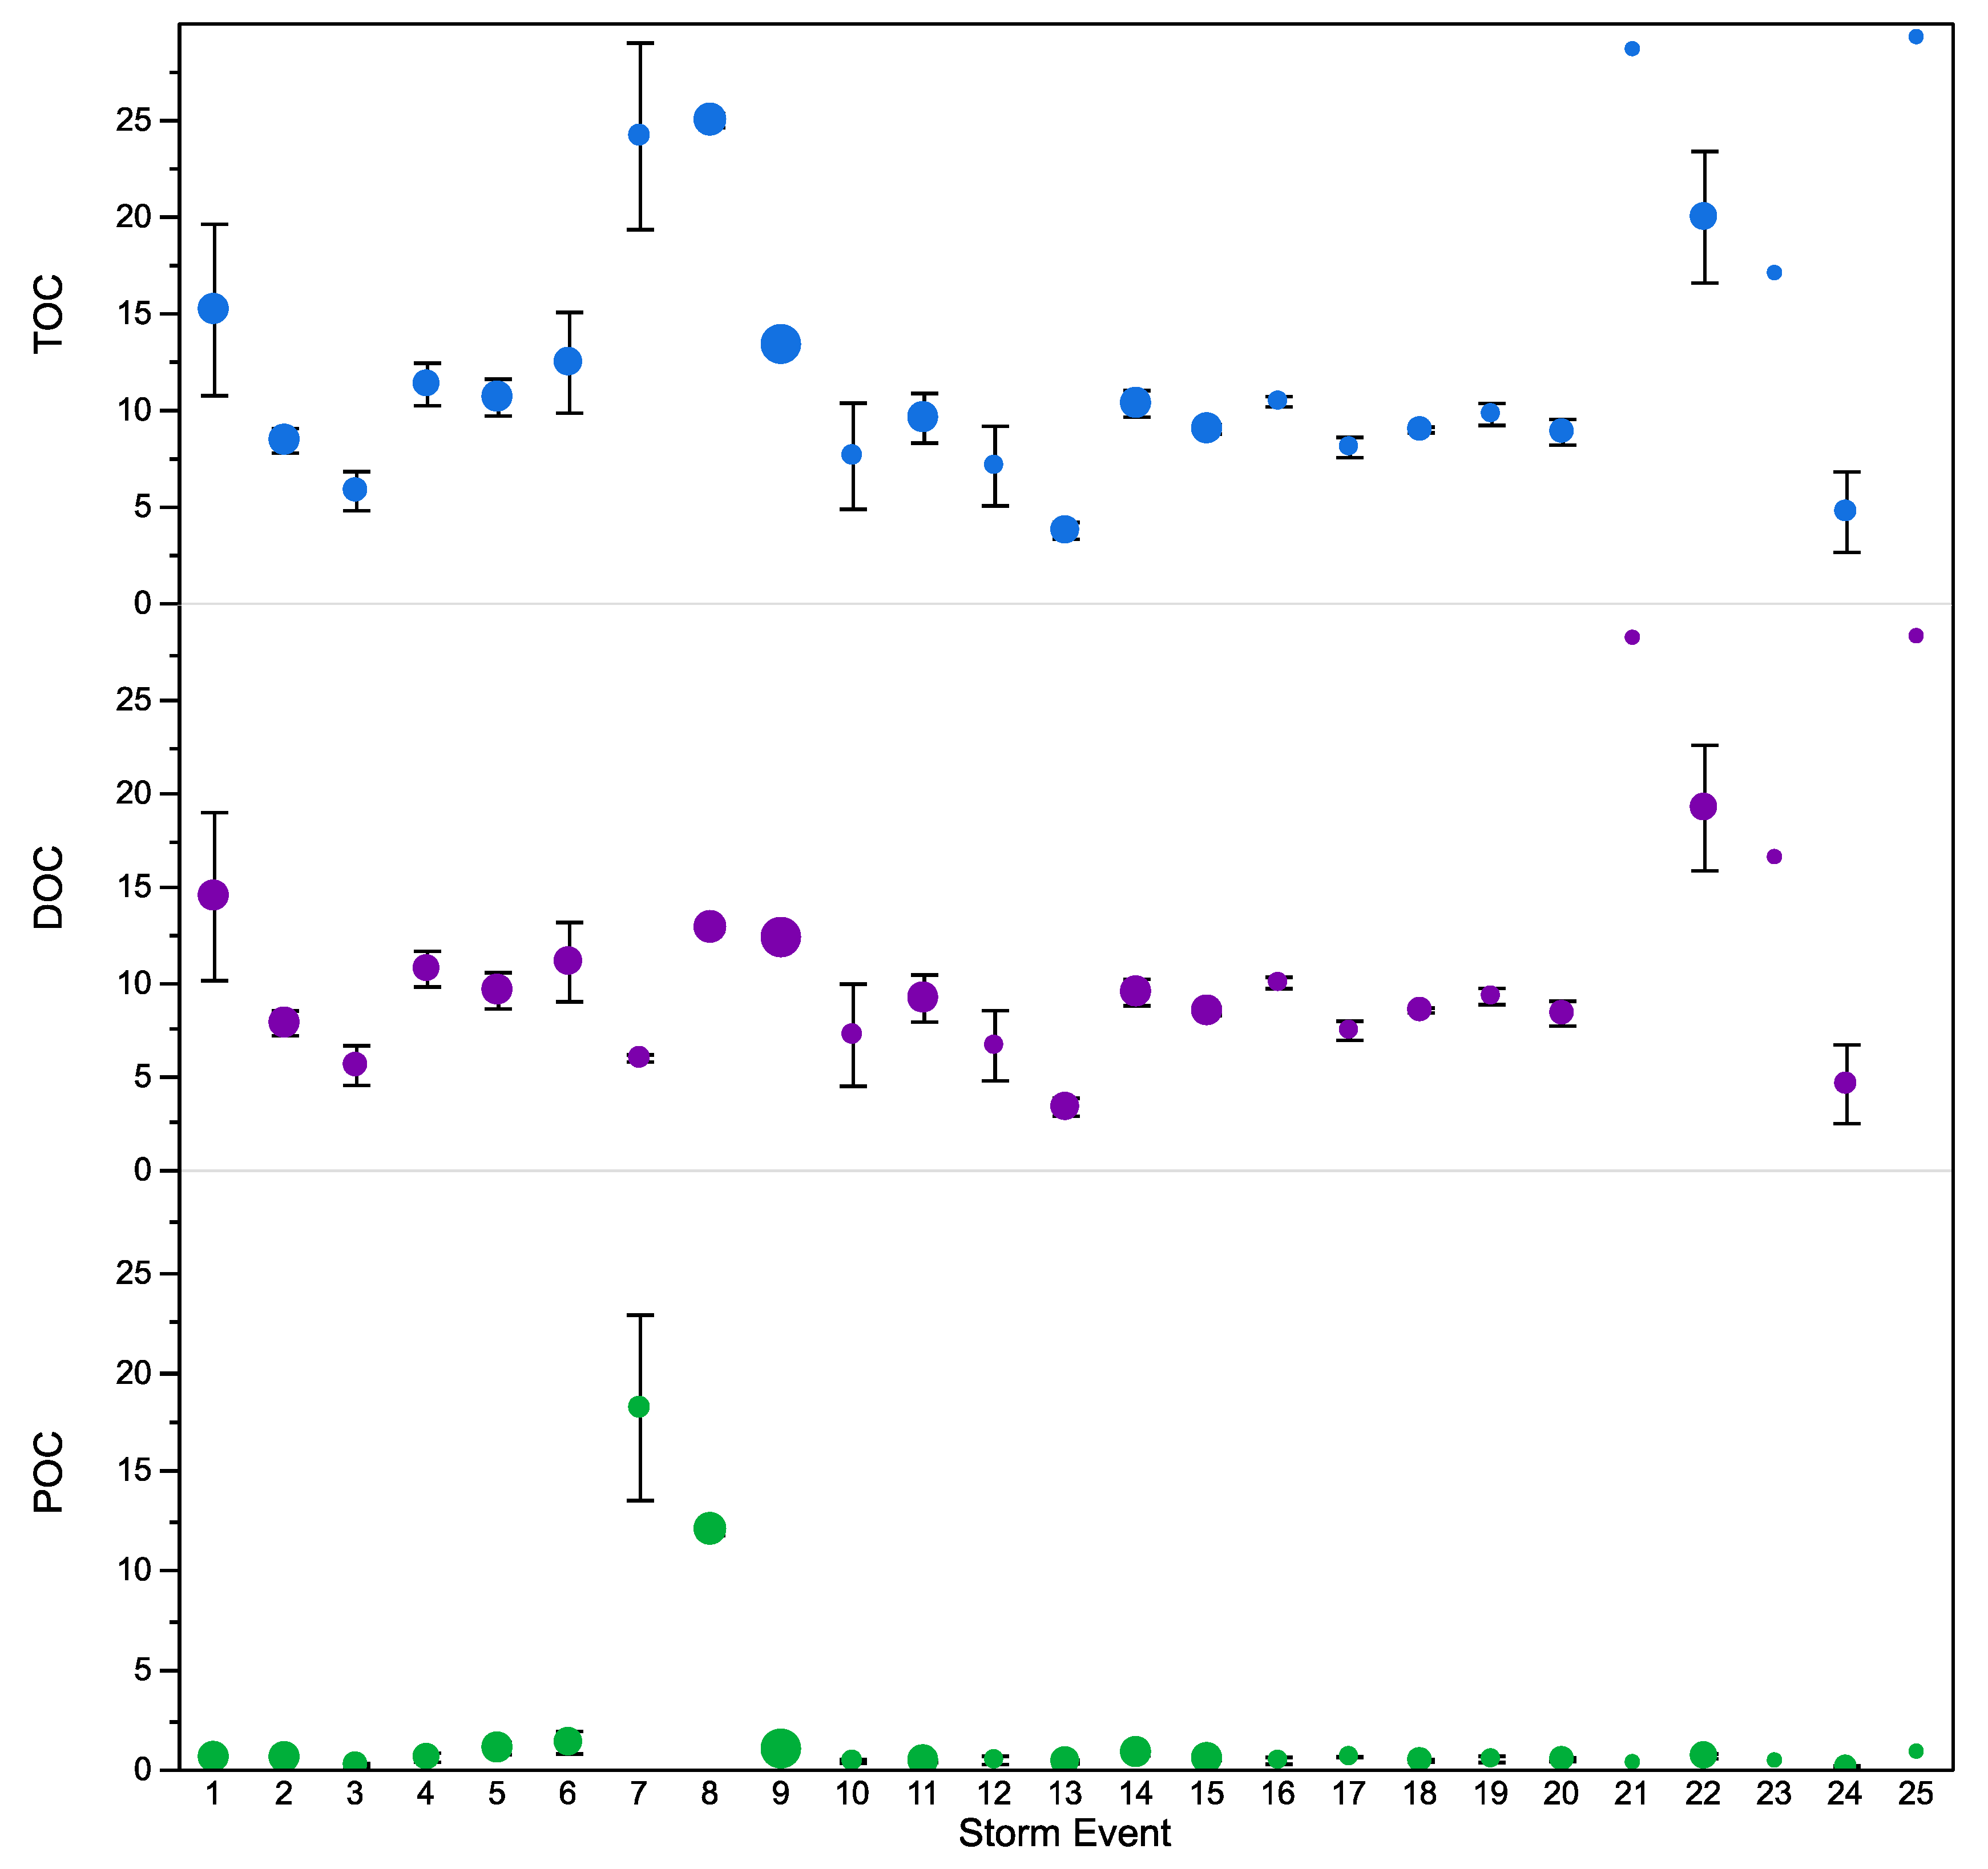
Concentrations of DOC, POC, and TOC showed temporal variation in the stormwater runoff samples collected at 10 min intervals (Figure 2) and between storm events over 25 storm events, due to the variable rainfall and runoff flows (Figure 4). Figure S3 shows the relationship between DOC and POC with rainfall and flow in the eight longest storm events. Despite the high variability in concentrations of DOC (3.37 to 28.40 mg L−1) and POC (0.41 to 18.23 mg L−1), a distinct temporal pattern was observed in the dataset, as the highest concentrations were evident shortly after the initiation of storm events, suggesting an initial flush of OC in stormwater runoff. The high concentration was generally followed by a gradual reduction, especially during prolonged storm events, indicating exhaustion of terrestrial OC sources in the residential catchment (Figure S3).
Similar to rainfall, flow, and OC concentrations, the stormwater hydrographs showed significant variations in intensity and duration (Figure S4). Due to the relatively small drainage area (3.89 ha) of the residential catchment, the stormwater runoff flow increased rapidly, following the rainfall peak. The average hydrograph lag time (time for the peak discharge after the highest rainfall) for 25 captured storm events was 38.4 min, whereas, in the eight longest storm events, the lag time ranged from 41 min in event 1 to 89 min in events 9 and 14 (Figure S4).

3.4. Organic Carbon Fractions Export in Stormwater Runoff

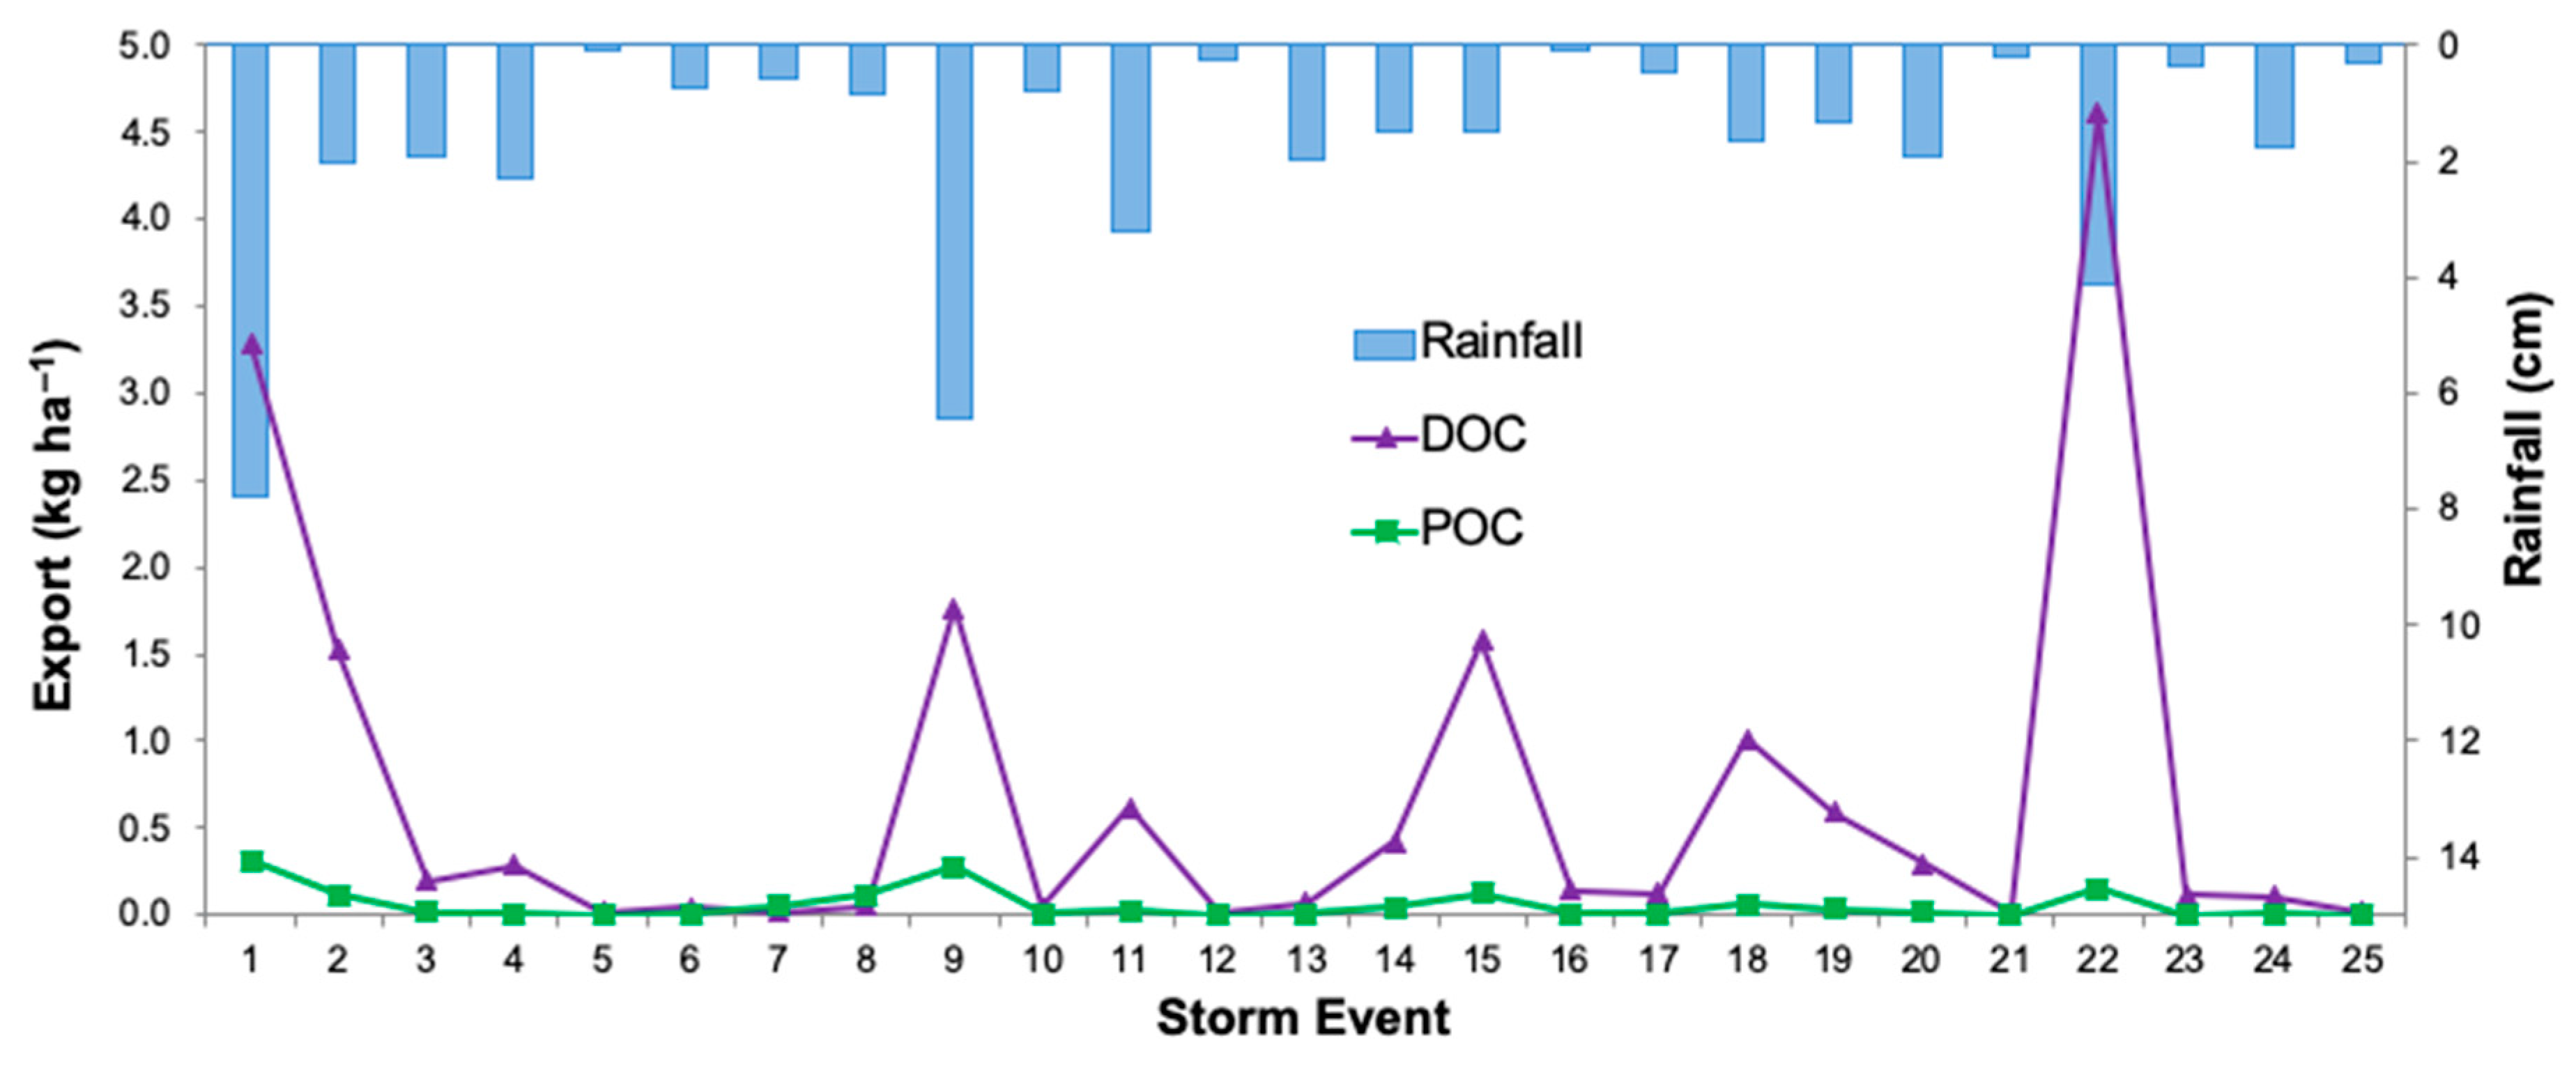
The amount of DOC and POC exported in the 25 storm events from the residential catchment was 16.8 and 1.4 kg ha−1, respectively (Table 3). There was a high variability in DOC and POC influx during the 25 storm events (Figure 5). For example, 70% of the OC was exported during the six longest and most rain-intensive storm events (1, 2, 9, 15, 18, and 22). A seasonal significant (p < 0.05) correlation model was established between flow and DOC loads (r = 0.84), and flow and POC loads (r = 0.87). This was then used to estimate the OC forms export over the entire wet season (June–September) by using the calculated export associated with 25 storm events and estimated export for the remainder of the non-captured storm events during the wet season. The total estimated export during the wet season from the residential catchment was 66.0 kg ha−1 for TOC, of which DOC was 86.2%, and POC was 13.8% (Table 3).

4. Discussion

4.1. Concentrations of DOC and POC in Stormwater Runoff

Urbanization impacts the local watershed hydrology and contributes to accelerated OC export to streams and rivers at regional and global scales, which can then impact downstream water quality [25]. Thus, a better understanding of the factors affecting the transport and transformation of OC in urban waters is needed [26]. Most of the OC in surface waters originates from natural (wetlands, plant material, atmosphere, and soil) and anthropogenic (sewage and septic system) sources.
A comparison of OC forms in the stormwater runoff with Florida urban surface water bodies indicated that DOC concentrations in stormwater runoff (10.51 ± 6.20 mg L−1) were within the range typically observed (5 to 16 mg L−1) in various water bodies in Florida (Table S3). Among OC forms, concentrations of DOC were significantly higher than POC in more than 90% of storm events, with DOC: POC of 9:1 (Figure 3). Wetzel et al. [3] observed that DOC: POC is commonly 10:1 in surface runoff waters, while Alvarez-Cobelas et al. [27] reported that DOC: POC is highly variable. We suggest that higher rainfall and temperature in Florida are likely drivers of higher DOC in stormwater runoff. Research has shown that temperature and precipitation influence DOC concentrations in surface waters and that areas with warmer and more humid climate are more likely to have higher DOC in surface water bodies, as a result of the increase in ecosystem productivity and metabolic rates [28].

4.2. Temporal Variations in Organic Carbon Concentrations in Stormwater Runoff

We found an initial influx of DOC shortly after storm events, followed by a gradual reduction in most storm events (Figure 2; Figure S3). As the rainfall progressed, dilution in OC concentration was evident in 15 storm events. There were three or fewer samples collected in other storm events, which did not provide sufficient data points to evaluate the temporal patterns. Despite the dilution effect of rainfall and associated flow, DOC and POC generally showed a positive correlation. Data from our study suggested that a delay in the hydrograph peak flow was likely due to the infiltration of rainfall in the pervious areas, which, when saturated, led to a gradual increase in surface runoff. This was supported by a steep initial rise in storm hydrographs (Figure S4) due to the relatively small catchment area with 43% impervious surfaces, consisting of roofs and roads. In general, pervious surfaces (grass and tree canopy) play an important role in reducing the amount of stormwater runoff; however, once the soil in the catchment reaches saturation, the rainfall water flows horizontally across the land surface. This is an indicator that rainfall has exceeded the soil infiltration capacity, which then will lead to runoff [29]. Further, the pervious areas can be a major contributor to the variability in the runoff hydrograph and are the main cause for long hydrograph tails in urban environments [29]. Initially, it takes a longer time for pervious areas to become fully saturated, and only then runoff occurs. Stormwater runoff flows slowly through rough surfaces, including turfgrass, and this is why pervious areas increase lag time and decrease high peak discharge, as well as steep rising and falling limbs. Surface runoff in pervious areas is more challenging to predict, as it is dependent on soil, site, and vegetation [29]. Wetzel et al. [3] suggest that an OC first-flush likely occurs in urban areas, especially during initial rainfall following a prolonged dry period. An initial flush could be observed immediately after an intense precipitation event, and then the DOC levels gradually decline due to the dilution effect of rainfall and flow, as observed in 15 storm events.

4.3. Wet Deposition of Organic Carbon in Stormwater Runoff

The OC loss from land depends on a set of drivers, including climate, hydrology, atmospheric chemistry, and vegetation [7]. Another source of OC in surface water bodies is precipitation. The mean DOC concentration in rainfall samples (n = 10) was 2.3 ± 1.68 mg L−1 (Table 2). When these concentrations were compared with stormwater runoff, we observed that 23% of the DOC in stormwater runoff likely originated from precipitation (Table 2). Hinton et al. [30] found that precipitation was a dominant source of DOC, contributing approximately 20% of the DOC concentration in aquatic water bodies. Our data support this observation, as DOC concentrations in rainfall were correlated with DOC in stormwater runoff, and the mean rainfall DOC levels averaged 23% of the mean DOC in stormwater runoff. Our mean DOC concentration from wet deposition was similar to related studies since 1985 (22 studies) that had average DOC of 2.48 ± 2.1 mg L−1 and mean wet deposition of DOC (14 sites) of 2.63 ± 2.1 mg L−1 in North America [15]. Based on these data, we conclude that our rainfall DOC concentrations were similar (95% confidence interval) to current research data (p = 0.685). However, our study did not focus on determining potential OC sources in rainfall. Iavorivska et al. [15] determined that the majority (90%) of the OC is released from terrestrial ecosystems and 30–50% of OC from the wet deposition reaches oceans. They implied that there is an inverse relationship between DOC concentration and precipitation amount, resulting in lower DOC concentrations at the high amount of precipitation. Our study did not identify such patterns but rather a slight positive correlation between rainfall amount and DOC concentrations.

4.4. Organic Carbon Export in Stormwater Runoff from the Residential Catchment

Total (calculated + estimated) load of DOC and POC during the wet season (June–September) was 56.9 and 9.1 kg ha−1, respectively. A significant relationship between flow and DOC loads (r = 0.80; a 95% confidence interval of 0.75 to 0.84) was observed. We compared our data with similar surface water bodies’ research [3], where the average watershed yield of DOC in 13 streams in agricultural areas was 25 kg ha−1 yr−1 and ranged between 2.1 and 92 kg ha−1 yr−1. Moreover, Sickman et al. [31] reported an average DOC yield of 47.7 kg ha−1 yr−1 in several urbanized watersheds, as compared to 10.3 kg ha−1 yr−1 for the whole Sacramento River basin. They concluded that urban watershed exports of DOC were, on average, four times higher than rural watersheds, and that urban watersheds’ DOC exports were similar to coniferous forest biomes (15–75 kg ha−1 yr−1). The DOC export from our small residential catchment during the wet season of four months (56.9 kg ha−1) was much higher as compared to previous research in urbanized areas. For example, Smith et al. [26] reported that, in the northeastern part of the United States, DOC export varied from 8 to 16 kg ha−1 yr−1. Our study reports that there are significantly higher OC concentrations and loads in humid and subtropical urban residential catchments. Therefore, OC stoichiometry research and various strategies to reduce OC transport to urban coastal waters are needed for successful watershed management, to reduce OC loading to water bodies.

4.5. Management Implications of Organic Carbon Transport in Residential Stormwater Runoff

The global mean air temperature by the end of the century is projected to increase between 1.5 and 5.8 °C, which may further accelerate OC export from terrestrial sources via stormwater runoff to surface waters [28]. The historical increase in DOC, which contributes to surface water acidification and C turnover in aquatic environments, demands thorough research and understanding of the present and future challenges [32]. The fluxes of DOC and POC can exacerbate pollutant binding and transport to aquatic systems, which will affect surface water ecology. The abundance of DOC serves as an energy source for bacteria and other microorganisms and can promote denitrification in aquatic environments depending on the C: N within the ecosystem [33]. High DOC levels can have an important effect since DOC absorbs sunlight and prevents it from reaching aquatic plants and phytoplankton [7]. Organic C in drinking water can impact human health as it can react with disinfecting chemicals in water treatment plants and form harmful byproducts [34,35].
Once OC forms find their way in urban water bodies, it is expected that these will be further transported downstream [3]. Impacts of OC in water bodies have been observed, which may especially be detrimental in states like Florida due to the rapid development, agricultural land use, and warm subtropical climate [28]. Understanding the OC concentrations and loads can lead to determine best management practices to reduce OC loading during the first few hours of rain events. The study showed the significance of rainfall contributions of DOC to stormwater runoff. Street sweeping and maintaining green infrastructure that captures and stores runoff waters can be beneficial to reduce OC loading to receiving waters, especially in rainfall events of high amount and duration. Runoff pollution control and successful land-management practices may decrease DOC exports simply by concentrating on strategies that can minimize stormwater runoff and soil erosion. Reduction in DOC export may involve promoting educational practices that limit improper disposal of organic materials which can runoff to surface water bodies. Another approach could be to promote canopy cover and street sweeping in urban landscapes. This may also include a low maintenance plant buffer zone between lawns and the shoreline next to surface water bodies. An alternative preventative method for runoff reduction includes slope gradient reduction before development and engineering ways to direct water spouts to plant beds. The ability to predict future DOC loads and concentrations from urban watersheds to downstream water bodies will be crucial for resource management, development strategies, and future policy decisions to prevent water quality impairment in sensitive ecosystems.

5. Conclusions

We investigated the concentrations, fractions, and loads of OC in stormwater runoff in a residential catchment located in the subtropical climate. The data revealed that DOC was the predominant form, with high concentrations (84% of TOC) and loads (86% of TOC), with the remainder being POC. Our results showed a high variability of OC concentrations and loads during different storm events, as well as positive correlations among rainfall, flow, and loads. First-flush concentration increases in OC forms were evident during multiple storm events, followed by diminishing concentrations due to the runoff dilution and exhaustion of landscape OC sources. The mean DOC (10.51 mg L−1) in stormwater runoff was within range of stream and river data in Florida water bodies. The estimated TOC export in stormwater runoff during the entire wet season (66.0 kg ha−1) was greater than other research in urban watersheds and natural environments. More research is needed to identify sources and sinks of C and the effects of land development on OC transport in urban ecosystems. Further studies should link OC data to nutrient (i.e., N and P) concentrations and their biogeochemical interactions. Concentrations and loads of OC depend on a set of interacting drivers such as climate, vegetation, soils, and atmospheric chemistry. Therefore, improving predictions of OC loads and concentrations will require interdisciplinary approaches, such as long-term observations, new model implementations, and in-depth statistical analysis. Because of the central role that OC plays in aquatic and terrestrial ecosystems, resource managers and policymakers need to understand the implications of changes in OC due to urbanization. Although aquatic scientists have a sufficient understanding of the role of OC, new research is needed to understand the mechanisms driving losses of OC in urban areas to protect water quality in downstream coastal ecosystems.

Supplementary Materials

The following are available online at https://www.mdpi.com/2073-4441/12/4/1031/s1. Figure S1. Detailed land use of residential catchment in Manatee County, Florida, United States. The location map of the catchment was made by using ArcGIS 10.3.1 version. Figure S2. Concentrations of TOC, DOC, and POC in rainfall samples collected in 10 storm events, from May to September 2016. Figure S3. Temporal relationship among DOC, POC, flow, and rainfall during the longest eight storm events between June and September. The primary y-axis displays DOC and POC concentrations in stormwater runoff, the secondary y-axis displays daily flow, the primary x-axis displays the duration of the event, and the secondary x-axis displays rainfall. Figure S4. Stormwater hydrographs for the eight longest storm events during the 2016 wet season. The red arrow shows the hydrograph lag time in minutes. Table S1. Pervious and impervious areas in the residential catchment. Table S2. Rainfall and flow characteristics in 25 storm events during the 2016 wet season. Table S3. Concentrations of DOC in stormwater runoff in this study and previous studies from Florida, United States.

Author Contributions

Conceptualization, G.S.T.; Methodology, G.S.T.; Software, S.K.; Validation, S.K.; Formal Analysis, S.K.; Investigation, S.K.; Resources, G.S.T.; Data Curation, S.K.; Writing – Original Draft Preparation, S.K.; Writing – Review & Editing, G.S.T.; Visualization, S.K.; Supervision, G.S.T.; Project Administration, G.S.T.; Funding Acquisition, G.S.T. All authors have read and agreed to the published version of the manuscript.

Funding

A part of the project (instrumentation at the study site) was funded by a grant from Florida Department of Environmental Protection.

Acknowledgments

We would like to thank residents and staff members of master-planned community of Lakewood Ranch in Bradenton, Florida, for providing complete access to the site and full support over the course of research work. We extend special thanks to Jariani Jani, former Ph.D. student, for her help with analyses of water samples. We would like to personally express gratitude to the Director of Operations at Lakewood Ranch, Paul Chetlain, for his incredible advocacy and assistance for this study.

Conflicts of Interest

The authors declare no conflict of interest.

References

  1. Hale, R.L.; Turnbull, L.; Earl, S.R.; Childers, D.L.; Grimm, N.B. Stormwater infrastructure controls runoff and dissolved material export from arid urban watersheds. Ecosystems 2014, 18, 62–75. [Google Scholar] [CrossRef] [Green Version]
  2. Walsh, C.J.; Fletcher, T.D.; Burns, M.J. Urban stormwater runoff: A new class of environmental flow problem. PLoS ONE 2012, 7, e45814. [Google Scholar] [CrossRef] [PubMed] [Green Version]
  3. Wetzel, R.G. Limnology: Lake and River Ecosystems, 3rd ed.; Academic Press: San Diego, CA, USA, 2010; p. 1006. [Google Scholar]
  4. Yang, Y.-Y.; Toor, G. Sources and mechanisms of nitrate and orthophosphate transport in urban stormwater runoff from residential catchments. Water Res. 2017, 112, 176–184. [Google Scholar] [CrossRef] [PubMed]
  5. Kaushal, S.S.; McDowell, W.; Wollheim, W.; Johnson, T.; Mayer, P.; Belt, K.; Pennino, M.J. Urban evolution: The role of water. Water 2015, 7, 4063–4087. [Google Scholar] [CrossRef]
  6. Kaushal, S.S.; Delaney-Newcomb, K.; Findlay, S.E.G.; Newcomer, T.A.; Duan, S.; Pennino, M.J.; Sivirichi, G.M.; Sides-Raley, A.M.; Walbridge, M.R.; Belt, K.T. Longitudinal patterns in carbon and nitrogen fluxes and stream metabolism along an urban watershed continuum. Biogeochemistry 2014, 121, 23–44. [Google Scholar] [CrossRef]
  7. Solomon, C.T.; Jones, S.E.; Weidel, B.C.; Buffam, I.; Fork, M.L.; Karlsson, J.; Larsen, S.; Lennon, J.T.; Read, J.S.; Sadro, S.; et al. Ecosystem consequences of changing inputs of terrestrial dissolved organic matter to lakes: Current knowledge and future challenges. Ecosystems 2015, 18, 376–389. [Google Scholar] [CrossRef]
  8. Pagano, T.; Bida, M.; Kenny, J. Trends in levels of allochthonous dissolved organic carbon in natural water: A review of potential mechanisms under a changing climate. Water 2014, 6, 2862–2897. [Google Scholar] [CrossRef] [Green Version]
  9. Rodríguez-Cardona, B.; Wymore, A.S.; McDowell, W.H. DOC:NO3-ratios and NO3-uptake in forested headwater streams. J. Geophys. Res. Biogeosci. 2016, 121, 205–217. [Google Scholar] [CrossRef] [Green Version]
  10. Jones, R.I. The influence of humic substances on lacustrine planktonic food chains. Hydrobiologia 1992, 229, 73–91. [Google Scholar] [CrossRef]
  11. Søndergaard, M.; Phillips, G.; Hellsten, S.; Kolada, A.; Ecke, F.; Mäemets, H.; Mjedde, M.; Azzella, M.M.; Oggioni, A. Maximum growing depth of submerged macrophytes in European lakes. Hydrobiologia 2012, 704, 165–177. [Google Scholar] [CrossRef]
  12. Kaushal, S.; McDowell, W.H.; Wollheim, W.M. Tracking evolution of urban biogeochemical cycles: Past, present, and future. Biogeochemistry 2014, 121, 1–21. [Google Scholar] [CrossRef]
  13. Deverel, S.J.; Rojstaczer, S. Subsidence of agricultural lands in the Sacramento-San Joaquin delta, California: Role of aqueous and gaseous carbon fluxes. Water Resour. Res. 1996, 32, 2359–2367. [Google Scholar] [CrossRef]
  14. Hallquist, M.; Wenger, J.; Baltensperger, U.; Rudich, Y.; Simpson, D.; Claeys, M.; Dommen, J.; Donahue, N.M.; George, C.; Goldstein, A.H.; et al. The formation, properties and impact of secondary organic aerosol: Current and emerging issues. Atmos. Chem. Phys. 2009, 9, 5155–5236. [Google Scholar] [CrossRef] [Green Version]
  15. Iavorivska, L.; Boyer, E.W.; DeWalle, D.R. Atmospheric deposition of organic carbon via precipitation. Atmos. Environ. 2016, 146, 153–163. [Google Scholar] [CrossRef] [Green Version]
  16. Parr, T.B.; Cronan, C.S.; Ohno, T.; Findlay, S.E.G.; Smith, S.M.C.; Simon, K.S. Urbanization changes the composition and bioavailability of dissolved organic matter in headwater streams. Limnol. Oceanogr. 2015, 60, 885–900. [Google Scholar] [CrossRef] [Green Version]
  17. Kaushal, S.S.; Belt, K.T. The urban watershed continuum: Evolving spatial and temporal dimensions. Urban Ecosyst. 2012, 15, 409–435. [Google Scholar] [CrossRef]
  18. Southwest Florida Water Management District. Manatee River: Comprehensive Watershed Management Plan; Southwest Florida Water Management District: Brookville, FL, USA, 2000; p. 201.
  19. Potter, B.B.; Wimsatt, J.C. USEPA method 415.3: Quantifying TOC, DOC, and SUVA. J. Am. Water Works Assoc. 2012, 104, E358–E369. [Google Scholar] [CrossRef]
  20. Filella, M. Freshwaters: Which NOM matters? Environ. Chem. Lett. 2008, 7, 21–35. [Google Scholar] [CrossRef]
  21. Motulsky, H.; Brown, R. Detecting outliers when fitting data with nonlinear regression-a new method based on robust nonlinear regression and the false discovery rate. BMC Bioinf. 2006, 7, 123. [Google Scholar] [CrossRef] [Green Version]
  22. Gray, D. Derivation of Hydrographs for Small Watersheds from Measurable Characteristics. Research Bulletin (Iowa Agriculture and Home Economics Experiment Station). 1962, Volume 34. No. 506, Article 1. Available online: http://lib.dr.iastate.edu/researchbulletin/vol34/iss506/1 (accessed on 1 March 2020).
  23. Arcement, G.J.; Schneider, V.R. Guide for Selecting Manning’s Roughness Coefficients for Natural Channels and Flood Plains United States Geological Survey Water-Supply Paper 2339. In Water-Supply Paper; 1989. Available online: https://pubs.er.usgs.gov/publication/wsp2339 (accessed on 1 March 2020).
  24. Jani, J.; Yang, Y.-Y.; Lusk, M.G.; Toor, G.S. Composition of nitrogen in urban residential stormwater runoff: Concentrations, loads, and source characterization of nitrate and organic nitrogen. PLoS ONE 2020, 15, e0229715. [Google Scholar] [CrossRef] [PubMed] [Green Version]
  25. Stanley, E.H.; Powers, S.M.; Lottig, N.R.; Buffam, I.; Crawford, J.T. Contemporary changes in dissolved organic carbon (DOC) in human-dominated rivers: Is there a role for DOC management? Freshwater Biol. 2012, 57, 26–42. [Google Scholar] [CrossRef]
  26. Smith, R.M.; Kaushal, S.S. Carbon cycle of an urban watershed: Exports, sources, and metabolism. Biogeochemistry 2015, 126, 173–195. [Google Scholar] [CrossRef]
  27. Alvarez-Cobelas, M.; Angeler, D.G.; Sánchez-Carrillo, S.; Almendros-Martin, G. A worldwide view of organic carbon export from catchments. Biogeochemistry 2012, 107, 275–293. [Google Scholar] [CrossRef]
  28. Tian, Y.Q.; Yu, Q.; Feig, A.D.; Ye, C.; Blunden, A. Effects of climate and land-surface processes on terrestrial dissolved organic carbon export to major US coastal rivers. Ecol. Eng. 2013, 54, 192–201. [Google Scholar] [CrossRef]
  29. Seo, Y.; Choi, N.J.; Schmidt, A.R. Contribution of directly connected and isolated impervious areas to urban drainage network hydrographs. Hydrol. Earth Syst. Sci. 2013, 17, 3473–3483. [Google Scholar] [CrossRef] [Green Version]
  30. Hinton, M.J.; Schiff, S.L.; English, M.C. The significance of storms for the concentration and export of dissolved organic carbon from two Precambrian Shield catchments. Biogeochemistry 1997, 36, 67–88. [Google Scholar] [CrossRef]
  31. Sickman, J.O.; Zanoli, M.J.; Mann, H.L. Effects of urbanization on organic carbon loads in the Sacramento River, California. Water Resour. Res. 2007, 43. [Google Scholar] [CrossRef] [Green Version]
  32. Fork, M.L.; Heffernan, J.B. Direct and indirect effects of dissolved organic matter source and concentration on denitrification in northern Florida rivers. Ecosystems 2013, 17, 14–28. [Google Scholar] [CrossRef] [Green Version]
  33. Sterner, R.; Andersen, T.; Elser, J.; Hessen, D.O.; Hood, J.M.; McCauley, E.; Urabe, J. Scale-dependent carbon:nitrogen:phosphorus seston stoichiometry in marine and freshwaters. Limnol. Oceanogr. 2008, 53, 1169–1180. [Google Scholar] [CrossRef]
  34. McPherson, B.F.; Miller, R.L.; Haag, K.H.; Bradner, A. Water Quality in Southern Florida Florida, 1996–98; U.S. Geological Survey Circular 1207; U.S. Geological Survey: Denver, CO, USA, 1997; p. 32. Available online: https://pubs.usgs.gov/circ/circ1207/ (accessed on 1 March 2020).
  35. Chen, Z.; Hu, C.; Comny, R.; Muller-Karger, F.; Swarzenski, P. Colored dissolved organic matter in Tampa Bay, Florida. Mar. Chem. 2007, 104, 98–109. [Google Scholar] [CrossRef]
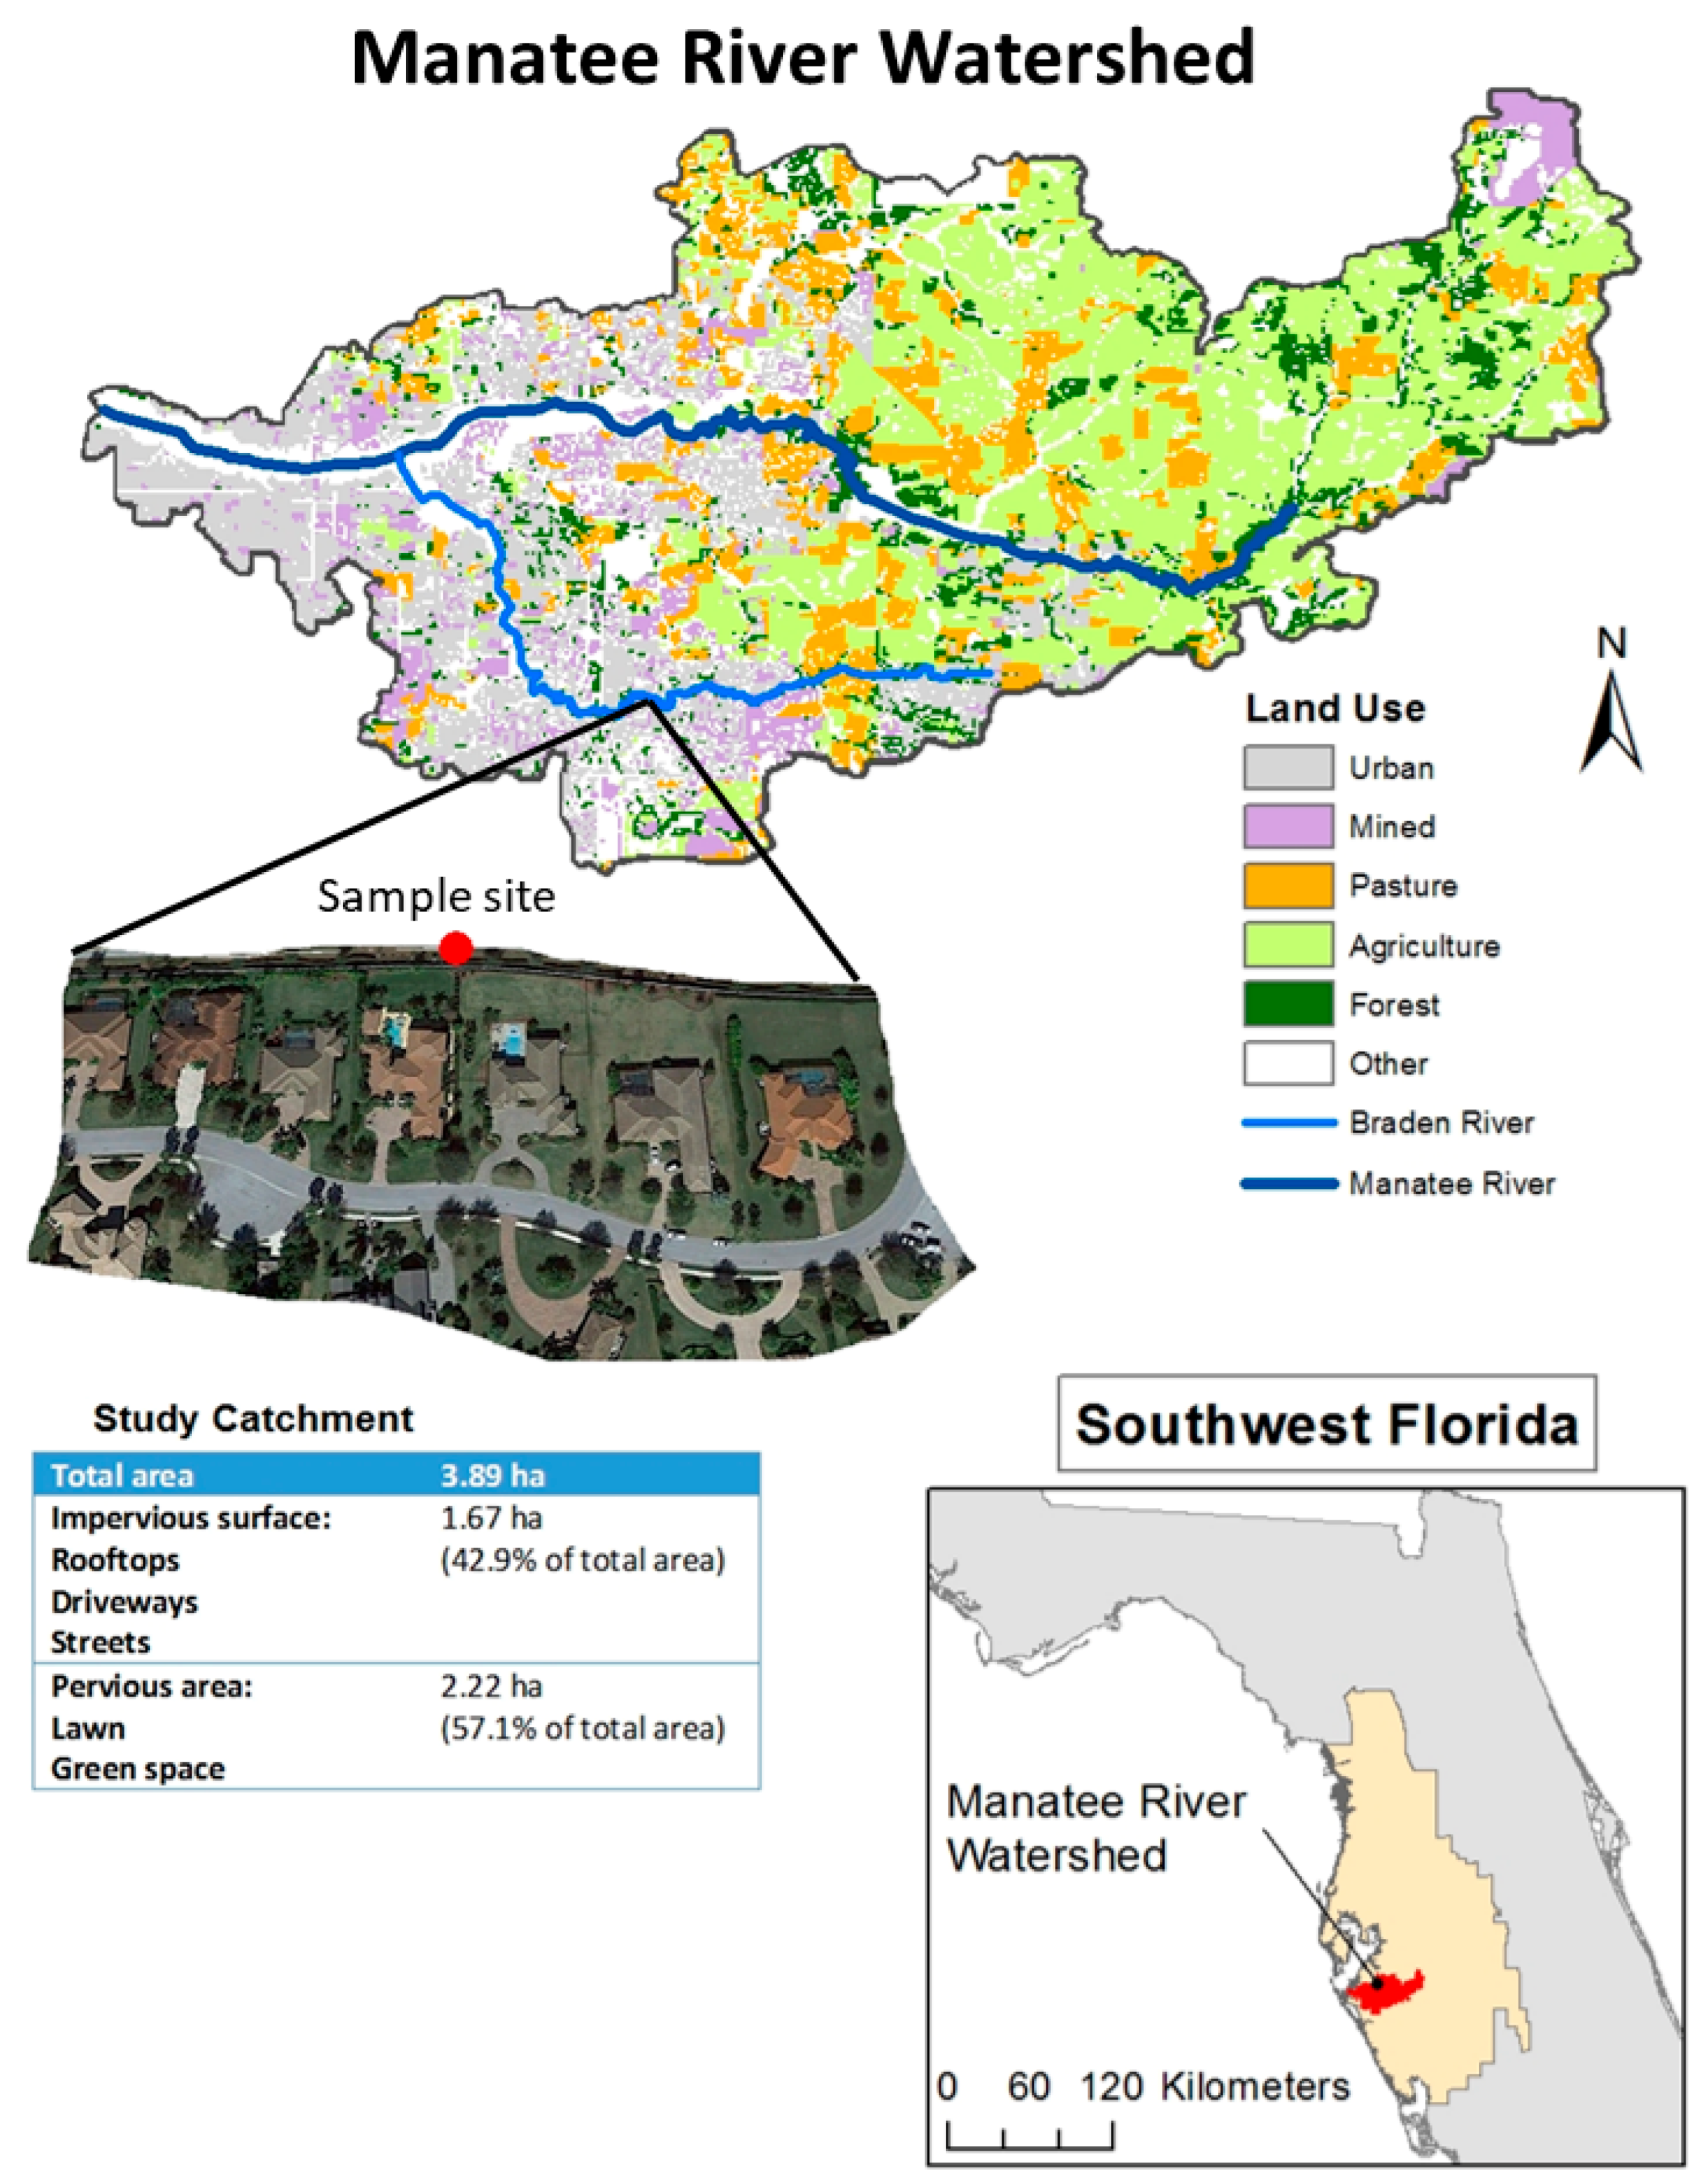
Figure 1. Land use of Manatee River Watershed, study site location, and drainage area of the residential catchment located in Manatee County, Florida, United States. The location map of the catchment was made by using ArcGIS 10.3.1 version.
Water 12 01031 g001
Figure 2. Rainfall, flow, and concentrations of DOC, POC, and TOC in sequentially collected samples at 10 min intervals, in stormwater runoff in 25 storm events, during the 2016 wet season (June–September).
Water 12 01031 g002
Figure 3. Proportions of DOC and POC in stormwater runoff in 25 storm events during the 2016 wet season (June–September).
Water 12 01031 g003
Figure 4. Mean concentration (mg L−1) and standard error of the mean for TOC, DOC, and POC concentrations in stormwater runoff in 25 storm events, during the 2016 wet season (June–September).
Water 12 01031 g004
Figure 5. Total export of DOC and POC in stormwater runoff in individual 25 storm events, during the 2016 wet season (June–September).
Water 12 01031 g005
Table 1. Flow-weighed mean concentration (FWMC), median, range, and standard deviation of DOC, POC, and TOC in urban stormwater runoff in 25 storm events during the 2016 wet season (June–September).
DOC (mg L−1)POC (mg L−1)TOC (mg L−1)DOC:TOCPOC:TOC
FWMC10.512.0112.520.840.16
Median9.480.5610.340.920.08
Minimum3.370.413.78
Maximum28.4018.2329.28
Standard Deviation6.204.057.09
Table 2. Comparison of rainfall and stormwater runoff characteristics in selected 10 storm events during the 2016 wet season.
EventRainfall DOC Concentration (mg L−1)Stormwater runoff DOC Concentration (mg L−1)Percent Rainfall DOC in Stormflow (%)
12.0814.5914
52.899.5830
92.0812.3517
102.027.2128
131.153.3734
140.839.489
191.289.5113
201.178.3514
226.9819.3036
242.254.6049
Mean2.279.8323
Table 3. Export of organic carbon forms over 25 storm events and the wet season, from June to September 2016.
FormCalculated export in 25 storm events (kg ha−1)Estimated export in non-captured storm events (kg ha−1)Total (calculated + estimated) export in wet season (kg ha−1)
DOC16.840.156.9
POC1.47.79.1
TOC18.247.866.0