Tree-Based Modeling Methods to Predict Nitrate Exceedances in the Ogallala Aquifer in Texas

 ,
,  and
and
Abstract
:
1. Introduction
2. Methods
2.1. Logistic Regression (LR)
2.2. Feature Selection for Logistic Regression Model Specification
2.3. Single-Tree-Based Methods
2.3.1. Classification and Regression Trees (CART)
2.3.2. Multi-Adaptive Regression Splines (MARS)
2.4. Ensemble-Based Methods
2.5. Random Forests (RF)
2.6. Gradient Boosting Trees (GBT)
2.7. Model Evaluation and Comparison
2.8. Data Compilation and Predictor Variables Selection
3. Results and Discussion
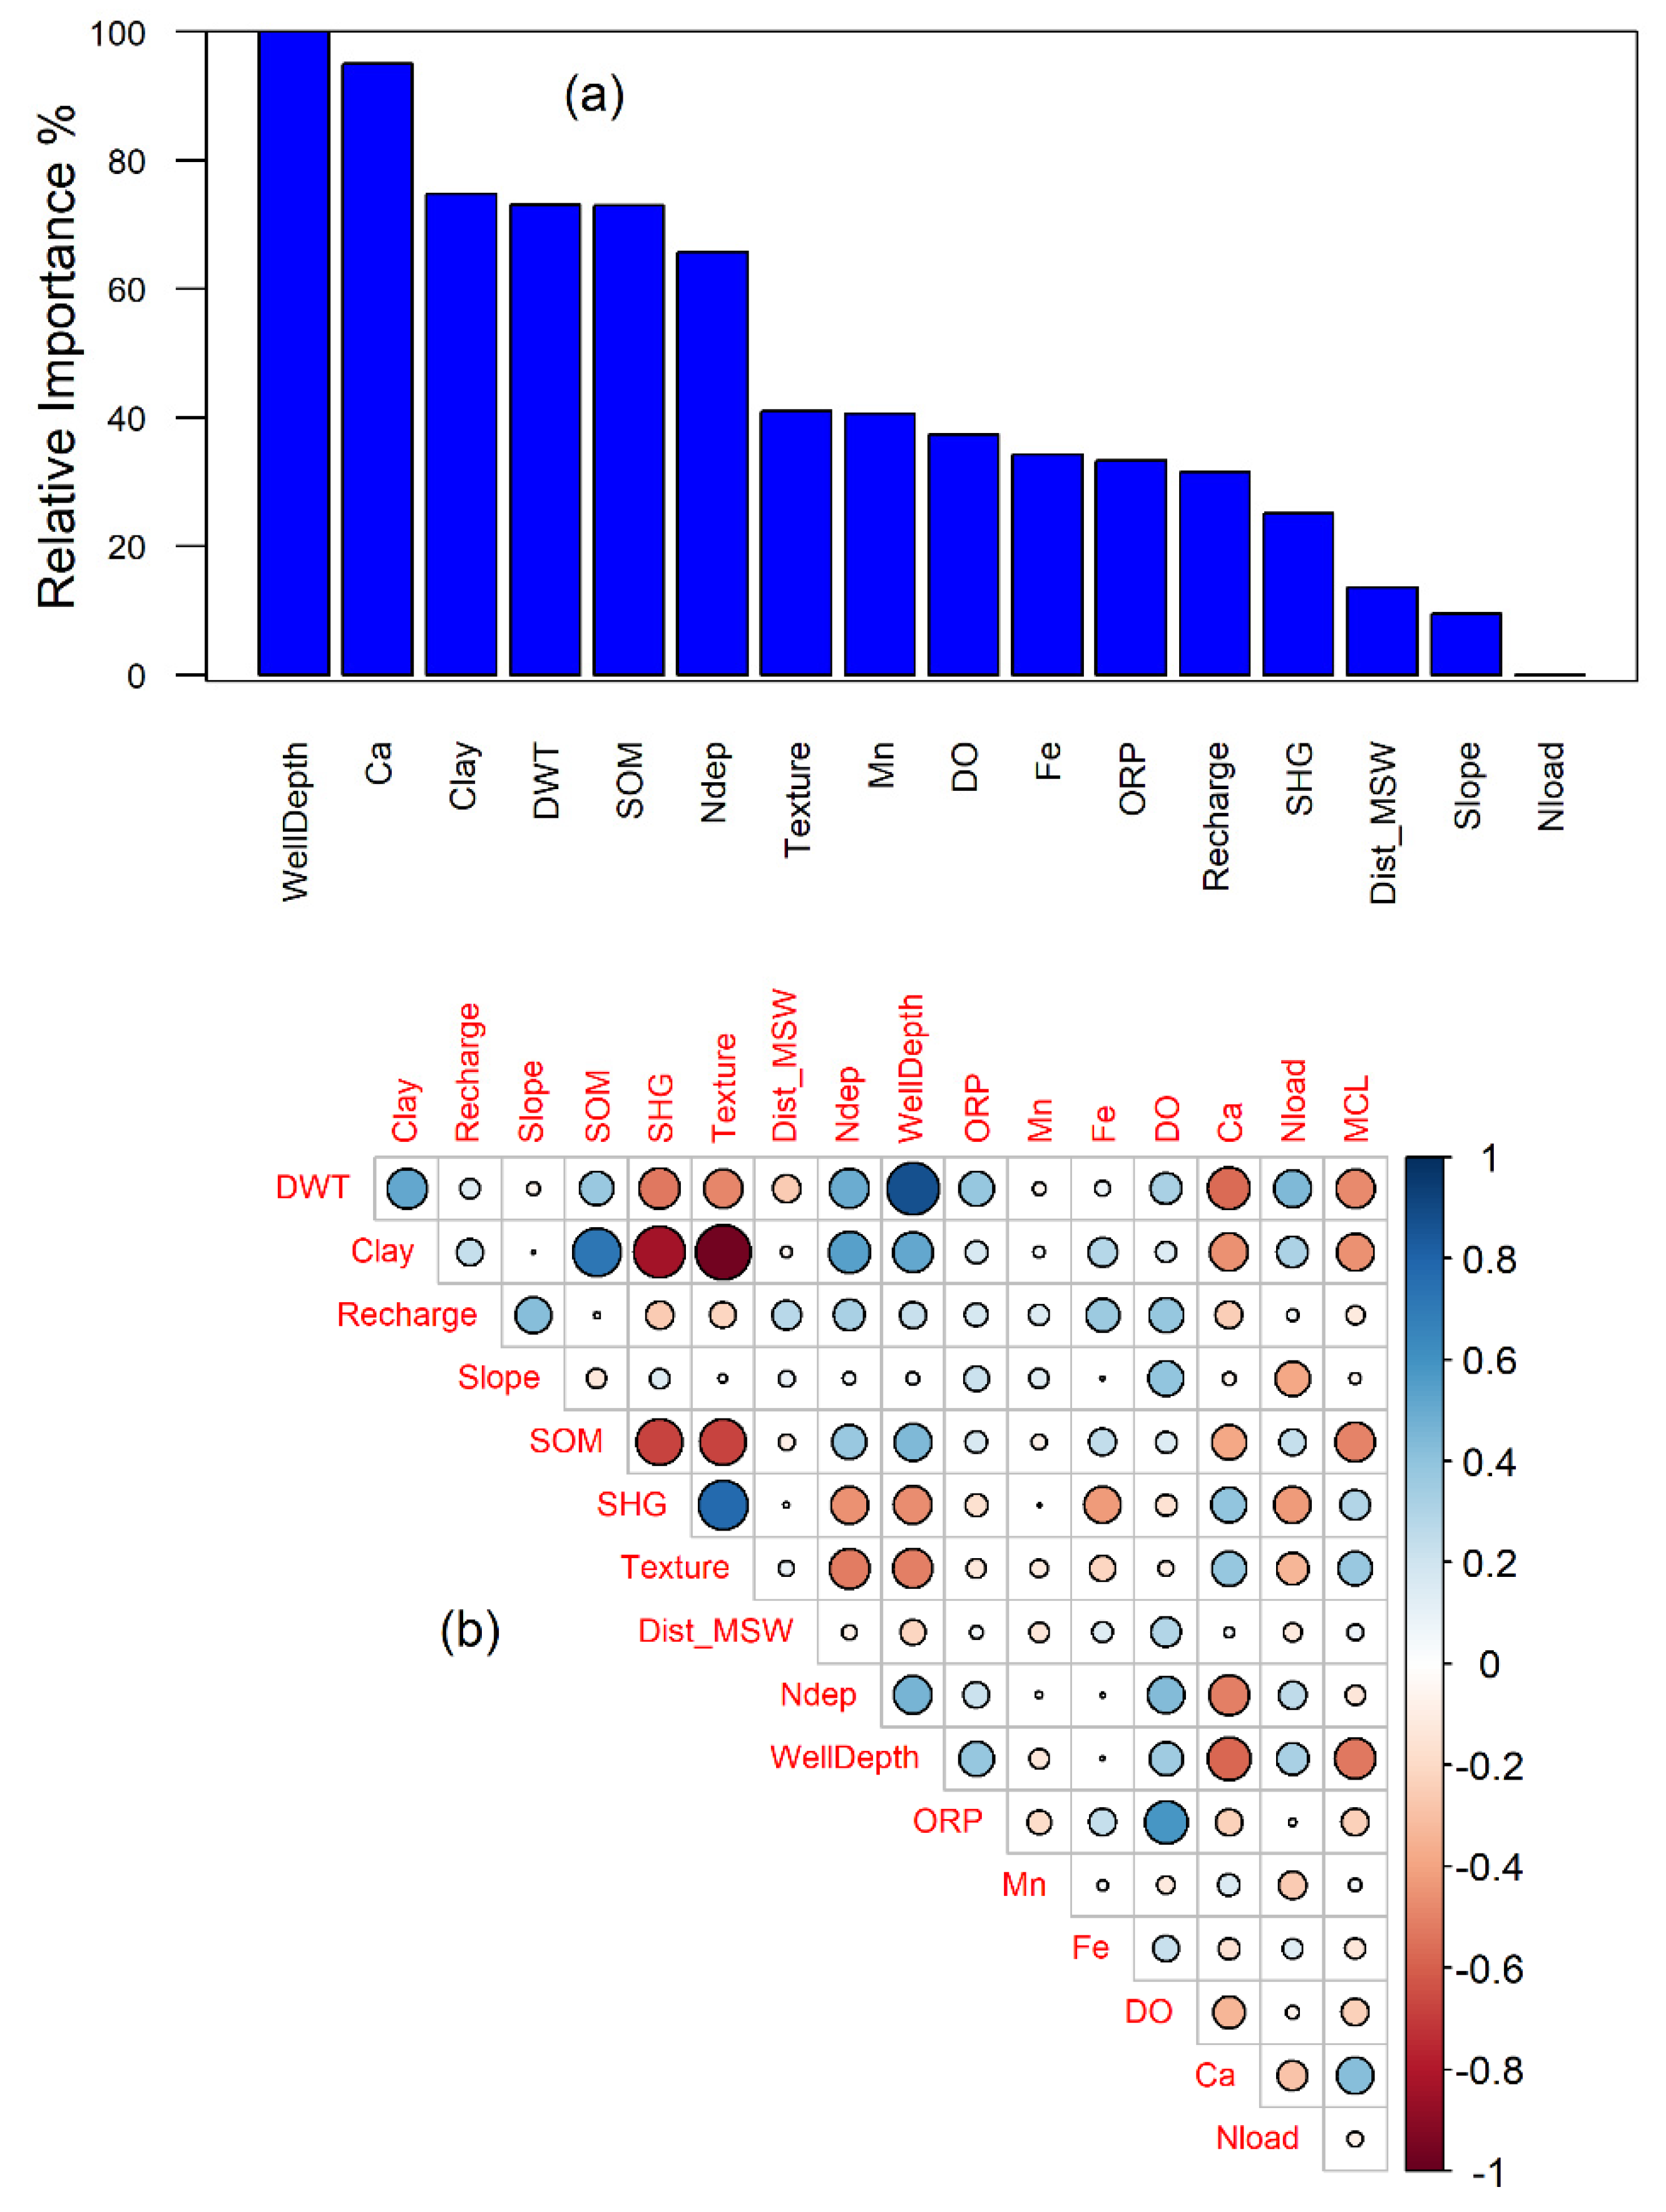
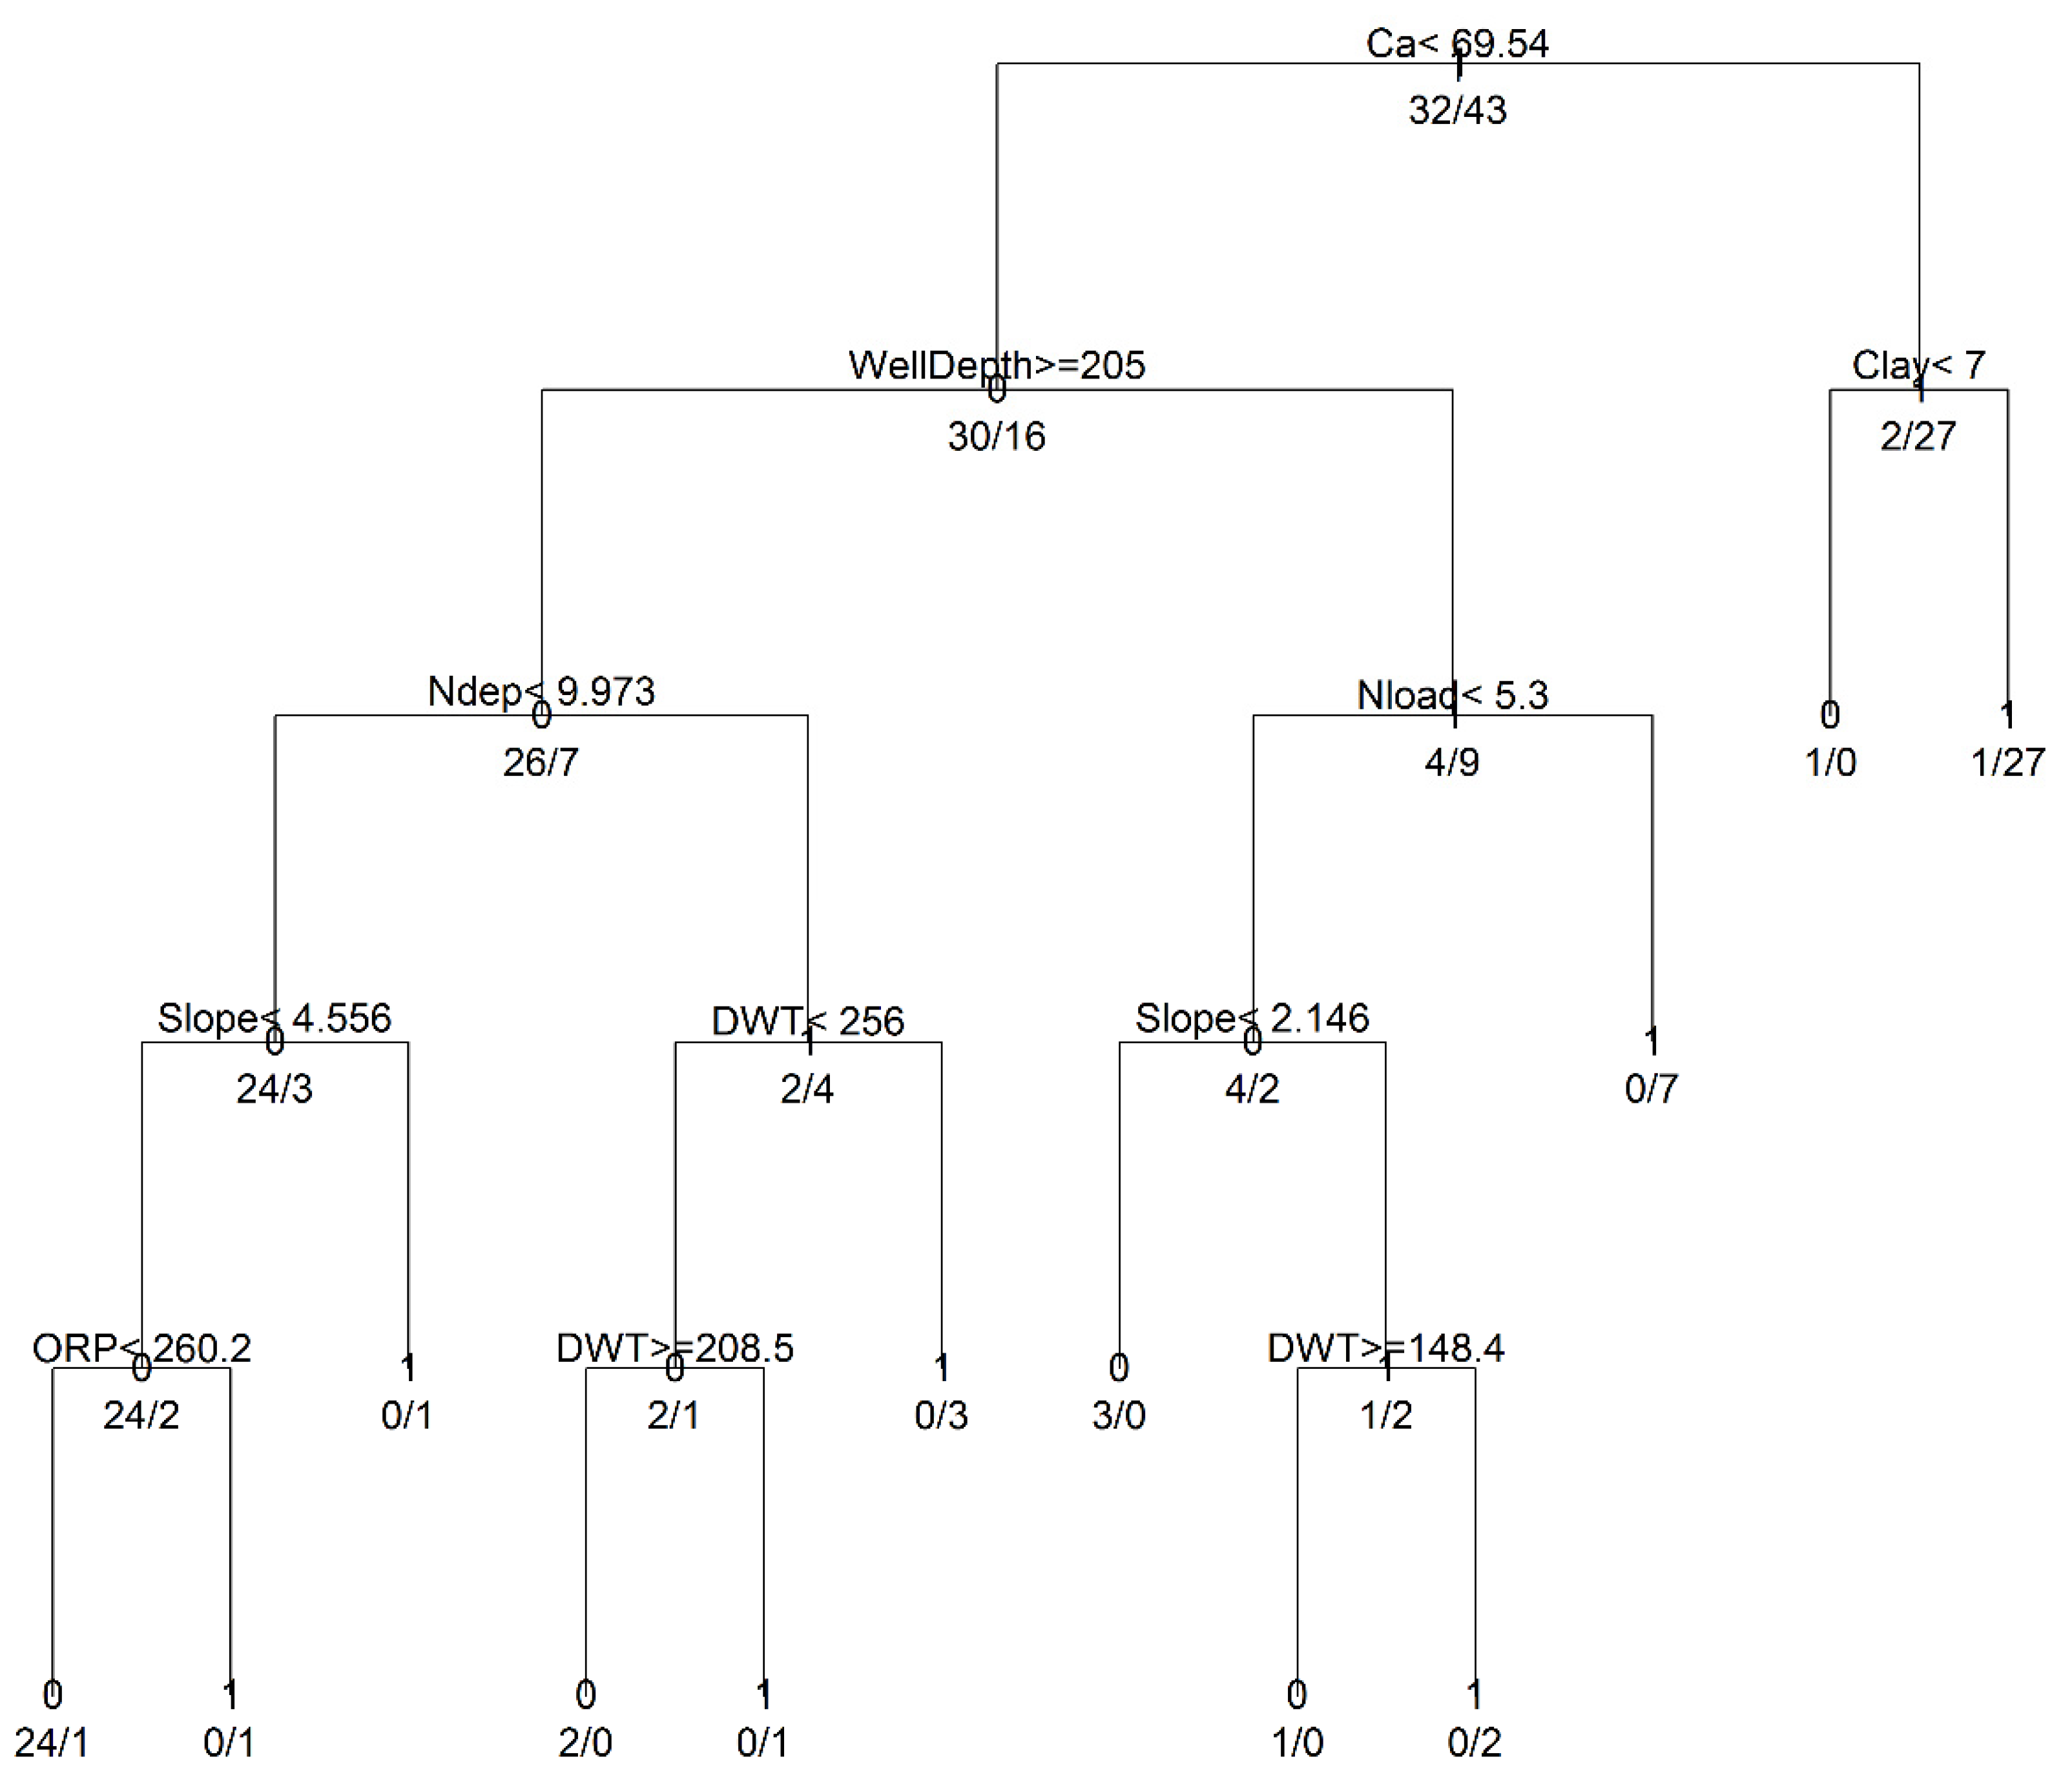
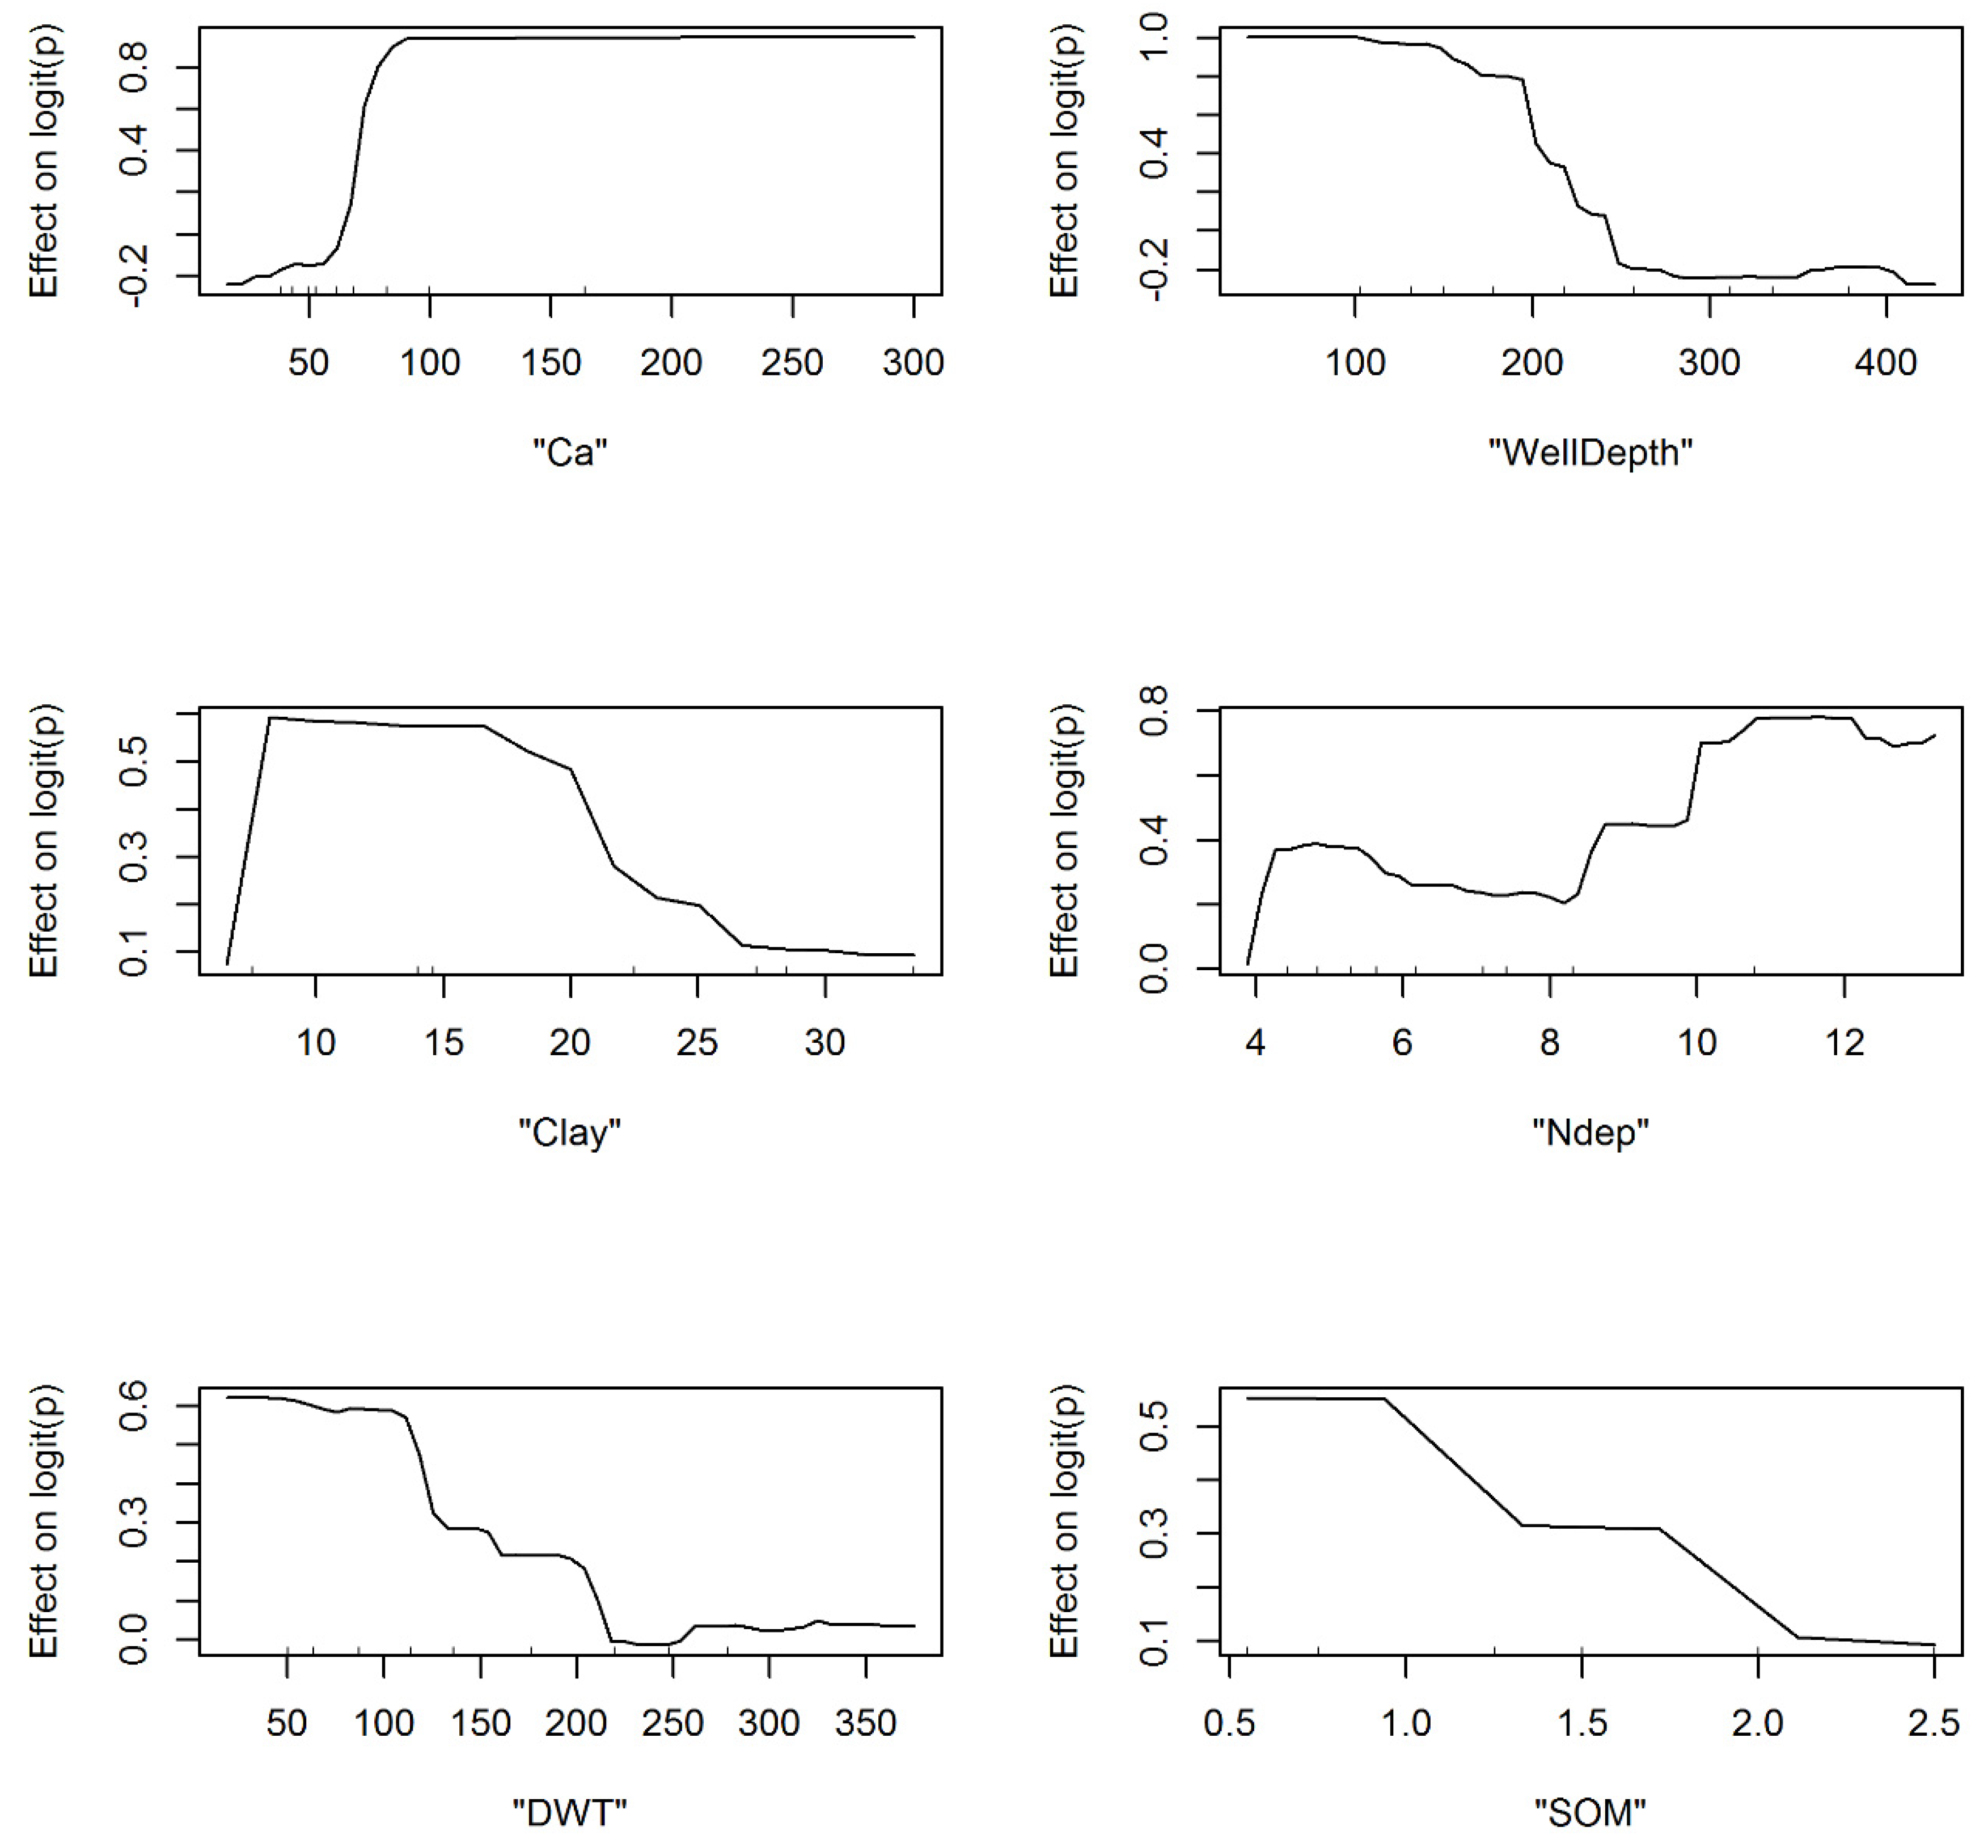
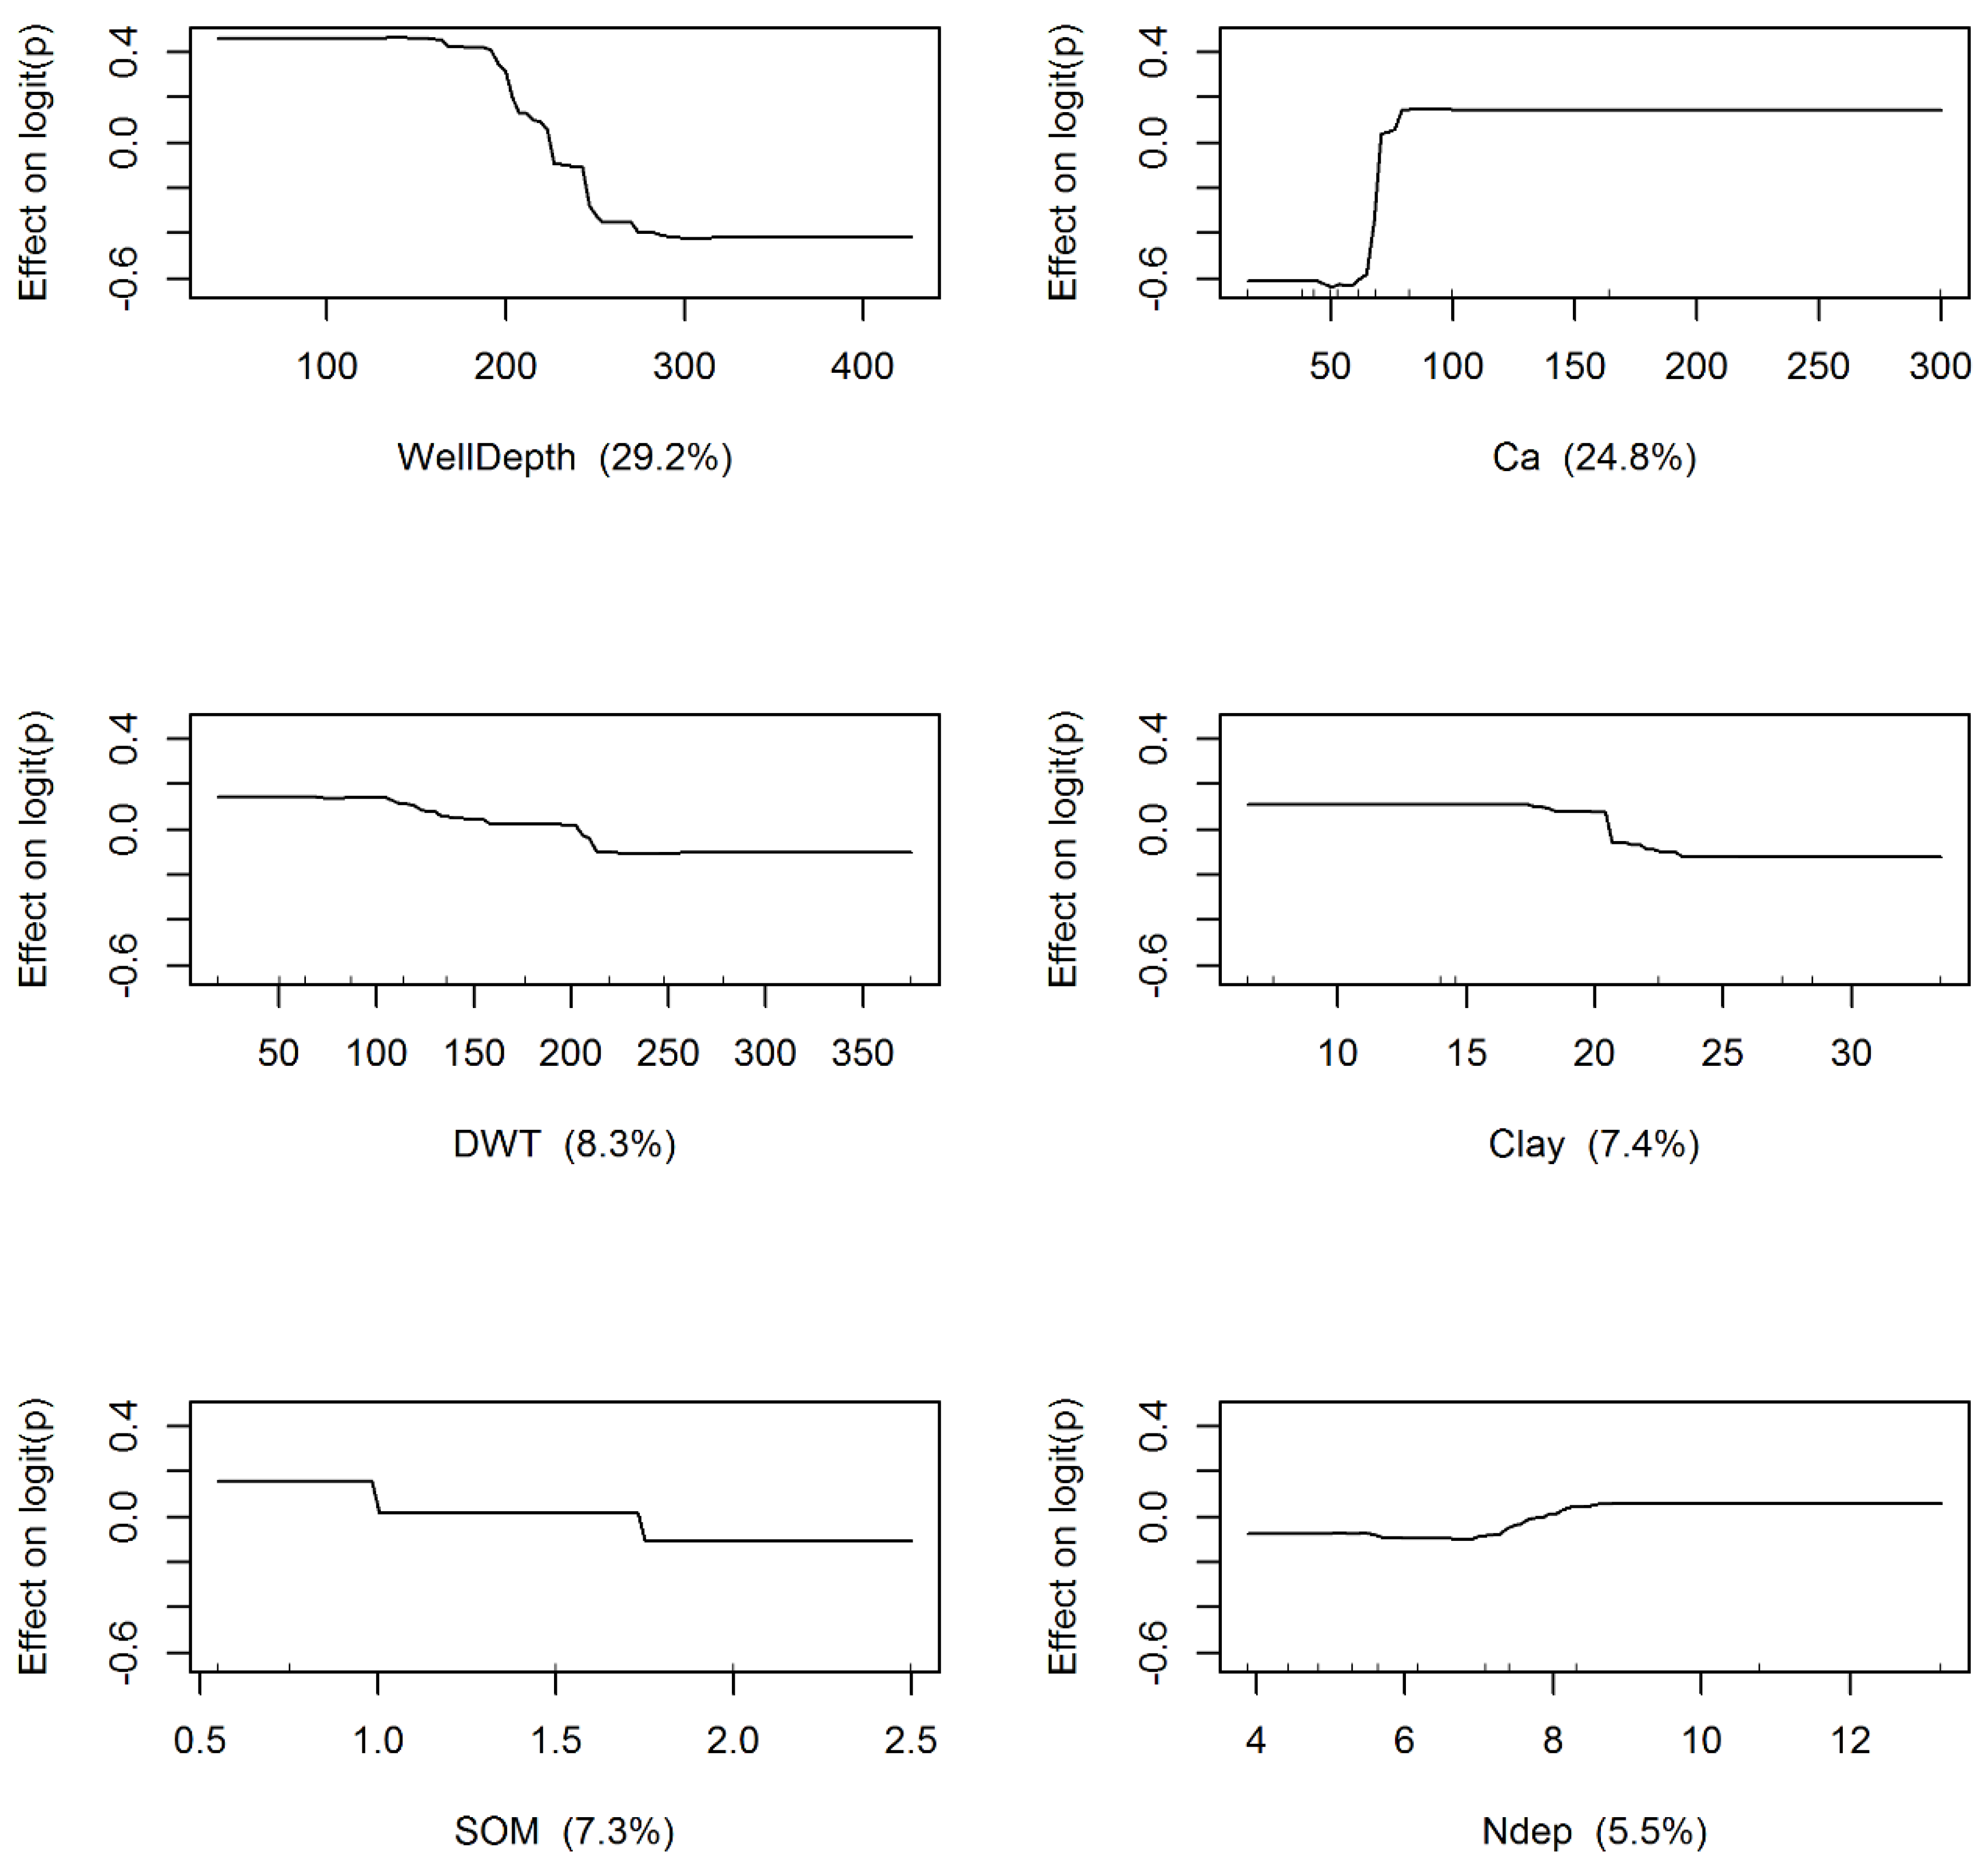
3.1. Model Development and Structural Inferences
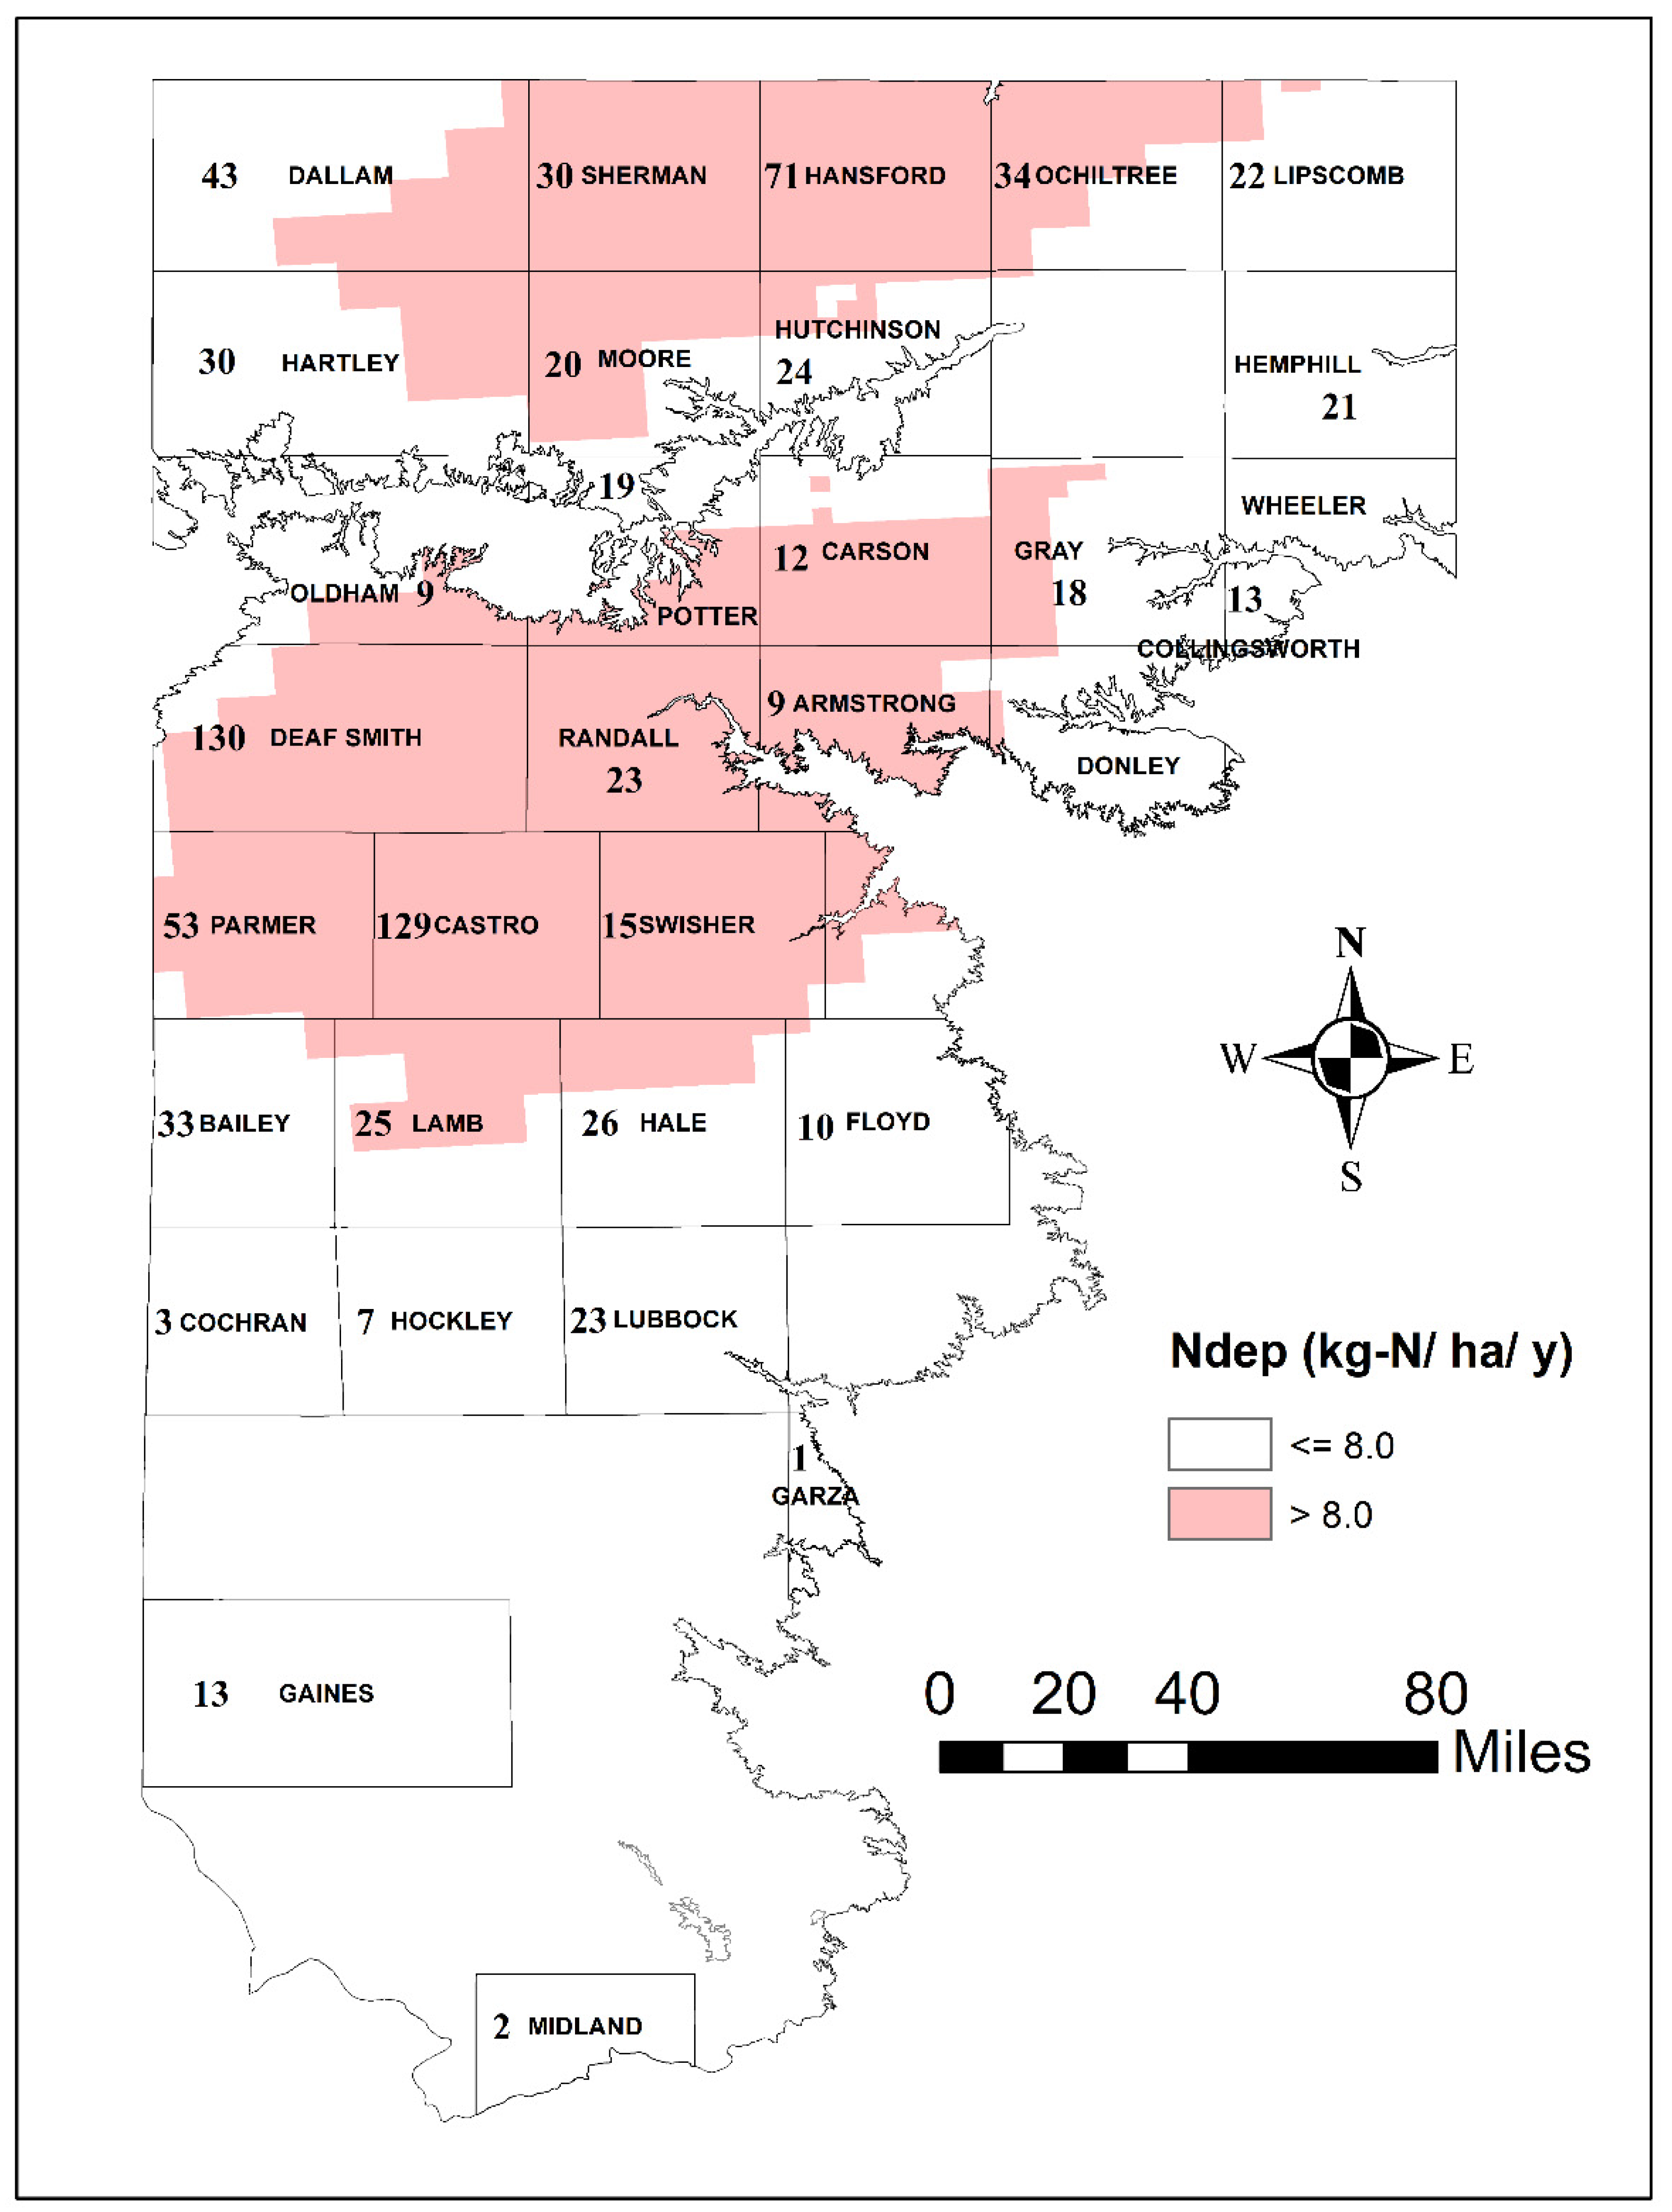
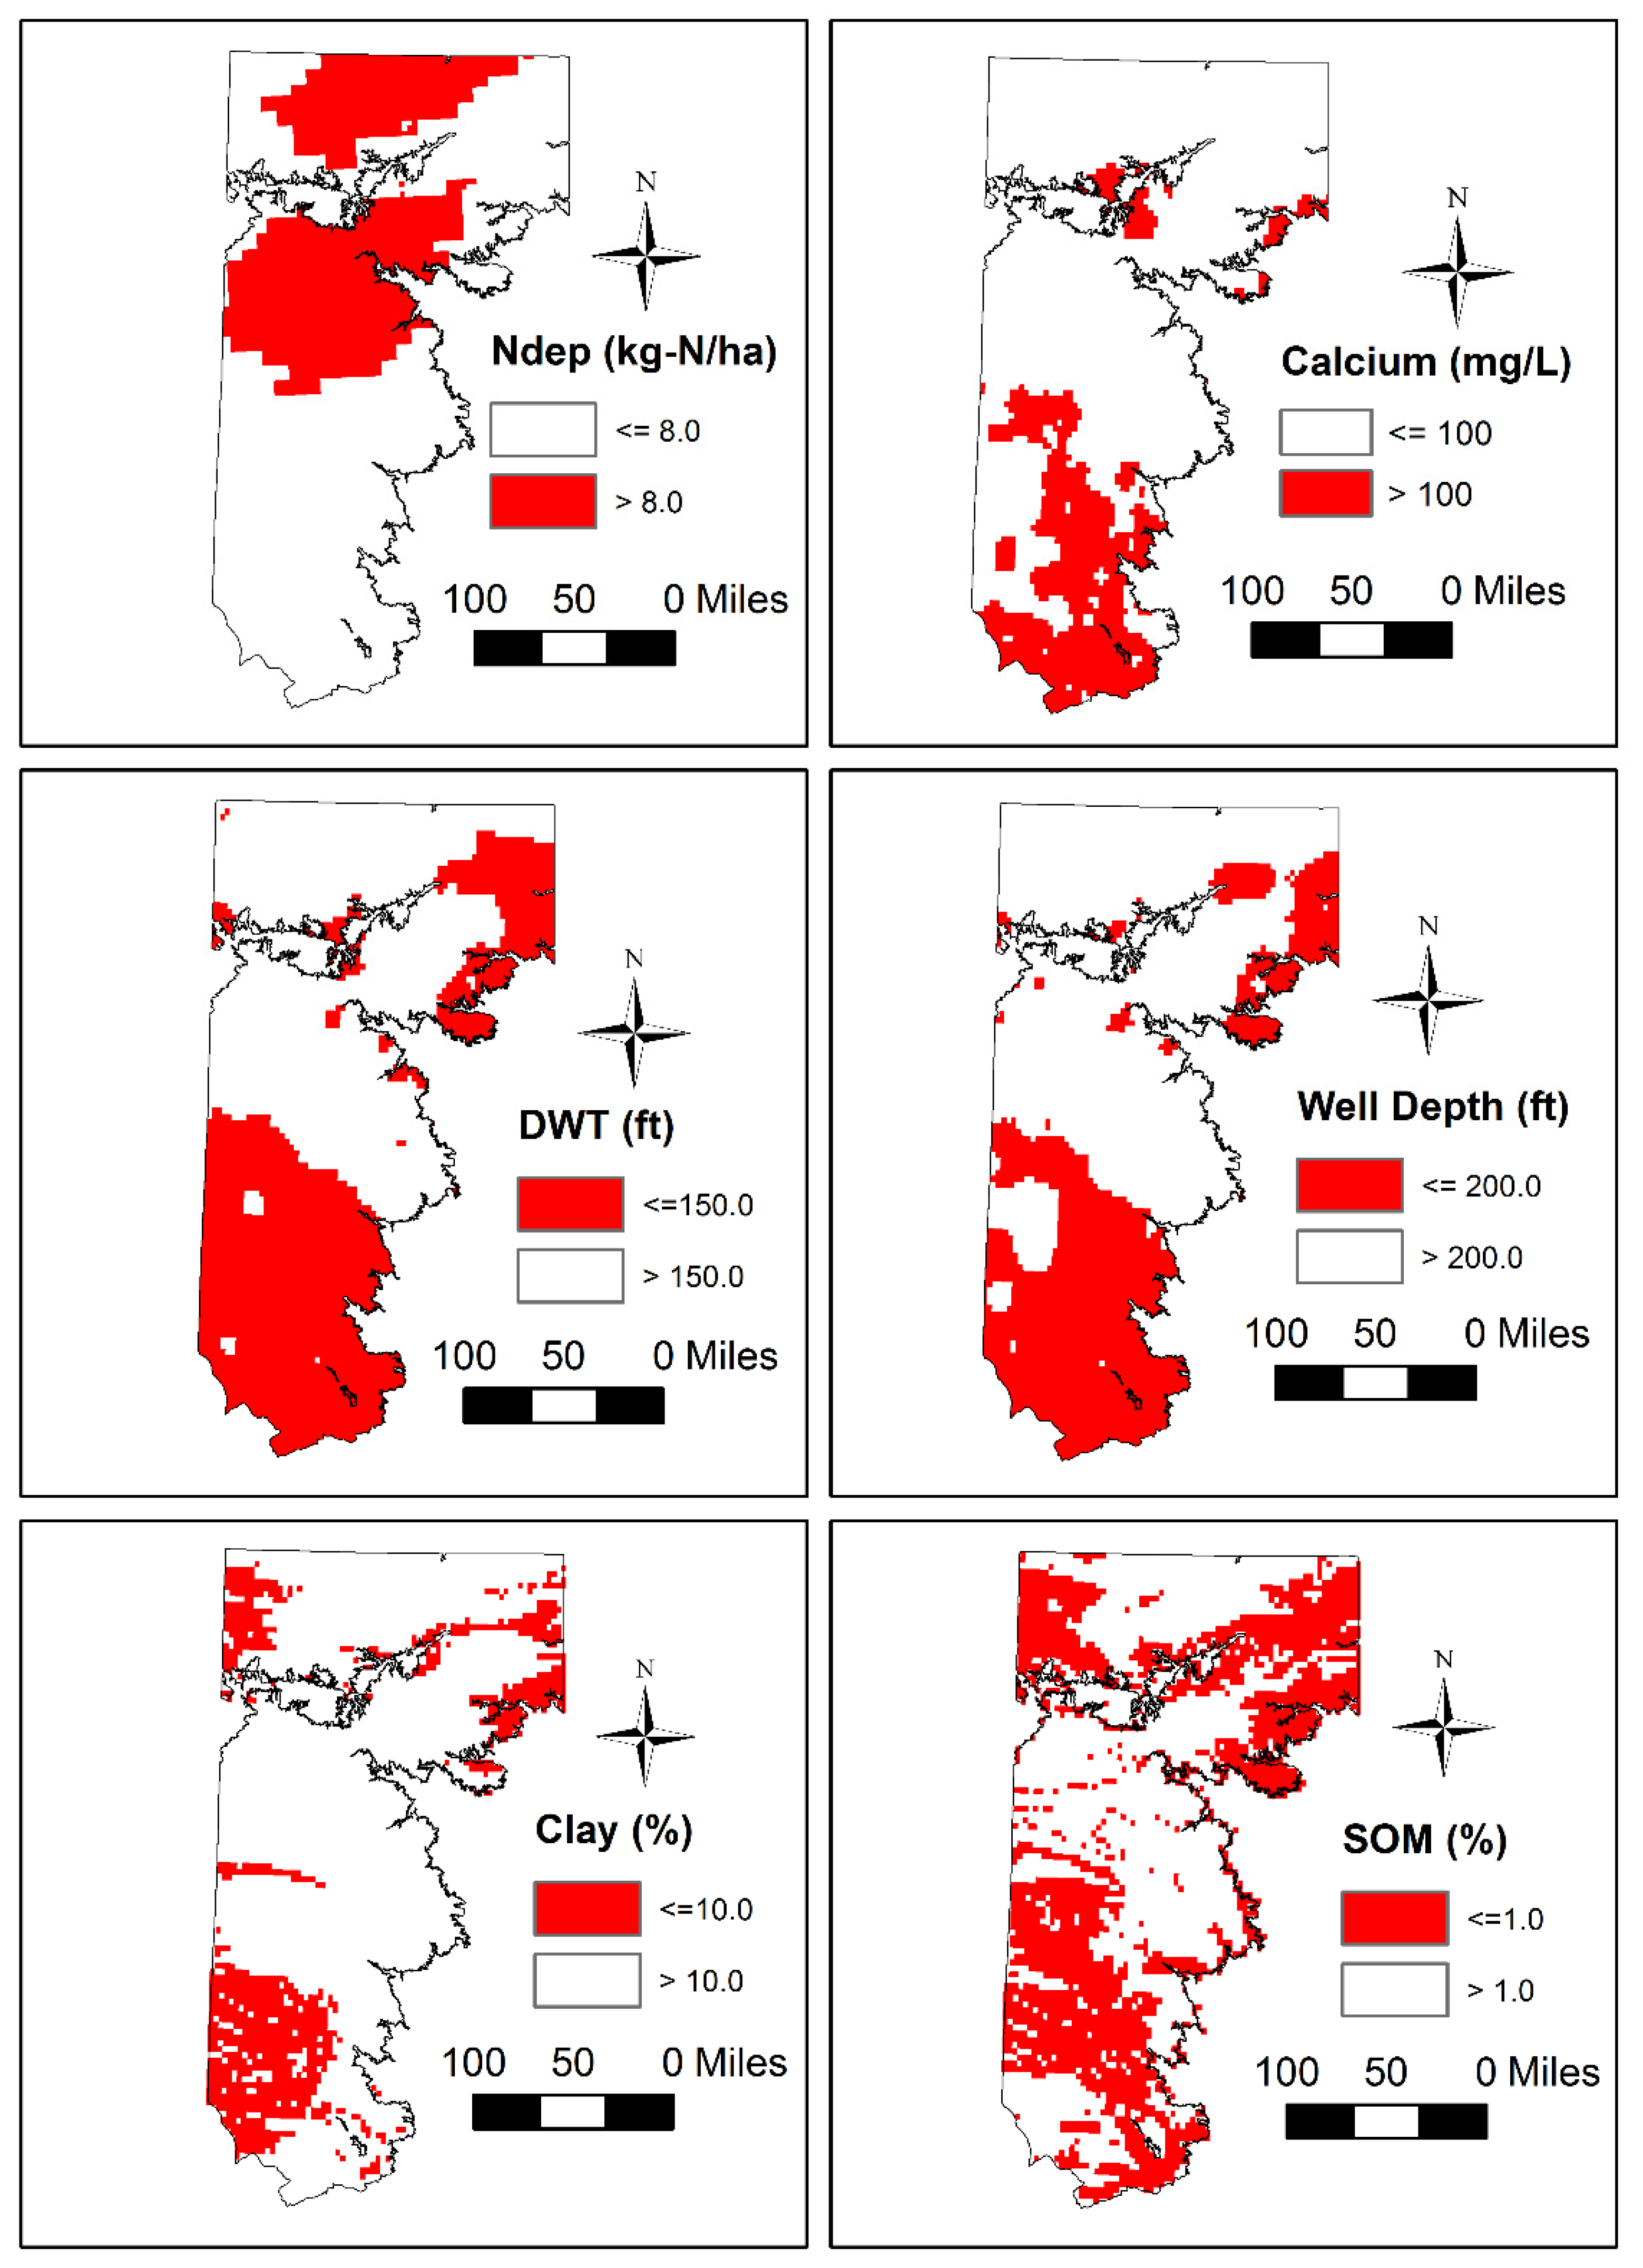
3.2. Spatial Patterns of Controlling Factors
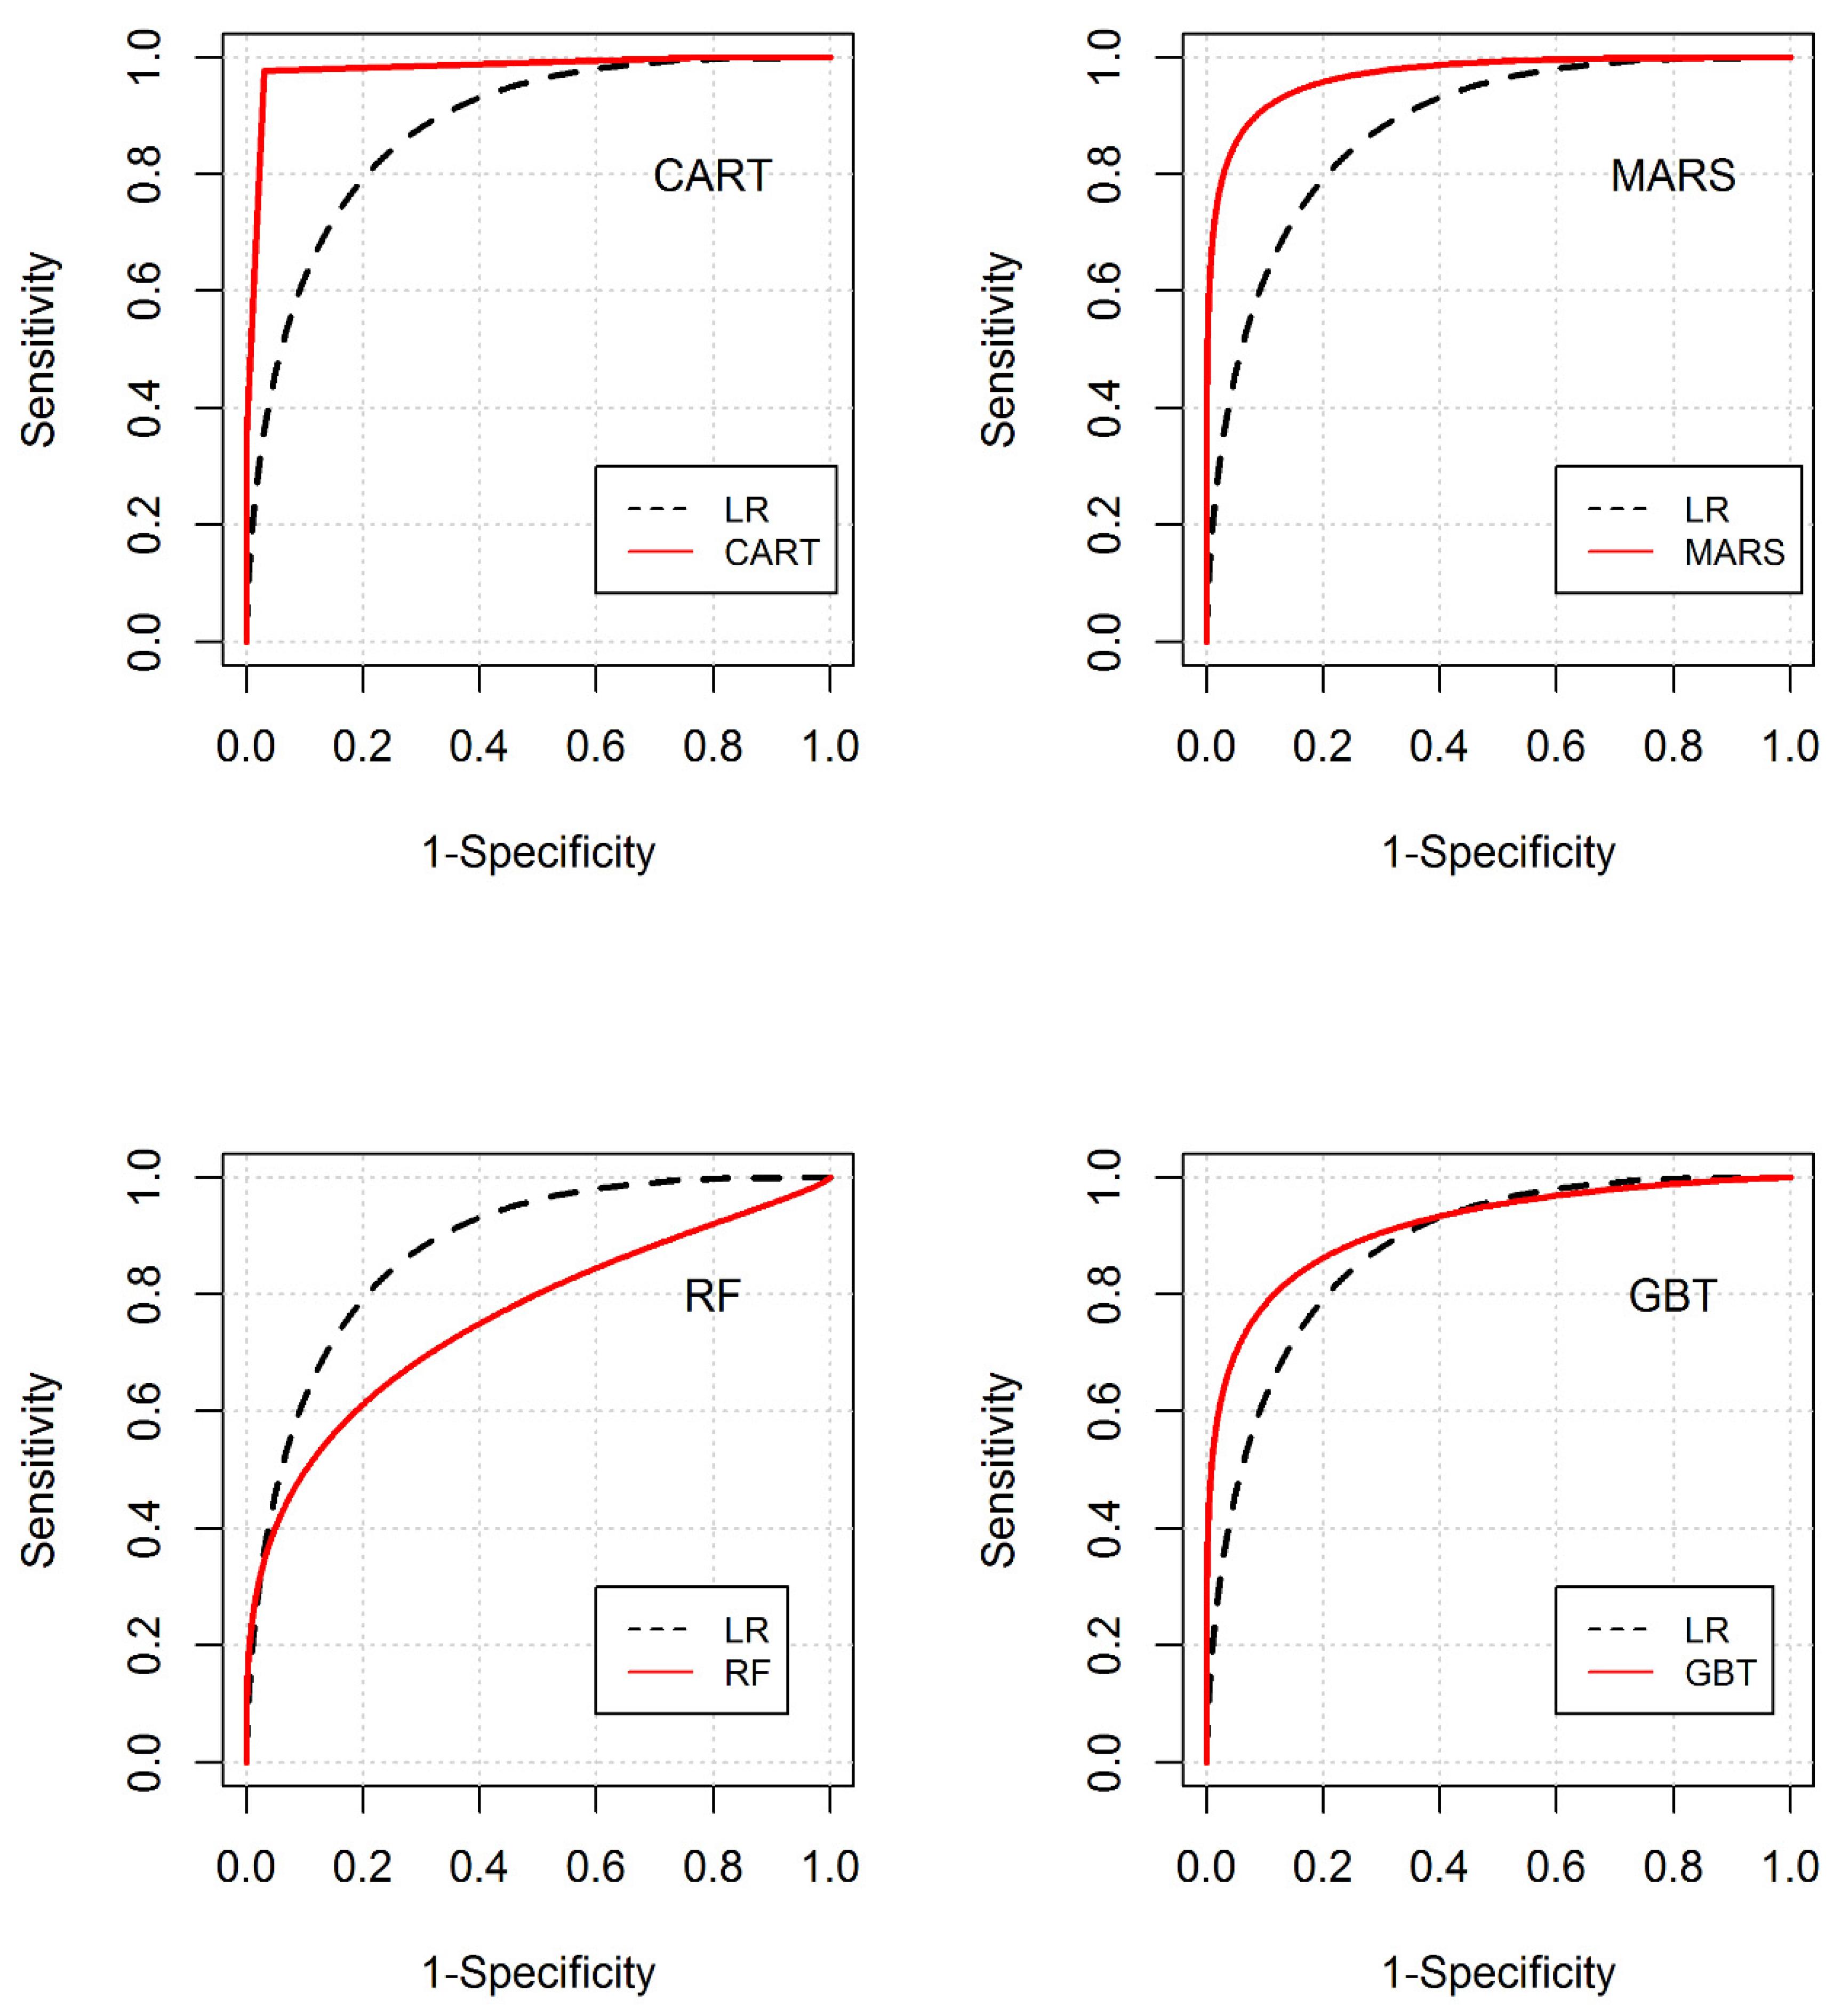
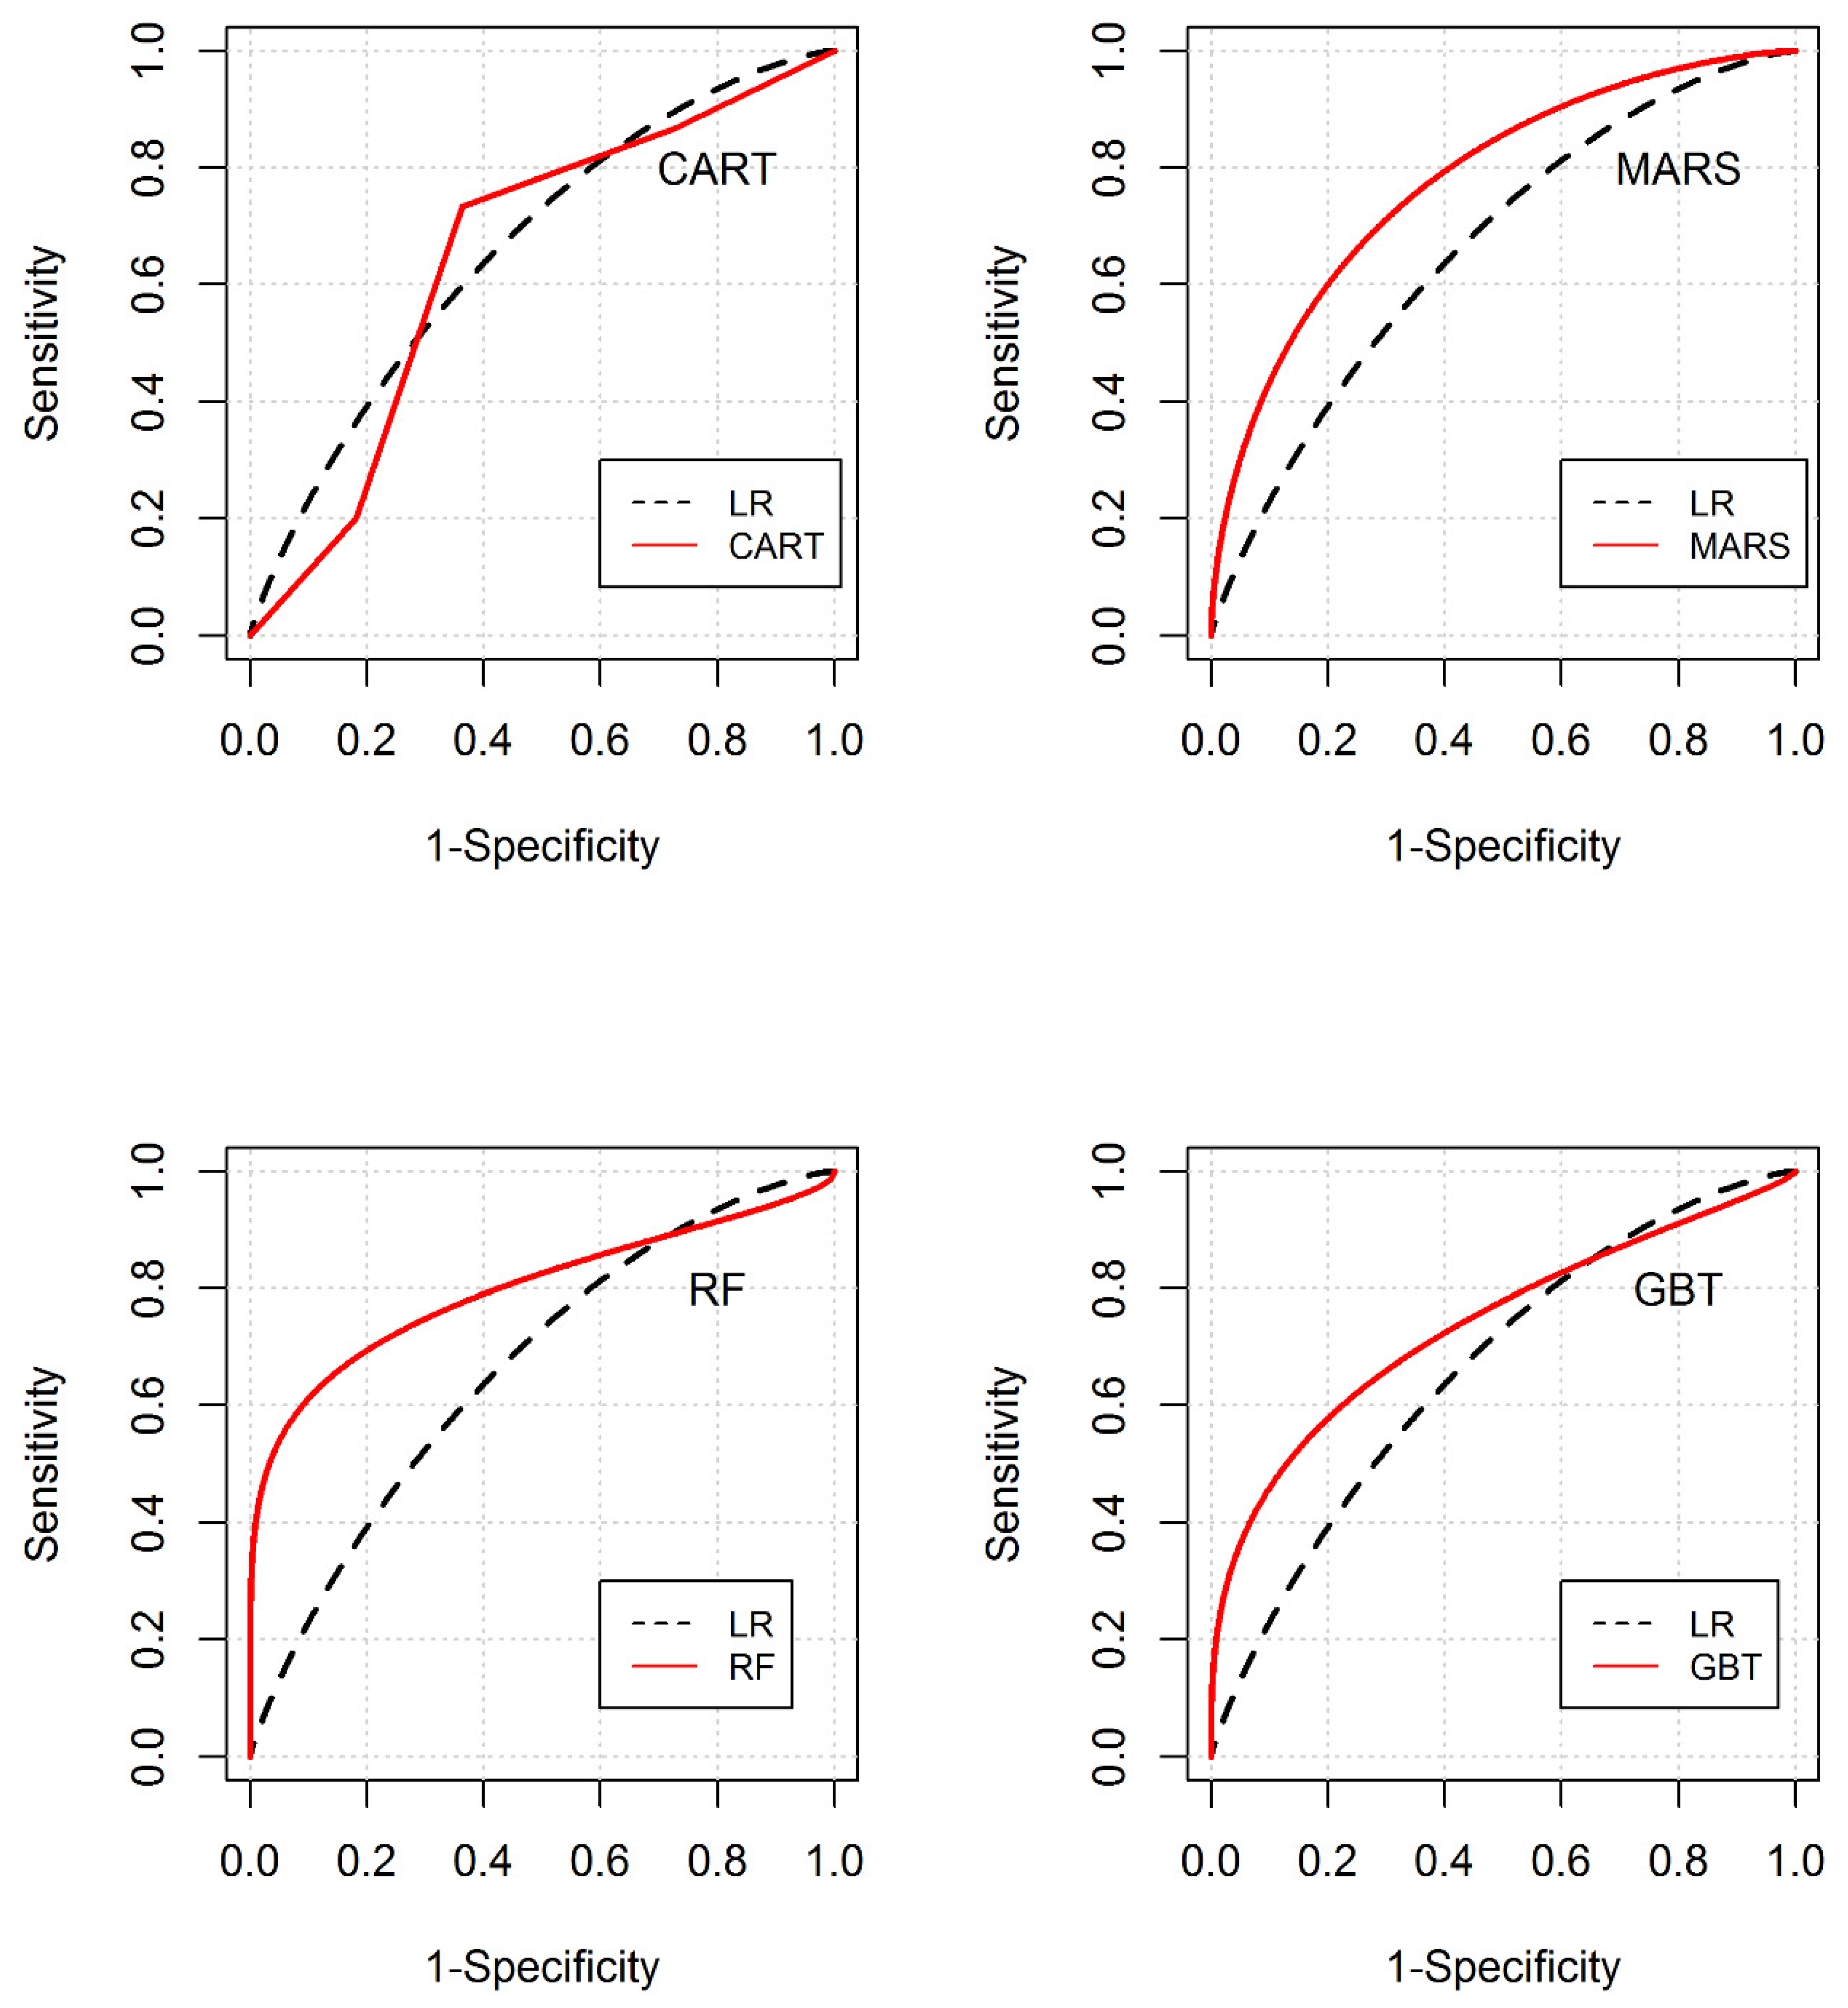
3.3. Predictive Evaluation of the Models
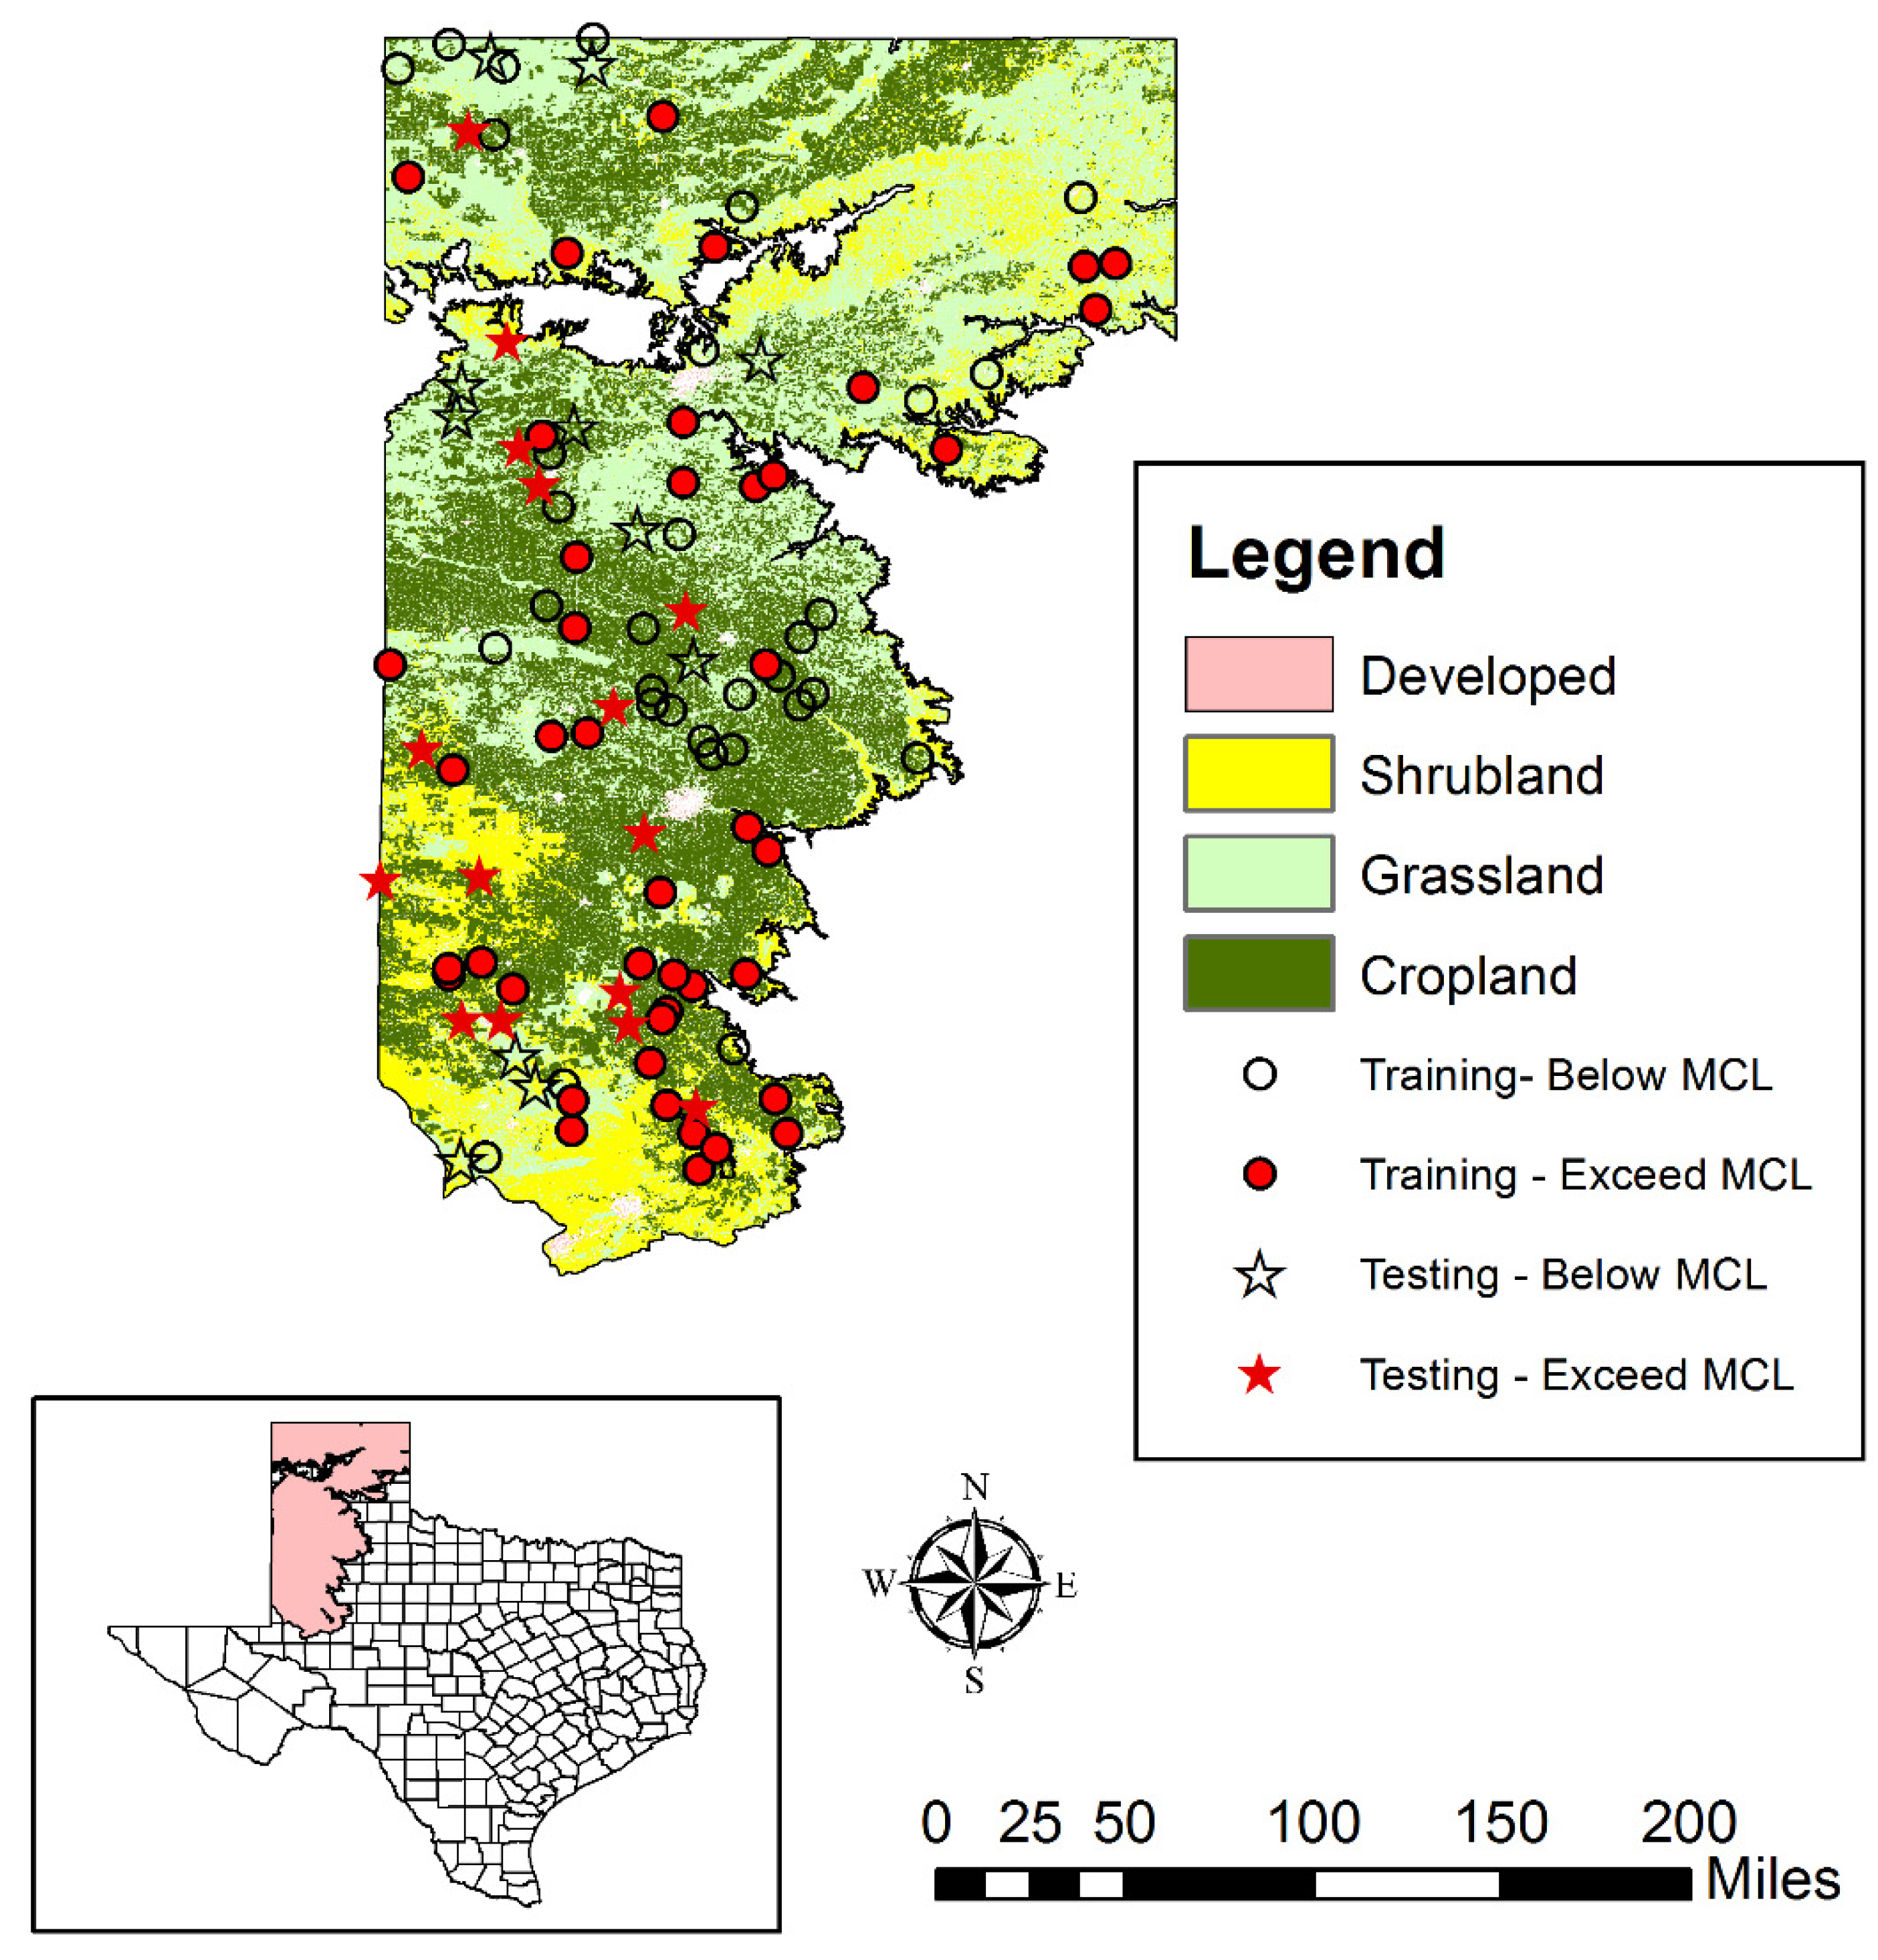
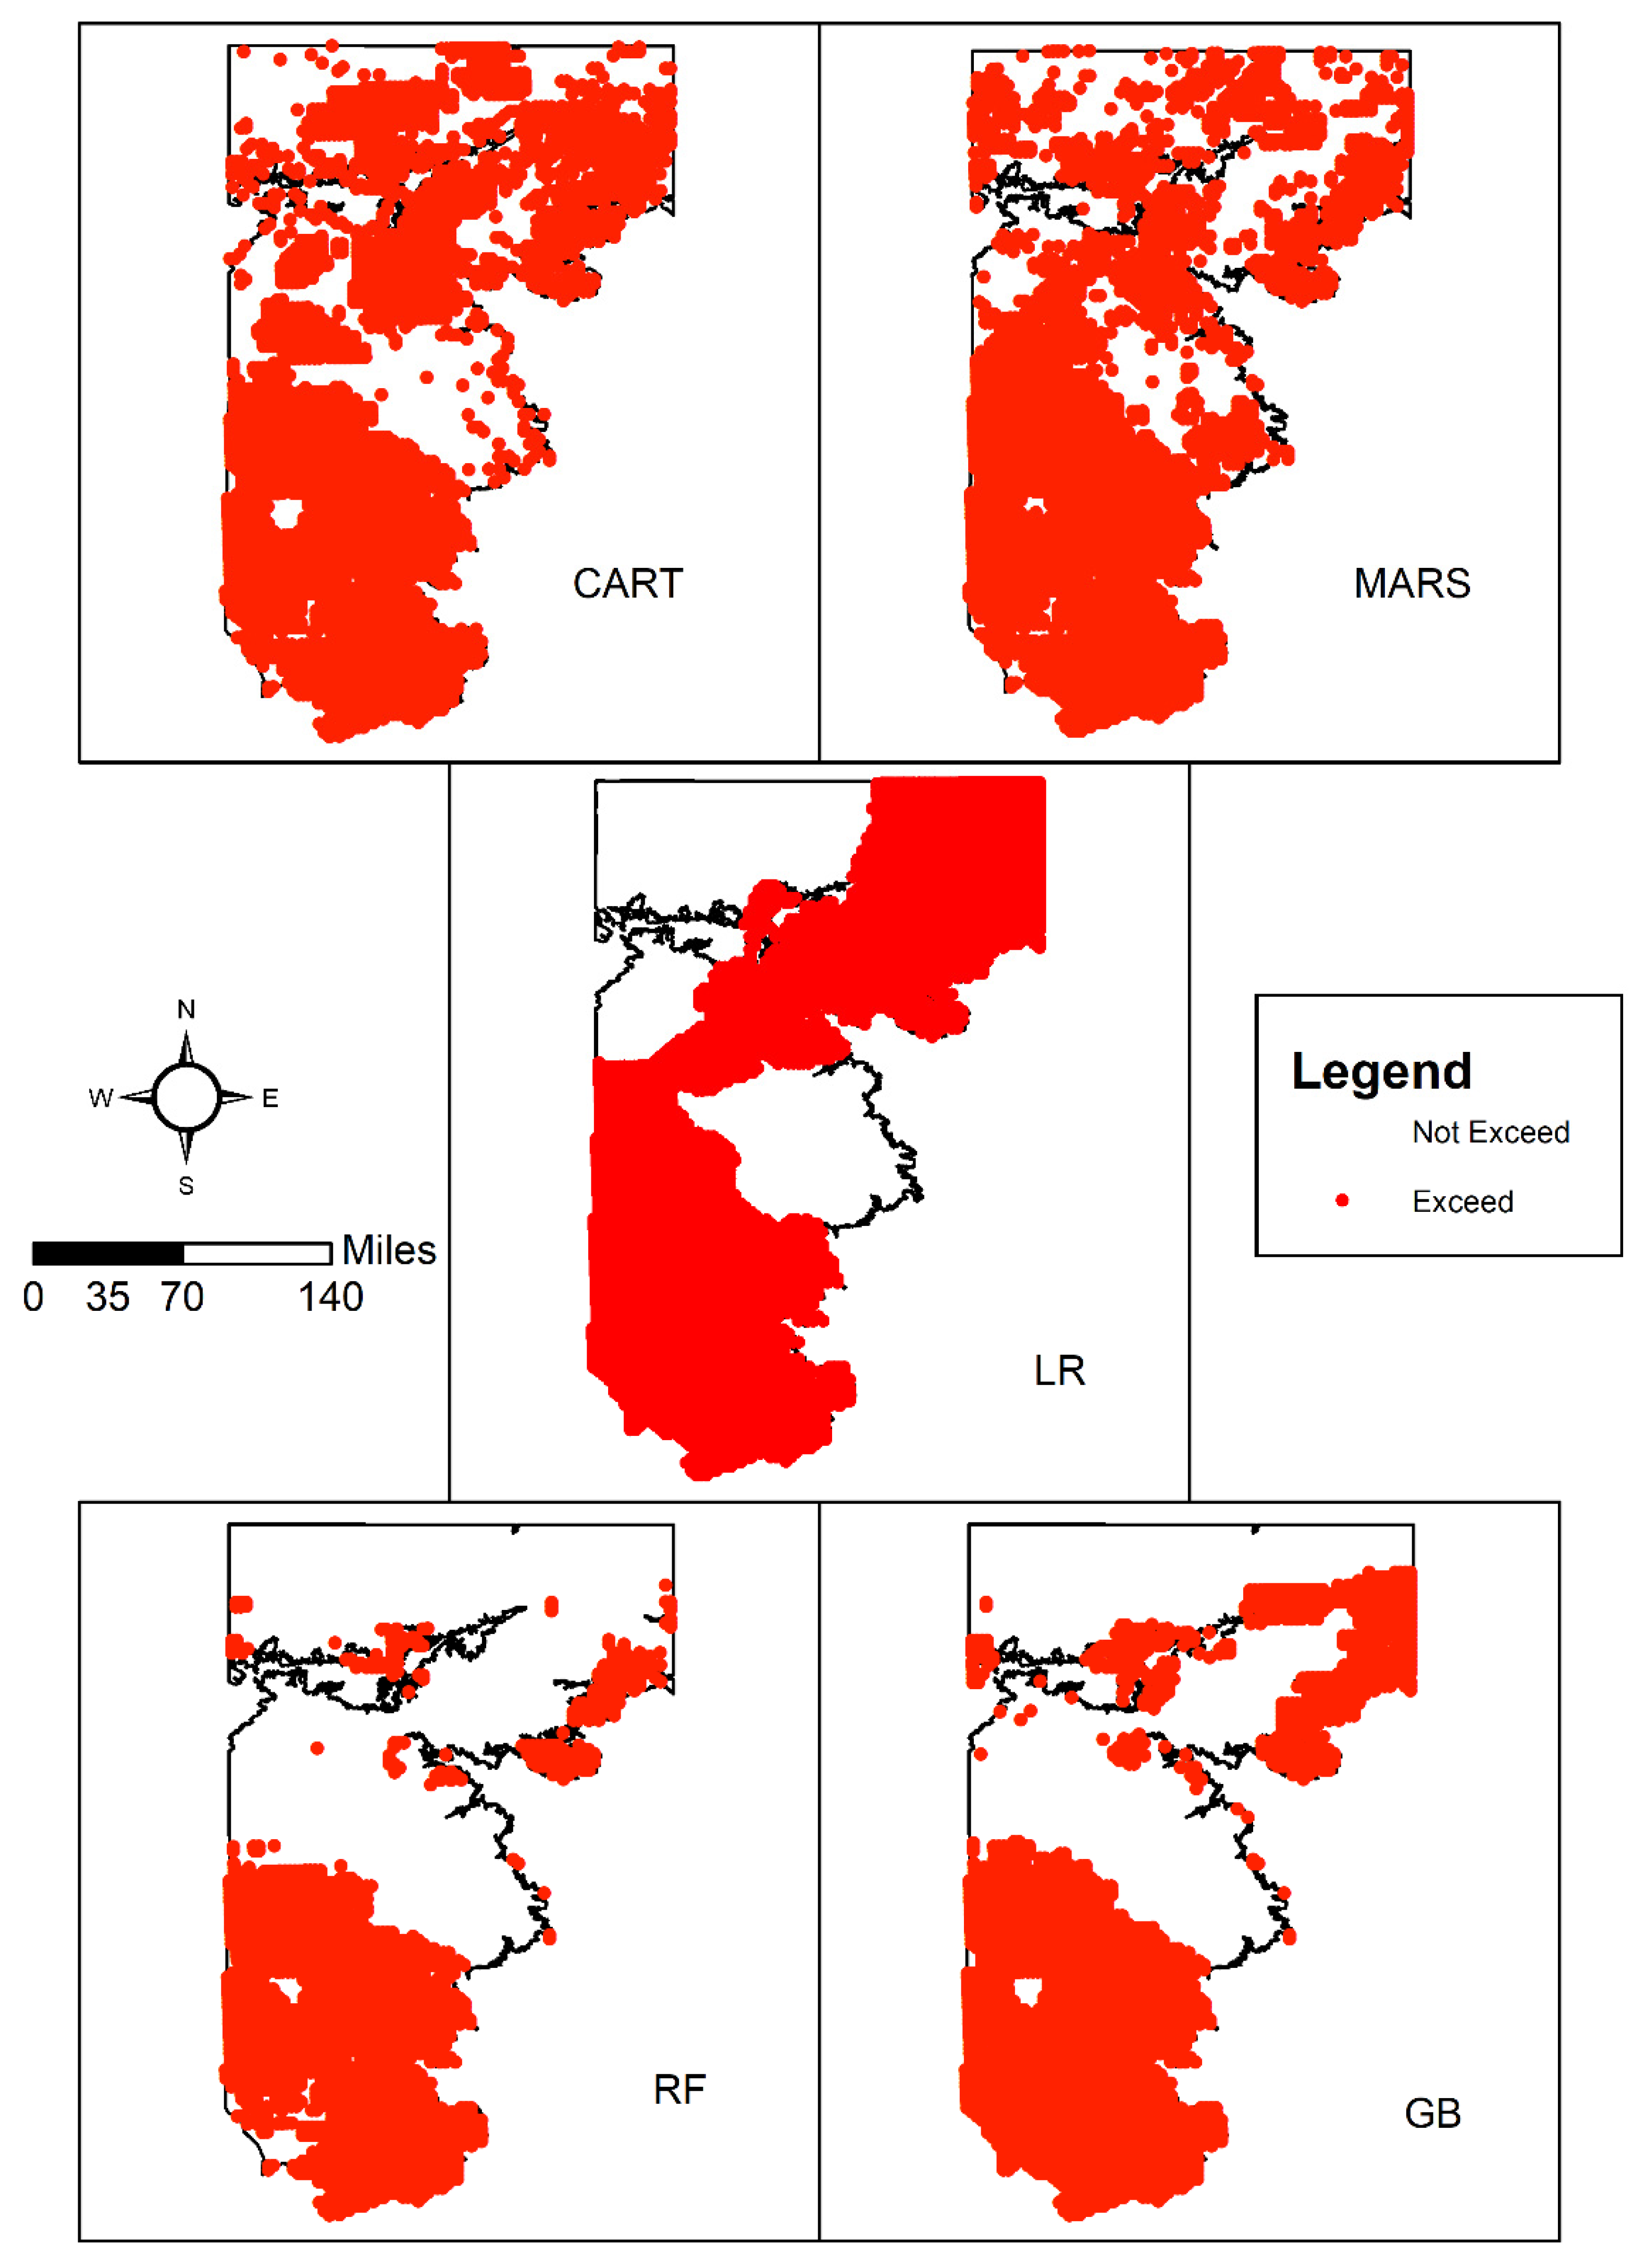
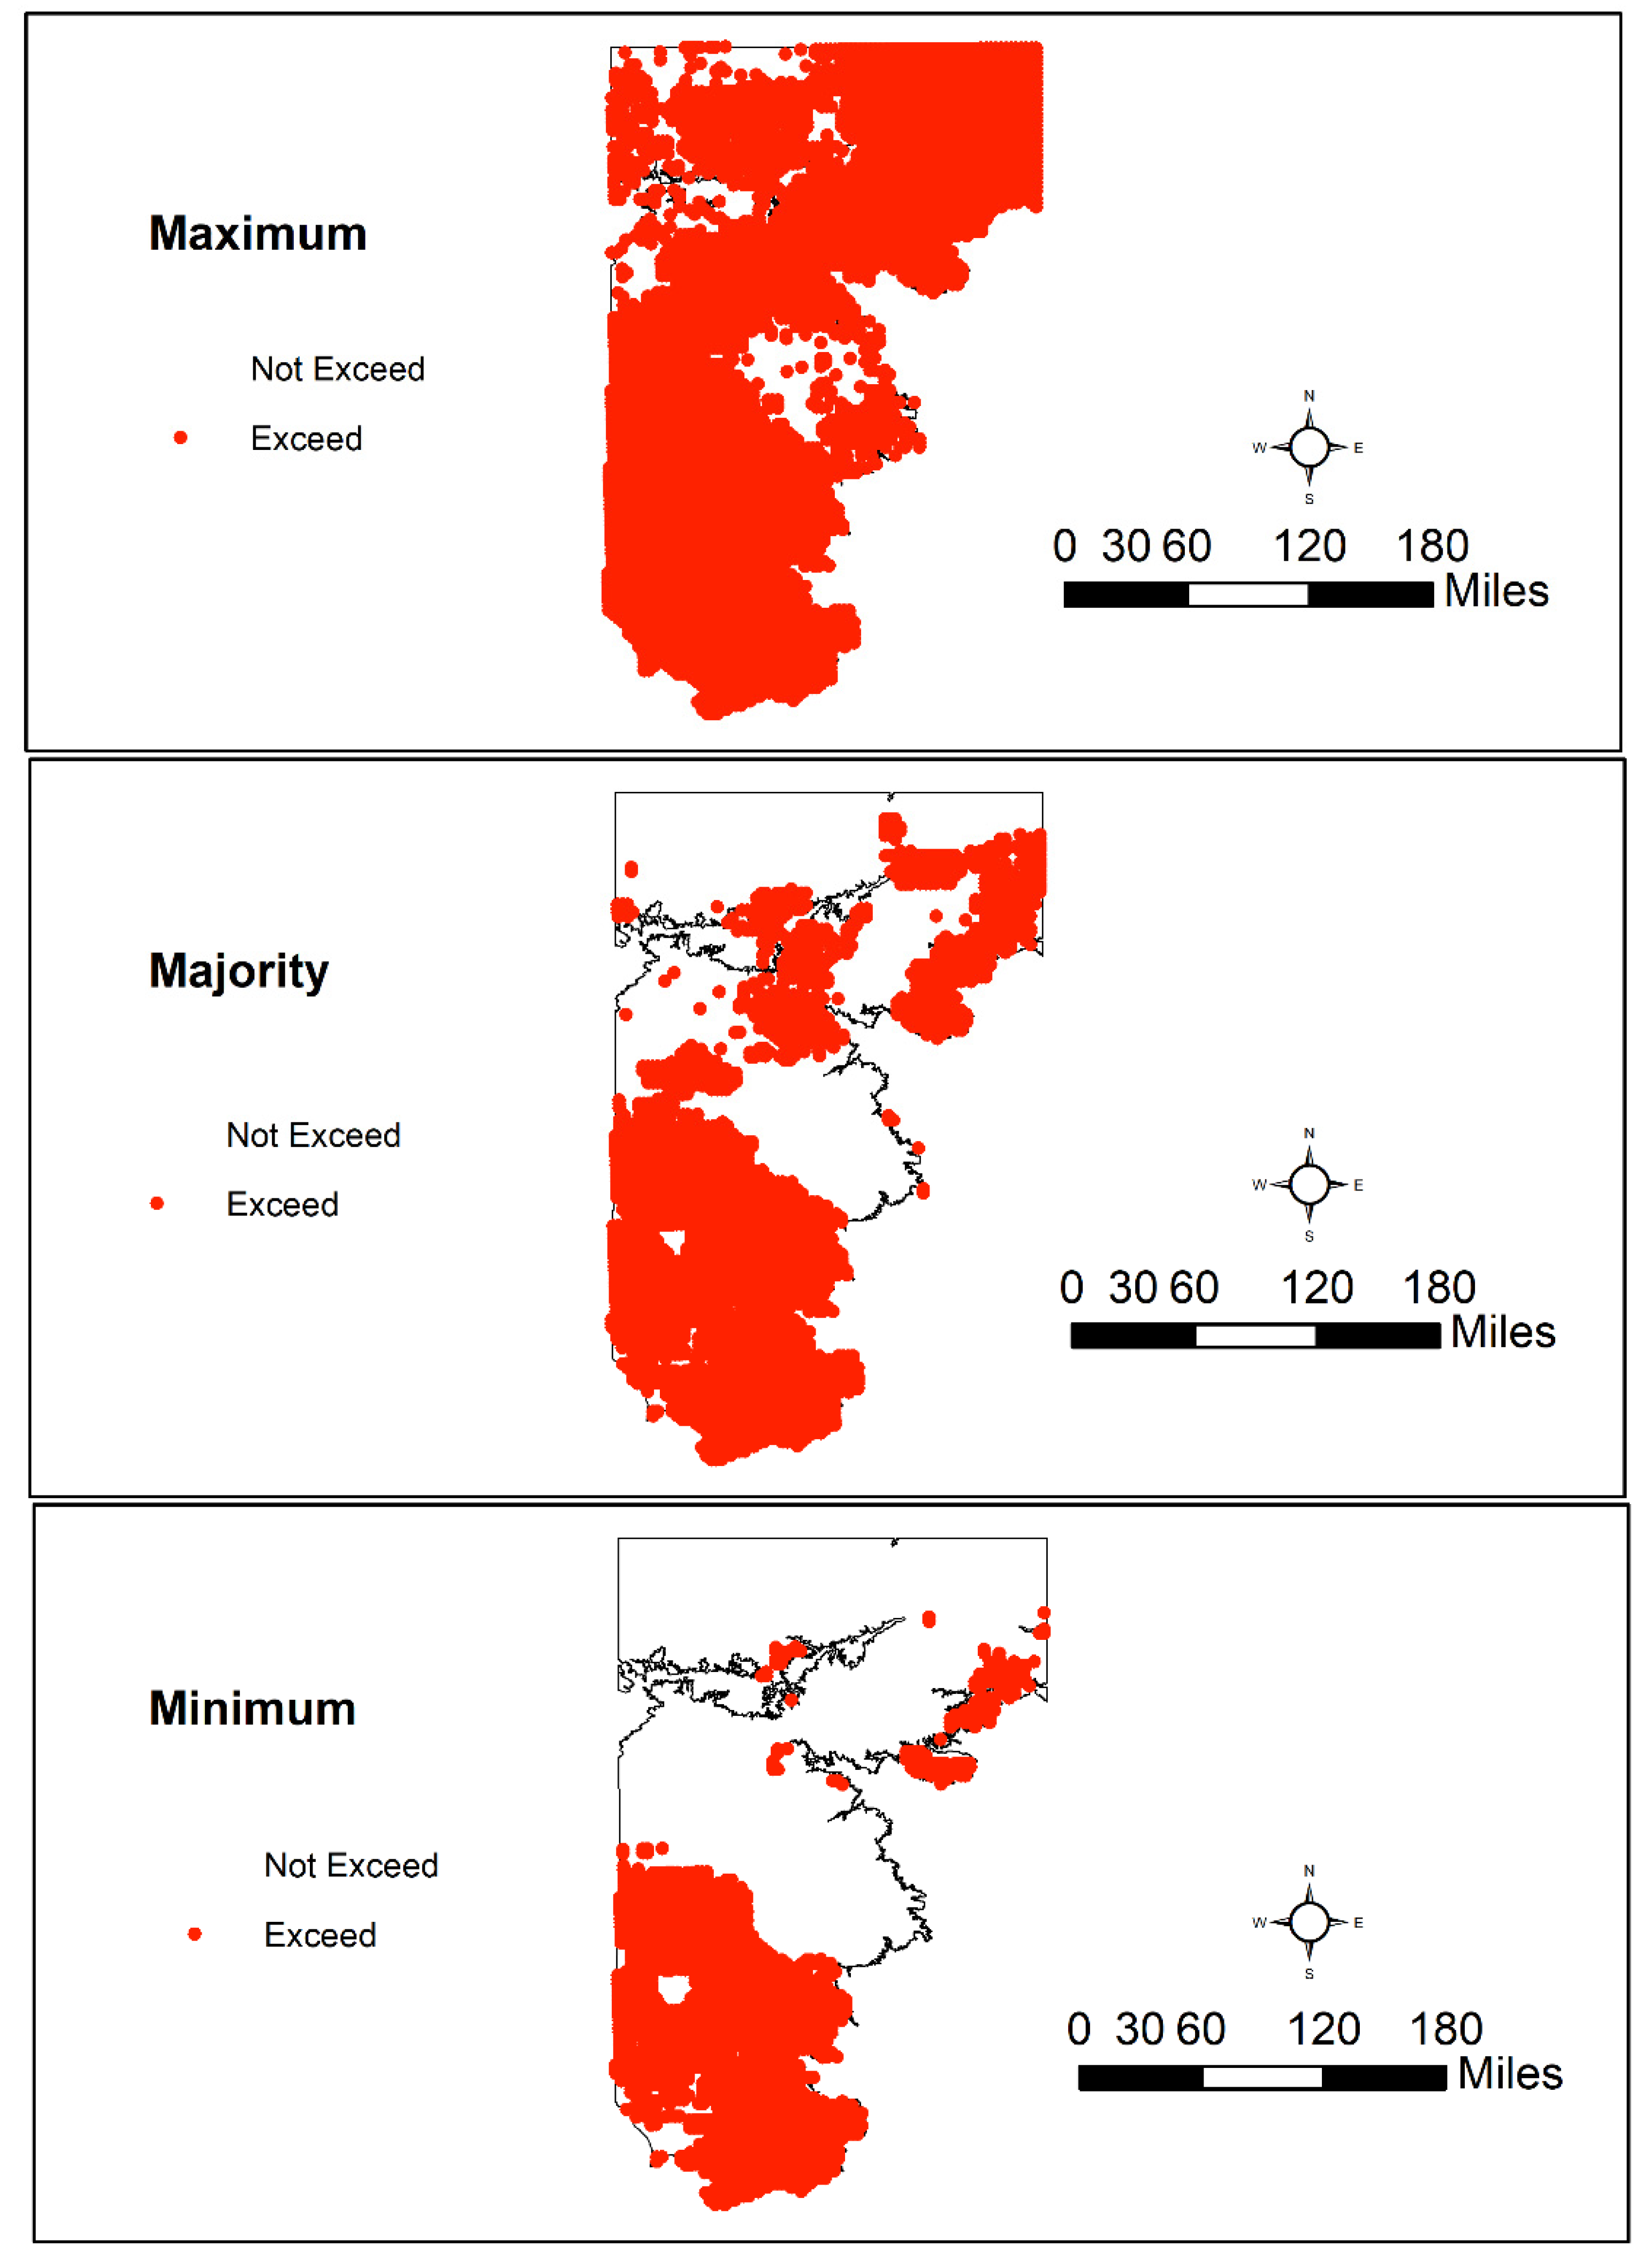
3.4. Spatial Patterns of Aquifer Susceptibility to Nitrate Exceedances
4. Summary and Conclusions
Supplementary Materials
Author Contributions
Funding
Acknowledgments
Conflicts of Interest
References
- WHO. Nitrite in Drinking-Water Background Document for Development of WHO Guidelines for Drinking-Water Quality; World Health Organization: Geneva, Switzerland, 2011; Available online: https://www.who.int/ (accessed on 19 February 2020).
- Pennino, M.; Compton, J.E.; Leibowitz, S.G. Trends in Drinking Water Nitrate Violations Across the United States. Environ. Sci. Technol. 2017, 51, 13450–13460. [Google Scholar] [CrossRef] [PubMed]
- United States Environmental Protection Agency. Available online: https://www.epa.gov/privatewells (accessed on 19 February 2020).
- DeSimone, L.A.; Hamilton, P.A.; Gilliom, R.J. Quality of ground water from private domestic wells. Water Well J. 2009, 63, 33–37. [Google Scholar]
- Gurdak, J.J.; Qi, S. Vulnerability of Recently Recharged Groundwater in Principle Aquifers of the United States to Nitrate Contamination. Environ. Sci. Technol. 2012, 46, 6004–6012. [Google Scholar] [CrossRef]
- Padilla, F.M.; Gallardo, M.; Manzano-Agugliaro, F. Global trends in nitrate leaching research in the 1960–2017 period. Sci. Total. Environ. 2018, 643, 400–413. [Google Scholar] [CrossRef] [PubMed]
- Wu, Y.; Liu, S. Impacts of biofuels production alternatives on water quantity and quality in the Iowa River Basin. Biomass Bioenergy 2012, 36, 182–191. [Google Scholar] [CrossRef]
- Gurdak, J.J.; Geyer, G.E.; Nanus, L.; Taniguchi, M.; Corona, C.R. Scale dependence of controls on groundwater vulnerability in the water–energy–food nexus, California Coastal Basin aquifer system. J. Hydrol. Reg. Stud. 2017, 11, 126–138. [Google Scholar] [CrossRef] [Green Version]
- Reddy, V.R.; Cunha, D.G.F.; Kurian, M. A Water–Energy–Food Nexus Perspective on the Challenge of Eutrophication. Water 2018, 10, 101. [Google Scholar] [CrossRef] [Green Version]
- King, A.; Jensen, V.; Fogg, G.; Harter, T. Groundwater remediation and management for nitrate. Tech. Rep. 2012, 5, 1–51. [Google Scholar]
- Keeler, B.L.; Polasky, S. Land-use change and costs to rural households: A case study in groundwater nitrate contamination. Environ. Res. Lett. 2014, 9, 074002. [Google Scholar] [CrossRef] [Green Version]
- Juntakut, P.; Haacker, E.M.K.; Snow, D.D.; Ray, A.C. Risk and Cost Assessment of Nitrate Contamination in Domestic Wells. Water 2020, 12, 428. [Google Scholar] [CrossRef] [Green Version]
- Lewandowski, A.; Montgomery, B.; Rosen, C.; Moncrief, J. Groundwater nitrate contamination costs: A survey of private well owners. J. Soil Water Conserv. 2008, 63, 153–161. [Google Scholar] [CrossRef]
- Aller, L.; Bennett, T.; Lehr, J.; Petty, R.; Hackett, G. DRASTIC: A Standardized System for Evaluating Ground Water Pollution Potential Using Hydrogeologic Settings; US Environmental Protection Agency: Washington, DC, USA, 1987.
- Uddameri, V.; Honnungar, V. Combining rough sets and GIS techniques to assess aquifer vulnerability characteristics in the semi-arid South Texas. Environ. Earth Sci. 2006, 51, 931–939. [Google Scholar] [CrossRef]
- Tesoriero, A.J.; Voss, F.D. Predicting the Probability of Elevated Nitrate Concentrations in the Puget Sound Basin: Implications for Aquifer Susceptibility and Vulnerability. Ground Water 1997, 35, 1029–1039. [Google Scholar] [CrossRef]
- Nolan, B.T.; Hitt, K.J.; Ruddy, B.C. Probability of Nitrate Contamination of Recently Recharged Groundwaters in the Conterminous United States. Environ. Sci. Technol. 2002, 36, 2138–2145. [Google Scholar] [CrossRef] [PubMed] [Green Version]
- Gardner, K.K.; Vogel, R.M. Predicting ground water nitrate concentration from land use. Ground Water 2005, 43, 343–352. [Google Scholar] [CrossRef] [PubMed] [Green Version]
- Liu, A.; Ming, J.; Ankumah, R.O. Nitrate contamination in private wells in rural Alabama, United States. Sci. Total. Environ. 2005, 346, 112–120. [Google Scholar] [CrossRef]
- Nolan, B.T.; Hitt, K.J. Vulnerability of Shallow Groundwater and Drinking-Water Wells to Nitrate in the United States. Environ. Sci. Technol. 2006, 40, 7834–7840. [Google Scholar] [CrossRef]
- Antonakos, A.; Lambrakis, N. Development and testing of three hybrid methods for the assessment of aquifer vulnerability to nitrates, based on the drastic model, an example from NE Korinthia, Greece. J. Hydrol. 2007, 333, 288–304. [Google Scholar] [CrossRef]
- Carbó, L.I.; Flores, M.C.; Herrero, M.A. Well site conditions associated with nitrate contamination in a multilayer semiconfined aquifer of Buenos Aires, Argentina. Environ. Earth Sci. 2008, 57, 1489–1500. [Google Scholar] [CrossRef]
- Warner, K.L.; Arnold, T. Relations that affect the probability and prediction of nitrate concentration in private wells in the glacial aquifer system in the United States. In Scientific Investigations Report; US Geological Survey: Reston, VA, USA, 2010. Available online: https://pubs.usgs.gov/sir/2010/5100/pdf/sir2010-5100.pdf (accessed on 19 February 2020).
- Venkataraman, K.; Uddameri, V. Modeling simultaneous exceedance of drinking-water standards of arsenic and nitrate in the Southern Ogallala aquifer using multinomial logistic regression. J. Hydrol. 2012, 458, 16–27. [Google Scholar] [CrossRef]
- Mair, A.; El-Kadi, A.I. Logistic regression modeling to assess groundwater vulnerability to contamination in Hawaii, USA. J. Contam. Hydrol. 2013, 153, 1–23. [Google Scholar] [CrossRef] [PubMed]
- Nolan, B.T.; Gronberg, J.M.; Faunt, C.C.; Eberts, S.M.; Belitz, K. Modeling Nitrate at Domestic and Public-Supply Well Depths in the Central Valley, California. Environ. Sci. Technol. 2014, 48, 5643–5651. [Google Scholar] [CrossRef]
- Rizeei, H.M.; Azeez, O.S.; Pradhan, B.; Khamees, H.H. Assessment of groundwater nitrate contamination hazard in a semi-arid region by using integrated parametric IPNOA and data-driven logistic regression models. Environ. Monit. Assess. 2018, 190, 633. [Google Scholar] [CrossRef] [PubMed]
- Gadbury, G.L.; Lyer, H.K.; Schreuder, H.T.; Ueng, C.Y. A nonparametric analysis of plot basal area growth using tree based models. In A Nonparametric Analysis of Plot Basal Area Growth Using Tree Based Models; U.S. Department of Agriculture-Forest Research Service: Fort Collins, CO, USA, 1997. Available online: https://www.fs.fed.us/rm/pubs/rmrs_rp002.pdf (accessed on 19 February 2020).
- McKenzie, N.; Ryan, P. Spatial prediction of soil properties using environmental correlation. Geoderma 1999, 89, 67–94. [Google Scholar] [CrossRef]
- Breiman, L.; Friedman, J.; Olshen, R.; Stone, C. Classification and Regression Trees; CRC Press: Boca Raton, FL, USA, 1984. [Google Scholar]
- Stidson, R.; Gray, C.A.; McPhail, C.D. Development and use of modelling techniques for real-time bathing water quality predictions. Water Environ. J. 2011, 26, 7–18. [Google Scholar] [CrossRef]
- Burow, K.R.; Nolan, B.T.; Rupert, M.G.; Dubrovsky, N.M. Nitrate in Groundwater of the United States, 1991−2003. Environ. Sci. Technol. 2010, 44, 4988–4997. [Google Scholar] [CrossRef]
- Friedman, J.H. Multivariate Adaptive Regression Splines. Ann. Stat. 1991, 19, 1–67. [Google Scholar] [CrossRef]
- Alonso-Fernández, J.R.; Nieto, P.G.; Muñiz, C.D.; Antón, J.C. Álvarez Modeling eutrophication and risk prevention in a reservoir in the Northwest of Spain by using multivariate adaptive regression splines analysis. Ecol. Eng. 2014, 68, 80–89. [Google Scholar] [CrossRef]
- Fortin, J.; Morais, A.; Anctil, F.; Parent, L. SVMLEACH—NK POTATO: A simple software tool to simulate nitrate and potassium co-leaching under potato crop. Comput. Electron. Agric. 2015, 110, 259–266. [Google Scholar] [CrossRef]
- Rezaie-Balf, M.; Naganna, S.; Ghaemi, A.; Deka, P.C. Wavelet coupled MARS and M5 Model Tree approaches for groundwater level forecasting. J. Hydrol. 2017, 553, 356–373. [Google Scholar] [CrossRef]
- Breiman, L. Random forests. Mach. Learn. 2001, 45, 5–32. [Google Scholar] [CrossRef] [Green Version]
- Breiman, L. Prediction games and arcing algorithms. Neural Comput. 1999, 11, 1493–1517. [Google Scholar] [CrossRef] [PubMed]
- Friedman, J.; Hastie, T.; Tibshirani, R. Additive logistic regression: A statistical view of boosting (With discussion and a rejoinder by the authors). Ann. Stat. 2000, 28, 337–407. [Google Scholar] [CrossRef]
- Ouedraogo, I.; Defourny, P.; Vanclooster, M. Modelling nitrate concentrations at the pan-African scale: A random forest approach. In Proceedings of the 1st Atlas Georesources International Congress (AGIC), Hammamet, Tunisia, 20–22 March 2017. [Google Scholar]
- Rodriguez-Galiano, V.; Mendes, M.P.; Garcia-Soldado, M.J.; Olmo, M.C.; Ribeiro, L. Predictive modeling of groundwater nitrate pollution using Random Forest and multisource variables related to intrinsic and specific vulnerability: A case study in an agricultural setting (Southern Spain). Sci. Total. Environ. 2014, 476, 189–206. [Google Scholar] [CrossRef] [PubMed]
- Nolan, B.T.; Fienen, M.; Lorenz, D.L. A statistical learning framework for groundwater nitrate models of the Central Valley, California, USA. J. Hydrol. 2015, 531, 902–911. [Google Scholar] [CrossRef] [Green Version]
- Hosseini, F.S.; Malekian, A.; Choubin, B.; Rahmati, O.; Cipullo, S.; Coulon, F.; Pradhan, B. A novel machine learning-based approach for the risk assessment of nitrate groundwater contamination. Sci. Total. Environ. 2018, 644, 954–962. [Google Scholar] [CrossRef] [Green Version]
- Crops and Plants [Online]. USDA-NASS: Washington, DC, USA, 2012. Available online: http://www.nass.usda.gov/ (accessed on 6 May 2013).
- Gurdak, J.J.; Qi, S. Vulnerability of recently recharged ground water in the High Plains aquifer to nitrate contamination. In Scientific Investigations Report; U.S. Geological Survey: Reston, VA, USA, 2006. Available online: https://pubs.usgs.gov/sir/2006/5050/ (accessed on 19 February 2020).
- Enwright, N.M.; Hudak, P.F. Spatial distribution of nitrate and related factors in the High Plains Aquifer, Texas. Environ. Earth Sci. 2009, 58, 1541–1548. [Google Scholar] [CrossRef]
- Scanlon, B.R.; Reedy, R.C.; Bronson, K.F. Impacts of Land Use Change on Nitrogen Cycling Archived in Semiarid Unsaturated Zone Nitrate Profiles, Southern High Plains, Texas. Environ. Sci. Technol. 2008, 42, 7566–7572. [Google Scholar] [CrossRef]
- Hamilton, J.D. State-space models. In Handbook of Econometrics IV; Elsevier: Amsterdam, The Netherlands, 1994. [Google Scholar]
- Smith, G. Step away from stepwise. J. Big Data 2018, 5, 32. [Google Scholar] [CrossRef]
- Saeys, Y.; Inza, I.; Larrañaga, P. A review of feature selection techniques in bioinformatics. Bioinformatics 2007, 23, 2507–2517. [Google Scholar] [CrossRef] [Green Version]
- Qian, S.S.; Anderson, C. Exploring Factors Controlling the Variability of Pesticide Concentrations in the Willamette River Basin Using Tree-Based Models. Environ. Sci. Technol. 1999, 33, 3332–3340. [Google Scholar] [CrossRef]
- Hancock, T.; Put, R.; Coomans, D.; Heyden, Y.V.; Everingham, Y. A performance comparison of modern statistical techniques for molecular descriptor selection and retention prediction in chromatographic QSRR studies. Chemom. Intell. Lab. Syst. 2005, 76, 185–196. [Google Scholar] [CrossRef]
- Clark, L.; Pregibon, D. Chapter Tree-Based Models. In Statistical Models in S; Chambers, J., Hastie, T., Eds.; CRC Press: Boca Raton, FL, USA, 1991. [Google Scholar]
- Leathwick, J.R.; Elith, J.; Hastie, T. Comparative performance of generalized additive models and multivariate adaptive regression splines for statistical modelling of species distributions. Ecol. Model. 2006, 199, 188–196. [Google Scholar] [CrossRef]
- Hastie, T.; Tibshirani, R. Discriminant Analysis by Gaussian Mixtures. J. R. Stat. Soc. Ser. B 1996, 58, 155–176. [Google Scholar] [CrossRef]
- Sutton, C.D. Classification and Regression Trees, Bagging, and Boosting. Handb. Stat. 2005, 24, 303–329. [Google Scholar]
- Breiman, L. Bias, Variance, and Arcing Classifiers; Tech. Rep. 460; Statistics Department, University of California: Berkeley, CA, USA, 1996. [Google Scholar]
- Breiman, L. Arcing classifier (with discussion and a rejoinder by the author). Ann. Stat. 1998, 26, 801–849. [Google Scholar] [CrossRef]
- Freund, Y.; Schapire, R.E. Experiments with a new boosting algorithm. icml 1996, 96, 148–156. [Google Scholar]
- Mason, L.; Baxter, J.; Bartlett, P.L.; Frean, M.R. Boosting algorithms as gradient descent. In Advances in Neural Information Processing Systems; MIT Press: Cambridge, MA, USA, 2000; pp. 512–518. Available online: https://papers.nips.cc/paper/1766-boosting-algorithms-as-gradient-descent.pdf (accessed on 19 February 2020).
- Hastie, T.; Tibshirani, R.; Friedman, J. Boosting and Additive Trees. In Springer Series in Statistics; Springer Science and Business Media LLC: Stanford, CA, USA, 2008; pp. 337–387. Available online: https://link.springer.com/chapter/10.1007%2F978-0-387-84858-7_10 (accessed on 19 February 2020).
- Schapire, R.E. The Boosting Approach to Machine Learning: An Overview. In Athens Conference on Applied Probability and Time Series Analysis; Springer Science and Business Media LLC: Florham Park, NJ, USA, 2003; Volume 171, pp. 149–171. Available online: https://link.springer.com/chapter/10.1007/978-0-387-21579-2_9 (accessed on 19 February 2020).
- Friedman, J.H. Greedy function approximation: A gradient boosting machine. Ann. Stat. 2001, 29, 1189–1232. [Google Scholar] [CrossRef]
- Elith, J.; Leathwick, J.R.; Hastie, T. A working guide to boosted regression trees. J. Anim. Ecol. 2008, 77, 802–813. [Google Scholar] [CrossRef]
- Friedman, J.H. Stochastic gradient boosting. Comput. Stat. Data Anal. 2002, 38, 367–378. [Google Scholar] [CrossRef]
- Agresti, A. An Introduction to Categorical Data Analysis; Wiley: Hoboken, NJ, USA, 2018. [Google Scholar]
- Fawcett, T. An introduction to ROC analysis. Pattern Recognit. Lett. 2006, 27, 861–874. [Google Scholar] [CrossRef]
- Burow, K.R.; Jurgens, B.C.; Belitz, K.; Dubrovsky, N.M. Assessment of regional change in nitrate concentrations in groundwater in the Central Valley, California, USA, 1950s–2000s. Environ. Earth Sci. 2012, 69, 2609–2621. [Google Scholar] [CrossRef]
- R Core Team. R: A Language and Environment for Statistical Computing; R Foundation for Statistical Computing: Vienna, Austria, 2019. [Google Scholar]
- Therneau, T.; Atkinson, B.; Ripley, B. Package ‘rpart’: Recursive Partitioning and Regression Trees. 2015, p. 34. Available online: https://cran.r-project.org/package=rpart (accessed on 19 February 2020).
- Milborrow, S. Package ‘earth’: Multivariate Adaptive Regression Splines. 2016, p. 51. Available online: http://www.milbo.users.sonic.net/earth (accessed on 19 February 2020).
- Liaw, A.; Wiener, M. Package ‘randomForest’: Breiman and Cutler’s Random Forests for Classification and Regression. 2015, p. 29. Available online: https://www.stat.berkeley.edu/~breiman/RandomForests/ (accessed on 19 February 2020).
- Hijmans, R.J.; Philips, S.; Leathwick, J.; Elith, J. Package ‘dismo’: Species Distribution Modeling. 2013, p. 68. Available online: http://rspatial.org/sdm/ (accessed on 19 February 2020).
- Midi, H.; Sarkar, S.; Rana, S. Collinearity diagnostics of binary logistic regression model. J. Interdiscip. Math. 2010, 13, 253–267. [Google Scholar] [CrossRef]
- Galloway, J.; Aber, J.D.; Erisman, J.W.; Seitzinger, S.; Howarth, R.W.; Cowling, E.B.; Cosby, B.J. The Nitrogen Cascade. Bioscience 2003, 53, 341. [Google Scholar] [CrossRef]
- Dayan, U.; Erel, Y.; Shpund, J.; Kordova, L.; Wanger, A.; Schauer, J.J. The impact of local sources and meteorological factors on nitrogen oxide and particulate matter concentrations: A case study of the Day of Atonement in Israel. Atmos. Environ. 2011, 45, 3325–3332. [Google Scholar] [CrossRef]
- Reeves, C.C. Origin, Classification, and Geologic History of Caliche on the Southern High Plains, Texas and Eastern New Mexico. J. Geol. 1970, 78, 352–362. [Google Scholar] [CrossRef]
- Peters, J.; De Baets, B.; Verhoest, N.E.C.; Samson, R.; Degroeve, S.; De Becker, P.; Huybrechts, W. Random forests as a tool for ecohydrological distribution modelling. Ecol. Model. 2007, 207, 304–318. [Google Scholar] [CrossRef]
- Friedman, J.H.; Meulman, J.J. Multiple additive regression trees with application in epidemiology. Stat. Med. 2003, 22, 1365–1381. [Google Scholar] [CrossRef]
- Costanza, J.K.; Marcinko, S.E.; Goewert, A.E.; Mitchell, C.E. Potential geographic distribution of atmospheric nitrogen deposition from intensive livestock production in North Carolina, USA. Sci. Total. Environ. 2008, 398, 76–86. [Google Scholar] [CrossRef]
- Rhoades, M.B.; Parker, D.B.; Cole, N.A.; Todd, R.W.; Caraway, E.A.; Auvermann, B.W.; Topliff, D.R.; Schuster, G.L. Continuous Ammonia Emission Measurements from a Commercial Beef Feedyard in Texas. Trans. ASABE 2010, 53, 1823–1831. [Google Scholar] [CrossRef]
- Qian, S.S. Environmental and Ecological Statistics with R, 2nd ed.; CRC Press Inc.: Boca, FL, USA, 2016. [Google Scholar]
- Kuncheva, L.; Bezdek, J.C.; Duin, R.P.W. Decision templates for multiple classifier fusion: An experimental comparison. Pattern Recognit. 2001, 34, 299–314. [Google Scholar] [CrossRef]


| Parameter | Description | Source | Data Location |
|---|---|---|---|
| Recharge | Groundwater Recharge (in/yr) | 1% of 30-year Annual Precipitation from PRISM | http://www.prism.oregonstate.edu/normals/ (last access date: 19 February 2020) |
| Slope (%) | Topographical Slope (%) | Calculated using the 90 m Digital Elevation Map | http://srtm.csi.cgiar.org/ (last access date: 19 February 2020) |
| SOM | Soil Organic Matter (%) | STATSGO2 | http://websoilsurvey.sc.egov.usda.gov/App/HomePage.htm (last access date: 19 February 2020) |
| SHG | Soil Hydrologic Group | STATSGO2 | http://websoilsurvey.sc.egov.usda.gov/App/HomePage.htm (last access date: 19 February 2020) |
| Texture | Soil Texture | STATSGO2 | http://websoilsurvey.sc.egov.usda.gov/App/HomePage.htm (last access date: 19 February 2020) |
| Clay | Percent Clay (%) | STATSGO2 | http://websoilsurvey.sc.egov.usda.gov/App/HomePage.htm (last access date: 19 February 2020) |
| Dist_MSW | Distance from Muncipal Solid Waste Facility (mi) | Based on Locations identified by Texas Commission on Environmental Quality | https://www.tceq.texas.gov/permitting/waste_permits/msw_permits/msw-data (last access date: 19 February 2020) |
| Ndep | Nitrogen Deposition (kg/ha/y) | Based on National Atmospheric Deposition Program | http://nadp.slh.wisc.edu/NTN/maps.aspx (last access date: 19 February 2020) |
| DWT | Depth to Water Table (ft) | Texas Water Development Board Groundwater Database | http://www.twdb.texas.gov/groundwater/data/gwdbrpt.asp (last access date: 19 February 2020) |
| Well Depth | Well Depth (ft) | Texas Water Development Board Groundwater Database | http://www.twdb.texas.gov/groundwater/data/gwdbrpt.asp (last access date: 19 February 2020) |
| Mn | Manganese (mg/L) | Texas Water Development Board Groundwater Database | http://www.twdb.texas.gov/groundwater/data/gwdbrpt.asp (last access date: 19 February 2020) |
| Fe | Iron (mg/L) | Texas Water Development Board Groundwater Database | http://www.twdb.texas.gov/groundwater/data/gwdbrpt.asp (last access date: 19 February 2020) |
| Ca | Calcium (mg/L) | Texas Water Development Board Groundwater Database | http://www.twdb.texas.gov/groundwater/data/gwdbrpt.asp (last access date: 19 February 2020) |
| DO | Dissolved Oxygen (mg/L) | Texas Water Development Board Groundwater Database | http://www.twdb.texas.gov/groundwater/data/gwdbrpt.asp (last access date: 19 February 2020) |
| ORP | Oxidation Reduction potential (mV) | Texas Water Development Board Groundwater Database | http://www.twdb.texas.gov/groundwater/data/gwdbrpt.asp (last access date: 19 February 2020) |
| Nload | Nitrogen Loading (kg/y) | Based on land use land cover from MLRC 2011 | https://www.mrlc.gov/data/legends/national-land-cover-database-2011-nlcd2011-legend (last access date: 19 February 2020) |
| Parameter | Coefficient |
|---|---|
| (Intercept) | −0.189 (1.919) |
| Clay (%) | −0.0948 (0.044) |
| Ndep (kg/ha/y) | 0.454 (0.173) |
| WellDepth (ft) | −0.00955 (0.004) |
| Ca (mg/L) | 0.0248 (0.014) |
| AIC | 74.47 |
| Parameter | Coefficients |
|---|---|
| (Intercept) | 1.005 |
| h(SHG-8) | −0.436 |
| h(Clay-14) | −0.020 |
| h(Ndep-6.89954) | 0.109 |
| h(ORP-121.949) | 0.004 |
| h(96.9828-Ca) | −0.008 |
| h(Nload-7.5) | 0.115 |
| h(WellDepth-350) | −0.043 |
| h(WellDepth-190) | −0.005 |
| h(WellDepth-331) | 0.040 |
| Measure | Equation | LR | CART | MARS | RF | GBT |
|---|---|---|---|---|---|---|
| True Positive | TP | 35 | 42 | 41 | 28 | 36 |
| False Positive | FP | 6 | 1 | 2 | 7 | 3 |
| False Negative | FN | 8 | 1 | 2 | 15 | 7 |
| True Negative | TN | 26 | 31 | 30 | 25 | 29 |
| Prevalence | (TP + FN)/(TP+FP+FN+TN) | 0.573 | 0.573 | 0.573 | 0.573 | 0.573 |
| Accuracy | (TP+TN)/(TP+FP+FN+TN) | 0.813 | 0.973 | 0.947 | 0.707 | 0.867 |
| True Positive Rate | TP/(TP + FN) | 0.814 | 0.977 | 0.953 | 0.651 | 0.837 |
| False Positive Rate | FP/(TN + FP) | 0.188 | 0.031 | 0.063 | 0.219 | 0.094 |
| False Negative Rate | FN/(TP + FN) | 0.186 | 0.023 | 0.047 | 0.349 | 0.163 |
| True Negative Rate | TN/(TN + FP) | 0.813 | 0.969 | 0.938 | 0.781 | 0.906 |
| Positive Predictive Value | TP/(TP + FP) | 0.854 | 0.977 | 0.953 | 0.800 | 0.923 |
| False Omission Rate | FN/(TN + FN) | 0.235 | 0.031 | 0.063 | 0.375 | 0.194 |
| False Discovery Rate | FP/(TP + FP) | 0.146 | 0.023 | 0.047 | 0.200 | 0.077 |
| Negative Predictive Value | TN/(TN + FN) | 0.765 | 0.969 | 0.938 | 0.625 | 0.806 |
| Positive Likelihood Ratio | True Positive Rate/False Positive Rate | 4.341 | 31.256 | 15.256 | 2.977 | 8.930 |
| Negative Likelihood Ratio | False Negative Rate/ True Negative Rate | 0.229 | 0.024 | 0.050 | 0.447 | 0.180 |
| Diagnostic Odds Ratio | Positive Likelihood Ratio/Negative Likelihood Ratio | 18.958 | 1302.000 | 307.500 | 6.667 | 49.714 |
| Measure | Equation | LR | CART | MARS | RF | GBT |
|---|---|---|---|---|---|---|
| True Positive | TP | 11 | 11 | 10 | 10 | 10 |
| False Positive | FP | 3 | 4 | 3 | 1 | 3 |
| False Negative | FN | 4 | 4 | 5 | 5 | 5 |
| True Negative | TN | 8 | 7 | 8 | 10 | 8 |
| Prevalence | (TP + FN)/(TP+FP+FN+TN) | 0.577 | 0.577 | 0.577 | 0.577 | 0.577 |
| Accuracy | (TP+TN)/(TP+FP+FN+TN) | 0.577 | 0.692 | 0.692 | 0.769 | 0.692 |
| True Positive Rate | TP/(TP + FN) | 0.667 | 0.733 | 0.667 | 0.667 | 0.667 |
| False Positive Rate | FP/(TN + FP) | 0.545 | 0.364 | 0.273 | 0.091 | 0.273 |
| False Negative Rate | FN/(TP + FN) | 0.333 | 0.267 | 0.333 | 0.333 | 0.333 |
| True Negative Rate | TN/(TN + FP) | 0.455 | 0.636 | 0.727 | 0.909 | 0.727 |
| Positive Predictive Value | TP/(TP + FP) | 0.625 | 0.733 | 0.769 | 0.909 | 0.769 |
| False Omission Rate | FN/(TN + FN) | 0.500 | 0.364 | 0.385 | 0.333 | 0.385 |
| False Discovery Rate | FP/(TP + FP) | 0.375 | 0.267 | 0.231 | 0.091 | 0.231 |
| Negative Predictive Value | TN/(TN + FN) | 0.500 | 0.636 | 0.615 | 0.667 | 0.615 |
| Positive Likelihood Ratio | True Positive Rate/False Positive Rate | 1.222 | 2.017 | 2.444 | 7.333 | 2.444 |
| Negative Likelihood Ratio | False Negative Rate/ True Negative Rate | 0.733 | 0.419 | 0.458 | 0.367 | 0.458 |
| Diagnostic Odds Ratio | Positive Likelihood Ratio/Negative Likelihood Ratio | 1.667 | 4.813 | 5.333 | 20.000 | 5.333 |
© 2020 by the authors. Licensee MDPI, Basel, Switzerland. This article is an open access article distributed under the terms and conditions of the Creative Commons Attribution (CC BY) license (http://creativecommons.org/licenses/by/4.0/).
Share and Cite
Uddameri, V.; Silva, A.L.B.; Singaraju, S.; Mohammadi, G.; Hernandez, E.A. Tree-Based Modeling Methods to Predict Nitrate Exceedances in the Ogallala Aquifer in Texas. Water 2020, 12, 1023. https://doi.org/10.3390/w12041023
Uddameri V, Silva ALB, Singaraju S, Mohammadi G, Hernandez EA. Tree-Based Modeling Methods to Predict Nitrate Exceedances in the Ogallala Aquifer in Texas. Water. 2020; 12(4):1023. https://doi.org/10.3390/w12041023
Chicago/Turabian StyleUddameri, Venkatesh, Ana Luiza Bessa Silva, Sreeram Singaraju, Ghazal Mohammadi, and E. Annette Hernandez. 2020. "Tree-Based Modeling Methods to Predict Nitrate Exceedances in the Ogallala Aquifer in Texas" Water 12, no. 4: 1023. https://doi.org/10.3390/w12041023
APA StyleUddameri, V., Silva, A. L. B., Singaraju, S., Mohammadi, G., & Hernandez, E. A. (2020). Tree-Based Modeling Methods to Predict Nitrate Exceedances in the Ogallala Aquifer in Texas. Water, 12(4), 1023. https://doi.org/10.3390/w12041023