Article

The Impact of Submerged Breakwaters on Sediment Distribution along Marsh Boundaries

Horn Point Laboratory, University of Maryland Center for Environmental Science, Cambridge, MD 21613, USA
*
Author to whom correspondence should be addressed.
Water 2020, 12(4), 1016; https://doi.org/10.3390/w12041016
Submission received: 7 February 2020 / Revised: 13 March 2020 / Accepted: 31 March 2020 / Published: 2 April 2020

Abstract

:
Human encroachment and development on coastlines have led to greater amounts of armoring of shorelines. Breakwaters are a common feature along coastlines, which are used to dampen wave energy and protect shorelines from flash floods or overwash events. Although common, their effects on sediment transport and marsh geomorphology are poorly understood. To address this gap, our study quantifies the effects of breakwaters on sediment transport and marsh evolution under different wave regimes using Delft3D-SWAN, a dynamic geomorphodynamic numerical model. Model configurations used the same numerical domain, but scenarios had different sediments, waves, tides, basin slopes and breakwater distances from the shoreline to explore how waves and tidal currents shape coastal margins. Model results suggested breakwaters were responsible for an average wave damping between 10–50%, proportional to the significant wave height across all modeled scenarios. Shear stress at the beginning of the marsh and the volume of sediment deposited at the end of the simulation (into the marsh behind the breakwater) increased on average between 20–40%, proportional to the slope and distance of the breakwater from the shoreline. Sediment trapping, defined as the ratio between the volume of sediment housed into the salt marsh behind and away from the breakwater, was found to be less than 1 from most model runs. Study results indicated that breakwaters are advantageous for wave breaking to protect shorelines from the wave’s energy, however, they might also be an obstacle for sediment transport, negatively affecting nourishment processes, and, consequently, impeded long-term salt marsh survival. Identifying a balance between waves dampening and shoreline nourishment should be considered in the design and implementation of these structures.

1. Introduction

Coastal environments are the most economically important and intensely used among all areas inhabited by humans [1,2]. In fact, it has been estimated that around half of the world’s population presently lives within 200 km of the coast, and this value is likely to double by 2025 [1,3]. Coastal regions are both widely regarded and protected, due to their immense ecological, social and economic benefits, e.g., essential fish habitat, food production, transportation hub, etc. [2,3] Concern over the decline or loss of valuable coastal ecosystem services has been mounting over the past several decades due to growing threats to their long-term viability (e.g., human encroachment, habitat degradation, sea-level rise). To protect and maintain the boundaries of coastal regions, a common practice is to transform, alter, and armor shorelines with a variety of structures, such as seawalls, breakwaters or bulkheads, that reduce waves energy and shoreline erosion [4,5,6]. However, a full accounting of the ecological damage associated with these structures is rarely performed, considered, or even well understood prior to infrastructure construction, but may be substantial once completed [4,6,7]. For example, the construction of low crested coastal defense structures always results in a local loss of soft-bottom habitats and associated assemblages of animals and plants [8].
Breakwaters, which were the object of this study, are structures that break incoming waves to reduce their energy at the shoreline, able to trap sediments, and thus can promote the strengthening of the coast [4,9]. Salt marsh vegetation is a natural barrier to dissipate wave energy, due to the drag created by plant stems and leaves [10,11], and reduces sediment re-suspension and promotes deposition [11,12]. Salt marshes are not only important for coastal defense, but they also play key roles for nursery habitat, biological production, and nutrient cycling within coastal communities and ecosystems [13]. Previous studies of breakwaters highlight how they can efficiently enhance mudflat stability and shoreline mitigation, waves attenuation, and facilitate fisheries production [14,15,16]; however, the effect that breakwaters have on the sediment supply for salt marshes remains poorly understood and not frequently examined. For example, Airoldi et al. (2005) [8], Moschella et al. (2005) [17] and Palinkas et al. (2016) [18], estimated the ecological impact of breakwaters, without considering their impact on sediment supply to salt marshes. Moreover, we note that Faraci et al. (2014) [19], who investigated the bottom profile evolution of a perched nourished beach by physical and numerical models, while in 2018 [20] investigated the morphodynamic and hydrodynamic response of a geocontainer submerged reef, focused on reflection and transmission through the structure. Similarly, Sumer et al. (2005) [21] investigated the local scour at roundhead and along the trunk of low crested structures.
Sediments play a crucial role for salt marshes, since their deposition promotes vertical accretion, allowing marshes to keep up with sea level rise [22,23]; moreover, coastal wetland enhancement driven by sedimentation can have direct consequences for shoreline protection, since the aboveground portion of vegetation can dampen waves and stabilize sediments [24]. As a result, local ecology and ecosystem functions can benefit from this sedimentation, since a healthy salt marsh also promotes feeding, roosting and nesting areas for a wide range of bird species [25,26] and nursery areas for many fish species [27].
In this study, we sought to fill knowledge gaps on how breakwaters may influence marsh nourishment using the numerical model Delft3D coupled with SWAN (Simulating WAves Nearshore). Breakwater effects on sediment supply to salt marsh were modelled under different scenarios of waves and tide conditions. This same numerical modelling approach has already been used to investigate the impact of waves on coastal morphology [28,29], estimate the effect of tides on the alternative deposition of mud and sand [30], examine the influence of vegetation on bars evolution [31], and simulate wave propagation in harbors [32].

2. Materials and Methods

Model Description

We present modeling results on how breakwaters affect the resilience of salt marshes under different wave conditions in a rectangular basin with rectangular cells, whose long cell dimension is parallel to the coast. The different run configurations use the same domain, but with different sediments, waves, tides, basin slopes and distances of the breakwater to the shoreline.
Delft3D [33,34] is an open-source computational fluid dynamics package that simulates fluid flow, waves, sediment transport, and morphological changes at different timescales. An advantage of Delft3D is the full coupling of the hydrodynamic and morphodynamic modules, so that the flow field adjusts in real-time as the bed topography changes. The equations of fluid motion, sediment transport, and deposition are discretized on a 3D curvilinear, finite-difference grid and solved by an alternating direction implicit scheme. For our model, we used the bi-dimensional formulation of the hydrodynamic and morphodynamic models implemented in Delft3D.
The generation and propagation of waves in shallow water is computed by SWAN, which is able to mimic random, short-crested waves in the open ocean and in shallow water regions. The key processes incorporated in SWAN are wave-wave interactions, wave refraction, and wave dissipation, that includes bottom friction [35] and wave breaking [36].
Here, we present the essential model equations, but further details can be found in Lesser et al. (2004) [34].
The mass-balance equation in Cartesian coordinates for an incompressible fluid with shallow water approximation, which is solved by Delft3D is:
· V = 0 ,
where V is the velocity vector with component u, v, w along the x, y and z direction. The momentum equations for unsteady, incompressible and turbulent flow is:
ρ D V D t = p + · τ + ρ g ,
where D V D t is the material derivate, ρ is the fluid density, V is the flow velocity, p is the pressure and τ is the fluid shear stress tensor which has order two.
Due to the shallow water approximation, the vertical momentum equation is reduced to the hydrostatic pressure equation; the vertical and horizontal eddy viscosity instead are computed by the k–ε model [37] and a large eddy simulation method [38], respectively.
The suspended sediment transport is calculated by solving the three-dimensional advection-diffusion equation:
C t = D 2 C V · C + R ,
where C is the mass concentration, D the diffusion coefficient, V the velocity field and R describes sources or sinks of the quantity C.
For cohesive sediments, the exchange between the water column and the bed in term of erosion and deposition are calculated with Partheniades–Krone formulations [39], while for non-cohesive sediments, the exchange is computed by the Van Rijn method [40], in which the formulation depends on the diameter of the suspended sediment (see Supplementary Materials).
Changes in bed bathymetry are computed from the gradients in sediment transport vectors as follow:
( 1 ε p o r ) z b d t = S x d x S y d y + T d ,
where ɛpor is the bed porosity, zb is the bed level (positive up) (m), Sx, Sy are the total sediment transport components per unit width in the x and y directions (m2/s), and Td is the deposition or erosion rate of the suspended sediment (m/s).
The evolution of the wave motion is instead described by SWAN, solving the spectral action balance equation:
  t N +   x c x   N +   y c y   N +   σ c σ   N +   θ c θ   N = S σ ,
where the left-hand side is the kinematic part of the equation. The first term represents the local change rate of action density in time, while the second and the third one describes propagation of action in geographical space (along the x-y direction with velocity cx and cy respectively). The fourth term represents shifting of the relative frequency due to variations in depths and currents, the fifth is the depth-induced and current-induced refraction, and lastly, the quantities cσ and cϴ are the propagation velocities in the spectral space. The right-hand side of the equation contains the source/sink term that represents all physical processes, including generation, dissipation, or wave energy redistribution.
The model simulates the hydrodynamic and sediment transport processes involved in the morphological evolution of a salt marsh, in the presence of subtidal breakwater. The numerical domain is a square (2 km × 2 km), whose computational grid is composed of 147 × 143 cells, in the x and y direction respectively, which is refined gradually from the eastern side (40 m × 40 m) to the western (5 m × 5 m) (Figure 1).
The breakwater was imported into the model as an integral part of the bed level, but with a non-eroding bottom, which made the structure waterproof. The height of the structure varied with xd (Figure 1b), while length and width were fixed at 100 m and 10 m, respectively.
In the vertical direction, five-meter-deep layer of mixed cohesive and non-cohesive sediments was originally accessible for erosion at the bottom of the domain. Neumann conditions were imposed on the North and South boundary, while on the East boundary different conditions were fixed: incoming waves, incoming sediment concentration and water level variation.
We wanted to simulate the most realistic and natural conditions possible found among coastal wetland environments in Chesapeake Bay. For this reason, we referred to and adopted values from Wiberg et al. (2019), who, in her experiment in Virginia Coastal Reserve, measured waves between 0.03 and 0.52 m and bathymetric slopes between 0.28% and 1.05%. For sediments instead, we referred to Russ and Palinkas (2018) [41], which, in their study, confirmed high mud content in sediment deposits in Chesapeake Bay, also registering median diameters between 50 and 300 µm.
We set up our runs varying the basin slope (0.4% and 0.8%), the breakwater distance to the shoreline (xd) (50 m, 100 m, 150 m), wave’s height (0.2 m, 0.3 m, 0.5 m, 0.7 m), tide (±0.2 m ±0.4 m), sediment concentration (0.2 kg/m3 0.4 kg/m3) and the sand fraction diameter D50 (100 µm 150 µm). Non-cohesive sediments were characterized by a specific density of 2650 kg/m3 and dry bed density of 1600 kg/m3, while characteristics of the cohesive sediment were chosen in agreement with values provided by Berlamont et al. (1993) [42]. Specific density was 2650 kg/m3, dry bed density was 500 kg/m3 and setting velocity was 0.5 mm/s. Wave parameters (Hs and Tp) were selected to simulate waves generated into the bay, so we analyzed the previously mentioned Hs values with a period Tp of 5s and a direction orthogonal to the shoreline. We imposed these values at the East boundary. Wave reflection was not accounted for in the wave model, so that wave energy was dissipated at the coastline.
The bottom stress was modelled with Chézy’s formulation. We used two different values of this parameter, one for the bed level of the domain (CD = 60) and one for the breakwater roughness (CD = 20). The initial condition of the models consisted of an initial water level fixed at 0.4 m. The suspended sediment eddy diffusivities were a function of the fluid eddy diffusivities and were calculated using horizontal large eddy simulation and grain settling velocity. The horizontal eddy diffusivity coefficient was defined as the combination of the subgrid-scale horizontal eddy viscosity, computed from a horizontal large eddy simulation, and the background horizontal viscosity, here set equal to 0.001 m2/s2 [43,44]. To satisfy the numerical stability criteria of Courant Frederichs–Levy, we used a time step Δt = 3 s [34]. To decrease the simulation time, a morphological scale factor of 50 was used in our models (a user device to multiply the deposition and erosion rate in each Δt). A sensitivity analysis showed that a morphological factor of 50 was acceptable.
Combining all the variables for run combinations (Table 1), we obtained 192 different simulations to run, from which the results were extracted. For symbols notation of Table 1 and Equations (1)–(5), refer to Table 2.

3. Results

Our focus was on the Delft3D models for simulating the hydrodynamics of flow and sediment transport, coupled with the SWAN wave analysis model. To understand how breakwaters impact salt marshes’ resilience, we first analyzed the wave damping and the hydrodynamic, followed by morphodynamics.
This modeling analysis revealed some key findings: breakwaters are efficient at breaking waves and reducing wave energy delivered the shoreline; the shear stress decreases with increasing breakwater distance to the shoreline and it also increases proportionally to wave heights. The slope also affects the shear stress. Slope was positively correlated with a greater magnitude of shear stress, which directly impacted marsh scarp erosion, since a steeper sloped basin eroded to a greater extent. However, the higher basin slope allowed more sediment deposition into the marsh. Similarly, model scenarios with the closest distance of the breakwater from the shoreline and those with higher incoming waves also promoted deposition into the marsh. Last, comparing deposition into the marsh behind the breakwater with an area not covered by the structure, we found that breakwater is likely to block sediments, since deposition far from the breakwater was higher.
In the following, a detailed analysis of model results and coastal geomorphological implications is reported.

3.1. Hydrodynamic Results

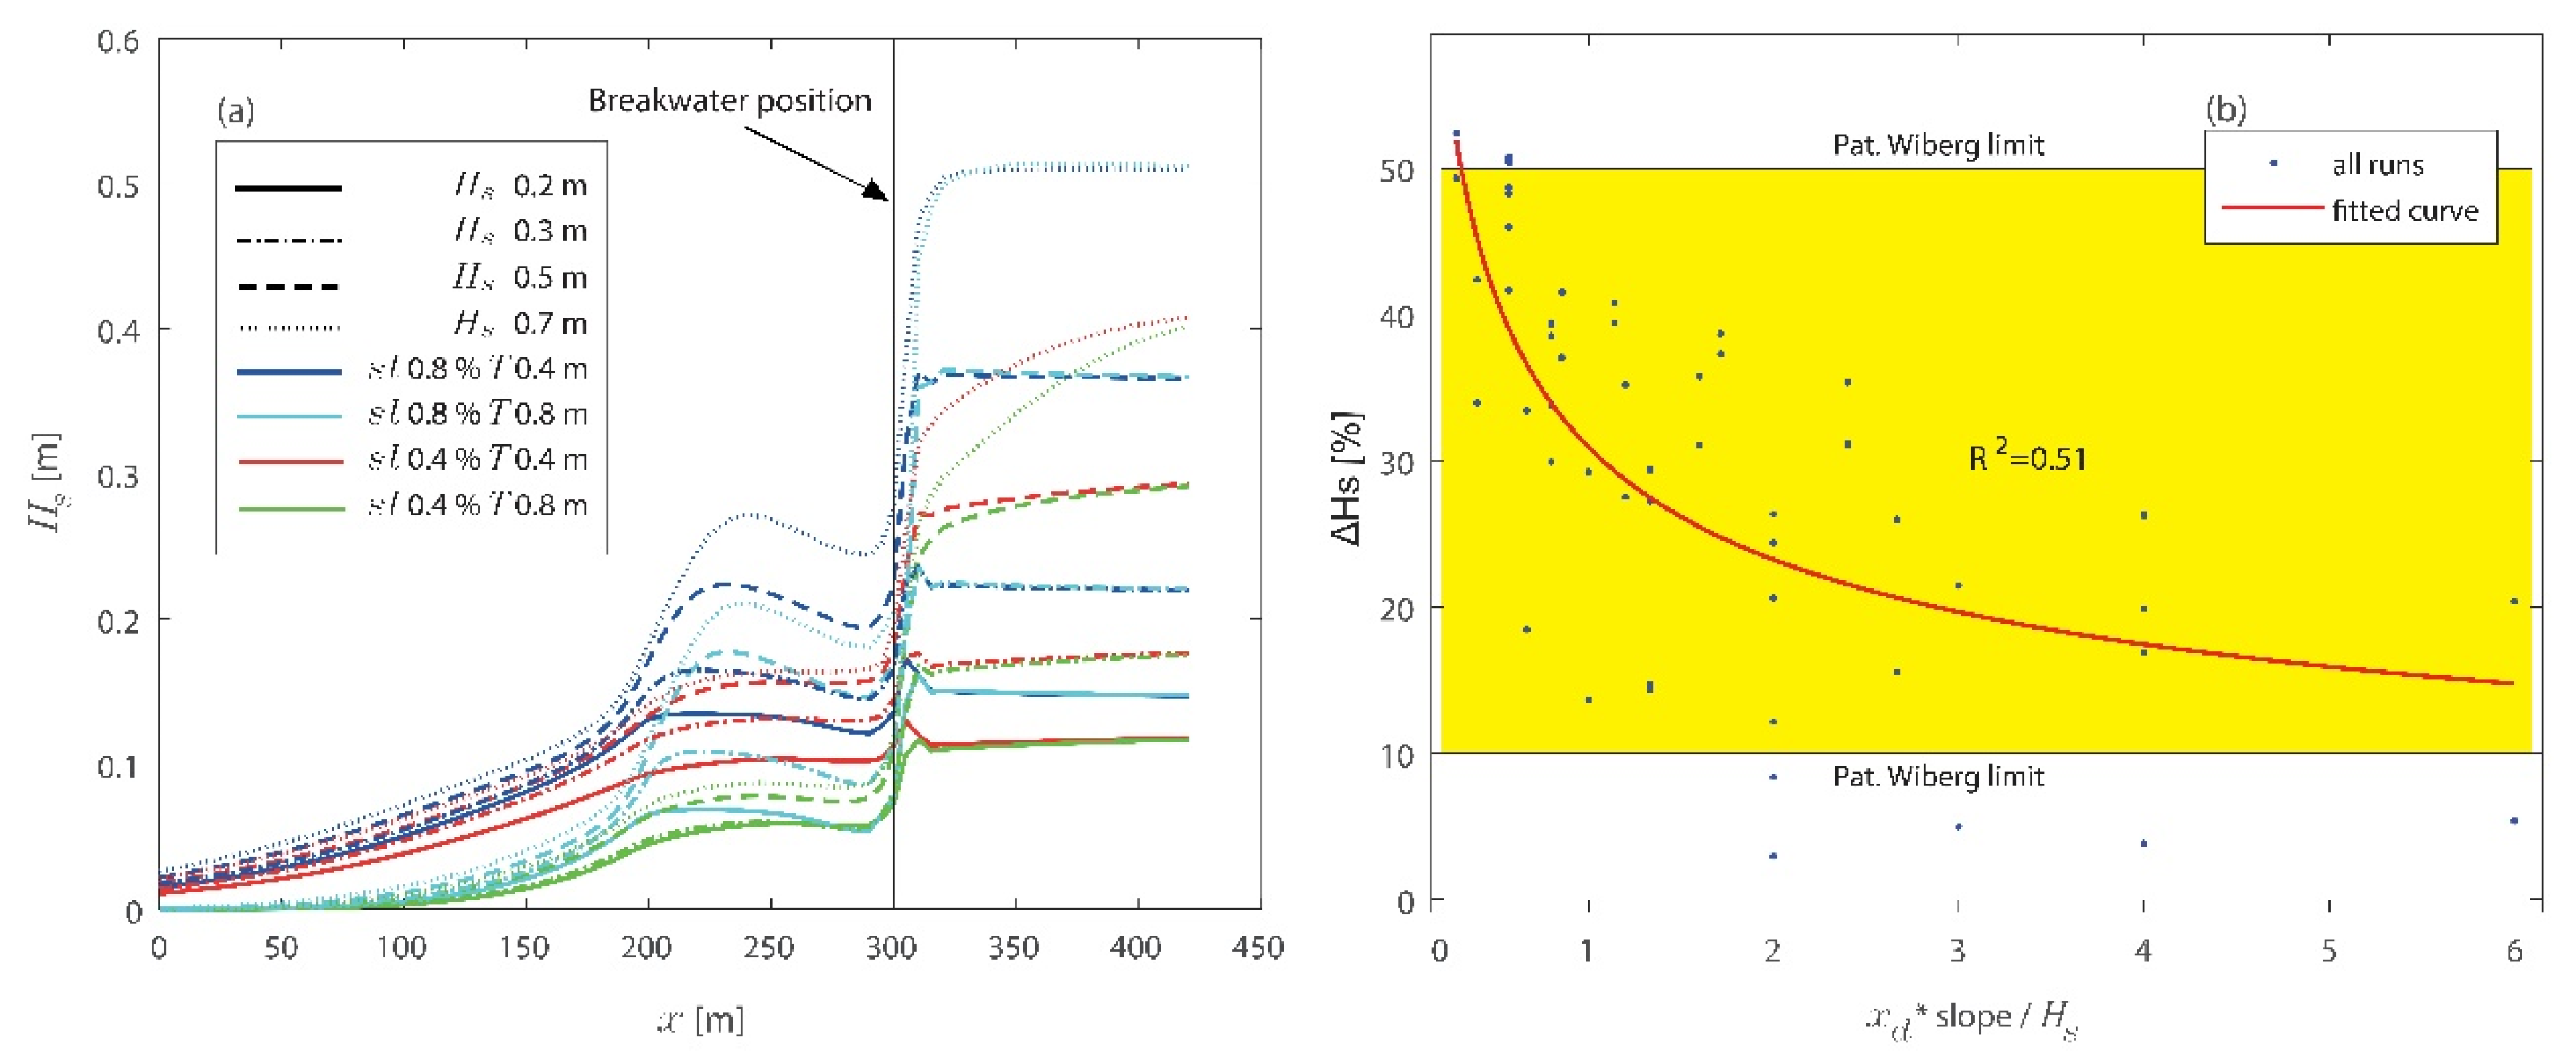
The breakwater was found to efficiently dampen between 10–50% of the incoming wave heights under all configurations (Figure 2). The wave damping was inversely proportional to xd and proportional to Hs following a power law (R2 = 0.51), while the slope did not affect this specific process. Our results (Figure 2b) were markedly consistent with the wave damping results of Wiberg et al. (2019) [15], who also observed a reduction of between 10–50% of incoming waves in a similar coastal environment at the Virginia Coastal Reserve (VCR).
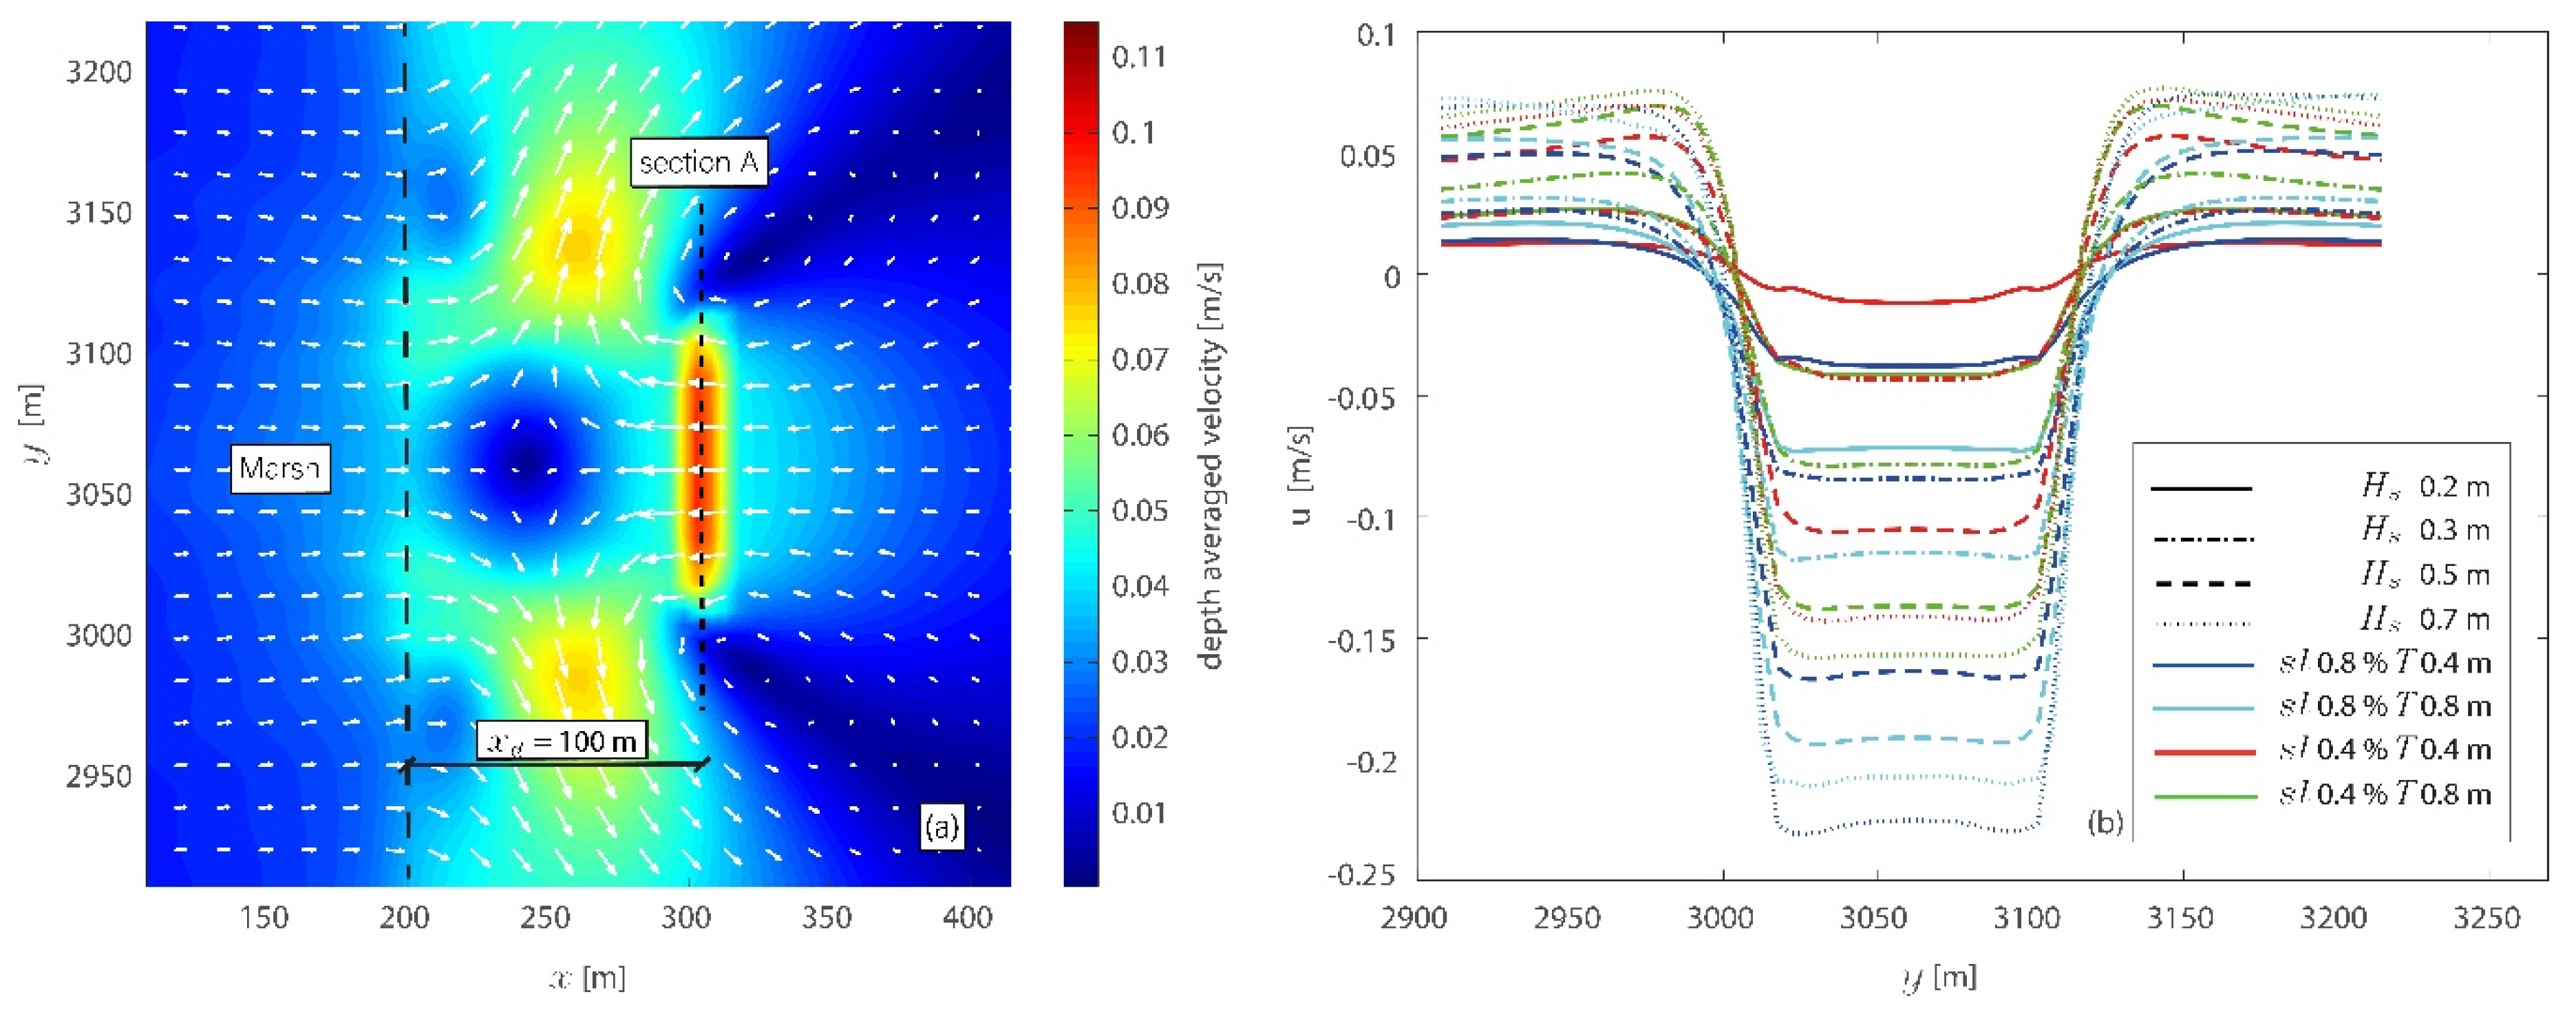
A clear increase in wave height (Hs) immediately behind waves were dampened on breakwaters (Figure 2a), which were created by the vorticity generated by the breakwater, which made the u velocity component negative (Figure 3b), drawing water back to the breakwater:
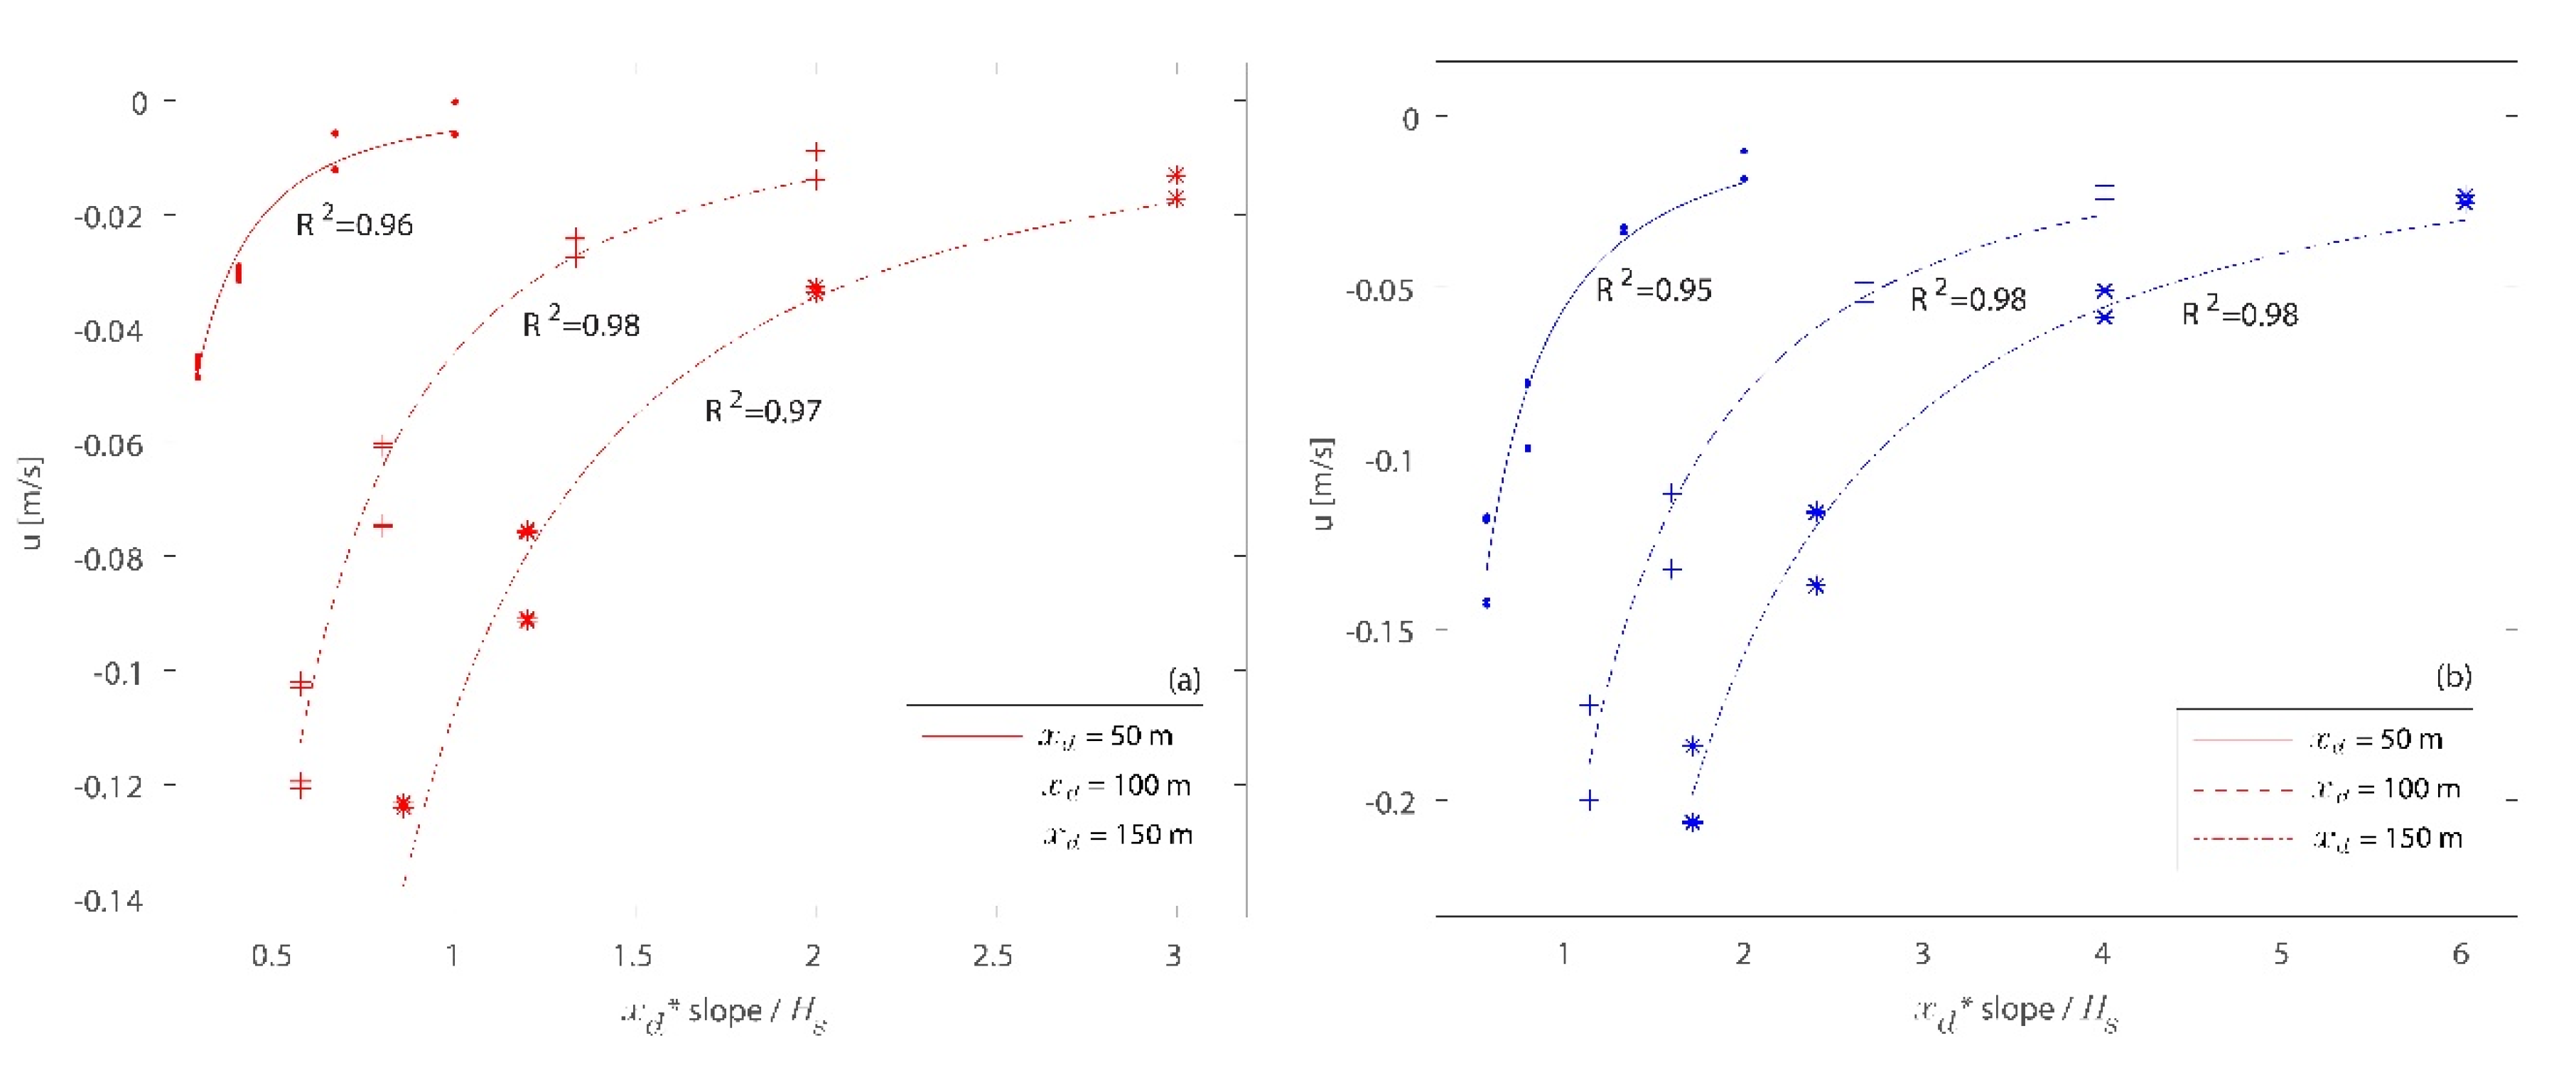
The magnitude of the u velocity component was inversely proportional to Hs and slope, and proportional to xd following a power law (Figure 4 0.95 < R2 < 0.98), which described how increasing the waves and distance of the breakwater to the shoreline allowed these vortices to direct water behind the breakwater and raise the wave crests vertically (Figure 4).
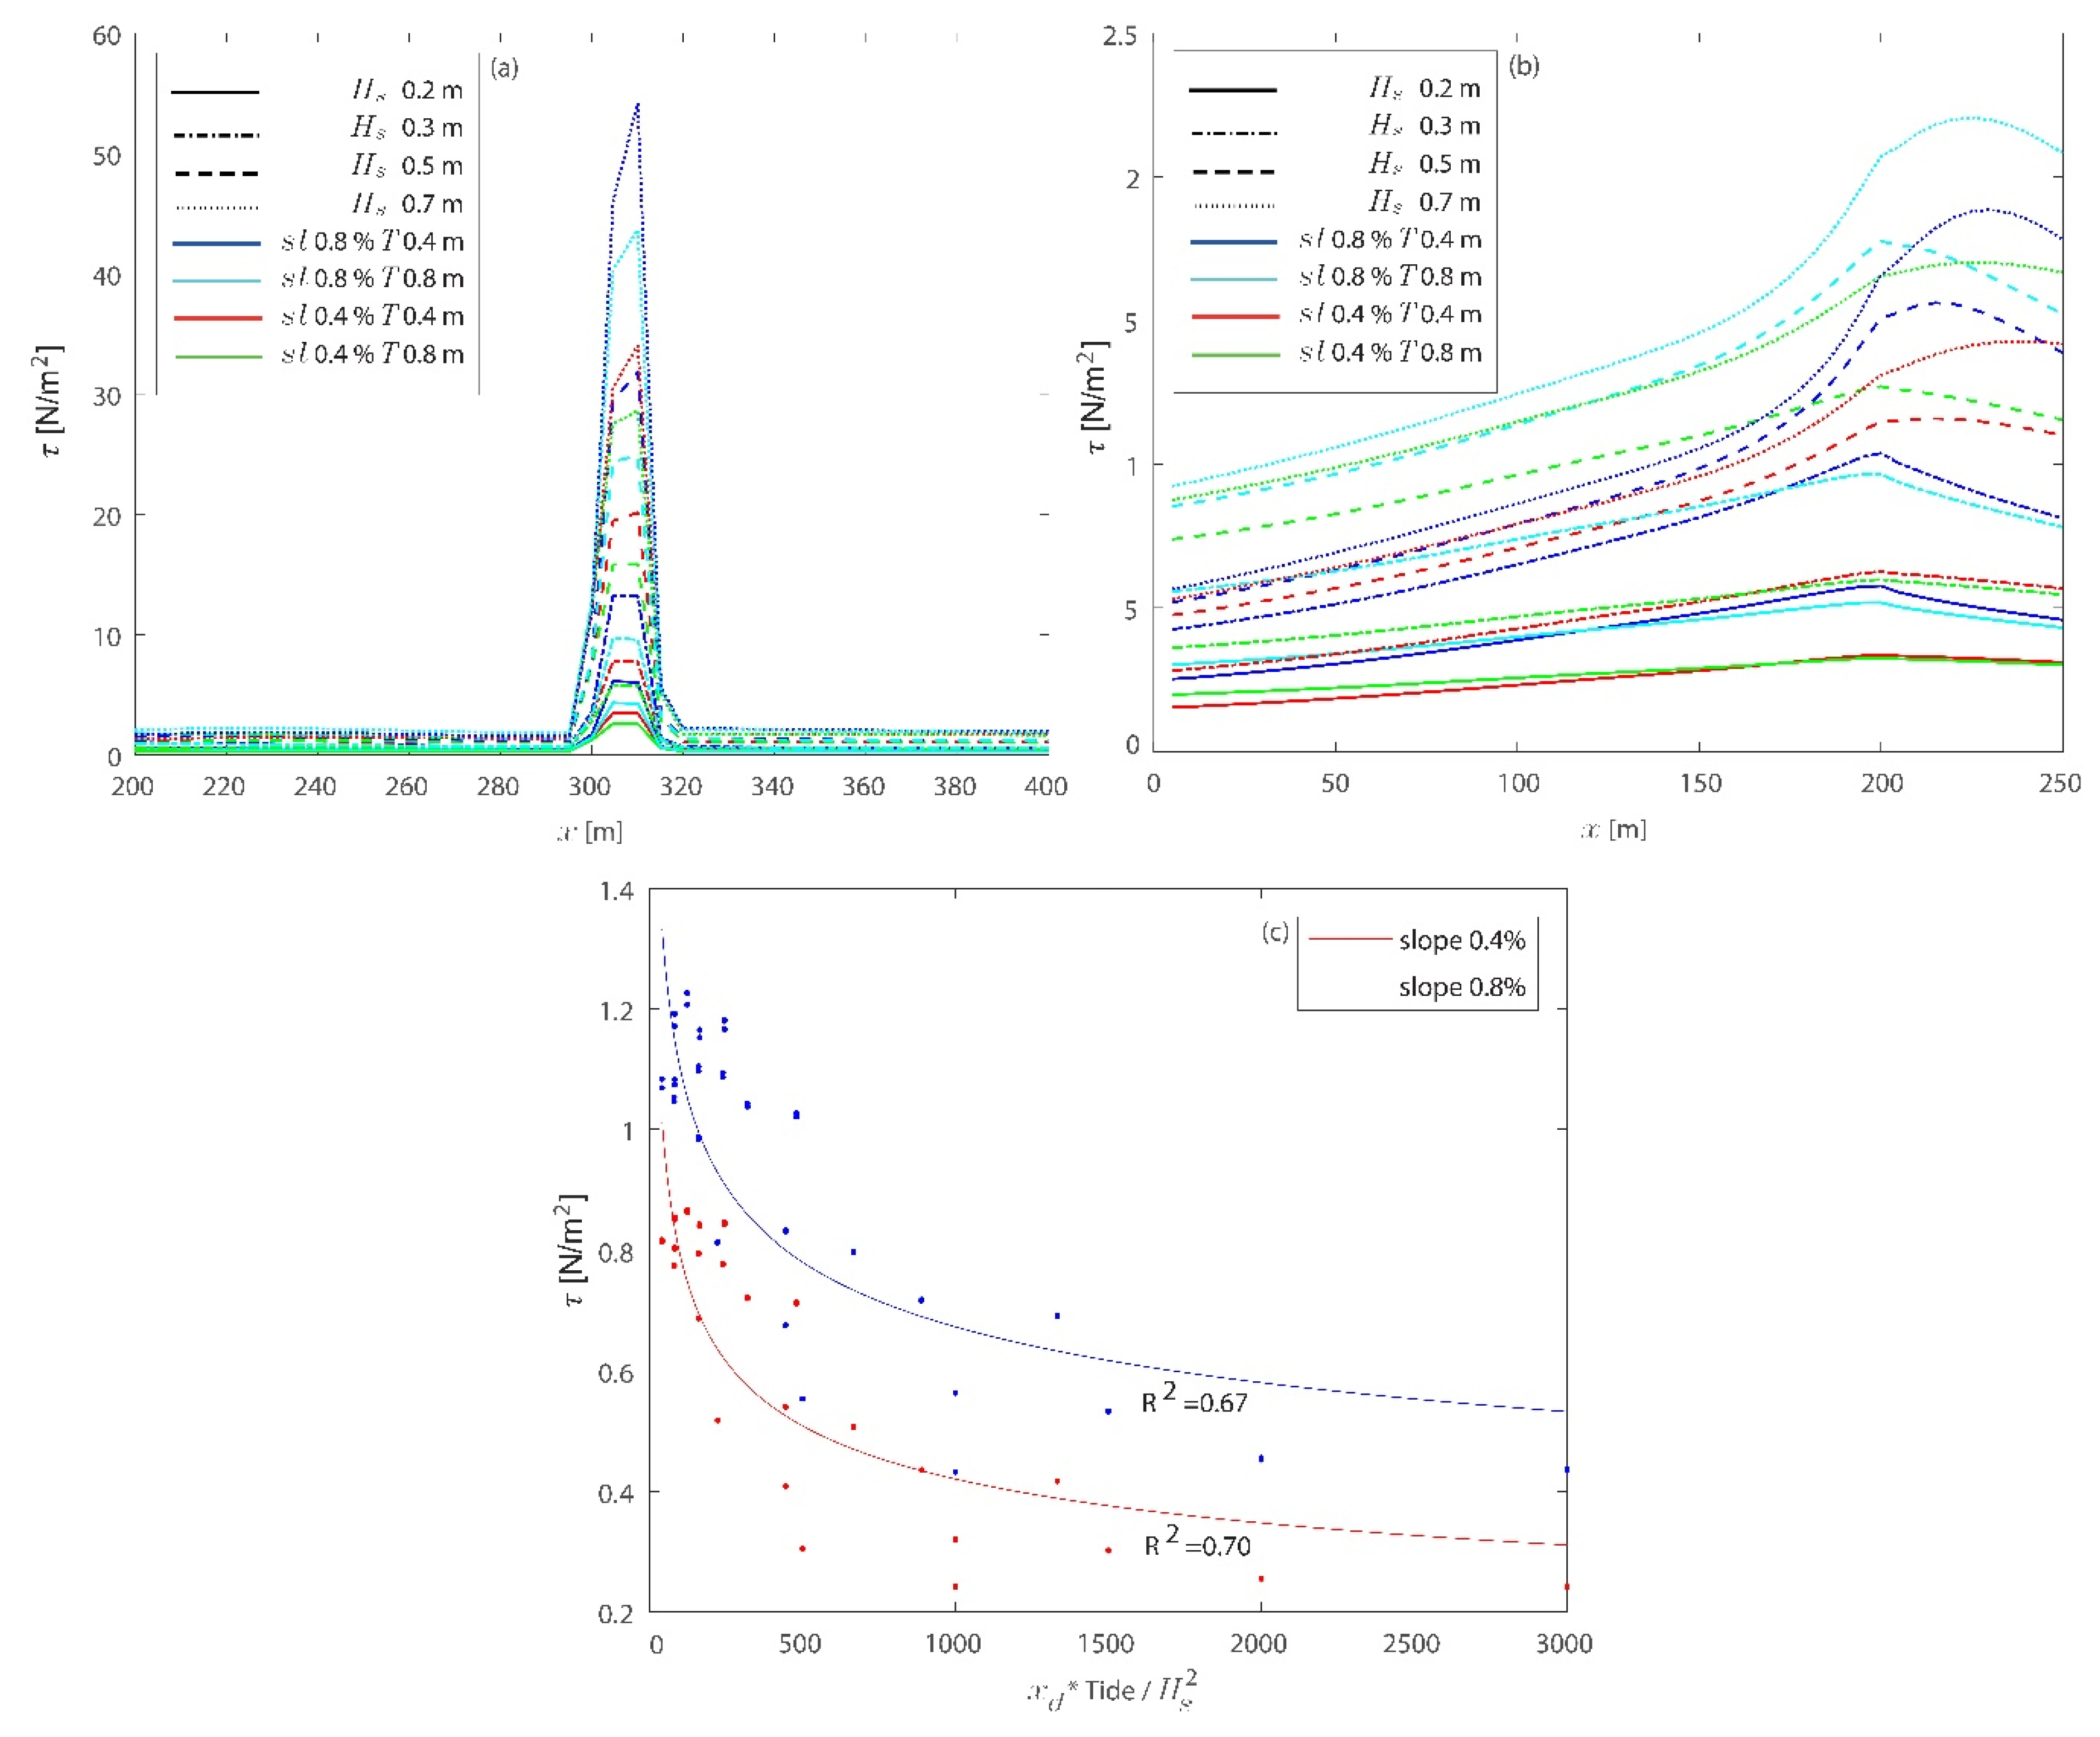
The shear stress peak due to the presence of the breakwater was clearly identified (Figure 5a), while the shear stress value into the marsh increased with wave height, slope and tide (Figure 5b). The shear stress value at the marsh scarp (x = 200 m) for all runs, as a function of xd, tide and waves, revealed how the magnitude of the shear stress was proportional to Hs and inversely proportional to xd and the tide, while the slope increasing effect augmented the erosion at the marsh edge (Figure 5c). Shear stress was correlated with the dimensionless variable for all distinct runs with slope 0.4% (R2 = 0.70) and 0.8% (R2 = 0.67).

3.2. Morphodynamic Results

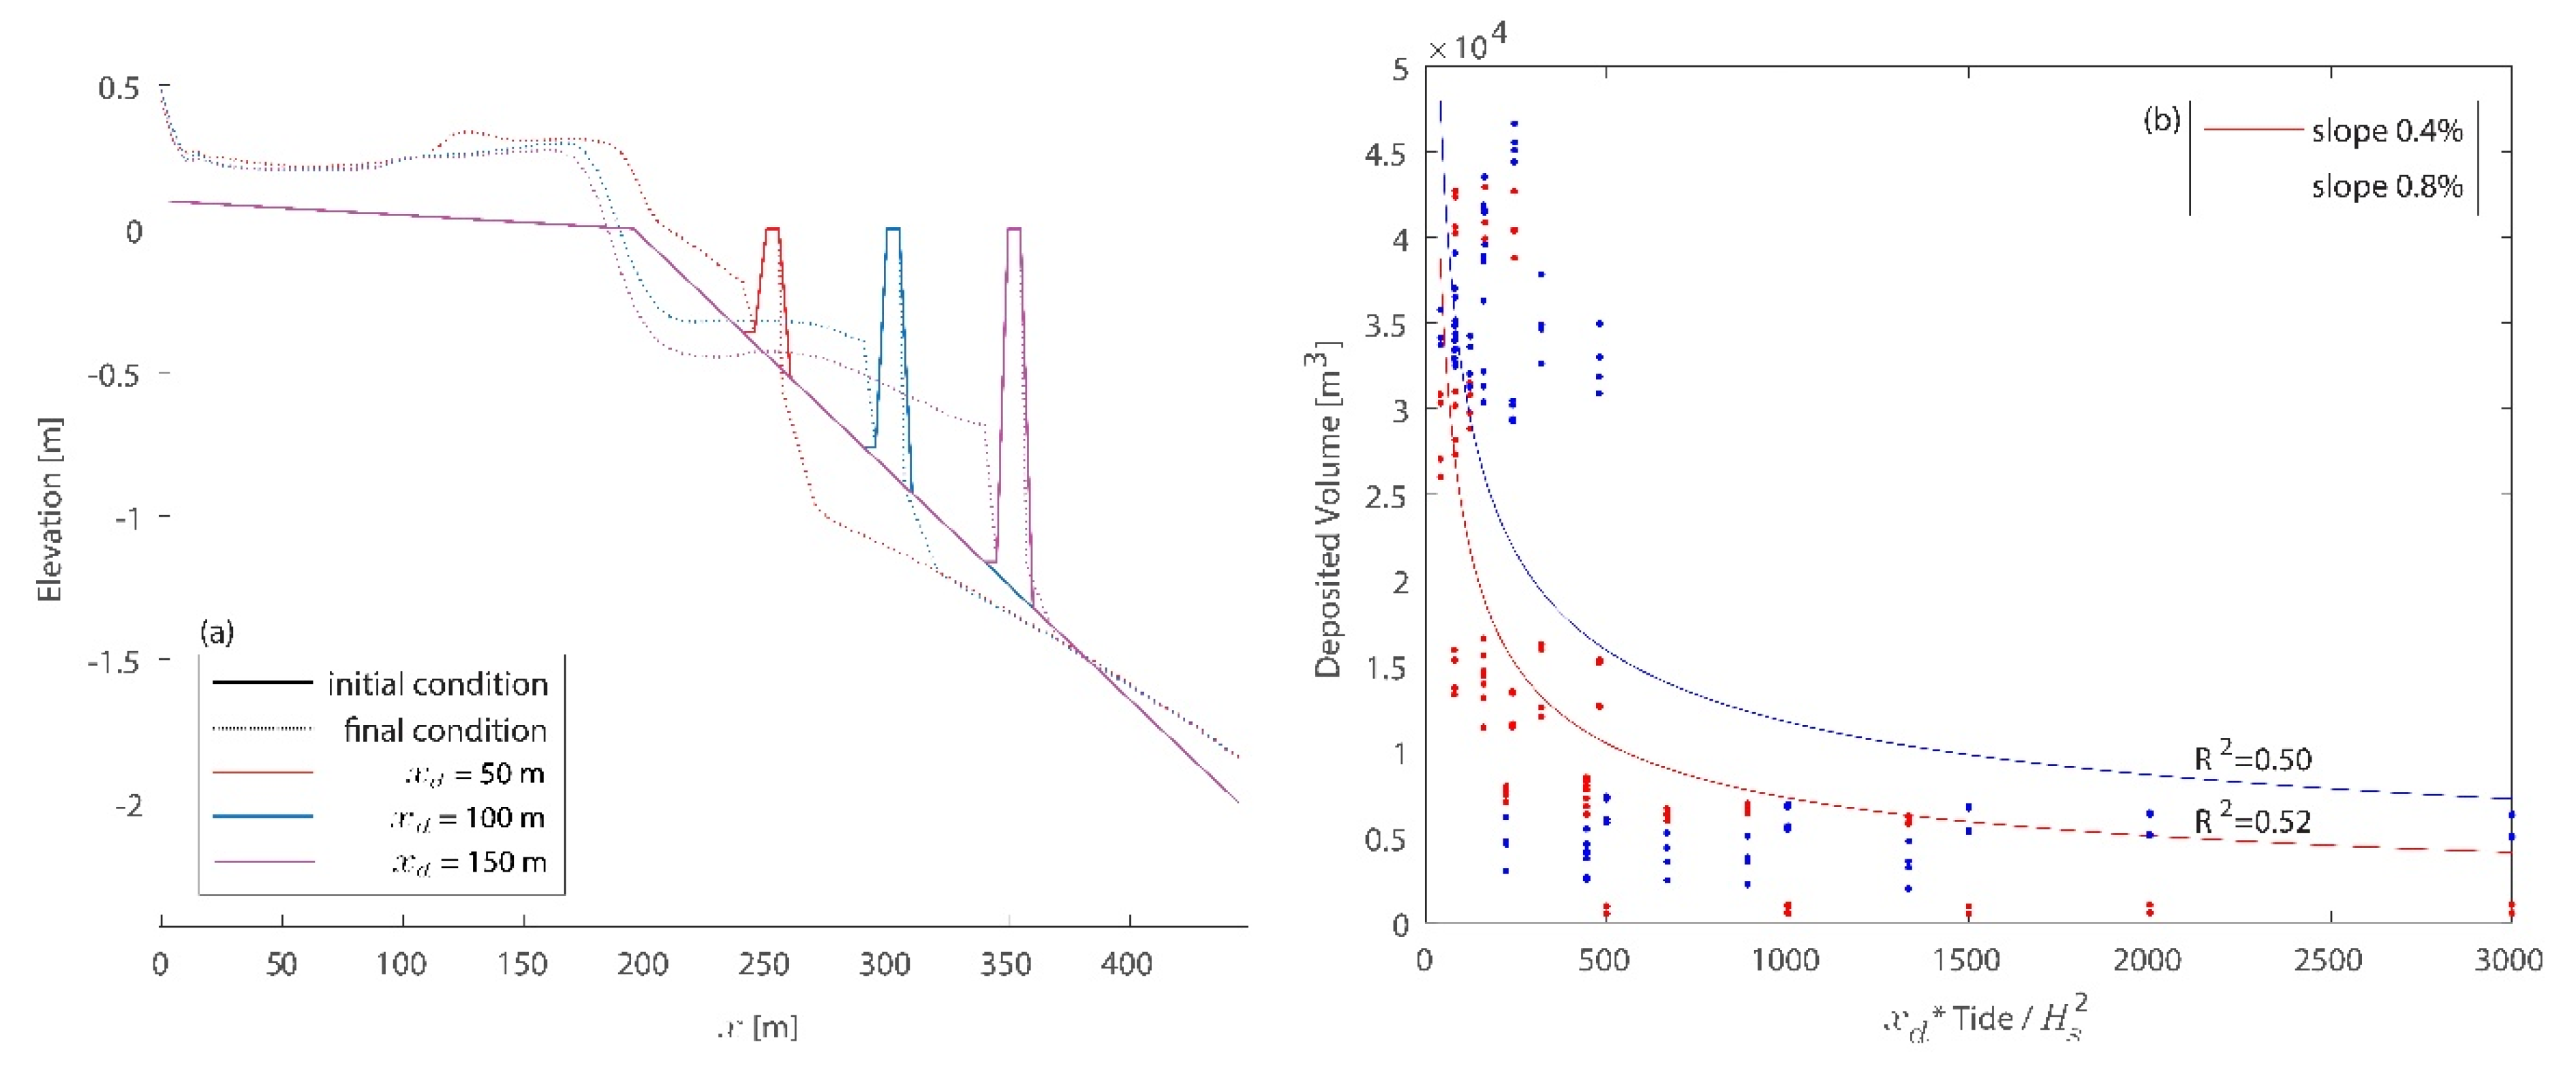
Breakwaters impacted the shoreline damping waves and created a low energy zone behind the structure, allowing sedimentation. Our results demonstrated how sediment accumulation into the marsh at the end of the simulations was inversely proportional to the distance of the breakwater to the shoreline and proportional to Hs. The distance of the breakwater from the shoreline plays an important role on sediment transport. Breakwater distance to shoreline was negatively correlated with the amount of sediment deposited into the marsh (Figure 6a). The volume deposited was proportional to Hs and inversely proportional to xd and the tide, following a power law correlation (0.50 < R2 < 0.52), while the slope increasing increase the sediment accumulation into the marsh (Figure 6b). Figure 6a also shows how a greater distance of the breakwater from the shore leads to greater erosion of the marsh scarp, an aspect that will be taken up later in the manuscript.
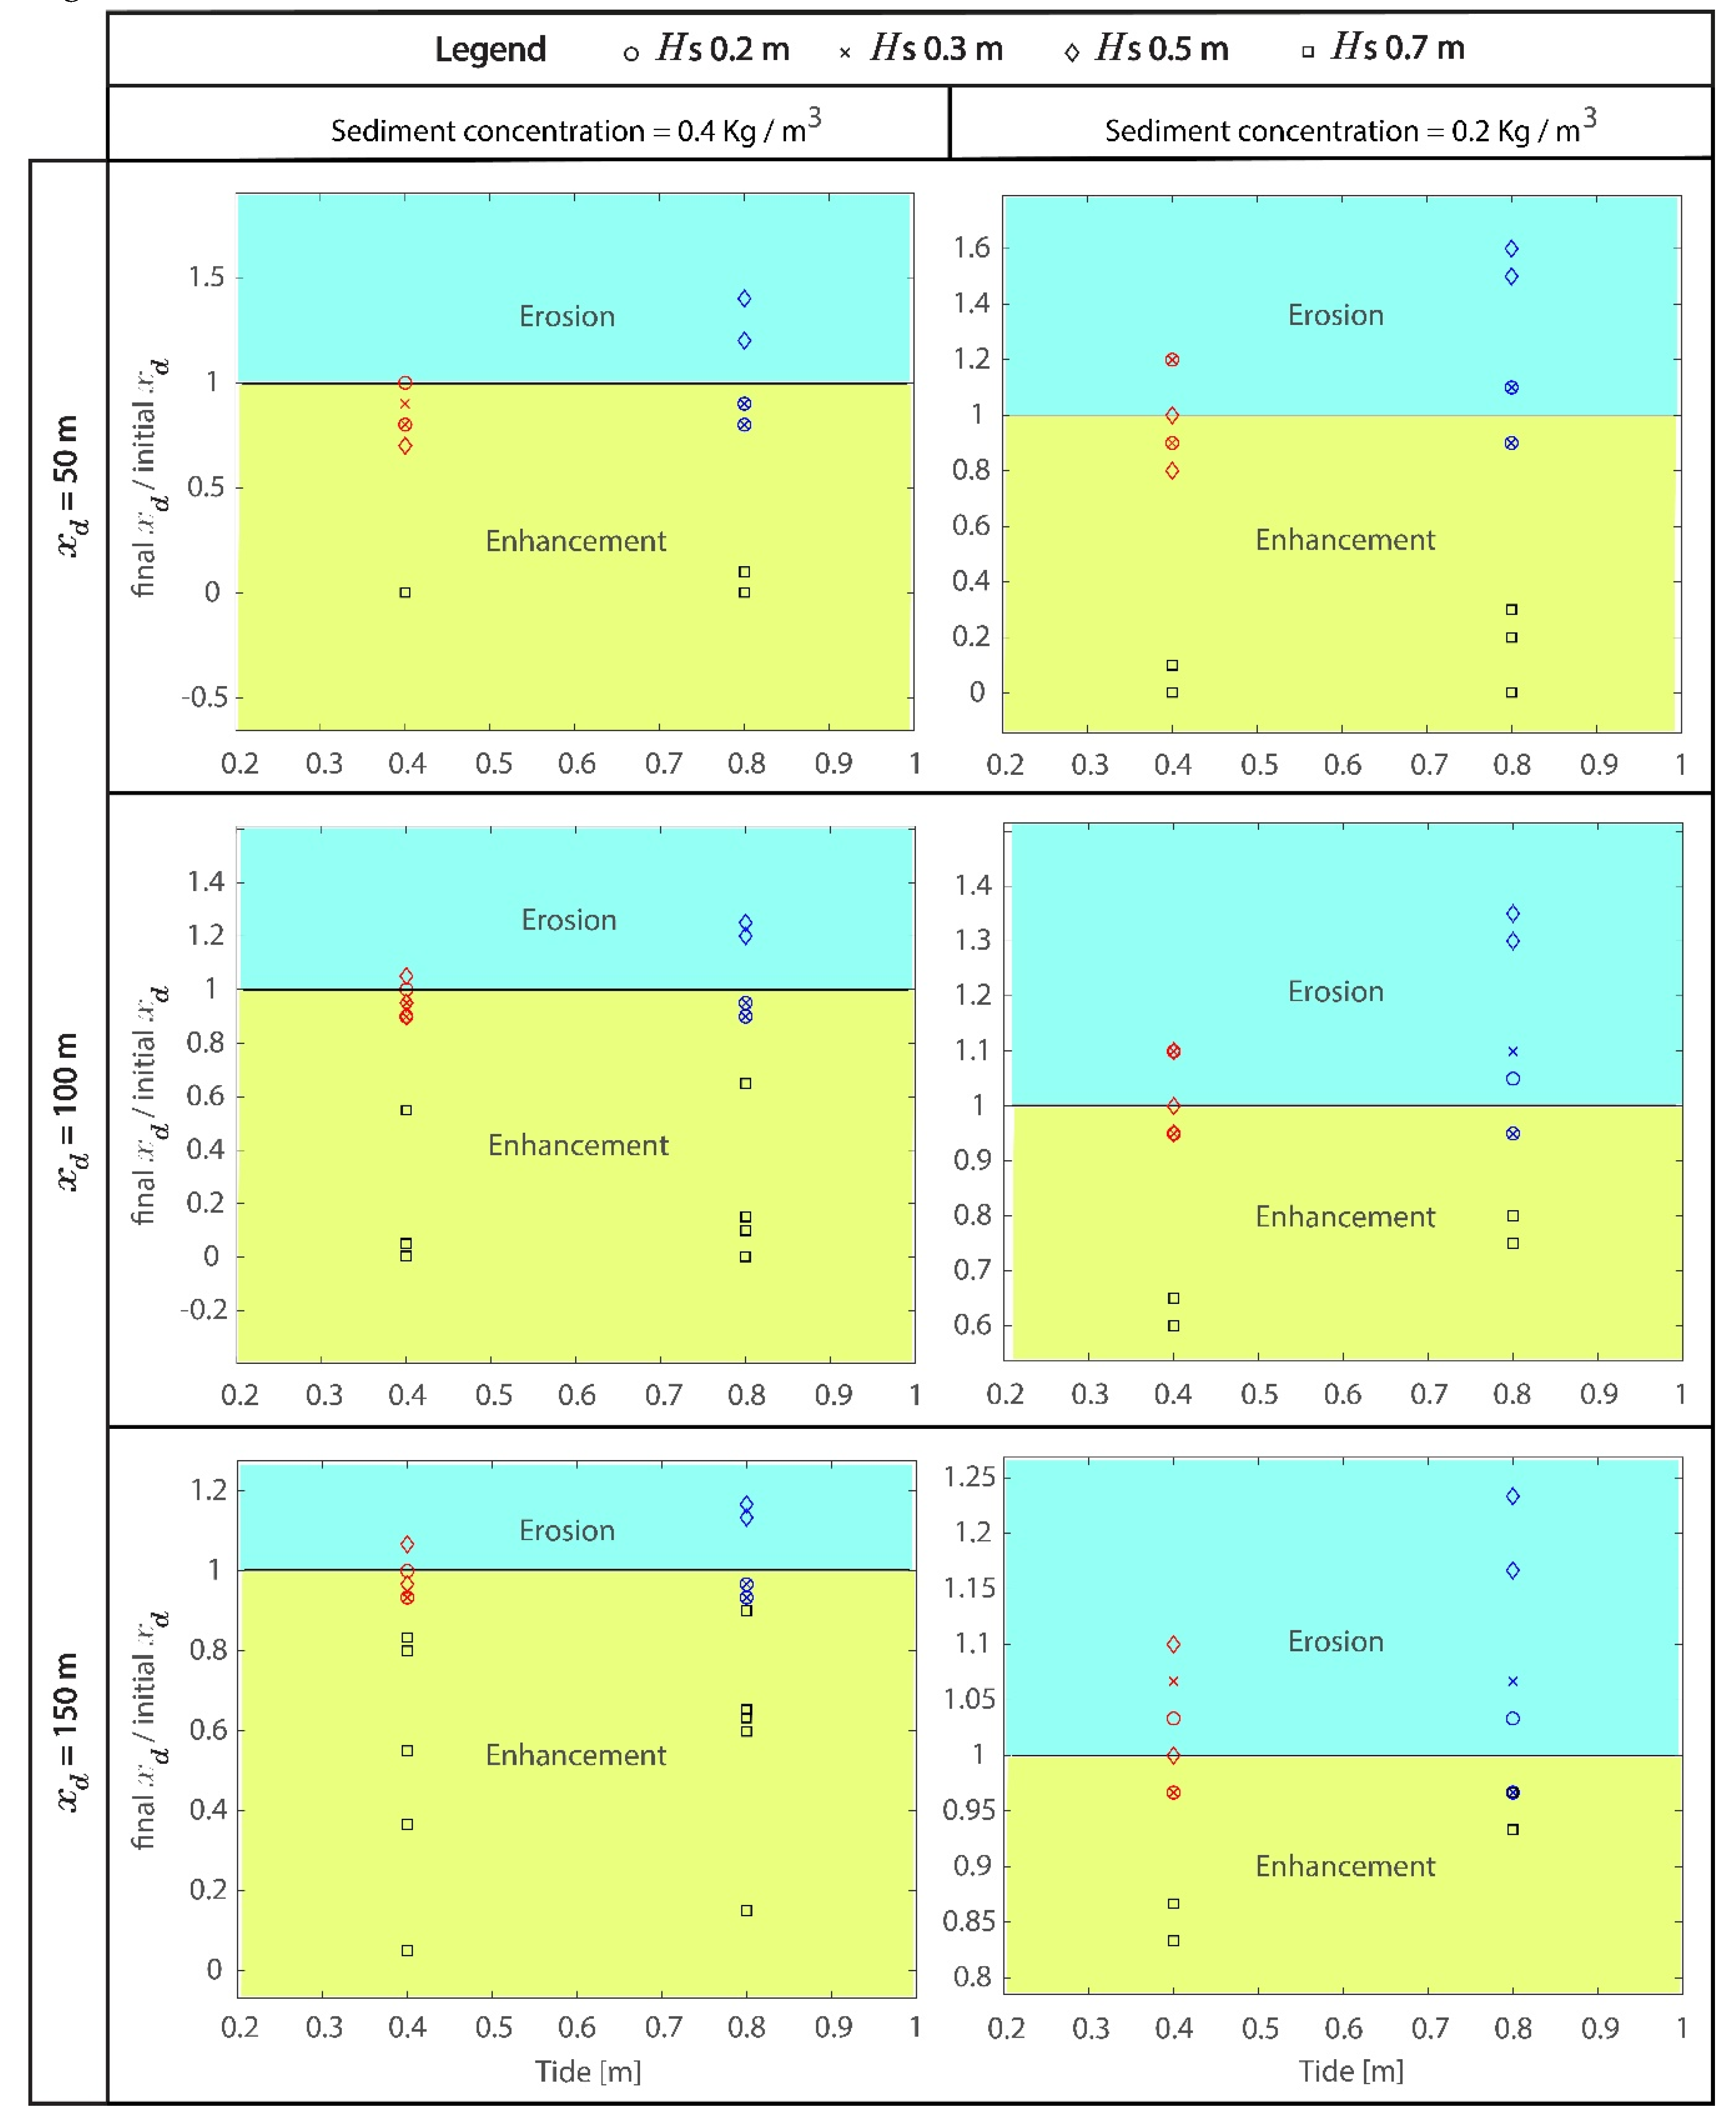
We identified and quantified several important structural (e.g., breakwater position) and environmental characteristics (wave height bathymetric slope) on sediment deposition within marshes; we calculated the deposited volume as the difference between the initial bed level and the bed level at the end of the simulation into the saltmarsh behind the breakwater, and then multiplied by the area of the cells in order to obtain the total deposited volume. The estimation was therefore punctual made cell by cell. With regards to the wave height abatement, on the other hand, an average wave damping was calculated during a tide cycle. However, the tide was found to play a dominant role in marsh erosion (Figure 7). This role was illustrated using the erosion ratio, defined as the final xd over the initial value of xd as function of the tide for all the xd, wave heights and for the two different values of concentration. We observed the tide to be strongly and positively correlated with the erosion at the marsh boundary. The erosion ratio for the 0.8 m tide condition, which reached the marsh platform at low tide, was greater than the 0.4 m tide condition, as increasing both the breakwater distance to the coastline and the wave height was observed to increase shoreline erosion. Additionally, the lower suspended sediment concentrations lead to higher erosion. It is also possible to observe how wave heights equal to 0.7 do not follow the same behavior as the other wave heights, but only cause deposition in the marsh (Figure 7). This mismatch is due to the great energy that the model develops in the presence of such waves, in environments governed by a very low energy regime.
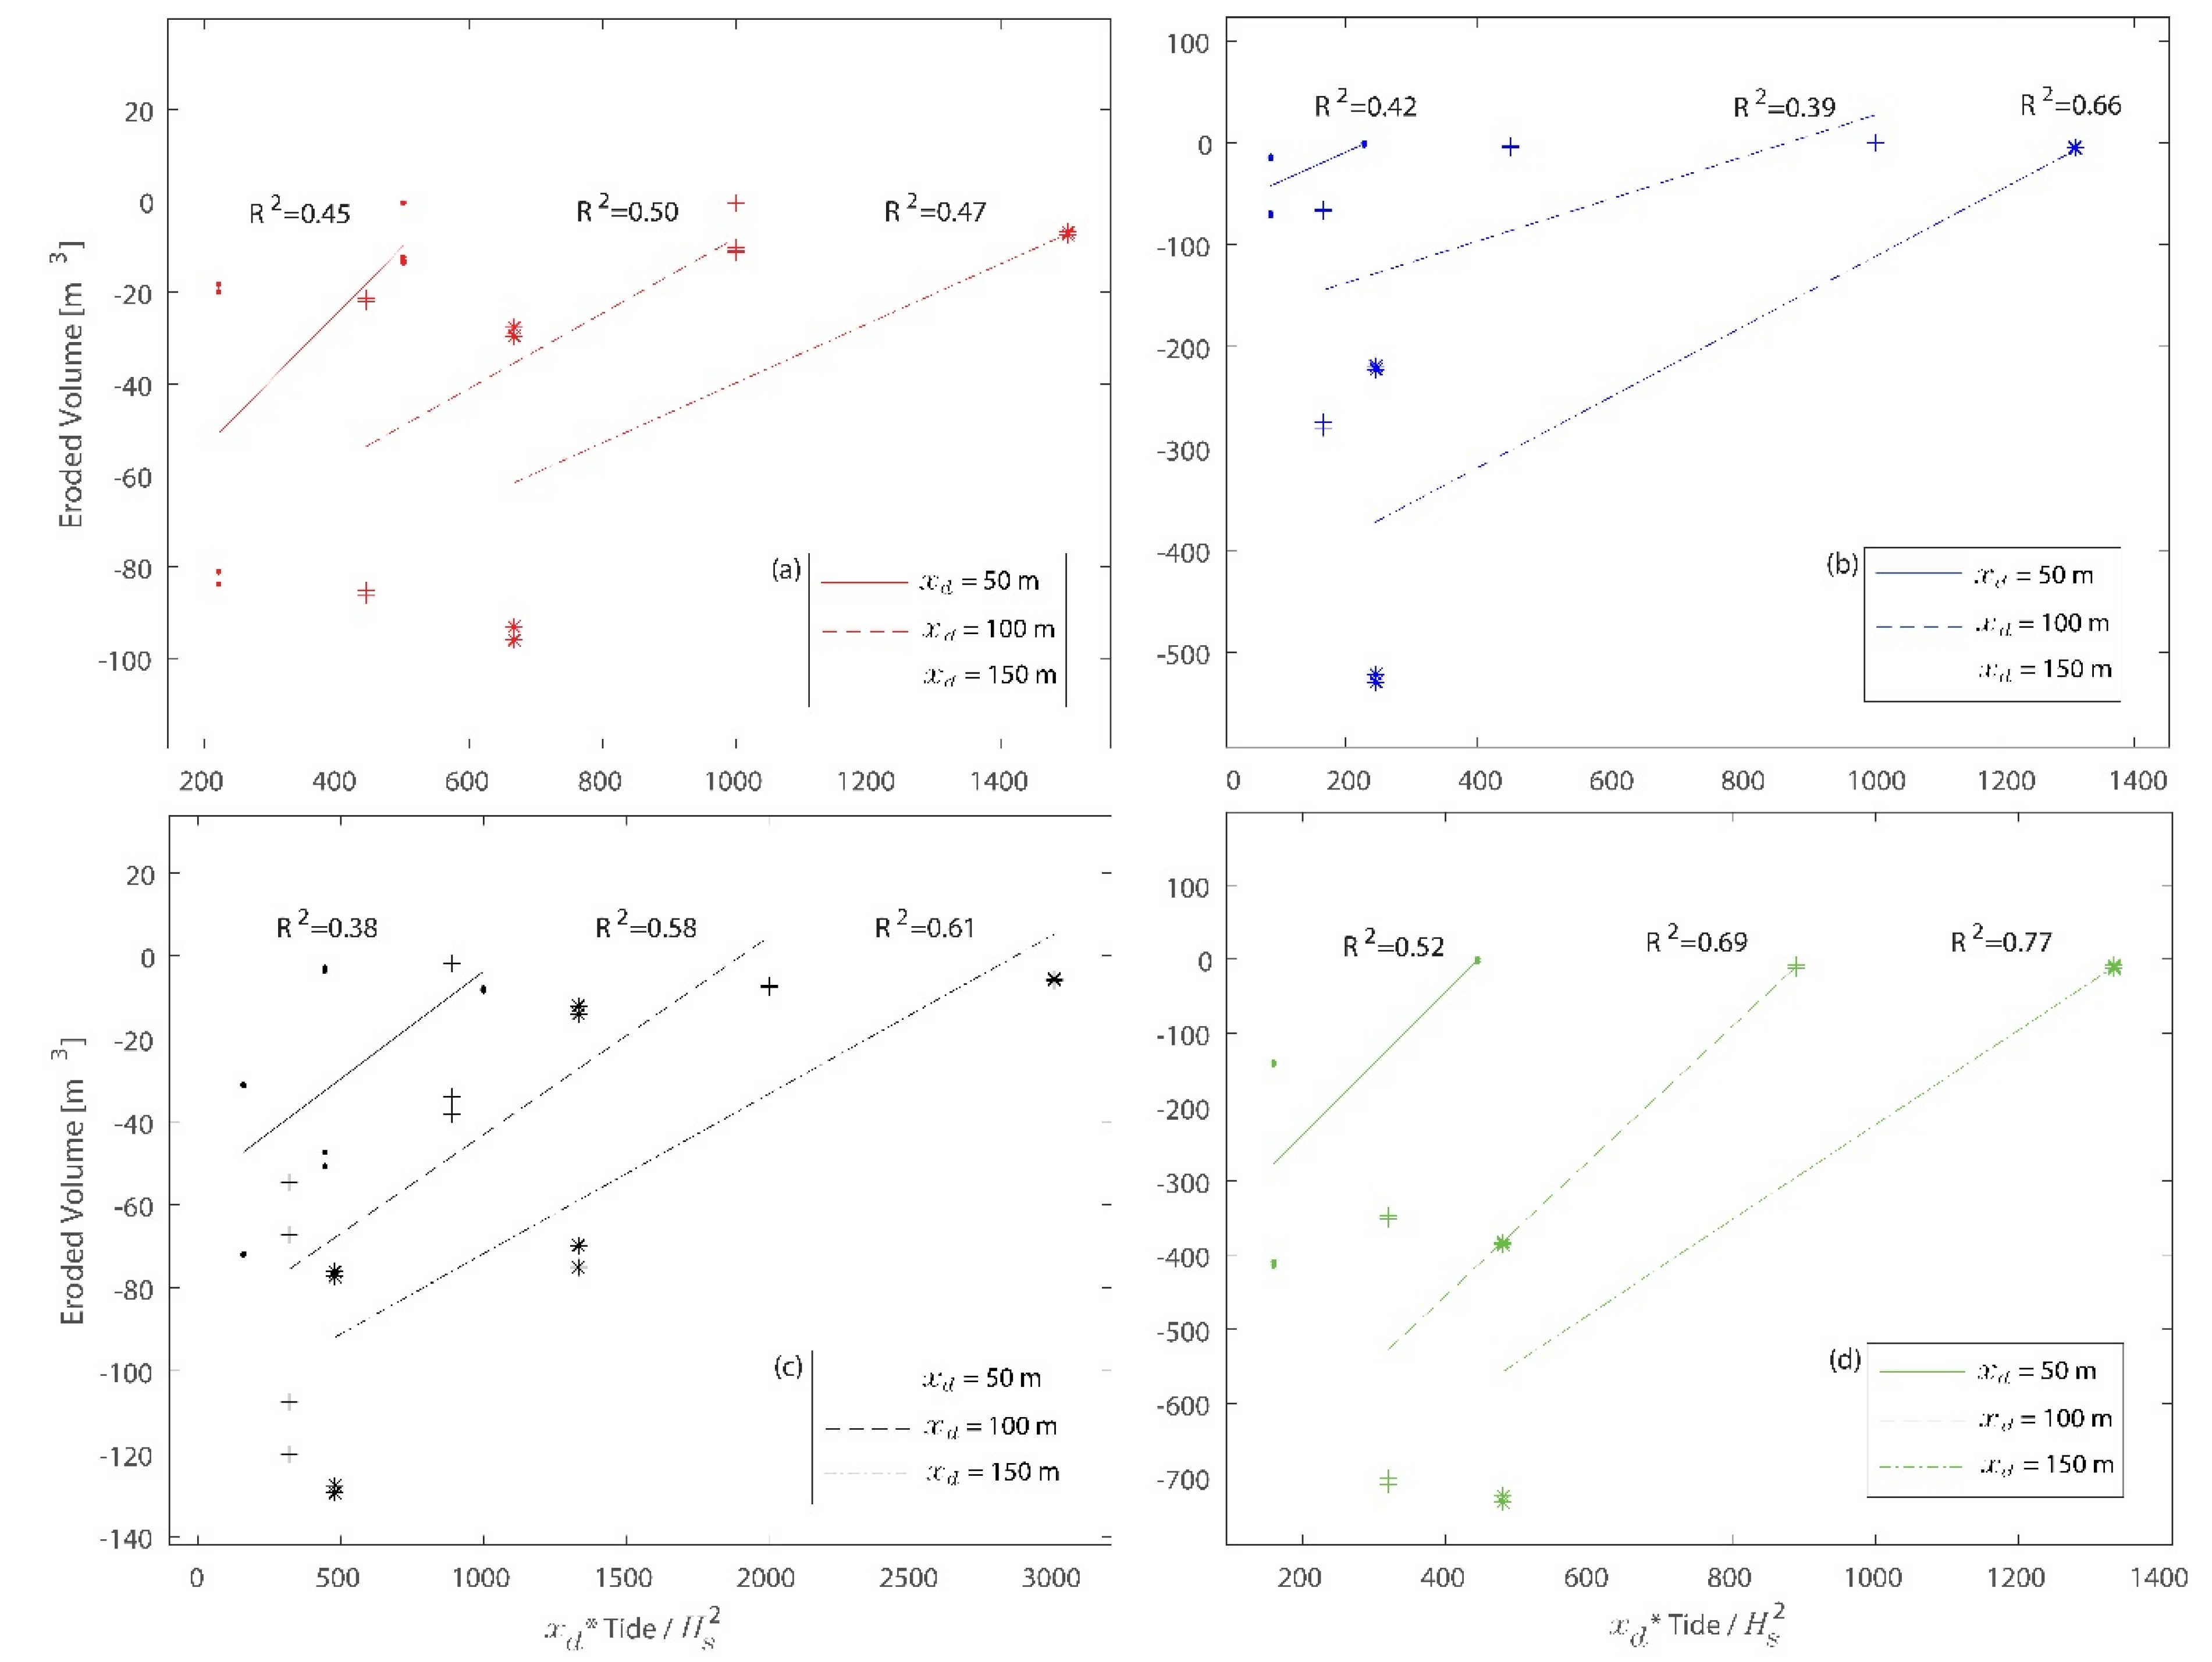
The eroded volume of the marsh scarp from model configurations found to cause erosion (see Figure 7), as function of the dimensionless variable xd* Tide/Hs2, for the two different slopes and tides, is summarized in Figure 8. A linear correlation between the dimensionless variable and the eroded volume for the slope = 0.4% and tide = ±0.2 m (Figure 8a), slope = 0.4% and tide = ±0.4 m (Figure 8c). Another linear correlation between the dimensionless variable and the eroded volume for the slope = 0.8% and tide = ±0.2 m (Figure 8b), slope = 0.8% and tide = ±0.4 m (Figure 8d). Collectively, these relationships demonstrate how the erosion was proportional to the slope, tide, wave height and the breakwater distance to the shoreline.
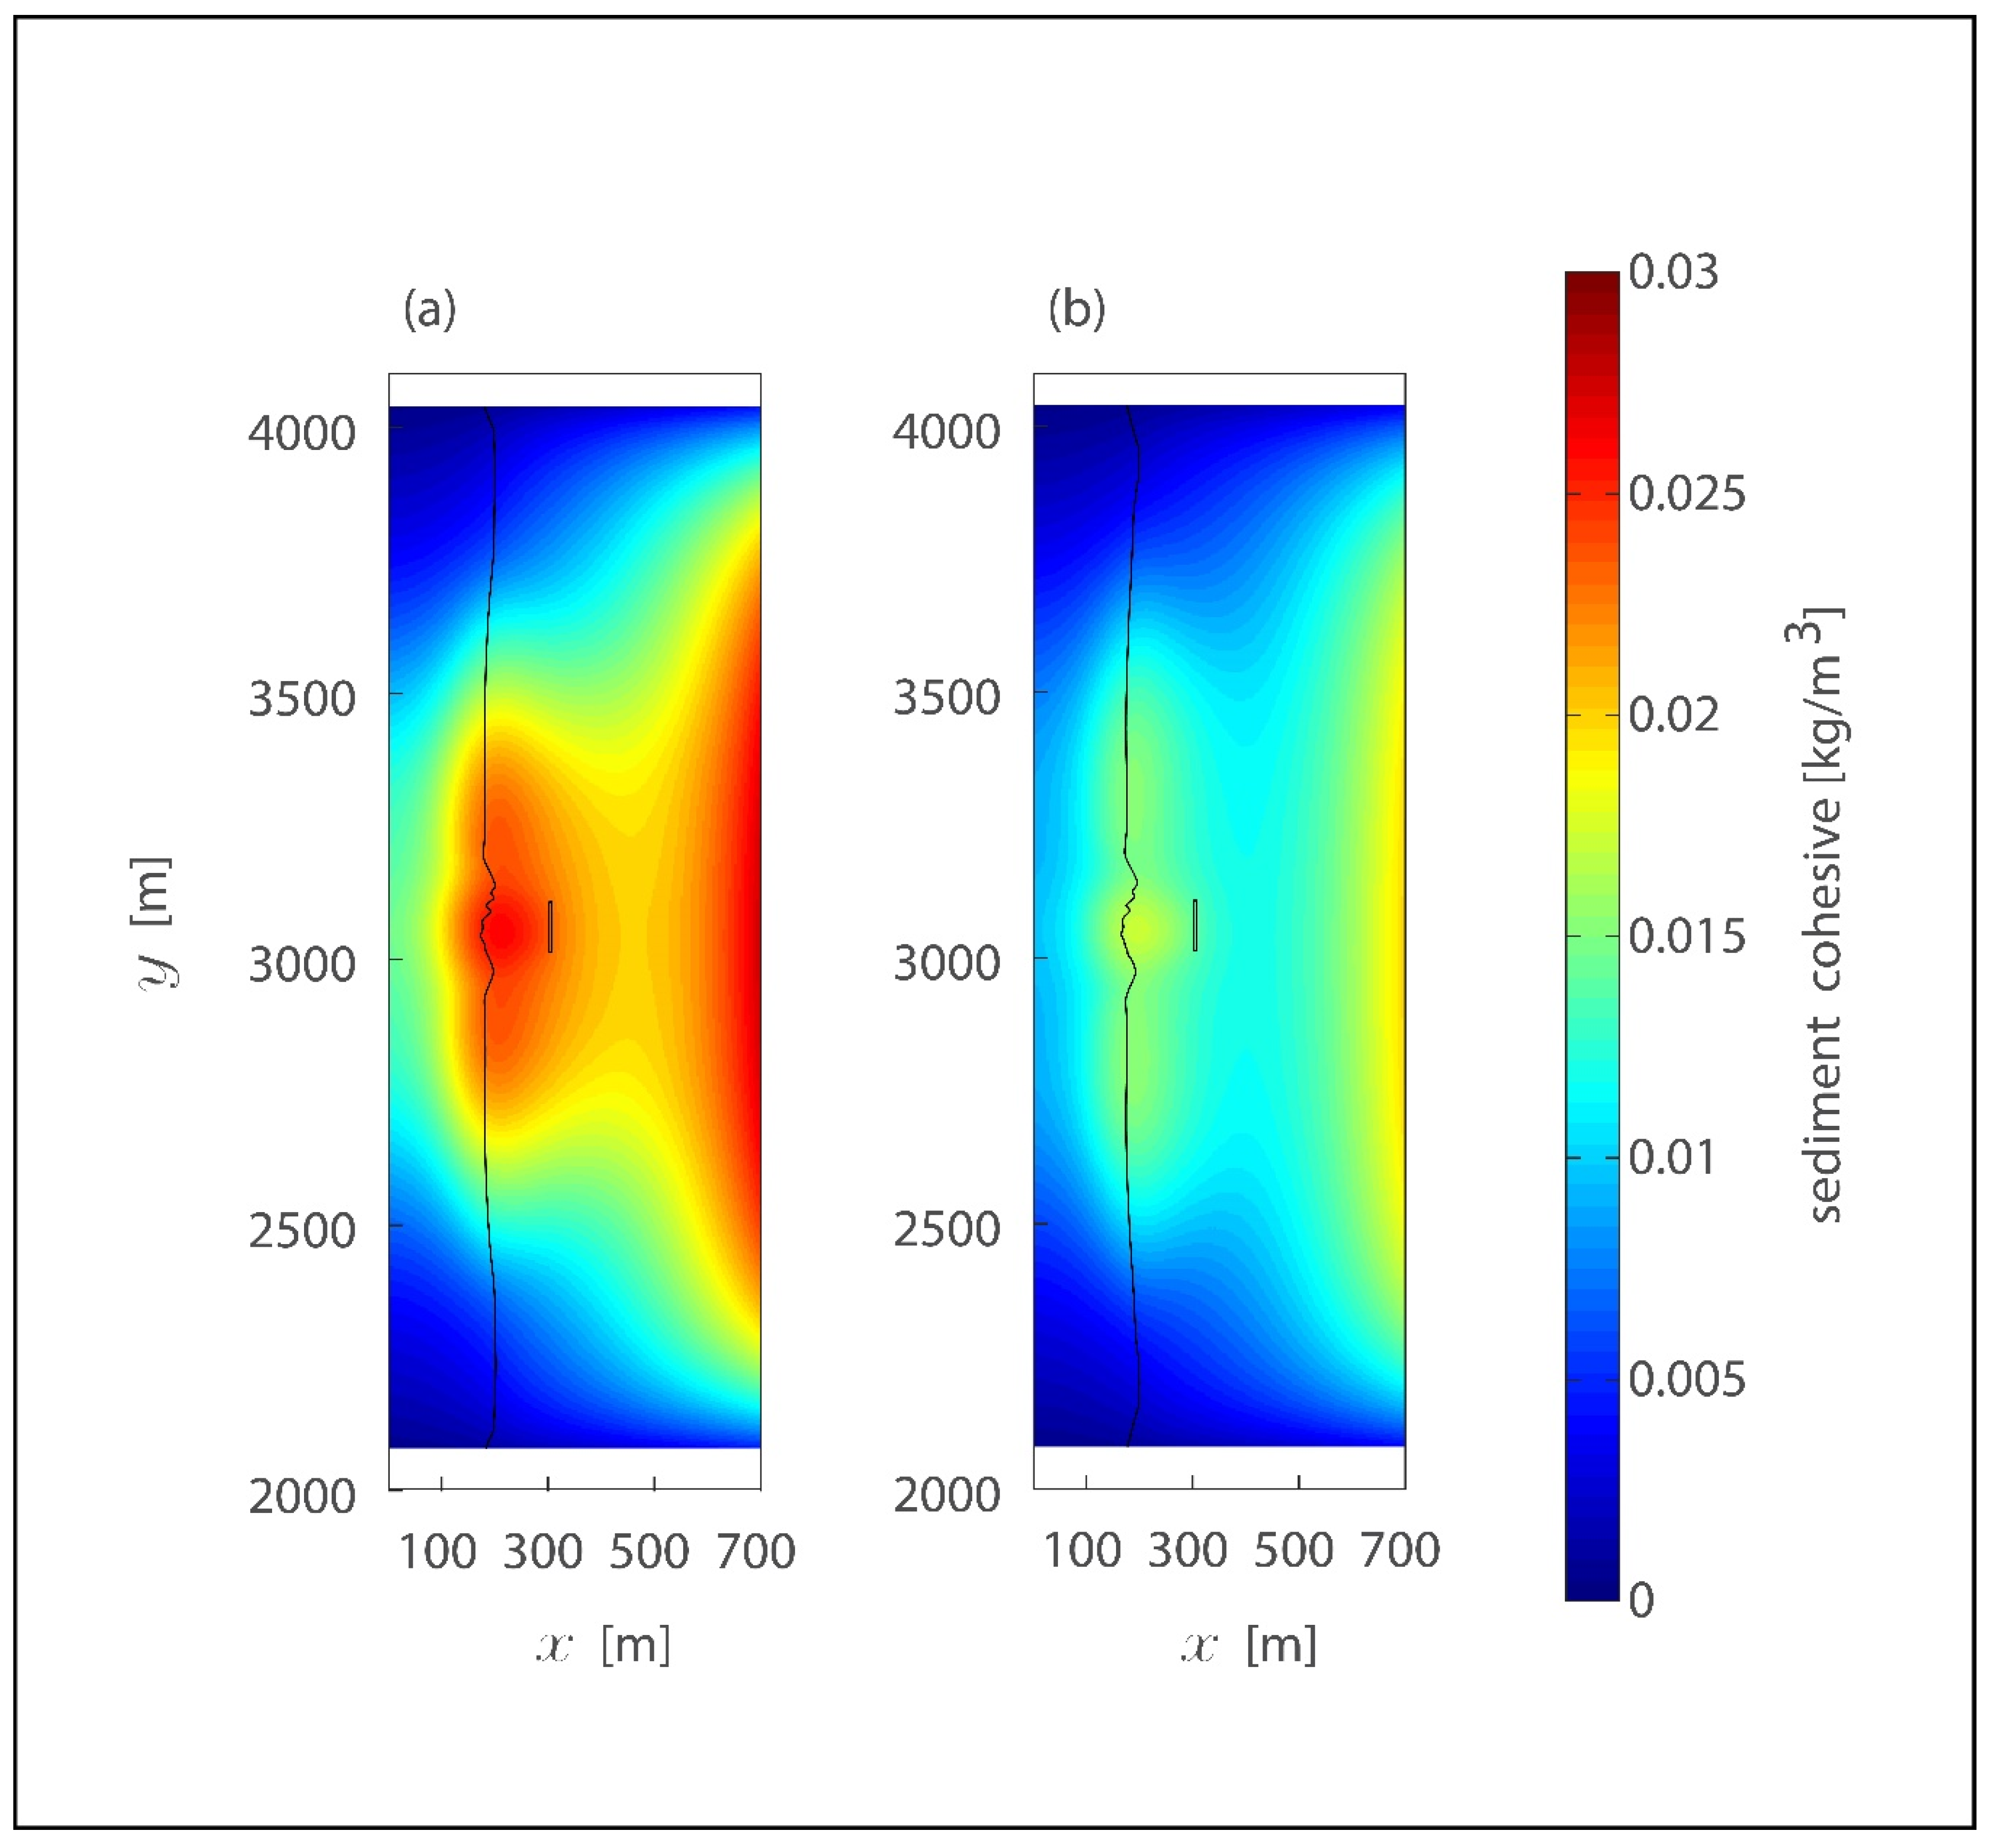
We provided an example of cohesive sediment concentration distribution at the end of the simulation around the breakwater area, for the run with Hs = 0.5 m, slope = 0.8%, Tide = ±0.4 m and xd = 100 m, for the two sediment concentrations (a) 0.4 kg/m3 and (b) 0.2 kg/m3 (Figure 9). The simulation demonstrated that the higher sediment concentration (Plot a) allows more sedimentation in the area protected by the breakwater and into the marsh.
Sandy sediments, on the other hand, were not considerably distributed within the calculation domain, due to the low energy developed by the hydrodynamics of our model.
An important aspect related to the sediment deposition into the salt marsh appeared, after comparing the volume accumulated behind the breakwater (into the marsh) and far away from it, revealing how breakwaters block sediment transport and prevent nourishment of the marsh (Figure 10).
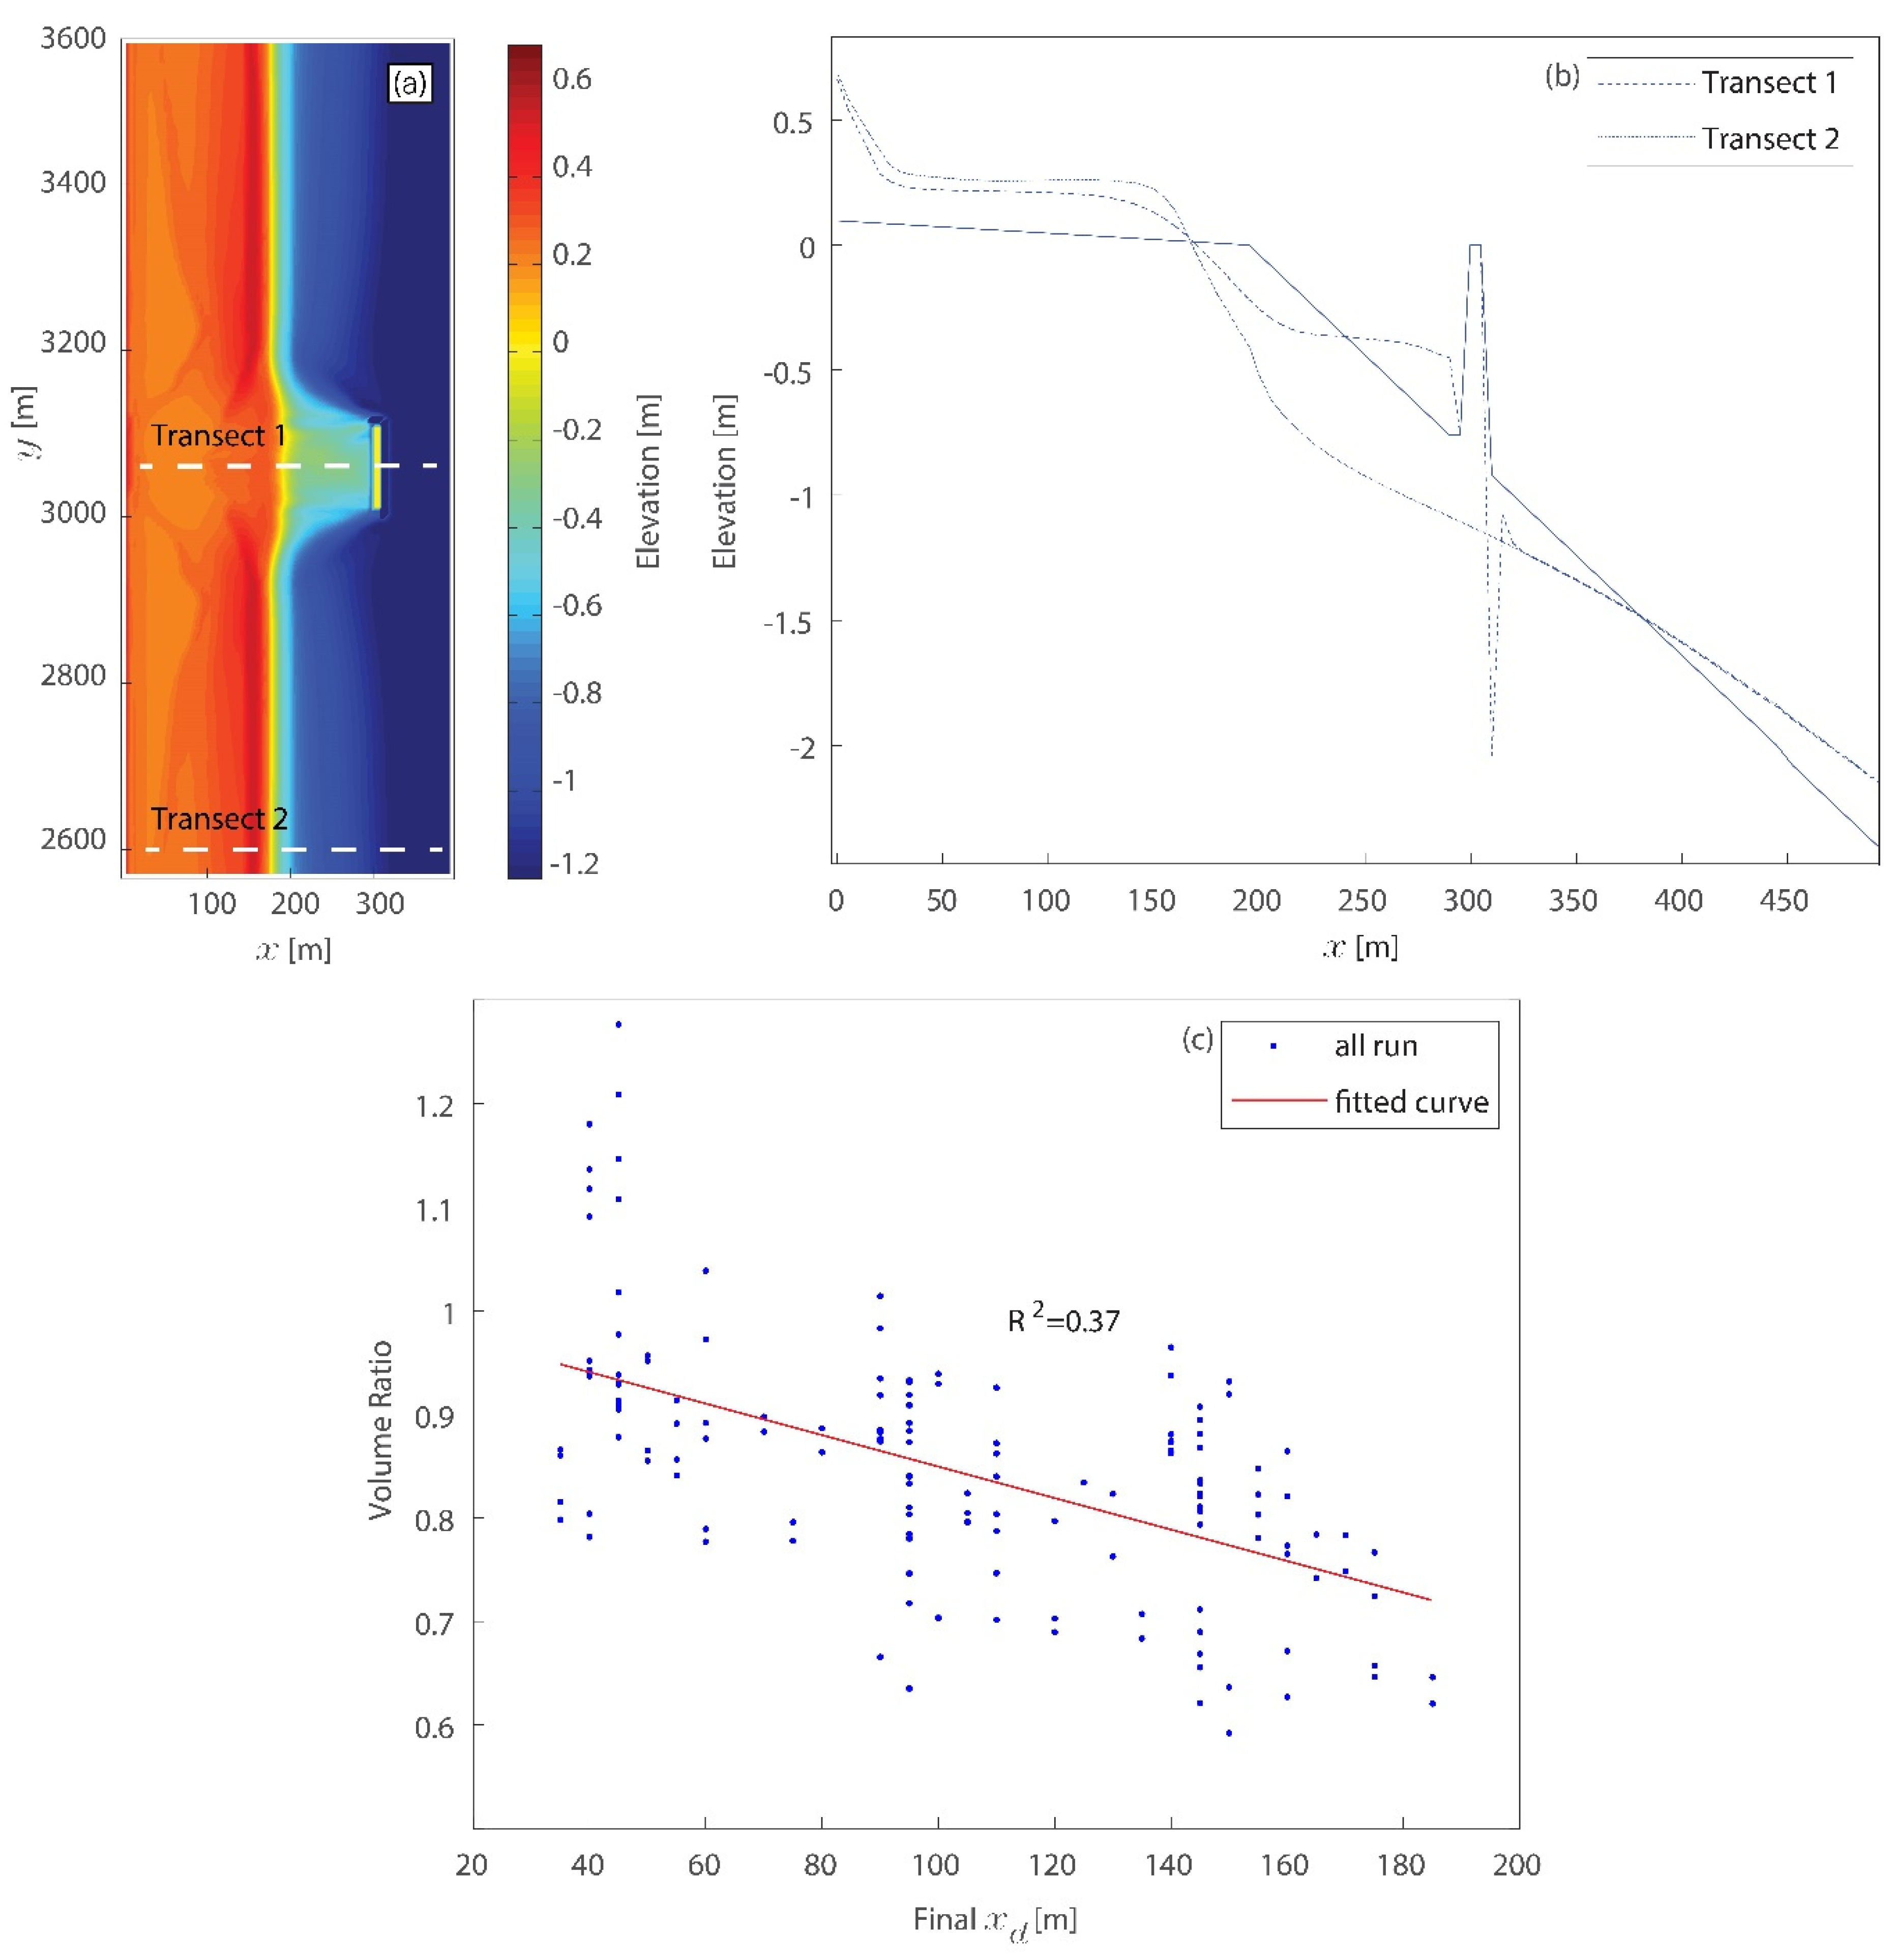
We compared two 100 × 200 m check volumes, centered on transect 1 and 2 into the salt marsh (Figure 10a,b). In particular, we highlighted the ratio between the sediment accumulation behind and far away from the breakwater, into the marsh, as function of the final breakwater distance to the shoreline (Figure 10c). Volume ratio was defined as the ratio between the deposited volume on transect 1 over the deposited volume on transect 2, into the salt marsh. For most of runs the volume ratio was lower than 1 (Figure 10c), meaning that sediments were blocked by the breakwater, while without breakwater more sediments are allowed to reach the marsh.
A typical morphodynamic response due to the presence of breakwater is the scouring effect happening at the tip of the structure, as is shown on our results on Figure 10b. This behavior happens naturally with submerged structures and has commonly been observed in previous studies, such as Sumer et al. (2000) [45].
Runs with wave heights 0.7 m do not follow the trend of the others because of the great amount of energy that this configuration generated into the model and were excluded from the chart (but see discussion for more commentary on this scenario).

4. Discussion

Our numerical experiment that couples Delft3D-SWAN models generates plausible results about sediment transport around breakwaters and the influence of waves and tides in shallow coastal bays.
Simulation results demonstrate how breakwaters were responsible for an average wave dampening of 10–50% (Figure 2), similar to empirical studies by Wiberg et al. (2019) [15], who measured the same range of wave dampening under similar coastal environment conditions at VCR. Additionally, Wiberg et al. (2019) [15] underline the importance of the incoming waves direction and the position of the structure itself regarding the breaking process. Our runs kept the same incoming waves direction perpendicular to the breakwater, and the same structure position parallel to the shoreline. The inference of our study is limited to our specific study conditions; nevertheless, they provide insight on the fundamental physical forces and principals underlying sediment load transport and fate.
The distance of the breakwater to the shoreline also affected the hydrodynamics, reducing the shear stress value as the distance increased. Sediment deposition into the salt marsh was primarily driven by wave height and the distance of the breakwater to the shoreline. Greater wave heights were associated with greater sediment suspension and transport, while increasing breakwater distance to shore decreased the amount of deposition, due to the lower transport energy of waves that were broken further offshore. This is in agreement with the study of Birben et al. (2005) [46], which investigated the effect of breakwaters’ parameters on sediment accumulation. They found that the deposition in the area protected by the breakwater was inversely proportional to the breakwater distance to the shoreline and that the deposition and transport of sediments decreases with decreasing wave height. Our modeling approach and results can be used to help guide future breakwater design to promote salt marshes stability and longevity. Future breakwaters’ deployment should consider placing these structures in locations that allow marsh nourishment (closer to the coastline), avoiding sediments’ accumulation offshore and reducing coastal erosion.
The erosion at the marsh boundary was mostly governed by the tide. When the water level reached the marsh platform, waves had more erosion power, as they dissipated their energy directly on the marsh edge, while higher water levels allowed the dissipation to happen through the marsh platform, with less impacts on marsh boundary erosion. These results are also similar to Tonelli et al (2010) [47], who observed that water level plays an essential role on marsh boundary erosion. Such erosional behavior was confirmed in our results (Figure 7), where the ±0.4 m tidal condition, which reached the marsh platform at low tide, eroded more than the ±0.2 m condition and was always higher than the platform level. Moreover, Figure 8 illustrates the effect of tide and slope on the erosion, demonstrating how increasing tide and slope increased the erosion of the marsh scarp.
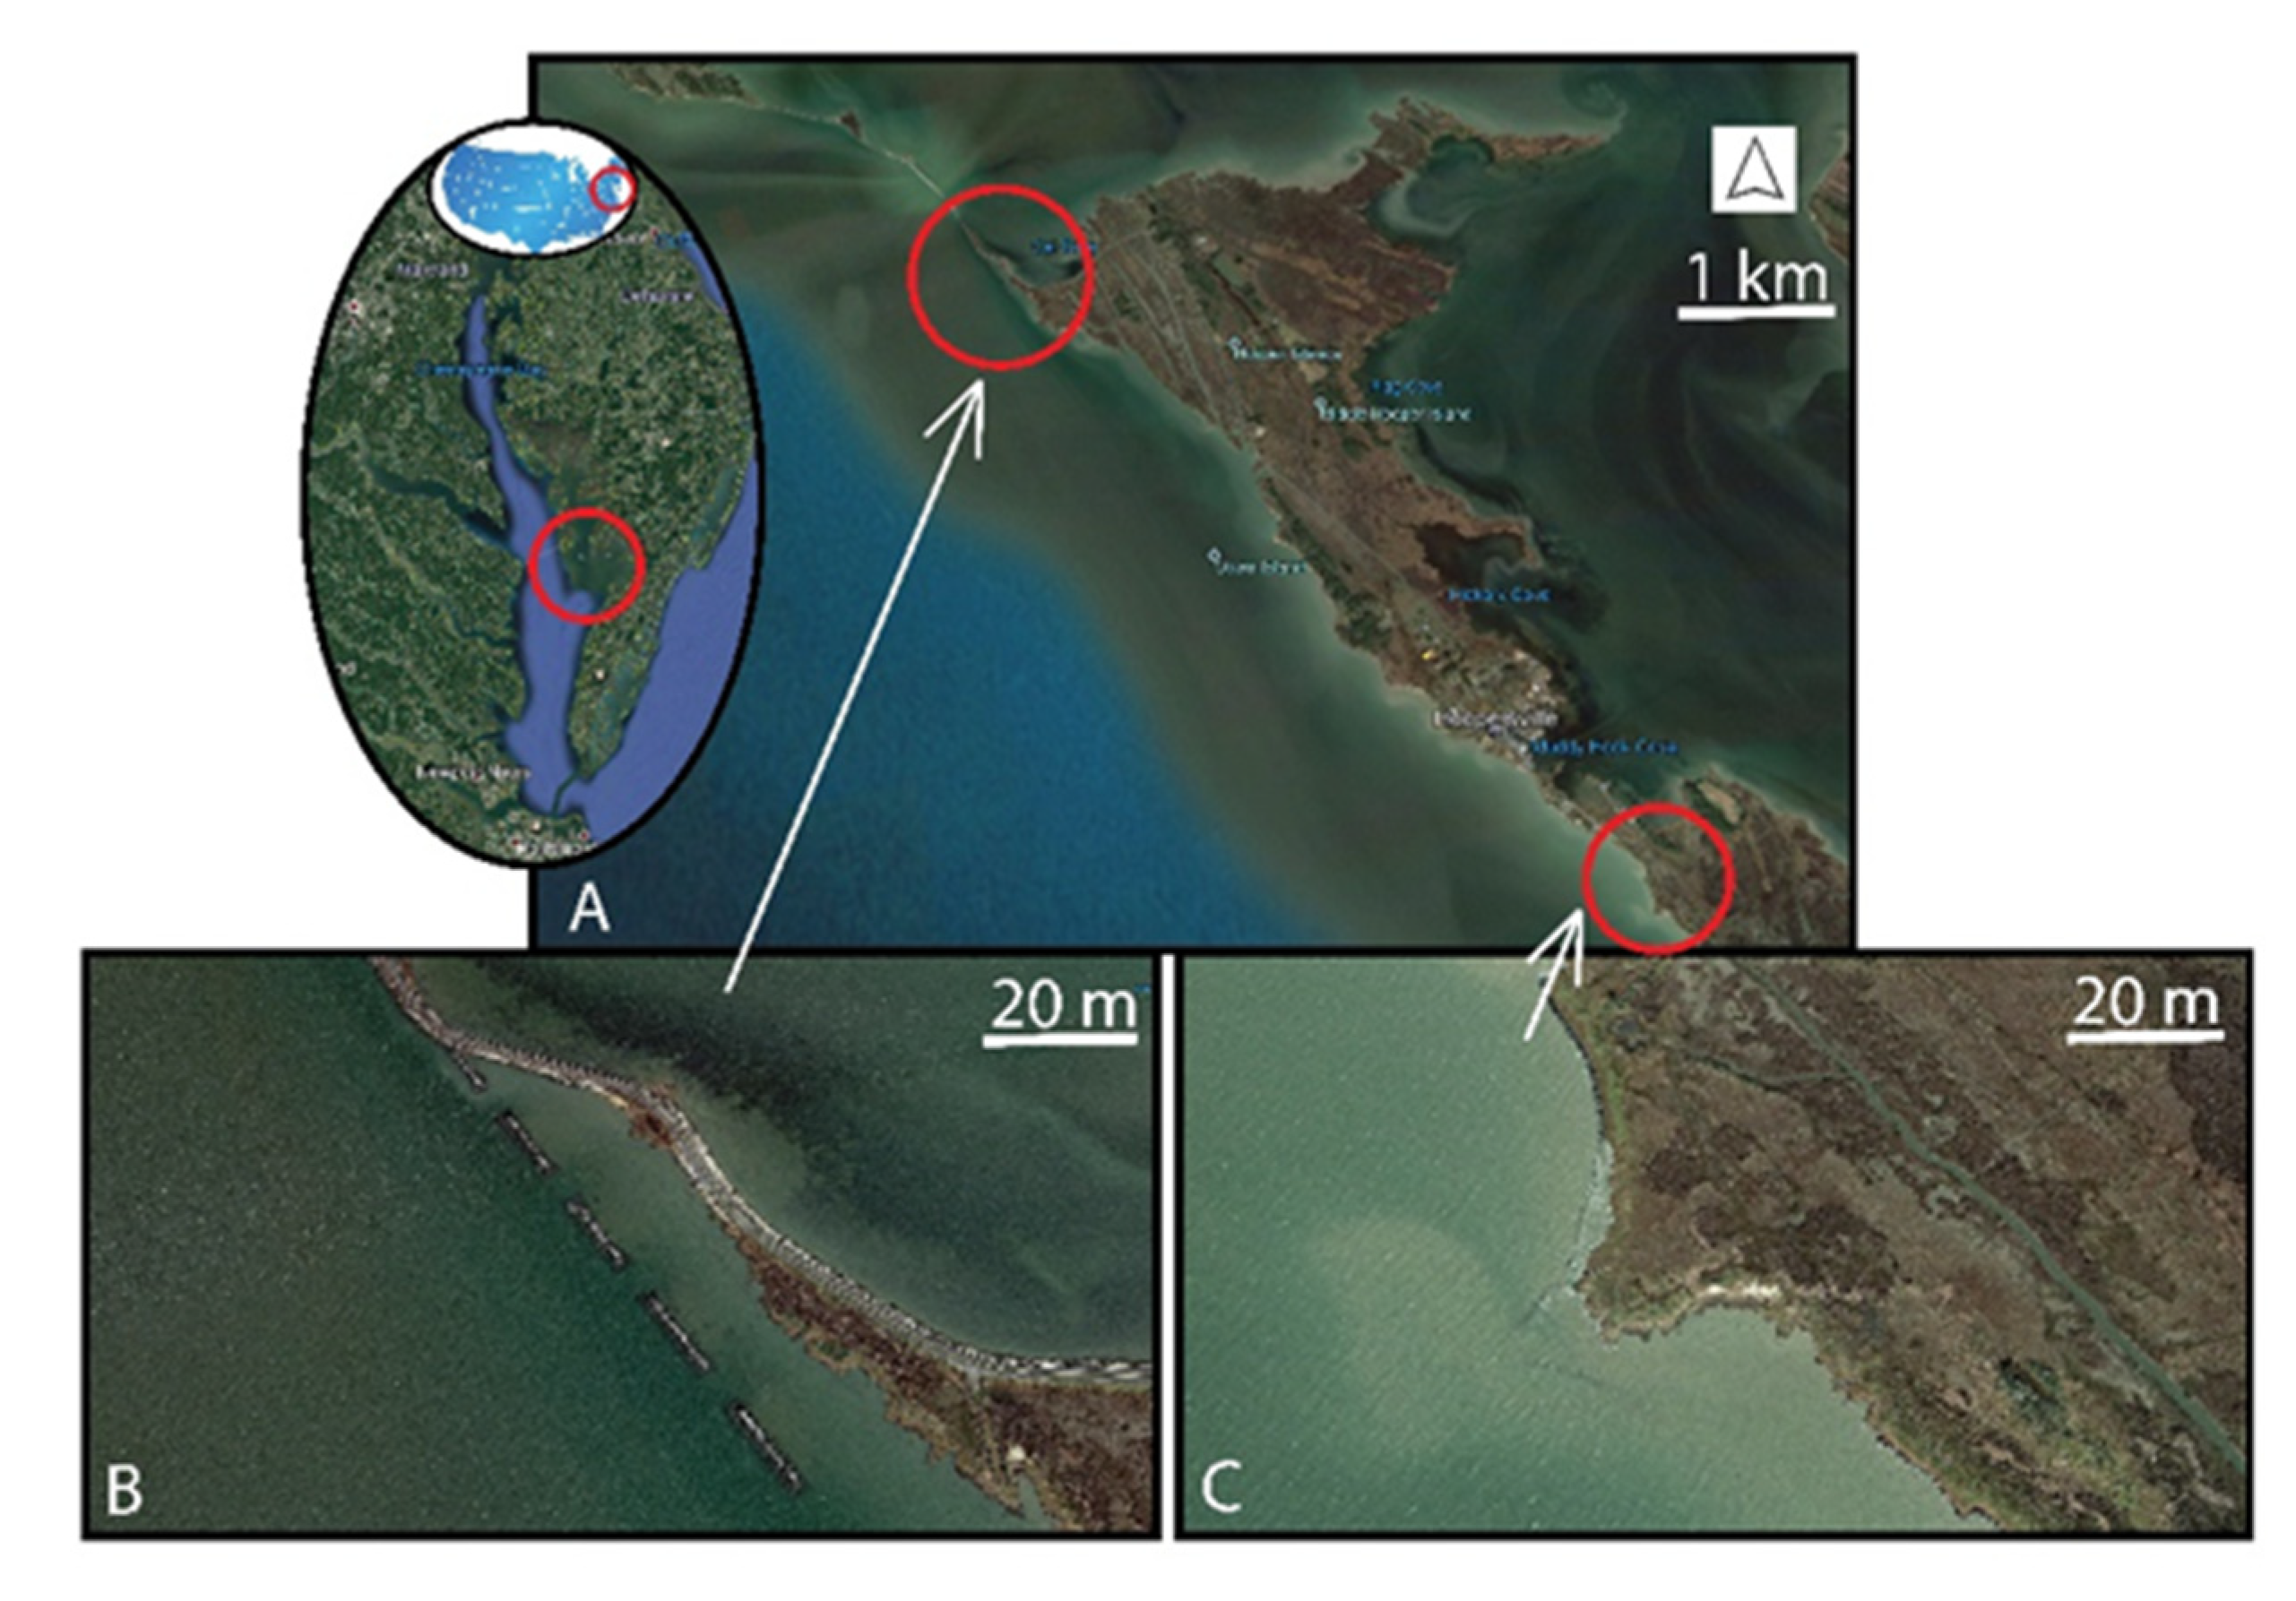
Results regarding the influence of the tide on the functioning of breakwaters highlights how higher water levels inhibit the protective performance of breakwaters, suggesting they could be drowned by sea level rise (SLR) and quickly become ineffective. Future modeling efforts may want to consider examining this scenario to better understand legacy infrastructure performance in the face of climate change. We have already begun to observe the failure of some breakwaters in the Chesapeake Bay (Figure 11), as well as clear signs of erosion, in part due to accelerating SLR in this system.
The presence of the breakwater is also likely to trap sediments and create less deposition in the area protected by it, compared to an area without obstacles (Figure 10).
This fact shows an important aspect about breakwaters and their behavior. They are efficient at breaking waves and reducing their energy, but on the other hand they can be an obstacle for sediments and consequently for salt marsh survival.
Moreover, the breakwater distance to the shoreline was significantly inversely related to the amount of sediment transported and deposited into the marsh; therefore, the best structure configuration, with respect to marsh nourishment (amount of sediments that can reach the vegetation), would be one with the closest distance to the shoreline (Figure 10). In addition, wave heights help the solid transport as the higher is the wave, the greater the amount of deposition into the salt marsh, while a flatter slope will lead to less deposition.
Our model shows how greater waves cause more erosion; however, this trend is not followed by the 0.7 m wave height, as it mainly causes deposition enriching in the marsh (Figure 7). Treating wave heights equal to 0.7 m as a storm-level [15], our results are in agreement with Castagno et al. (2018) [48] who demonstrated, using Delft3D, that extreme events are likely to enrich coastal wetlands with more sediments.
As our model points out, the water level and therefore the increase in sea level are crucial to consider for the long-term functioning of breakwaters, since they are likely to become less efficient with accelerating SLR. A recently advanced engineering concept to cope with the growing threat SLR is the use of hybrid infrastructures, which combines built and natural solution for coastal defense and is thought to exploit the benefits that accompany each approach. Hybrid infrastructure that can adapt to changing environmental conditions, such as coral or oyster reefs working in conjunction with grey structure to dampen incoming waves, is an attractive alternative that can sustainably stabilize the shoreline, while also contributing immense ecological value [49,50]. The advantage of integrating breakwaters and other in-water infrastructure with oysters is that the reefs these organisms form may grow with SLR [51,52], providing greater guarantees that these structures could provide protection to coastal environments long after the grey structure has been drowned (see Supplementary Materials Figure S1). Principals established in this study are highly applicable for the design of fully-integrated hybrid infrastructures wishing to use oysters and other reef-forming species, while also ensuring marsh habitat is also considered and protected.
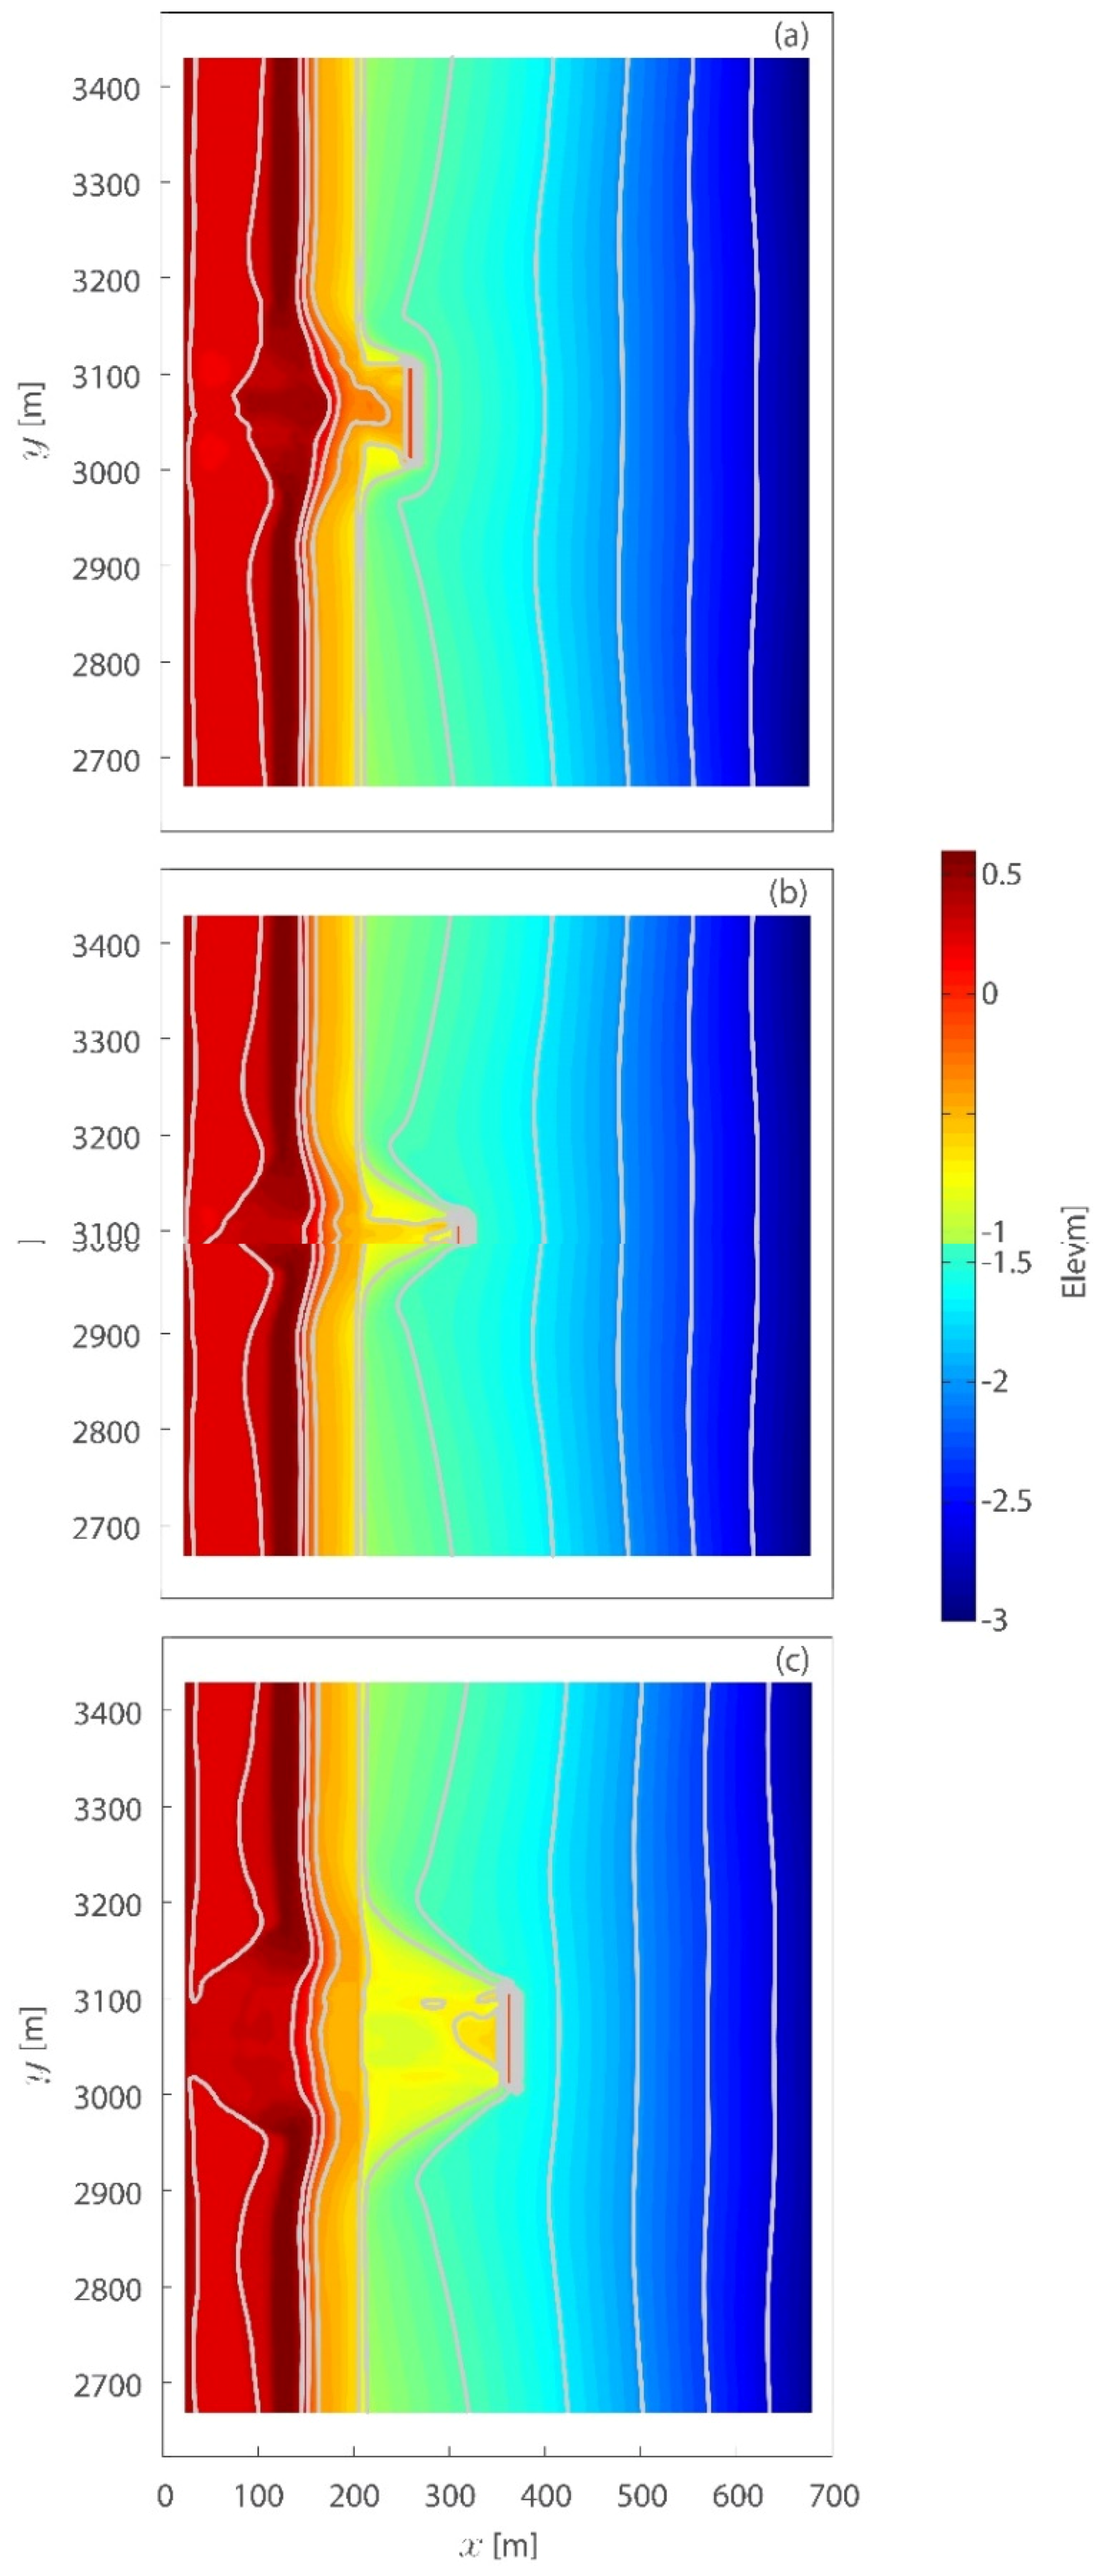
A long-term analysis of coastal dynamics has also been simulated to look at the effect that breakwaters can have on long-shore sediment transport (Figure 12). Our results show how, over time, breakwaters tend to close their rear deposits, blocking solid transport and creating morphodynamic structures known as salients and tombolos, as is shown in many papers in the literature, such as Hanson et al. (1991) [53]. The Figure shows how these morphodynamic structures tend to be less accentuate with increasing breakwater distance to the shoreline.
In the view of a possible reuse of all the deposited material behind the breakwater for coastal zone management and protection, A. De Vincenzo et al. (2018) [54] offers an important analysis on how material accumulated in reservoirs might be reused in nourishment works. They reported a study case of the Guardialfiera reservoir in Italy, but this application suggests how such an approach can be tested, for instance, also in the restoration of coastal wetlands along the eastern shore of the United States.

5. Conclusions

Understanding sediment transport dynamic is a key aspect for the protection and the survival of salt marshes. In this study we investigated breakwater effects on sediment supply and morphological changes for a vegetated shoreline. The presence of the breakwater certainly reduces the incoming waves by dissipating the energy and protecting the coast, as clearly shown in Figure 11. However, the breakwater distance to the coast affects sediment transport and may inhibit marsh nourishment if not properly considered during planning and deployment activities. Greater distances are associated with less sediment deposition and more erosion of the marsh scarp.
The slope, tide and wave heights play different roles in the sediment supply for the vegetation: (a) slope was positively correlated with greater amounts of deposition into the salt marsh; (b) tide or water level at similar elevations to the marsh platform was more likely to erode; (c) higher waves were observed to bring more sediments towards the marsh, but they also have more erosion power. Our study, which highlights the conflicting effects of breakwater (coastal protection vs. marsh malnourishment), is relevant and applicable for field studies and future coastal management in areas such as Chesapeake Bay. Study results also suggest that more research is needed to help find a balance between waves dampening and sediments supply during the design and implementation of breakwater infrastructures.

Supplementary Materials

The following are available online at https://www.mdpi.com/2073-4441/12/4/1016/s1, Figure S1: Plot (a) the longitudinal profile of the domain used in this analysis, highlighting the three different breakwater configurations. (b) An example of wave damping for the case with wave period = 5 s, and (c) linear correlations between wave period and wave height measured at the marsh boundary (x = 200 m) for the three breakwater configurations.

Author Contributions

1-Formal analysis: I.V., M.W.G., W.N.; 2-Methodology: I.V., W.N.; 3-Software: I.V.; 4-Supervision: M.W.G., W.N.; 5-Validation: I.V.; Writing—original draft: I.V.; Writing—review and editing: I.V., M.W.G., W.N. All authors have read and agreed to the published version of the manuscript.

Funding

This research received no external funding.

Acknowledgments

This is contribution 5840 of the University of Maryland Center for Environmental Science—Horn Point Laboratory.

Conflicts of Interest

The authors declare no conflict of interest.

References

  1. Kay, R.; Alder, J. Coastal Planning and Management, 2nd ed.; Taylor & Francis: New York, NY, USA, 2005. [Google Scholar]
  2. Post, J.C.; Lundin, C.G. Guidelines for Integrated Coastal Zone Management; The World Bank: Washington, DC, USA, 1996. [Google Scholar]
  3. Creel, L. Ripple Effects: Population and Coastal Regions; Population Reference Bureau: Washington, DC, USA, 2003; pp. 1–7. [Google Scholar]
  4. Board, O.C.; National Research Council. Mitigating Shore Erosion along Sheltered Coasts; National Academic Press: Washington, DC, USA, 2007. [Google Scholar]
  5. Pilkey, O.H.; Wright, W. Seawalls versus Beaches. J. Coast. Res. 1988, 4, 41–64. [Google Scholar]
  6. Douglass, S.L.; Pickel, B.H. The tide doesn’t go out anymore-the effect of bulkheads on urban shorelines. Shore Beach 1999, 67, 19–25. [Google Scholar]
  7. Kennish, M.J. Environmental threats and environmental future of estuaries. Environ. Conserv. 2002, 29, 78–107. [Google Scholar] [CrossRef]
  8. Airoldi, L. An ecological perspective on the deployment and design of low-crested and other hard coastal defence structures. Coast. Eng. 2005, 52, 1073–1087. [Google Scholar] [CrossRef] [Green Version]
  9. Borsje, B.W.; van Wesenbeeck, B.K.; Dekker, F.; Paalvast, P.; Bouma, T.J.; van Katwijk, M.M.; de Vries, M.B. How ecological engineering can serve in coastal protection. Ecol. Eng. 2011, 37, 113–122. [Google Scholar] [CrossRef]
  10. Broome, S.W.; Rogers, S.M., Jr.; Seneca, E.D. Shoreline Erosion Control Using Marsh Vegetation and Low-Cost Structures. 2015. Available online: https://tamug-ir.tdl.org/bitstream/handle/1969.3/28985/Broome-Rogers-Seneca-shoreline-erosion-control[1].pdf?sequence=1 (accessed on 2 April 2020).
  11. Allen, J.R.; Pye, K. Saltmarshes: Morphodynamics, Conservation and Engineering Significance; Cambridge University Press: Cambridge, UK, 1992. [Google Scholar]
  12. Boorman, L.A.; Garbutt, A.; Barratt, D. The Role of Vegetation in Determining Patterns of the Accretion of Salt Marsh Sediment; Special Publications; Geological Society: London, UK, 1998; Volume 139, pp. 389–399. [Google Scholar]
  13. Boorman, L.A. Salt marshes–present functioning and future change. Mangroves Salt Marshes 1999, 3, 227–241. [Google Scholar] [CrossRef]
  14. Scyphers, S.B.; Powers, S.P.; Heck, K.L. Ecological value of submerged breakwaters for habitat enhancement on a residential scale. Environ. Manag. 2015, 55, 383–391. [Google Scholar] [CrossRef]
  15. Wiberg, P.L.; Taube, S.R.; Ferguson, A.E.; Kremer, M.R.; Reidenbach, M.A. Wave attenuation by oyster reefs in shallow coastal bays. Estuaries Coasts 2019, 42, 331–347. [Google Scholar] [CrossRef]
  16. Chowdhury, M.S.N.; Walles, B.; Sharifuzzaman, S.M.; Hossain, M.S.; Ysebaert, T.; Smaal, A.C. Oyster breakwater reefs promote adjacent mudflat stability and salt marsh growth in a monsoon dominated subtropical coast. Sci. Rep. 2019, 9, 8549. [Google Scholar] [CrossRef]
  17. Moschella, P.S.; Abbiati, M.; Åberg, P.; Airoldi, L.; Anderson, J.M.; Bacchiocchi, F.; Granhag, L. Low-crested coastal defence structures as artificial habitats for marine life: Using ecological criteria in design. Coast. Eng. 2005, 52, 1053–1071. [Google Scholar] [CrossRef]
  18. Palinkas, C.M.; Barth, N.; Koch, E.W.; Shafer, D.J. The influence of breakwaters on nearshore sedimentation patterns in Chesapeake Bay, USA. J. Coast. Res. 2016, 32, 788–799. [Google Scholar] [CrossRef]
  19. Faraci, C.; Scandura, P.; Foti, E. Bottom profile evolution of a perched nourished beach. J. Waterw. Port Coast. Ocean Eng. 2014, 140, 04014021. [Google Scholar] [CrossRef]
  20. Faraci, C. Experimental investigation of the hydro-morphodynamic performances of a geocontainer submerged reef. J. Waterw. Port Coast. Ocean Eng. 2018, 144, 04017045. [Google Scholar] [CrossRef]
  21. Sumer, B.M.; Fredsøe, J.; Lamberti, A.; Zanuttigh, B.; Dixen, M.; Gislason, K.; Di Penta, A.F. Local scour at roundhead and along the trunk of low crested structures. Coast. Eng. 2005, 52, 995–1025. [Google Scholar] [CrossRef]
  22. Bricker-Urso, S.; Nixon, S.W.; Cochran, J.K.; Hirschberg, D.J.; Hunt, C. Accretion rates and sediment accumulation in Rhode Island salt marshes. Estuaries 1989, 12, 300–317. [Google Scholar] [CrossRef]
  23. Schuerch, M.; Spencer, T.; Temmerman, S.; Kirwan, M.L.; Wolff, C.; Lincke, D.; McOwen, C.J.; Pickering, M.D.; Reef, R.; Vafeidis, A.T.; et al. Future response of global coastal wetlands to sea-level rise. Nature 2018, 561, 231–234. [Google Scholar] [CrossRef] [PubMed]
  24. Hashim, A.M.; Catherine, S.M.P. Effectiveness of mangrove forests in surface wave attenuation: A review. Res. J. Appl. Sci. Eng. Technol. 2013, 5, 4483–4488. [Google Scholar] [CrossRef]
  25. Cadwalladr, D.A.; Owen, M.; Morley, J.V.; Cook, R.S. Wigeon (Anas penelope L.) conservation and salting pasture management at Bridgwater Bay National Nature Reserve, Somerset. J. Appl. Ecol. 1972, 9, 417–425. [Google Scholar] [CrossRef]
  26. Burger, J.; Howe, M.A.; Hahn, D.C.; Chase, J. Effects of tide cycles on habitat selection and habitat partitioning by migrating shorebirds. Auk 1977, 94, 743–758. [Google Scholar] [CrossRef]
  27. Daiber, F.C. Salt marsh animals: Distributions related to tidal flooding, salinity and vegetation. In Ecosystems of the World; Elsevier: Amsterdam, The Netherlands, 1977. [Google Scholar]
  28. Nardin, W.; Fagherazzi, S. The effect of wind waves on the development of river mouth bars. Geophys. Res. Lett. 2012, 39. [Google Scholar] [CrossRef]
  29. Nardin, W.; Larsen, L.; Fagherazzi, S.; Wiberg, P. Tradeoffs among hydrodynamics, sediment fluxes and vegetation community in the Virginia Coast Reserve, USA. Estuar. Coast. Shelf Sci. 2018, 210, 98–108. [Google Scholar] [CrossRef]
  30. Leonardi, N.; Sun, T.; Fagherazzi, S. Modeling tidal bedding in distributary-mouth bars. J. Sediment. Res. 2014, 84, 499–512. [Google Scholar] [CrossRef] [Green Version]
  31. Lera, S.; Nardin, W.; Sanford, L.; Palinkas, C.; Guercio, R. The impact of submersed aquatic vegetation on the development of river mouth bars. Earth Surf. Process. Landf. 2019, 44, 1494–1506. [Google Scholar] [CrossRef]
  32. Cooper, A.H.; Mulligan, R.P. Application of a spectral wave model to assess breakwater configurations at a small craft harbour on Lake Ontario. J. Mar. Sci. Eng. 2016, 4, 46. [Google Scholar] [CrossRef] [Green Version]
  33. Roelvink, J.A.; Van Banning, G.K.F.M. Design and development of DELFT3D and application to coastal morphodynamics. Oceanogr. Lit. Rev. 1995, 11, 925. [Google Scholar]
  34. Lesser, G.R.; Roelvink, J.V.; Van Kester, J.A.T.M.; Stelling, G.S. Development and validation of a three-dimensional morphological model. Coast. Eng. 2004, 51, 883–915. [Google Scholar] [CrossRef]
  35. Hasselmann, K.; Barnett, T.P.; Bouws, E.; Carlson, H.; Cartwright, D.E.; Enke, K.; Ewing, J.A.; Gienapp, H.; Hasselmann, D.E.; Kruseman, P.; et al. Measurements of wind-wave growth and swell decay during the Joint North Sea Wave Project (JONSWAP). Ergänzungsheft 1973, 12, 95. [Google Scholar]
  36. Battjes, J.A.; Janssen, J.P.F.M. Energy loss and set-up due to breaking of random waves. Coast. Eng. 1978, 1978, 569–587. [Google Scholar]
  37. Rodi, W.; Scheuerer, G. Scrutinizing the k-epsilon-model under adverse pressure gradient conditions. In 4th Symposium on Turbulent Shear Flows; Springer: Berlin/Heidelberg, Germany, 1984; pp. 2–8. [Google Scholar]
  38. Lévêque, E.; Toschi, F.; Shao, L.; Bertoglio, J.P. Shear-improved Smagorinsky model for large-eddy simulation of wall-bounded turbulent flows. J. Fluid Mech. 2007, 570, 491–502. [Google Scholar] [CrossRef] [Green Version]
  39. Partheniades, E. Erosion and deposition of cohesive soils. J. Hydraul. Div. 1965, 91, 105–139. [Google Scholar]
  40. Van Rijn, L.C. Principles of Sediment Transport in Rivers, Estuaries and Coastal Seas; Aqua Publications: Amsterdam, The Netherlands, 1993; Volume 1006, pp. 11–13. [Google Scholar]
  41. Russ, E.R.; Palinkas, C.M. Seasonal-scale and decadal-scale sediment-vegetation interactions on the subaqueous Susquehanna River delta, upper Chesapeake Bay. Estuaries Coasts 2018, 41, 2092–2104. [Google Scholar] [CrossRef]
  42. Berlamont, J.; Ockenden, M.; Toorman, E.; Winterwerp, J. The characterisation of cohesive sediment properties. Coast. Eng. 1993, 21, 105–128. [Google Scholar] [CrossRef] [Green Version]
  43. Edmonds, D.A.; Slingerland, R.L. Significant effect of sediment cohesion on delta morphology. Nat. Geosci. 2010, 3, 105–109. [Google Scholar] [CrossRef]
  44. Nardin, W.; Edmonds, D.A.; Fagherazzi, S. Influence of vegetation on spatial patterns of sediment deposition in deltaic islands during flood. Adv. Water Resour. 2016, 93, 236–248. [Google Scholar] [CrossRef] [Green Version]
  45. Sumer, B.M.; Fredsøe, J. Experimental study of 2D scour and its protection at a rubble-mound breakwater. Coast. Eng. 2000, 40, 59–87. [Google Scholar] [CrossRef]
  46. Birben, A.R.; Özölçer, İ.H.; Karasu, S.; Kömürcü, M.İ. Investigation of the effects of offshore breakwater parameters on sediment accumulation. Ocean Eng. 2007, 34, 284–302. [Google Scholar] [CrossRef]
  47. Tonelli, M.; Fagherazzi, S.; Petti, M. Modeling wave impact on salt marsh boundaries. J. Geophys. Res. Oceans 2010, 115. [Google Scholar] [CrossRef] [Green Version]
  48. Castagno, K.A.; Jiménez-Robles, A.M.; Donnelly, J.P.; Wiberg, P.L.; Fenster, M.S.; Fagherazzi, S. Intense storms increase the stability of tidal bays. Geophys. Res. Lett. 2018, 45, 5491–5500. [Google Scholar] [CrossRef]
  49. Sutton-Grier, A.E.; Wowk, K.; Bamford, H. Future of our coasts: The potential for natural and hybrid infrastructure to enhance the resilience of our coastal communities, economies and ecosystems. Environ. Sci. Policy 2015, 51, 137–148. [Google Scholar] [CrossRef] [Green Version]
  50. Fleming, C.S.; Dillard, M.K.; Regan, S.D.; Gorstein, M.; Messick, E.; Blair, A. A coastal community vulnerability assessment for the Choptank Habitat Focus Area. NOAA Tech. Memo. NOS NCCOS 2017, 225, 92. [Google Scholar]
  51. Ridge, J.T.; Rodriguez, A.B.; Fodrie, F.J. Evidence of exceptional oyster-reef resilience to fluctuations in sea level. Ecol. Evolut. 2017, 7, 10409–10420. [Google Scholar] [CrossRef] [PubMed] [Green Version]
  52. Rodriguez, A.B.; Fodrie, F.J.; Ridge, J.T.; Lindquist, N.L.; Theuerkauf, E.J.; Coleman, S.E.; Grabowski, J.H.; Brodeur, M.C.; Gittman, R.K.; Keller, D.A.; et al. Oyster reefs can outpace sea-level rise. Nat. Clim. Chang. 2014, 4, 493–497. [Google Scholar] [CrossRef]
  53. Hanson, H.; Kraus, N.C. Shoreline response to a single transmissive detached breakwater. Coast. Eng. 1990, 1991, 2034–2046. [Google Scholar]
  54. De Vincenzo, A.; Covelli, C.; Molino, A.J.; Pannone, M.; Ciccaglione, M.; Molino, B. Long-Term Management Policies of Reservoirs: Possible Re-Use of Dredged Sediments for Coastal Nourishment. Water 2019, 11, 15. [Google Scholar] [CrossRef] [Green Version]
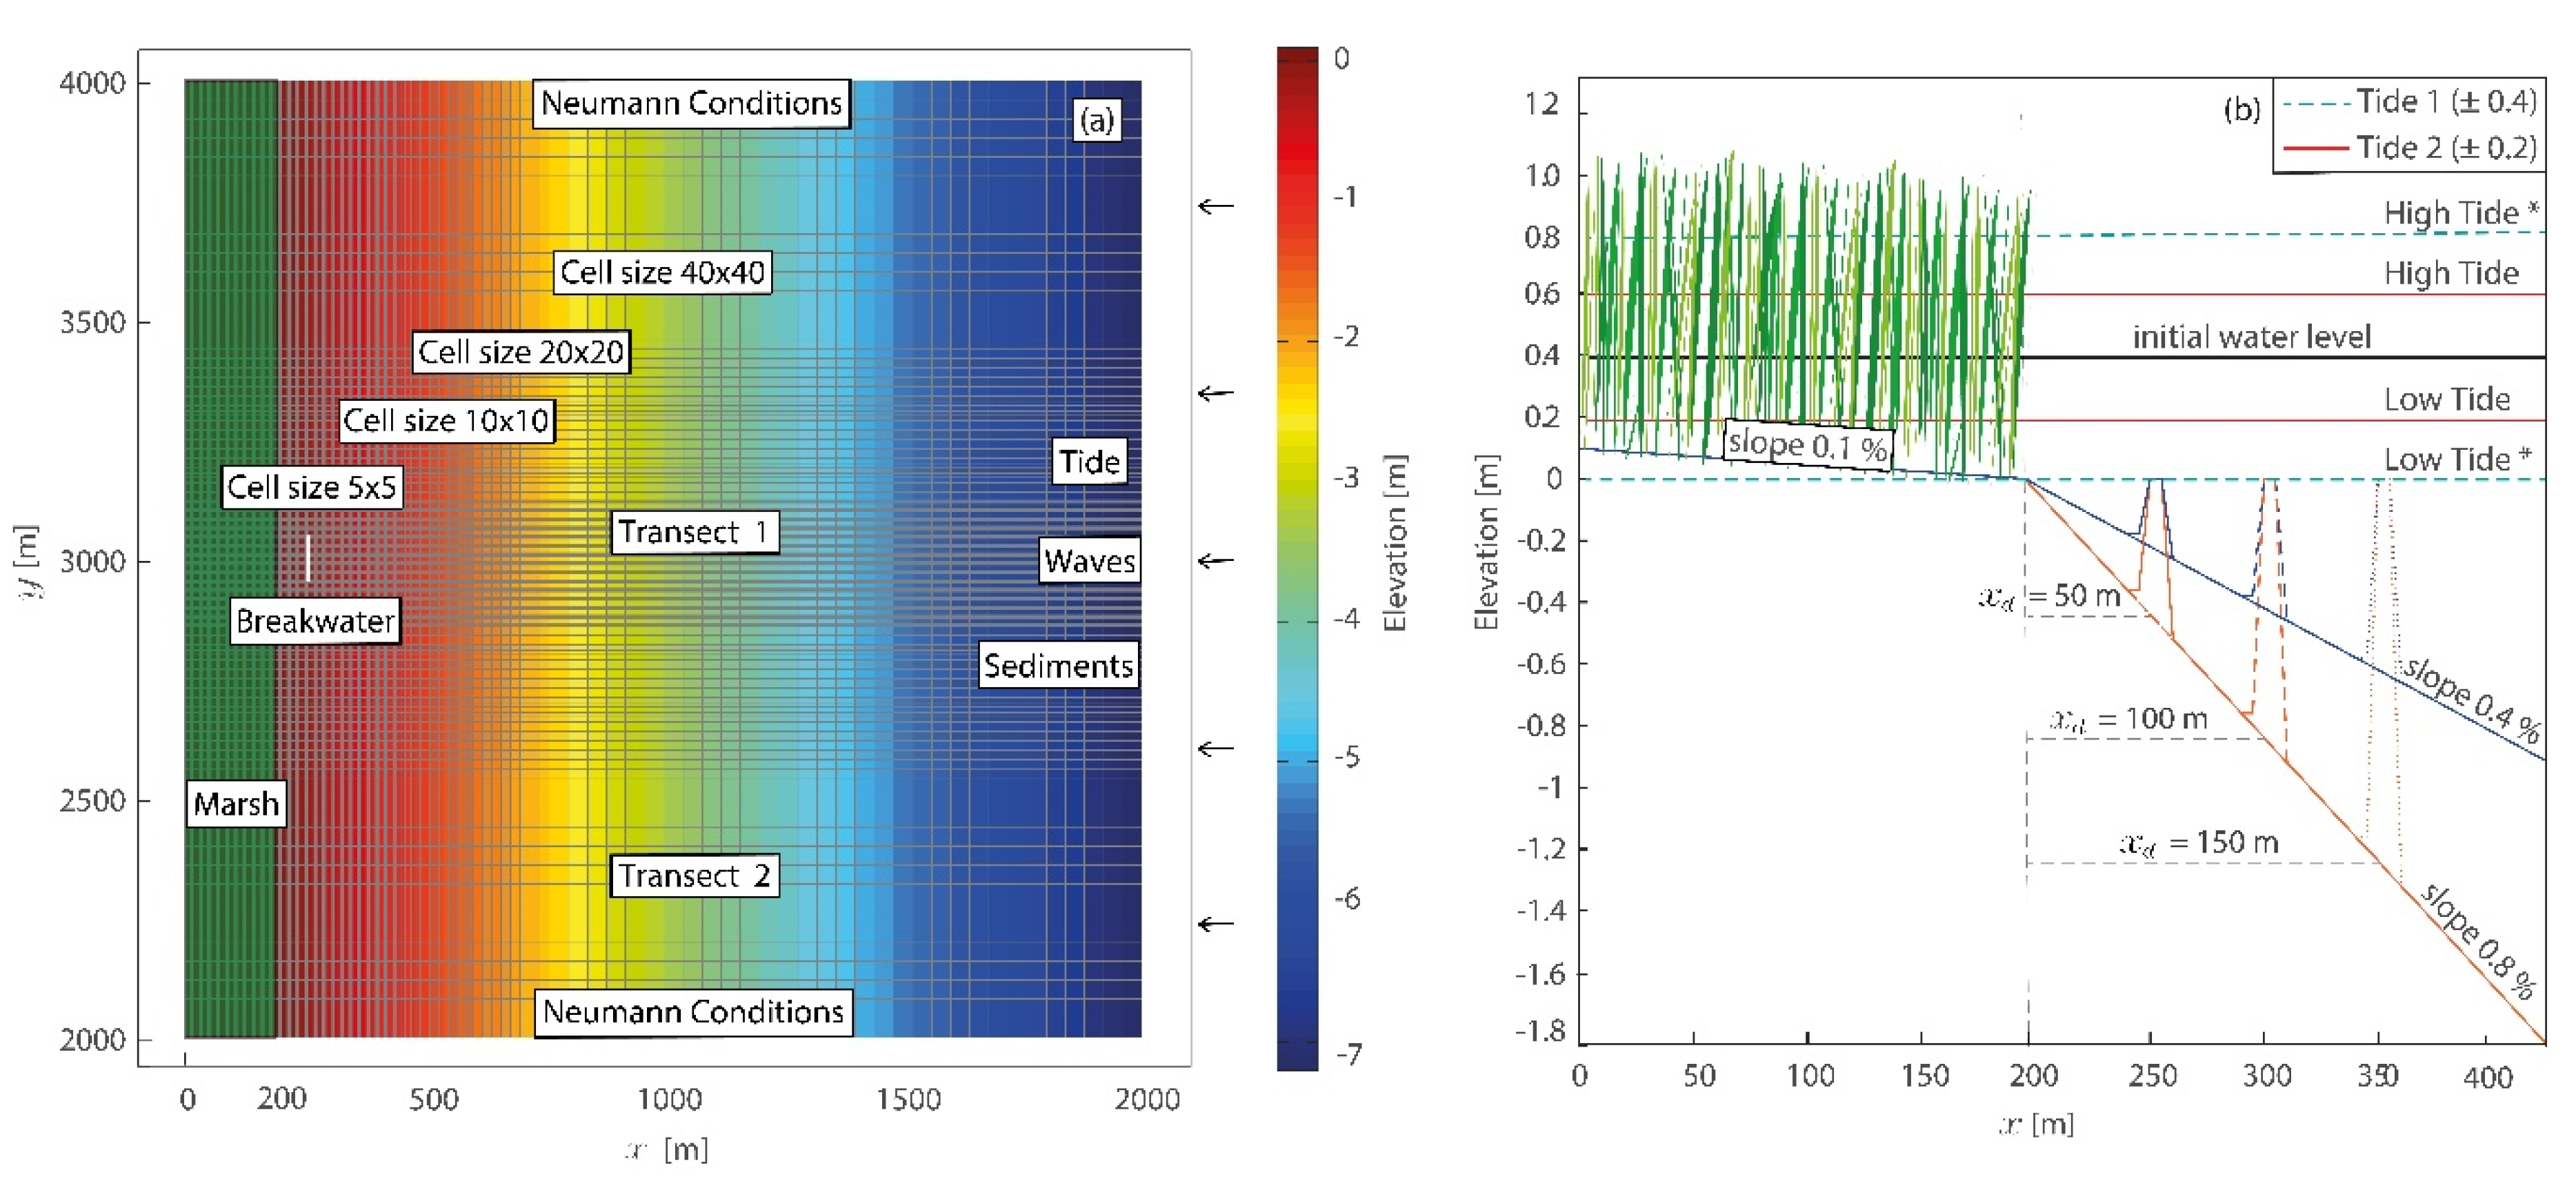
Figure 1. Domain configuration. Plot (a) planimetry of the model with cells dimension and boundary conditions on the North/South side (Neumann condition) and East side (waves, tide and sediment concentration). Transect 1 and 2 will be used later in the paper for making a comparison on breakwater effect on sediment transport. Plot (b) longitudinal profile of the domain with the two different slopes used (blue line = 0.4% and orange line = 0.8%), with three different breakwater positions and two tide conditions (red continuous line = ±0.2 m and cyan dashed line = ±0.4 m).
Water 12 01016 g001
Figure 2. (a) Example of wave damping for the xd = 100 m configuration. Type of line changes according to the wave height, the color is relative to slope and tide. Red continuous line represents (Hs = 0.2 sl = 0.4% T = 0.4), blue continuous (Hs = 0.2 sl = 0.8% T = 0.4), cyan dashed (Hs = 0.5 sl = 0.8% T = 0.8), and so on. (b) Wave damping for all runs as function of the dimensionless variable xd*slope/Hs. Wiberg limits define the range within she measured waves damping, which are consistent with our model results.
Water 12 01016 g002
Figure 3. (a) Velocity field around the breakwater related to the configuration with xd = 100 m, Hs = 0.5 m and sl = 0.8%, during the tidal flood. (b) U velocity component along section A related to all runs with xd = 100 m (same reading key of Plot 2a).
Water 12 01016 g003
Figure 4. Mean u velocity during one tidal cycle measured at the center of section A, as function of the dimensionless variable xd * slope/Hs for all simulations with slope = 0.4% (a) and 0.8% (b).
Water 12 01016 g004
Figure 5. Shear stress as function of the x distance for the xd = 100 m configuration. (a) Shear stress focus on the peak due to the presence of the breakwater (same reading key of Plot 2a). (b) Shear stress zoom on the marsh zone (same reading key of Plot 2a). (c) Shear stress value at the beginning of the marsh (x = 200 m) for the two different slopes, as functions of the dimensionless variable xd*Tide/Hs2.
Water 12 01016 g005
Figure 6. (a) Bed level profile after the end of the simulation compared to the initial condition, for the simulation with slope 0.8%, Hs = 0.5 m, Tide = ±0.2 m, Cs = 0.2 kg/m3 and D50 = 100 µm. (b) Sediment deposition into the salt marsh behind the breakwater, as function of breakwater distance from the shoreline, tide and wave height.
Water 12 01016 g006
Figure 7. Ratio between the breakwater distance to the shoreline as function of the tide. The increasing of tide and breakwater distance to the coast increase the erosion at the marsh boundary, except for wave heights equal to 0.7 m, which mainly results in deposition into the marsh.
Water 12 01016 g007
Figure 8. Eroded marsh volume for those configurations which cause erosion (see Figure 7), as function of the dimensionless variable xd*Tide/Hs2. (a) slope = 0.4% and Tide = ±0.4 m (b) slope = 0.8% and Tide = ±0.4 m (c) slope = 0.4% and Tide = ±0.8 m (d) slope = 0.8% and Tide = ±0.8 m.
Water 12 01016 g008
Figure 9. Sediment concentration Plot for the run with Hs = 0.5 m, slope = 0.8%, Tide = ±0.4 m and xd = 100 m. (a) Sediment concentration = 0.4 kg/m3 and (b) Sediment concentration = 0.2 kg/m3.
Water 12 01016 g009
Figure 10. (a) The 2D bed level at the end of the simulation with slope = 0.8% case, Hs = 0.5 m, xd = 100 m and Tide = ±0.4 m. (b) Longitudinal profile of transect 1 and 2 for the same simulation. The continuous line represents the initial condition, the dash line the transect 1 final bed level condition and the point line transect 2 final bed level condition. (c) Ratio between the deposited volume on transect 1 and 2 for all runs.
Water 12 01016 g010
Figure 11. Example of failing breakwaters use in Chesapeake Bay, US. (A) Eastern Shore of Maryland, (Hoopers Island), (B) and (C) shows failing coastal structures like breakwaters and submerged Riprap. Signs of erosion are evident in the back-marsh area.
Water 12 01016 g011
Figure 12. Long term simulation for (a) xd = 50 m, (b) xd = 100 m and (c) xd = 150 m. The Figure shows how these morphodynamic structures tend to be less accentuated with an increase in breakwater distance to the shoreline.
Water 12 01016 g012
Table 1. Variables for run combinations.
Hs (m)xd (m)sl (%)
0.2 0.3 0.5 0.750 100 1500.4 0.8
D50 (µm)T (m)C (Kg/m3)
100 150±0.2 ±0.40.2 0.4
Table 2. Notation of coefficients of Equations (1)–(5) and Table 1.
CMass concentration of sediment fraction, kg/m3θWave direction
CxPropagation velocity in the x-space, m/sSSource/sink term for the action Balance equation
CyPropagation velocity in the y-space, m/sSxTotal sediment transport in the x direction, m2/s
CσPropagation velocity in the σ –space, m/sSyTotal sediment transport in the y direction, m2/s
CθPropagation velocity in the θ –space, m/sslBasin slope, %
DDiffusion coefficientτFluid shear stress tensor
D50Median diameter, µmtTime, s
ɛporBed porosityTdDeposition or erosion rate, m/s
gGravity acceleration, m/s2TTidal conditions, m
HsWave height, mVVelocity field, m/s
NDensity spectrumxLongitudinal direction, m
pFluid pressure, N/m2xdBreakwater distance from the coast
RSource/sink term for the advection-diffusion equationyTransversal direction, m
ρFluid density, kg/m3zElevation, m
σFrequencyzbBed level, m