Assessing Redundancy in Stormwater Structures Under Hydraulic Design

 , , ,
, , ,
Abstract
:1. Introduction
2. Materials and Methods
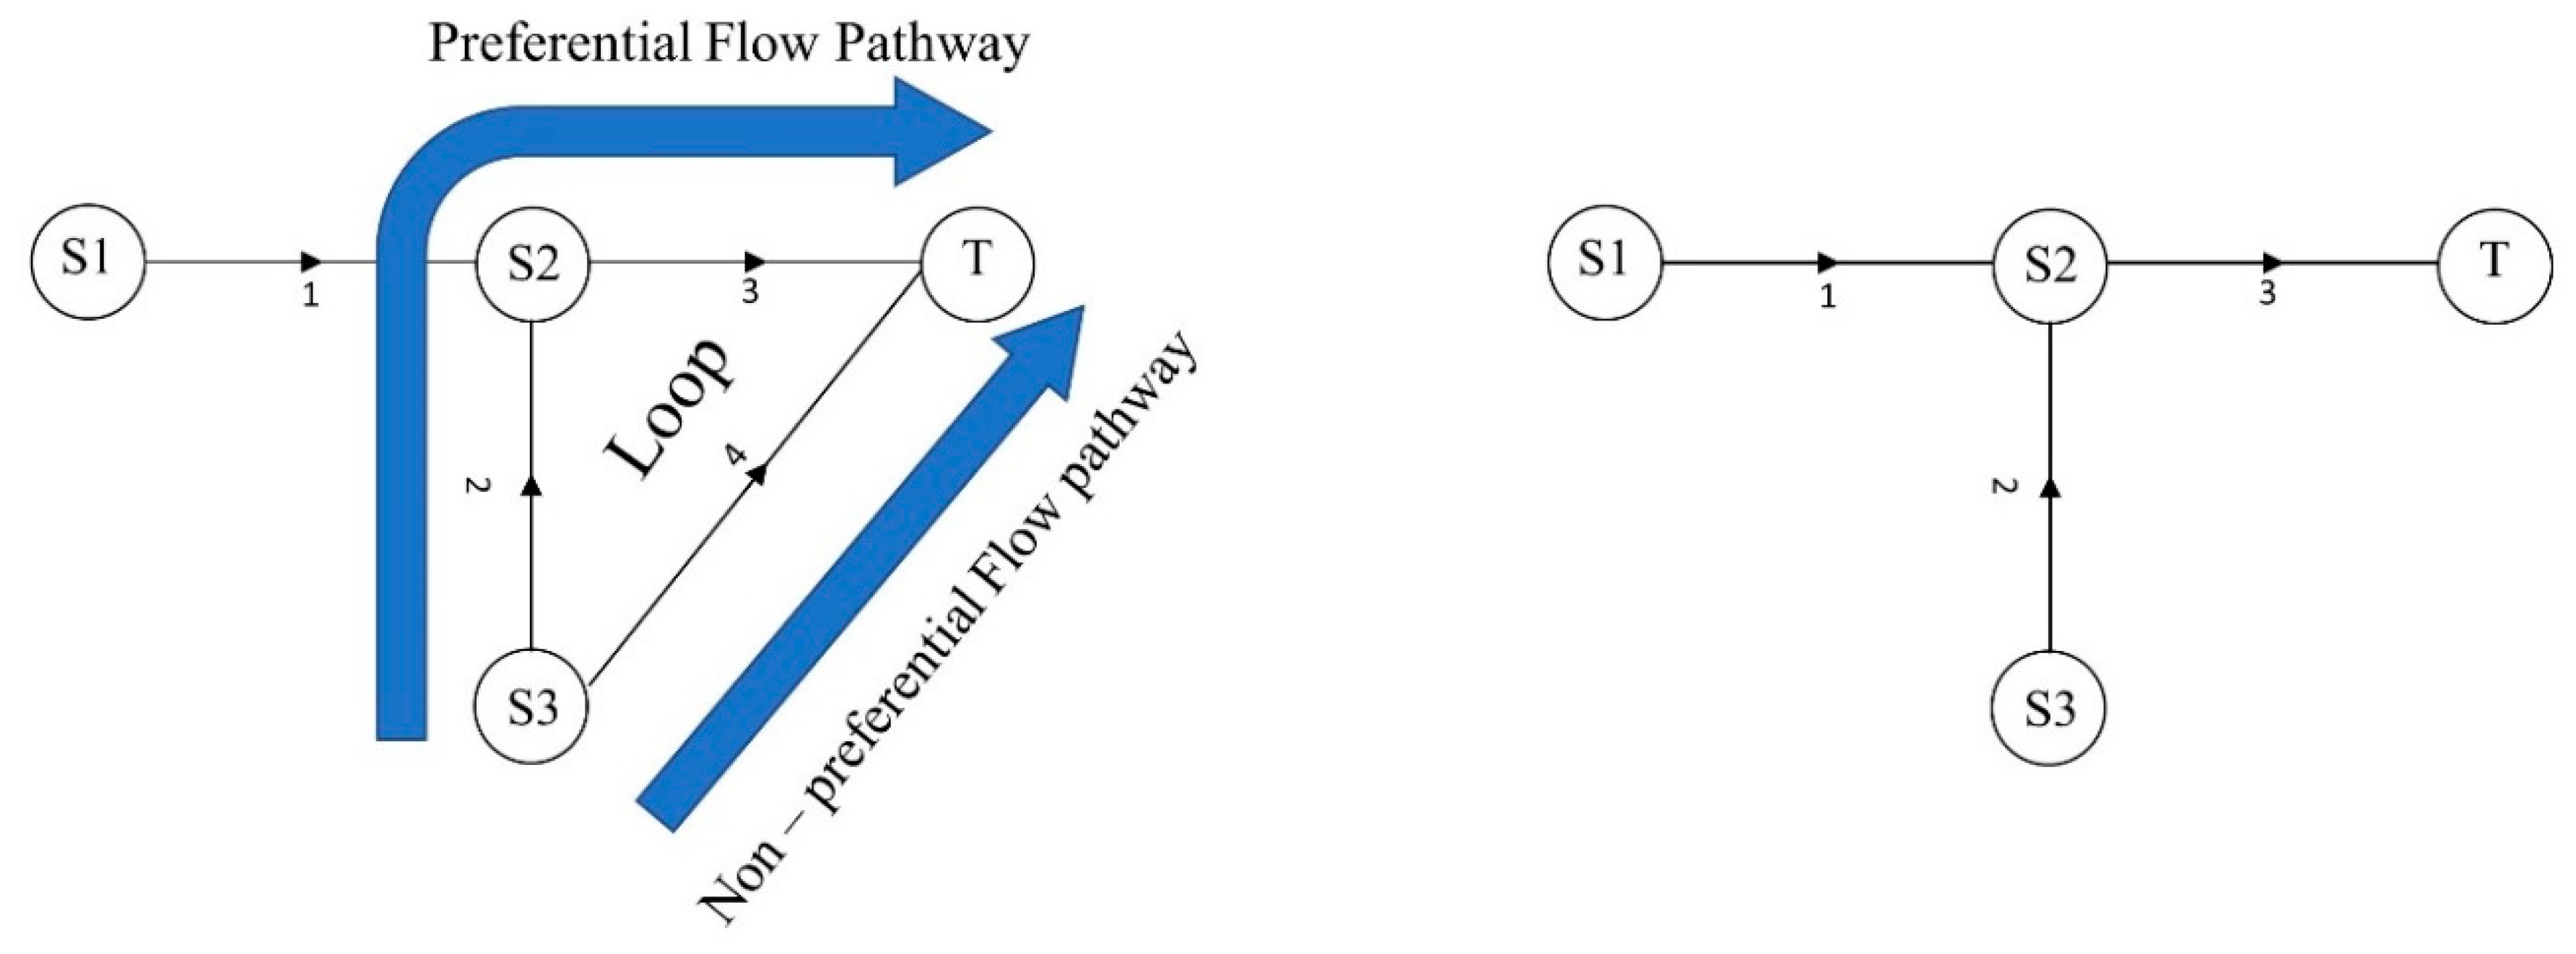
2.1. Complex Network Analysis
2.2. Design Cost Performance Indicator
2.2.1. Layout/Structure Design
2.2.2. Hydraulic Dimensioning and Costs
2.3. Urbanization
2.4. Hydraulic Performance Indicator
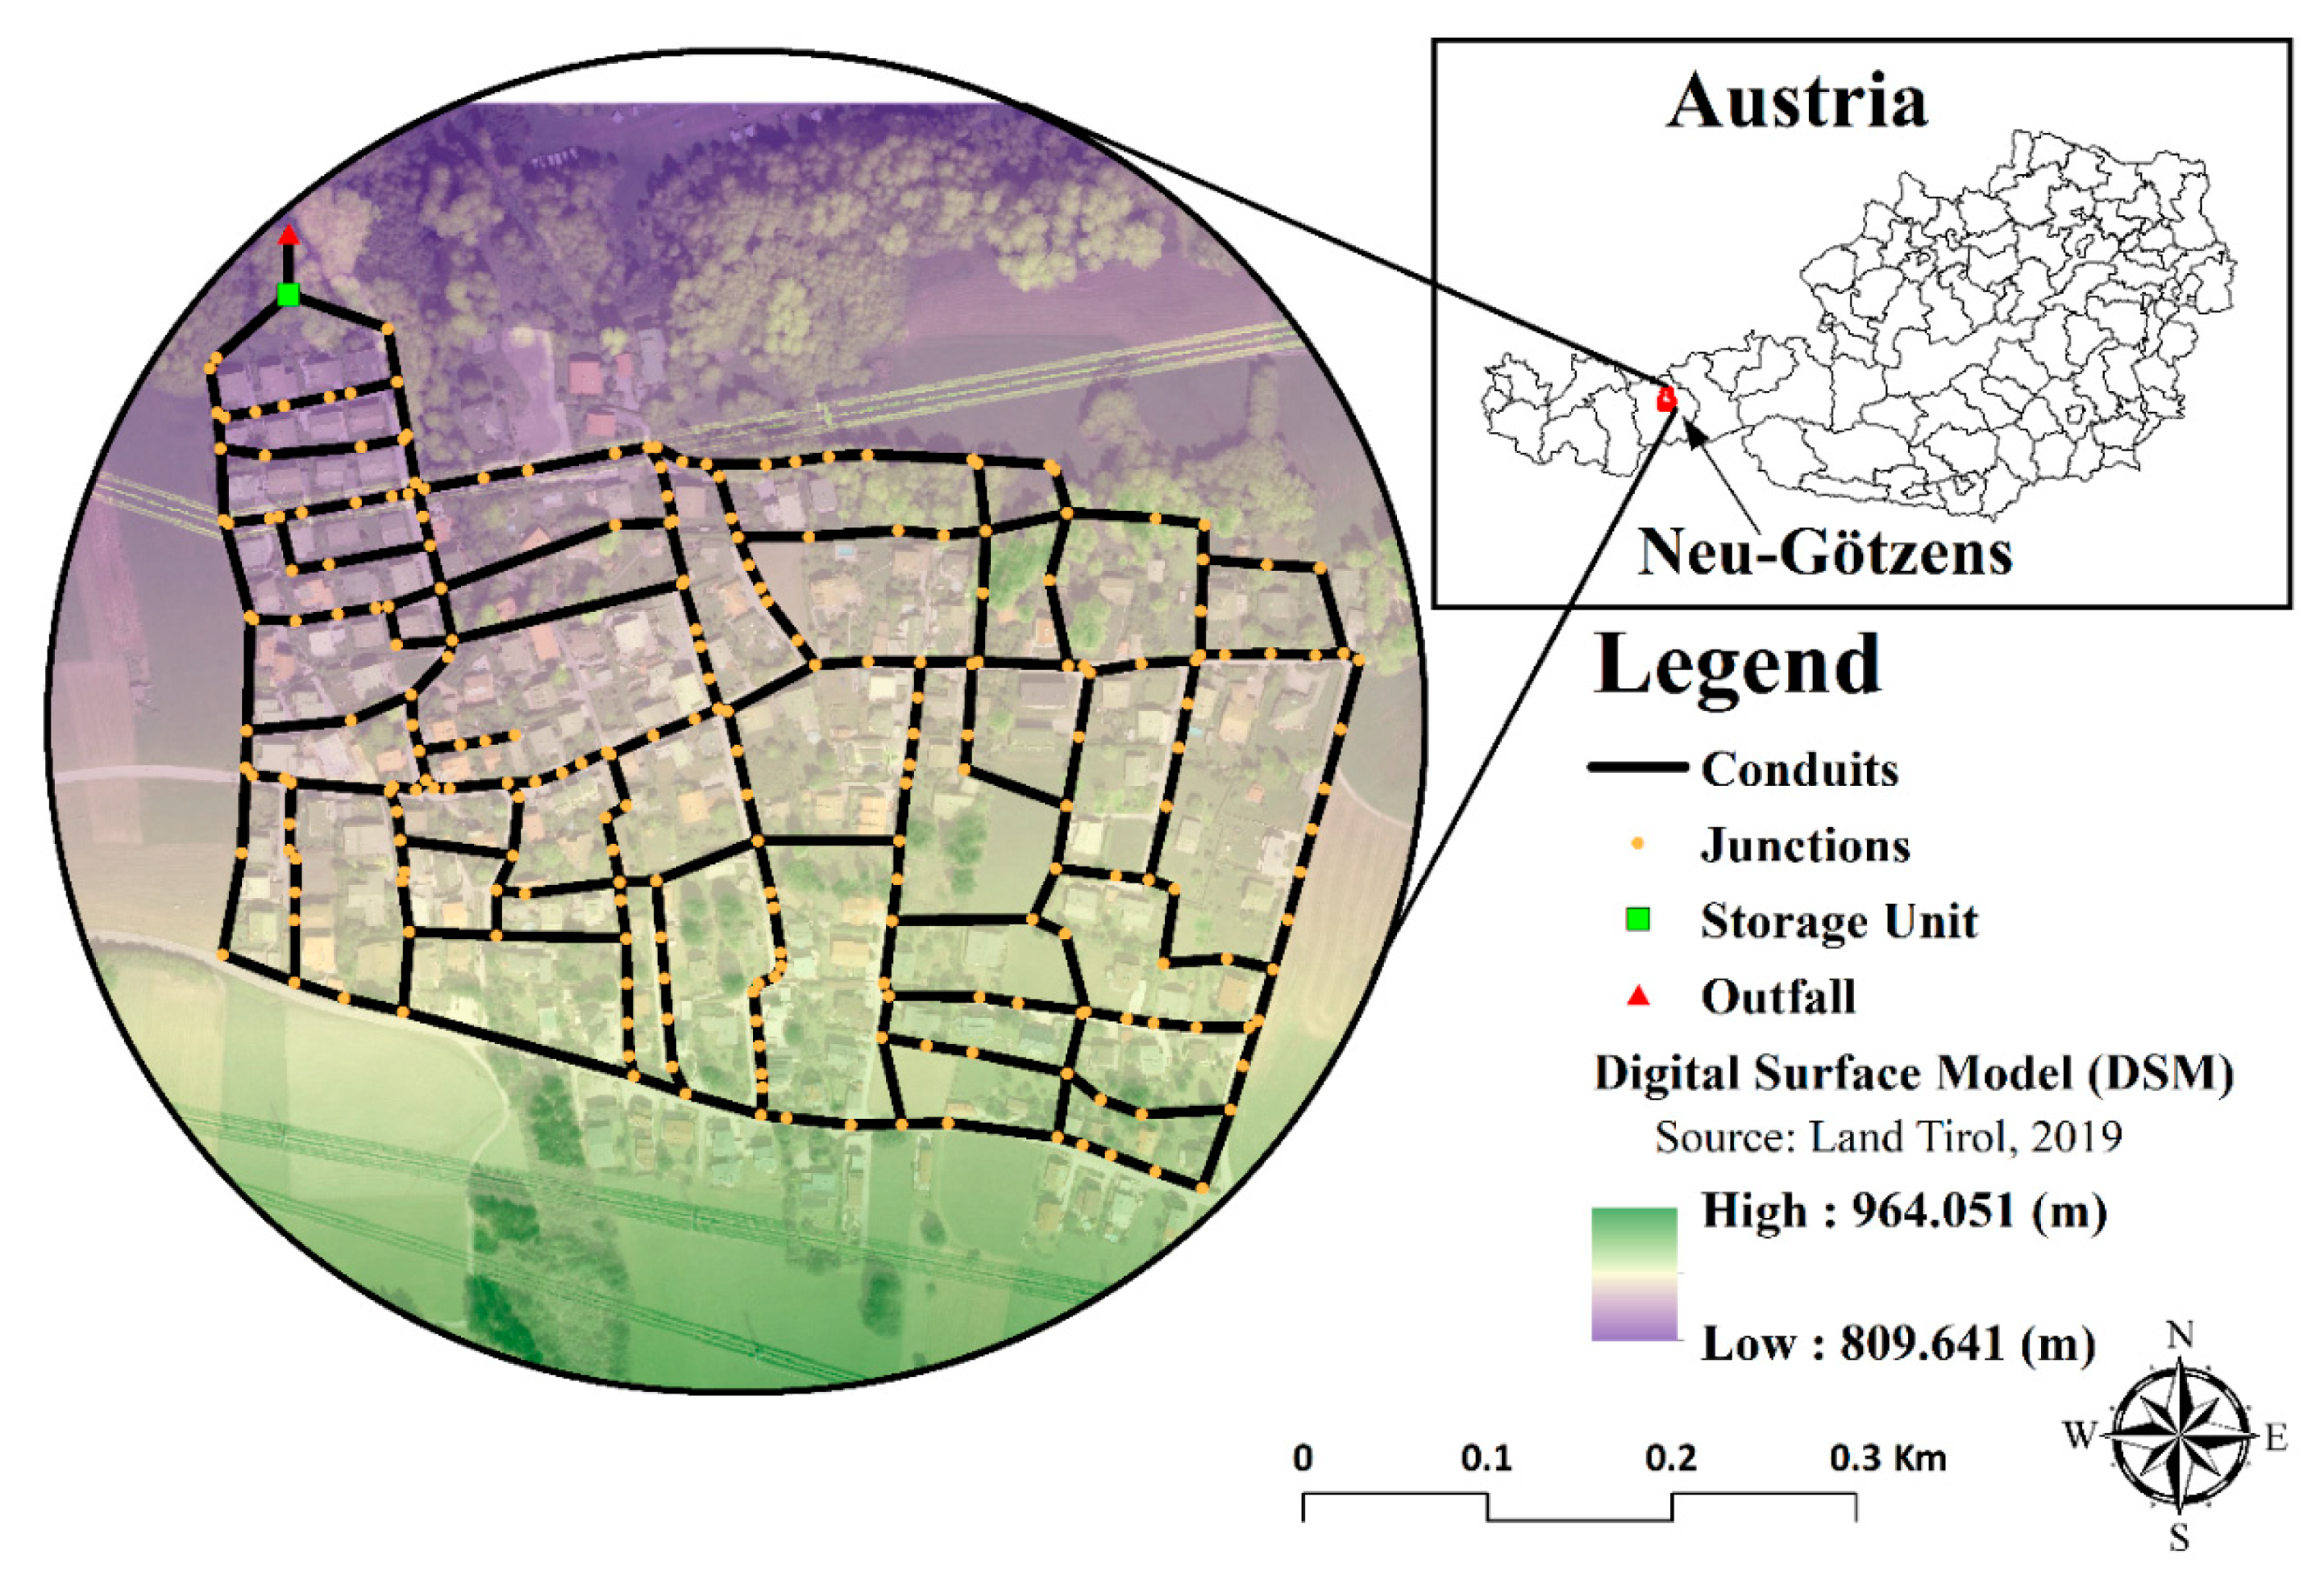
2.5. Case Study
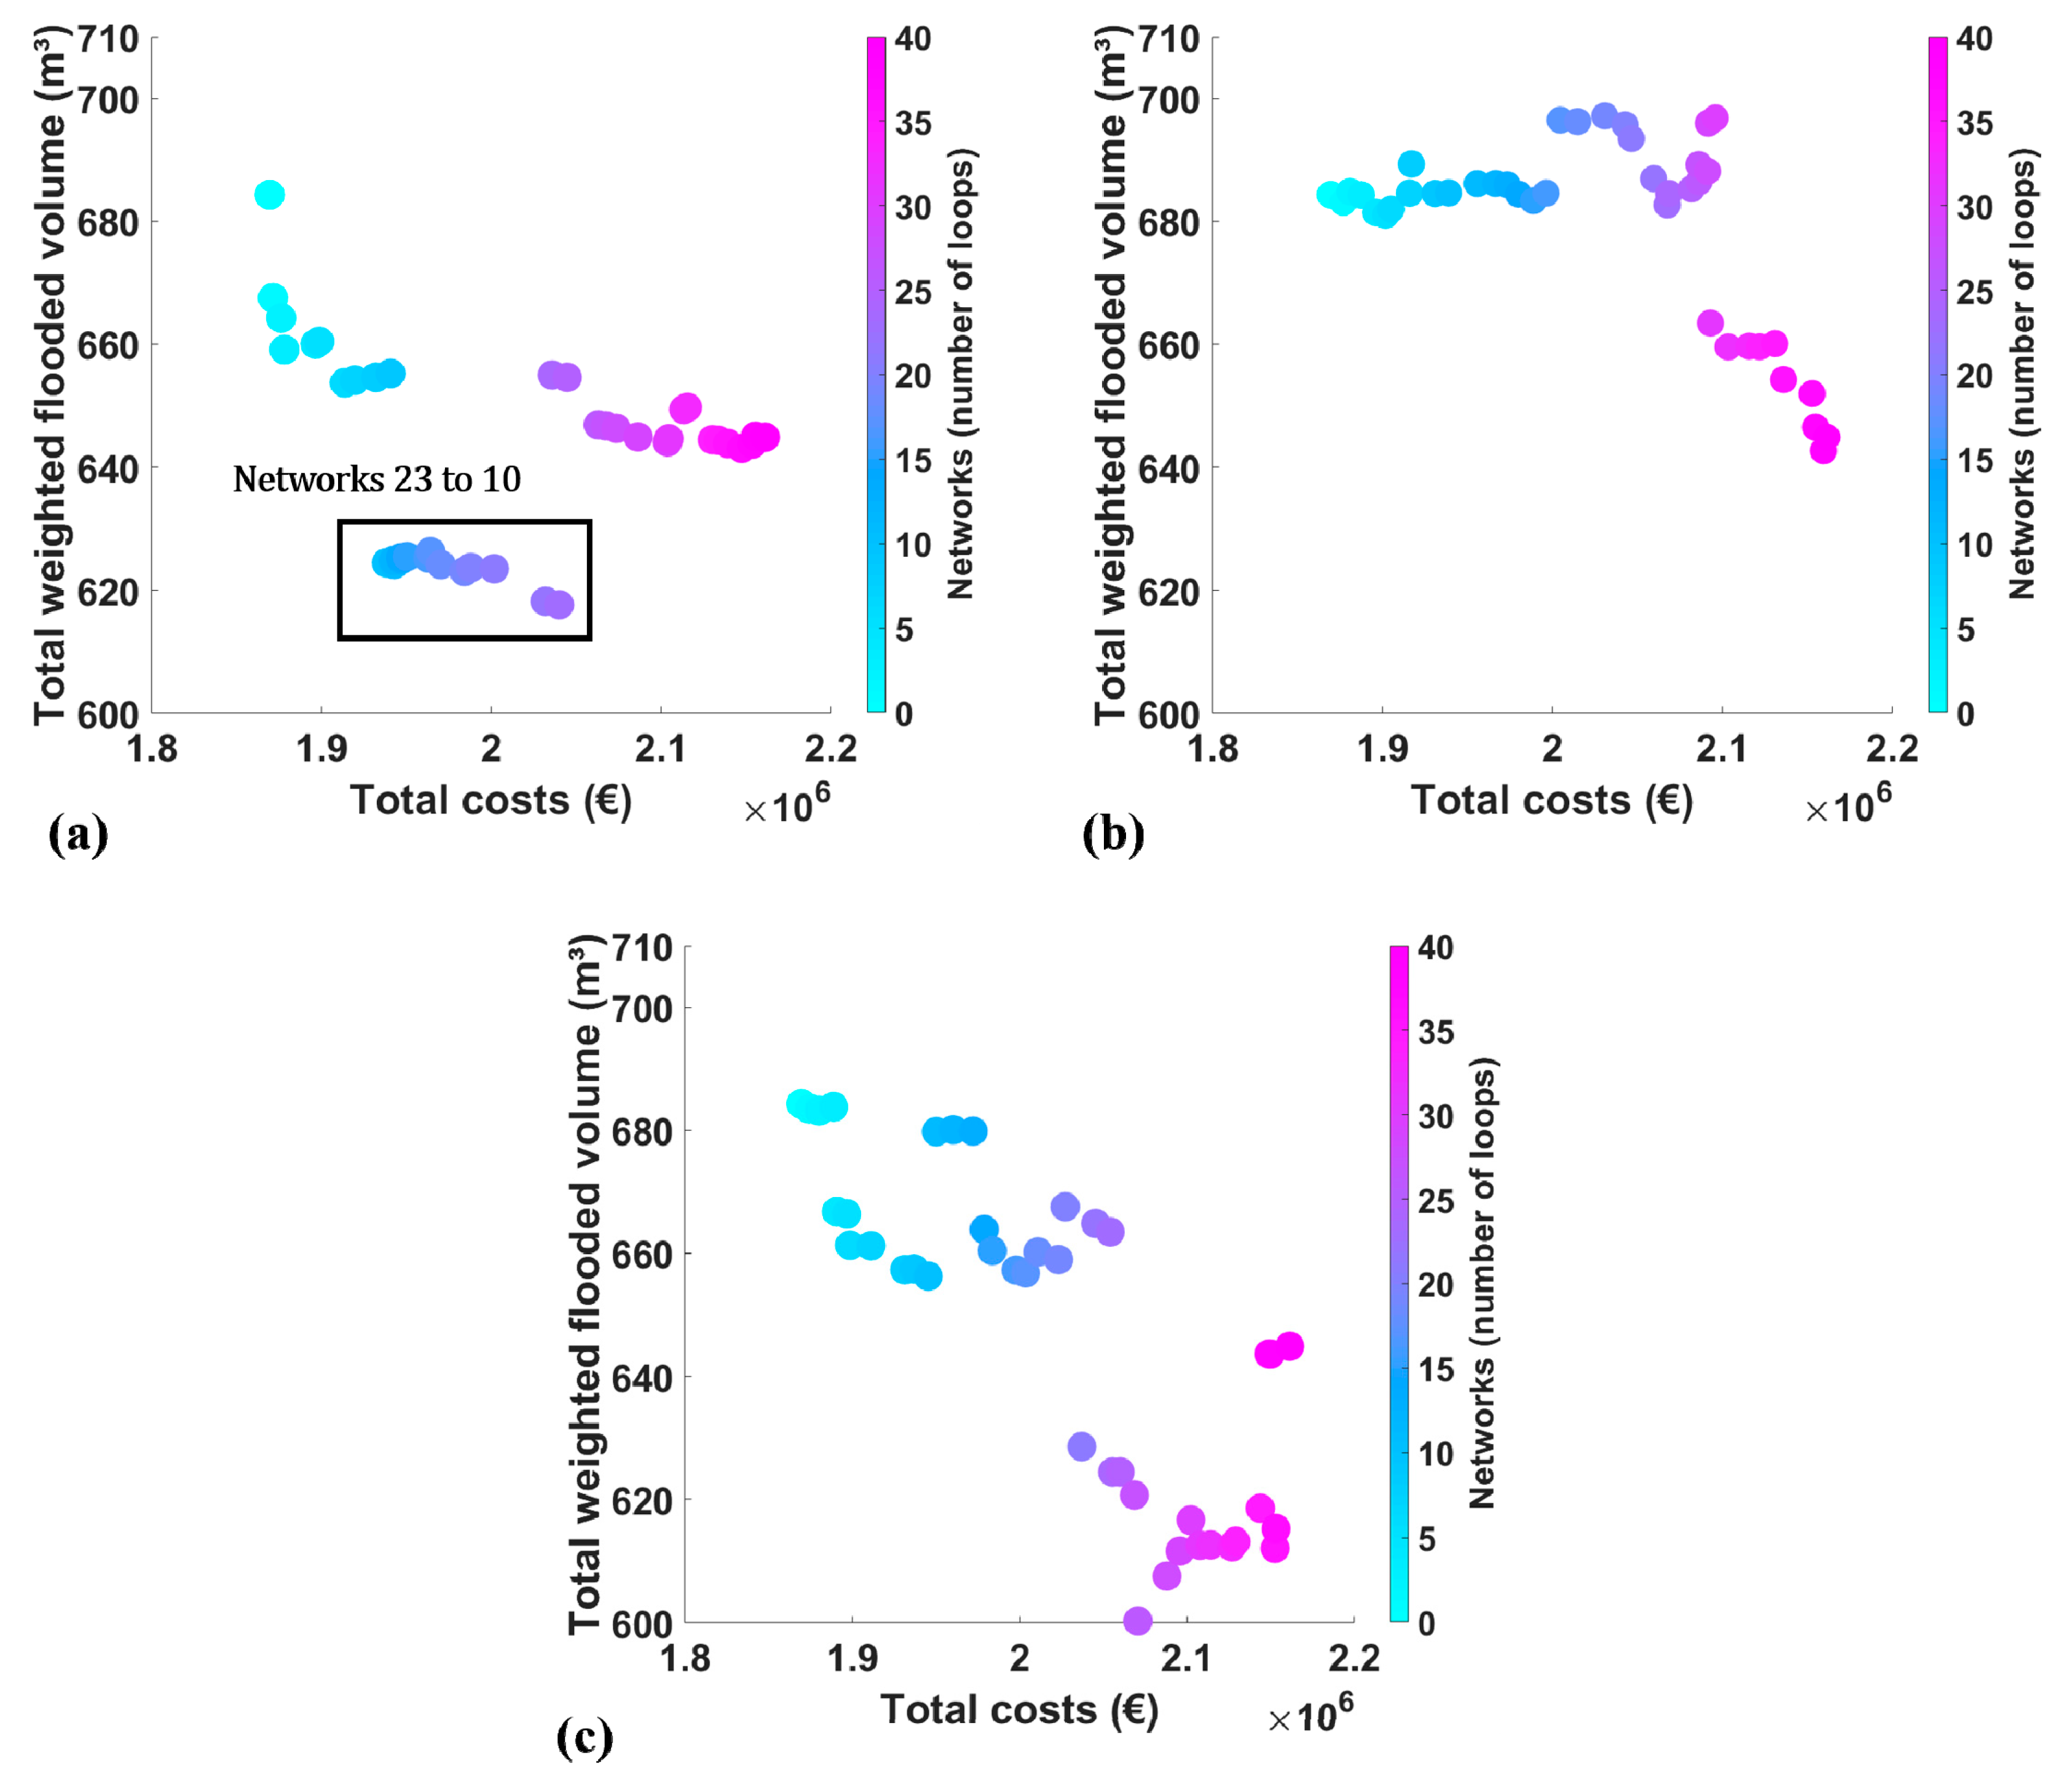
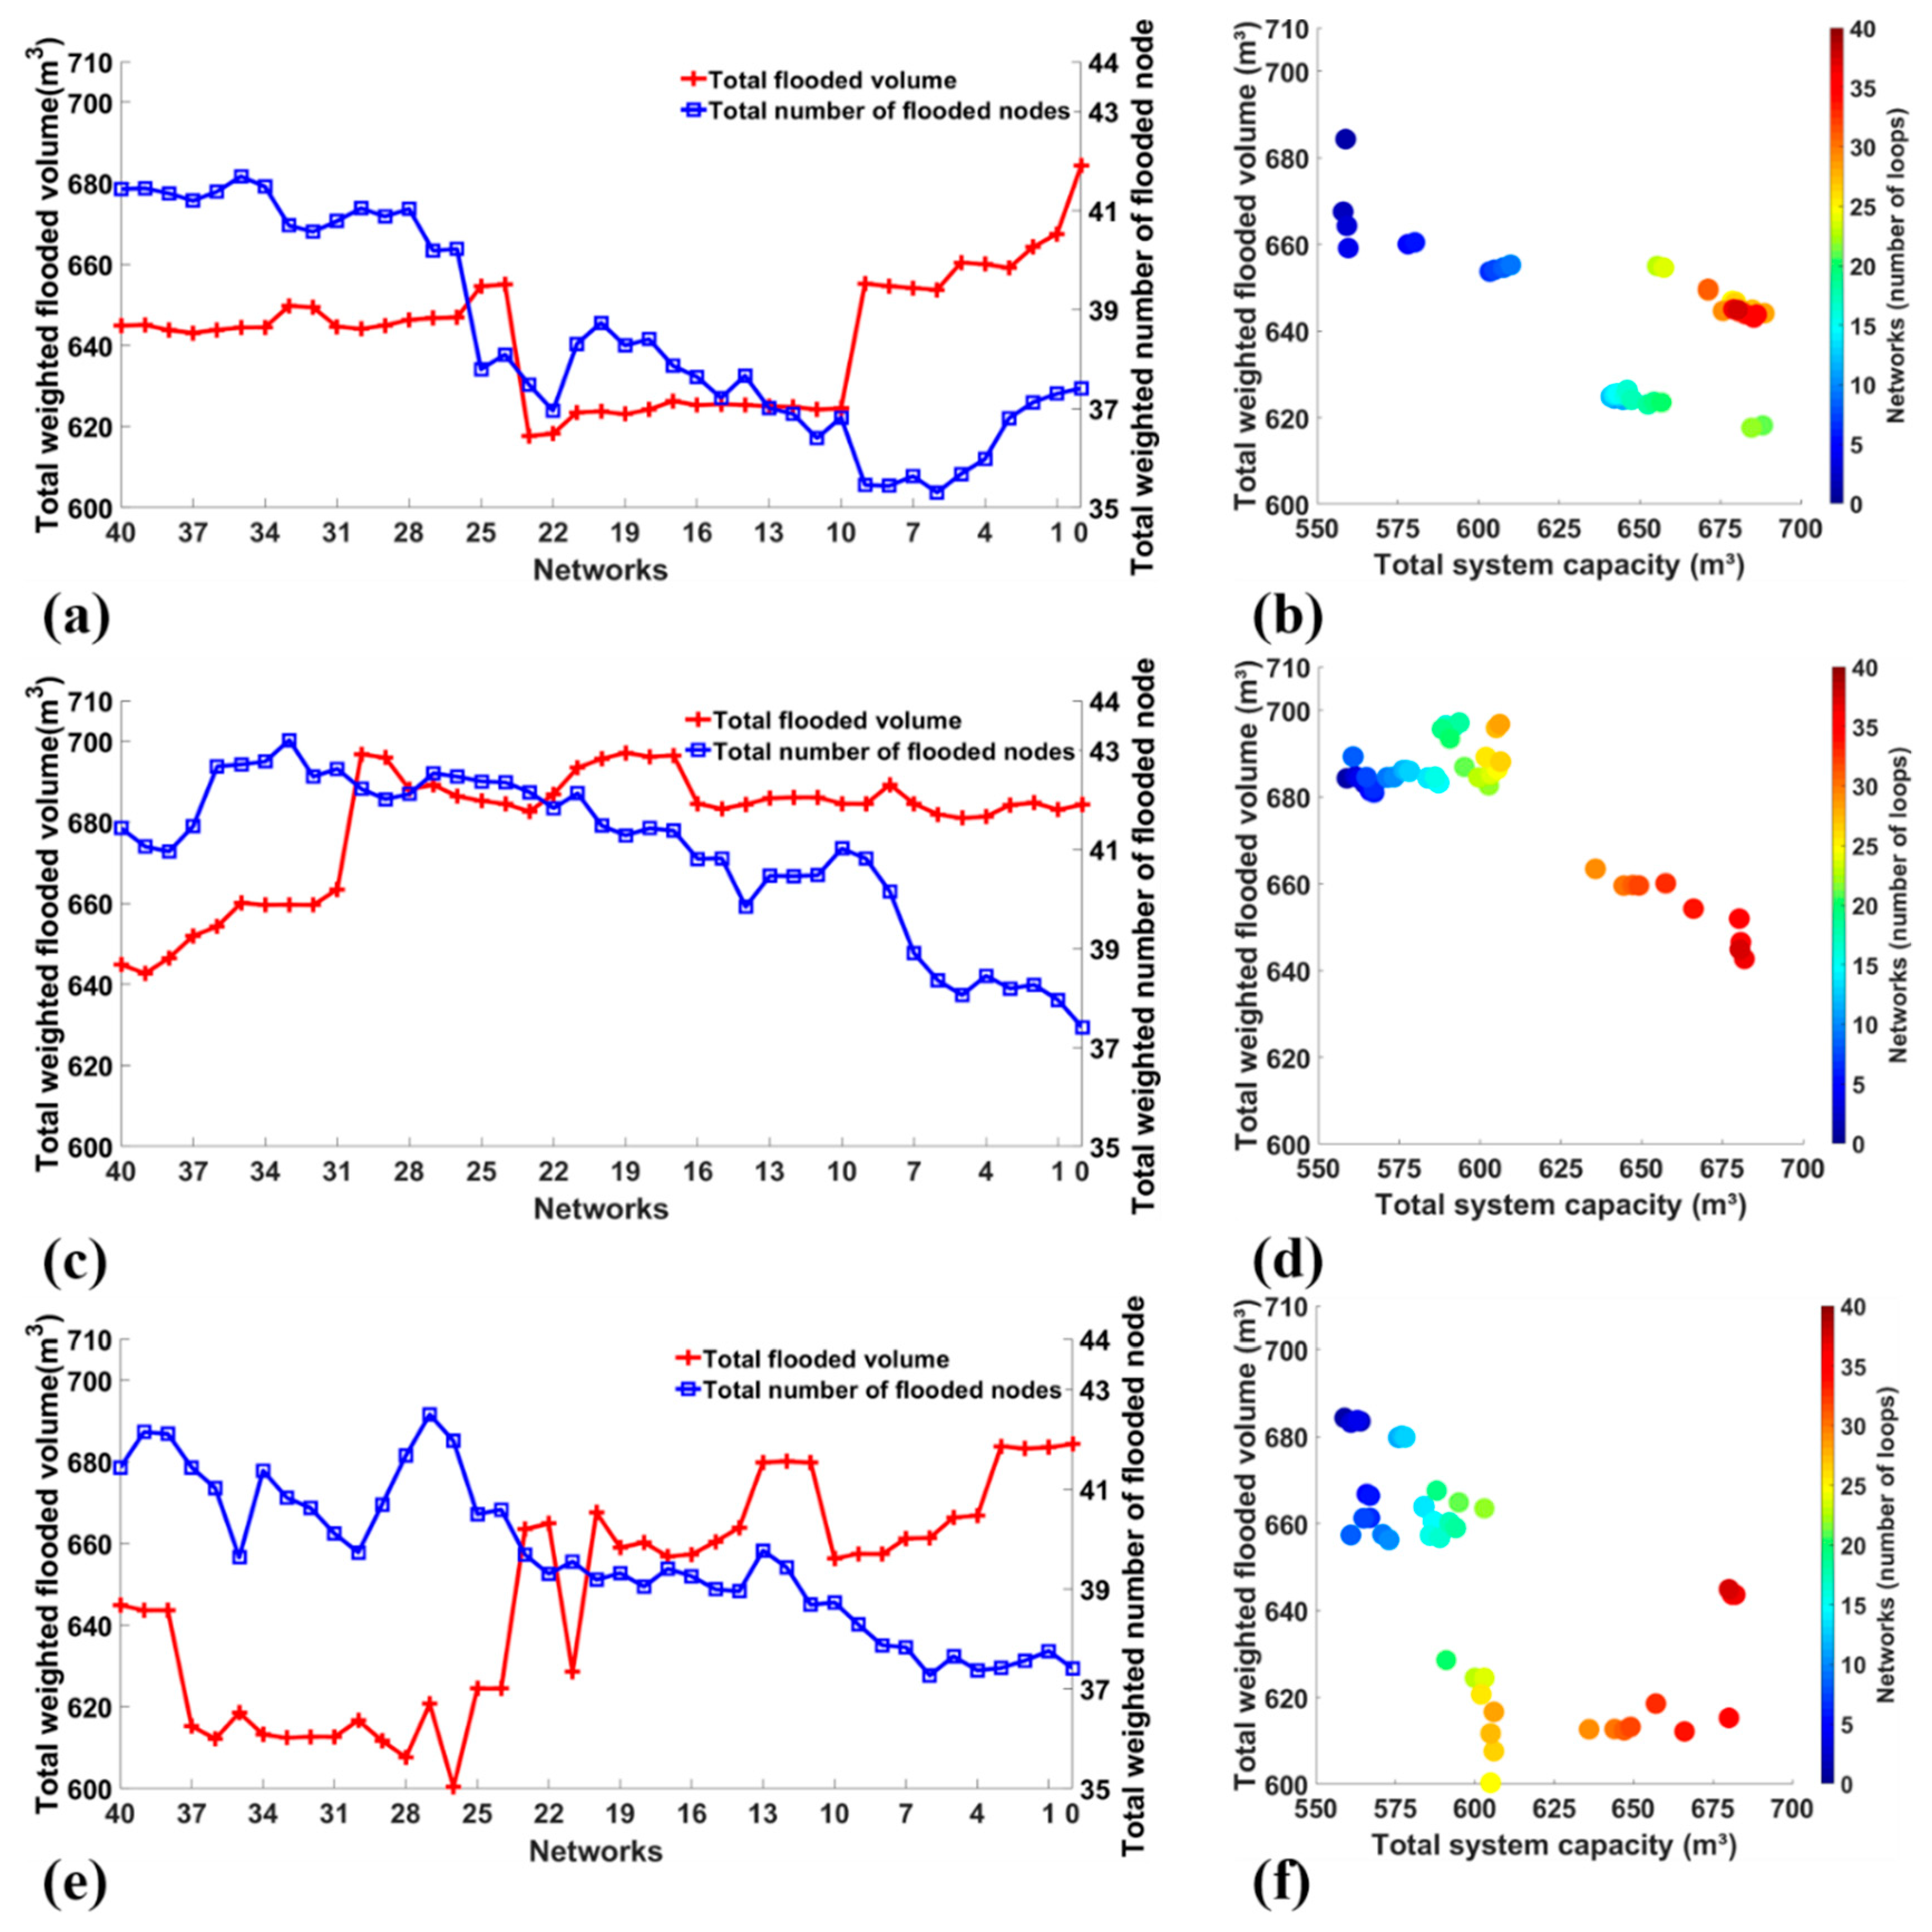
3. Results and Discussion
3.1. Hydraulic Performance Assessment
3.2. Hydraulic and Design Costs Performance Assessment
4. Summary and Conclusions
Author Contributions
Funding
Conflicts of Interest
Appendix A

| Networks | Total Costs (€) | Total System Capacity (m3) | Flooded Volume (m3) | Flooded Nodes | Networks | Total Costs (€) | Total System Capacity (m3) | Flooded Volume (m3) | Flooded Nodes |
|---|---|---|---|---|---|---|---|---|---|
| 40 (base) | 2,161,330 | 680 | 645 | 41.4 | 19 | 1,984,308 | 653 | 623 | 38.3 |
| 39 | 2,155,603 | 679 | 645 | 41.4 | 18 | 1,970,456 | 647 | 624 | 38.4 |
| 38 | 2,153,795 | 686 | 644 | 41.3 | 17 | 1,964,329 | 646 | 626 | 37.9 |
| 37 | 2,147,579 | 685 | 643 | 41.2 | 16 | 1,963,083 | 645 | 625 | 37.6 |
| 36 | 2,139,390 | 683 | 644 | 41.4 | 15 | 1,950,568 | 643 | 625 | 37.2 |
| 35 | 2,133,817 | 682 | 644 | 41.7 | 14 | 1,946,925 | 642 | 625 | 37.7 |
| 34 | 2,130,374 | 681 | 644 | 41.5 | 13 | 1,947,084 | 643 | 625 | 37.0 |
| 33 | 2,115,637 | 671 | 650 | 40.7 | 12 | 1,942,697 | 641 | 625 | 36.9 |
| 32 | 2,113,453 | 671 | 649 | 40.6 | 11 | 1,942,997 | 645 | 624 | 36.4 |
| 31 | 2,104,637 | 676 | 645 | 40.8 | 10 | 1,938,491 | 642 | 624 | 36.8 |
| 30 | 2,103,883 | 689 | 644 | 41.0 | 9 | 1,940,864 | 610 | 655 | 35.5 |
| 29 | 2,086,489 | 685 | 645 | 40.9 | 8 | 1,932,195 | 608 | 655 | 35.4 |
| 28 | 2,073,721 | 679 | 646 | 41.0 | 7 | 1,919,880 | 605 | 654 | 35.6 |
| 27 | 2,067,563 | 680 | 647 | 40.2 | 6 | 1,913,960 | 604 | 654 | 35.3 |
| 26 | 2,063,138 | 679 | 647 | 40.2 | 5 | 1,898,866 | 580 | 660 | 35.7 |
| 25 | 2,044,826 | 657 | 655 | 37.8 | 4 | 1,896,678 | 578 | 660 | 36.0 |
| 24 | 2,035,973 | 655 | 655 | 38.1 | 3 | 1,878,386 | 560 | 659 | 36.8 |
| 23 | 2,040,203 | 685 | 618 | 37.5 | 2 | 1,876,470 | 559 | 664 | 37.1 |
| 22 | 2,032,046 | 688 | 619 | 37.0 | 1 | 1,871,648 | 558 | 668 | 37.3 |
| 21 | 2,001,924 | 657 | 624 | 38.3 | 0 | 1,869,698 | 559 | 684 | 37.4 |
| 20 | 1,988,070 | 654 | 624 | 38.7 | |||||
| Networks | Total Costs (€) | Total System Capacity (m3) | Flooded Volume (m3) | Flooded Nodes | Networks | Total Costs (€) | Total System Capacity (m3) | Flooded Volume (m3) | Flooded Nodes |
|---|---|---|---|---|---|---|---|---|---|
| 40 (base) | 2,161,330 | 680 | 645 | 41.4 | 19 | 2,030,928 | 594 | 697 | 41.3 |
| 39 | 2,159,587 | 682 | 643 | 41.1 | 18 | 2,014,936 | 592 | 696 | 41.4 |
| 38 | 2,154,764 | 681 | 647 | 41.0 | 17 | 2,004,697 | 589 | 696 | 41.4 |
| 37 | 2,152,848 | 680 | 652 | 41.5 | 16 | 1,996,492 | 586 | 685 | 40.8 |
| 36 | 2,135,994 | 666 | 654 | 42.7 | 15 | 1,988,899 | 587 | 683 | 40.8 |
| 35 | 2,130,969 | 657 | 660 | 42.7 | 14 | 1,980,184 | 584 | 684 | 39.8 |
| 34 | 2,121,862 | 649 | 660 | 42.8 | 13 | 1,973,479 | 578 | 686 | 40.5 |
| 33 | 2,115,790 | 647 | 660 | 43.2 | 12 | 1,966,705 | 577 | 686 | 40.5 |
| 32 | 2,103,474 | 644 | 660 | 42.5 | 11 | 1,955,941 | 576 | 686 | 40.5 |
| 31 | 2,093,036 | 636 | 663 | 42.6 | 10 | 1,939,136 | 573 | 685 | 41.0 |
| 30 | 2,095,986 | 606 | 697 | 42.2 | 9 | 1,931,201 | 571 | 685 | 40.8 |
| 29 | 2,091,710 | 605 | 696 | 42.0 | 8 | 1,917,250 | 561 | 689 | 40.1 |
| 28 | 2,091,278 | 606 | 688 | 42.1 | 7 | 1,916,134 | 565 | 685 | 38.9 |
| 27 | 2,086,162 | 602 | 689 | 42.5 | 6 | 1,905,165 | 567 | 682 | 38.4 |
| 26 | 2,086,278 | 605 | 686 | 42.5 | 5 | 1,901,968 | 567 | 681 | 38.1 |
| 25 | 2,081,858 | 603 | 685 | 42.4 | 4 | 1,896,395 | 566 | 681 | 38.4 |
| 24 | 2,068,662 | 600 | 685 | 42.3 | 3 | 1,887,506 | 563 | 684 | 38.2 |
| 23 | 2,067,676 | 603 | 683 | 42.2 | 2 | 1,881,011 | 561 | 685 | 38.3 |
| 22 | 2,059,741 | 595 | 687 | 41.8 | 1 | 1,877,138 | 564 | 683 | 38.0 |
| 21 | 2,046,580 | 591 | 693 | 42.1 | 0 | 1,869,698 | 559 | 684 | 37.4 |
| 20 | 2,042,804 | 588 | 696 | 41.5 | |||||
| Networks | Total Costs (€) | Total System Capacity (m3) | Flooded Volume (m3) | Flooded Nodes | Networks | Total Costs (€) | Total System Capacity (m3) | Flooded Volume (m3) | Flooded Nodes |
|---|---|---|---|---|---|---|---|---|---|
| 40 (base) | 2,161,330 | 680 | 645 | 41.4 | 19 | 2,023,225 | 594 | 659 | 39.3 |
| 39 | 2,149,865 | 682 | 644 | 42.1 | 18 | 2,010,975 | 592 | 660 | 39.0 |
| 38 | 2,149,004 | 681 | 644 | 42.1 | 17 | 2,003,661 | 589 | 657 | 39.4 |
| 37 | 2,153,055 | 680 | 615 | 41.4 | 16 | 1,997,935 | 586 | 657 | 39.3 |
| 36 | 2,152,498 | 666 | 612 | 41.0 | 15 | 1,983,732 | 587 | 660 | 39.0 |
| 35 | 2,143,796 | 657 | 619 | 39.6 | 14 | 1,978,909 | 584 | 664 | 39.0 |
| 34 | 2,129,086 | 649 | 613 | 41.4 | 13 | 1,972,227 | 578 | 680 | 39.8 |
| 33 | 2,126,811 | 647 | 612 | 40.8 | 12 | 1,960,383 | 577 | 680 | 39.4 |
| 32 | 2,114,063 | 644 | 613 | 40.6 | 11 | 1,950,277 | 576 | 680 | 38.7 |
| 31 | 2,107,760 | 636 | 613 | 40.1 | 10 | 1,945,455 | 573 | 656 | 38.7 |
| 30 | 2,102,239 | 606 | 617 | 39.7 | 9 | 1,936,903 | 571 | 657 | 38.3 |
| 29 | 2,095,733 | 605 | 612 | 40.7 | 8 | 1,931,461 | 561 | 657 | 37.9 |
| 28 | 2,087,909 | 606 | 608 | 41.7 | 7 | 1,911,252 | 565 | 661 | 37.8 |
| 27 | 2,068,655 | 602 | 621 | 42.5 | 6 | 1,898,737 | 567 | 661 | 37.3 |
| 26 | 2,070,702 | 605 | 600 | 42.0 | 5 | 1,896,821 | 567 | 666 | 37.6 |
| 25 | 2,060,105 | 603 | 624 | 40.5 | 4 | 1,890,901 | 566 | 667 | 37.4 |
| 24 | 2,055,568 | 600 | 624 | 40.6 | 3 | 1,888,952 | 563 | 684 | 37.4 |
| 23 | 2,054,192 | 603 | 663 | 39.7 | 2 | 1,880,283 | 561 | 683 | 37.6 |
| 22 | 2,045,340 | 595 | 665 | 39.3 | 1 | 1,874,358 | 564 | 684 | 37.8 |
| 21 | 2,037,088 | 591 | 629 | 39.5 | 0 | 1,869,698 | 559 | 684 | 37.4 |
| 20 | 2,027,299 | 588 | 668 | 39.2 | |||||
References
- Rosenzweig, B.R.; McPhillips, L.; Chang, H.; Cheng, C.; Welty, C.; Matsler, M.; Iwaniec, D.; Davidson, C.I. Pluvial flood risk and opportunities for resilience. Wiley Interdiscip Rev. Water 2018, 5, e1302. [Google Scholar] [CrossRef]
- Alexander, L.V.; Zhang, X.; Peterson, T.C.; Caesar, J.; Gleason, B.; Klein Tank, A.M.G.; Haylock, M.; Collins, D.; Trewin, B.; Rahimzadeh, F. Global observed changes in daily climate extremes of temperature and precipitation. J. Geophys. Res. Atmos. 2006, 111, 1–22. [Google Scholar] [CrossRef] [Green Version]
- Freire Diogo, A.; Antunes do Carmo, J. Peak Flows and Stormwater Networks Design—Current and Future Management of Urban Surface Watersheds. Water 2019, 11, 759. [Google Scholar] [CrossRef] [Green Version]
- Liang, L.Y. Optimising the design of sewer networks using genetic algorithms and tabu search. Eng. Constr. Archit. Manag. 2004, 11, 101–112. [Google Scholar] [CrossRef]
- Afshar, M.H. Improving the efficiency of ant algorithms using adaptive refinement: Application to storm water network design. Adv. Water Resour. 2006, 29, 1371–1382. [Google Scholar] [CrossRef]
- Afshar, M.H. Rebirthing particle swarm optimization algorithm: Application to storm water network design. Can. J. Civ. Eng. 2008, 35, 1120–1127. [Google Scholar] [CrossRef]
- Tze-Chin, P.; Jehng-Jung, K. GA-QP Model to Optimize Sewer System Design. J. Environ. Eng. 2009, 135, 17–24. [Google Scholar]
- Afshar, M.H.; Shahidi, M.; Rohani, M.; Sargolzaei, M. Application of cellular automata to sewer network optimization problems. Sci. Iran. 2011, 18, 304–312. [Google Scholar] [CrossRef] [Green Version]
- Haghighi, A.; Bakhshipour, A.E. Optimization of Sewer Networks Using an Adaptive Genetic Algorithm. Water Resour. Manag. 2012, 26, 3441–3456. [Google Scholar] [CrossRef]
- Bakhshipour, A.E.; Bakhshizadeh, M.; Dittmer, U.; Haghighi, A.; Nowak, W. Hanging Gardens Algorithm to Generate Decentralized Layouts for the Optimization of Urban Drainage Systems. J. Water Resour. Plan. Manag. 2019, 145, 04019034. [Google Scholar] [CrossRef]
- Afshar, M.H.; Rohani, M. Optimal design of sewer networks using cellular automata-based hybrid methods: Discrete and continuous approaches. Eng. Optim. 2012, 44, 1–22. [Google Scholar] [CrossRef]
- Steele, J.C.; Mahoney, K.; Karovic, O.; Mays, L.W. Heuristic optimization model for the optimal layout and pipe design of sewer systems. Water Resour. Manag. 2016, 30, 1605–1620. [Google Scholar] [CrossRef]
- Ahern, J. From fail-safe to safe-to-fail: Sustainability and resilience in the new urban world. Landsc. Urban Plan. 2011, 100, 341–343. [Google Scholar] [CrossRef] [Green Version]
- Mugume, S.N.; Diao, K.; Astaraie-Imani, M.; Fu, G.; Farmani, R.; Butler, D. Enhancing resilience in urban water systems for future cities. Water Supply 2015, 15, 1343–1352. [Google Scholar] [CrossRef] [Green Version]
- Butler, D.; Farmani, R.; Fu, G.; Ward, S.; Diao, K.; Astaraie-Imani, M. A new approach to urban water management: Safe and sure. Procedia Eng. 2014, 89, 347–354. [Google Scholar] [CrossRef] [Green Version]
- Casal-Campos, A.; Sadr, S.M.K.; Fu, G.; Butler, D. Reliable, resilient and sustainable urban drainage systems: An analysis of robustness under deep uncertainty. Environ. Sci. Technol. 2018, 52, 9008–9021. [Google Scholar] [CrossRef] [Green Version]
- Jia, H.; Wang, Z.; Zhen, X.; Clar, M.; Shaw, L.Y. China’s sponge city construction: A discussion on technical approaches. Front. Environ. Sci. Eng. 2017, 11, 18. [Google Scholar] [CrossRef]
- Pregnolato, M.; Ford, A.; Robson, C.; Glenis, V.; Barr, S.; Dawson, R. Assessing urban strategies for reducing the impacts of extreme weather on infrastructure networks. R. Soc. open Sci. 2016, 3, 160023. [Google Scholar] [CrossRef] [Green Version]
- Martínez, C.; Sanchez, A.; Galindo, R.; Mulugeta, A.; Vojinovic, Z.; Galvis, A. Configuring green infrastructure for urban runoff and pollutant reduction using an optimal number of units. Water 2018, 10, 1528. [Google Scholar] [CrossRef] [Green Version]
- Yang, B.; Li, S. Green infrastructure design for stormwater runoff and water quality: Empirical evidence from large watershed-scale community developments. Water 2013, 5, 2038–2057. [Google Scholar] [CrossRef]
- Stovin, V.; Dunnett, N.; Hallam, A. Green roofs-getting sustainable drainage off the ground. In Proceedings of the NOVATECH 2007, Lyon, France, 25–28 June 2007; pp. 11–18. [Google Scholar]
- Zhang, C.; Wang, Y.; Li, Y.; Ding, W. Vulnerability analysis of urban drainage systems: Tree vs. loop Networks. Sustainability 2017, 9, 397. [Google Scholar] [CrossRef] [Green Version]
- Lee, J.; Chung, G.; Park, H.; Park, I. Evaluation of the structure of urban stormwater pipe network using drainage density. Water (Switzerland) 2018, 10, 1444. [Google Scholar] [CrossRef] [Green Version]
- Reyes-Silva, J.D.; Helm, B.; Krebs, P. Meshness of sewer networks and its implications for flooding occurrence. Water Sci. Technol. 2019. [Google Scholar] [CrossRef]
- Mair, M.; Zischg, J.; Rauch, W.; Sitzenfrei, R. Where to find water pipes and sewers?—On the correlation of infrastructure networks in the urban environment. Water 2017, 9, 146. [Google Scholar] [CrossRef] [Green Version]
- Shao, Z.; Zhang, X.; Li, S.; Deng, S.; Chai, H. A novel SWMM based algorithm application to storm sewer network design. Water 2017, 9, 747. [Google Scholar] [CrossRef] [Green Version]
- Diogo, A.F.; Walters, G.A.; Ribeiro de Sousa, E.; Graveto, V.M. Three-dimensional optimization of urban drainage systems. Comput. Civ. Infrastruct. Eng. 2000, 15, 409–425. [Google Scholar] [CrossRef]
- Girvan, M.; Newman, M.E.J. Community structure in social and biological networks. Proc. Natl. Acad. Sci. USA 2002, 99, 7821–7826. [Google Scholar] [CrossRef] [Green Version]
- Barthelemy, M. Morphogenesis of Spatial Networks; Springer International Publishing: Cham, Switzerland, 2018; ISBN 978-3-319-20564-9. [Google Scholar]
- Rossman, L.A. Storm Water Management Model, User’s Manual, Version 5.1; EPA-600/R-14/413b; U.S. Office of Research and Development, US Environmental Protection Agency: Cincinnati, OH, USA, 2015.
- Abfallwirtschaftsverband. ÖWAV-Regelblatt 11: Richtlinien für die abwassertechnische Berechnung und Dimensionierung von Abwasserkanälen; Österreichisches Normungsinstitut: Wien, Austria, 2009. [Google Scholar]
- Arbeitsblatt. DWA-A 118: Hydraulische Bemessung und Nachweis von Entwässerungssystemen. DWA, Hennef 2006, 3, 1–32. [Google Scholar]
- Maurer, M.; Scheidegger, A.; Herlyn, A. Quantifying costs and lengths of urban drainage systems with a simple static sewer infrastructure model. Urban. Water J. 2013, 10, 268–280. [Google Scholar] [CrossRef]
- Yang, L.; Tian, F.; Niyogi, D. A need to revisit hydrologic responses to urbanization by incorporating the feedback on spatial rainfall patterns. Urban. Clim. 2015, 12, 128–140. [Google Scholar] [CrossRef]
- Villarini, G.; Smith, J.A.; Baeck, M.L.; Smith, B.K.; Sturdevant-Rees, P. Hydrologic analyses of the July 17–18, 1996, flood in Chicago and the role of urbanization. J. Hydrol. Eng. 2011, 18, 250–259. [Google Scholar] [CrossRef]
- Kleidorfer, M.; Sitzenfrei, R.; Rauch, W. Simplifying impact of urban development on sewer systems. Water Sci. Technol. 2014, 70, 1808–1816. [Google Scholar] [CrossRef] [PubMed]
- Jia, N.; Sitzenfrei, R.; Rauch, W.; Liang, S.; Liu, Y. Effects of Urban Forms on Separate Drainage Systems: A Virtual City Perspective. Water 2019, 11, 758. [Google Scholar] [CrossRef] [Green Version]


| Properties | Edge Number | ||
|---|---|---|---|
| 2 | 3 | 4 | |
| Length [] | 20 | 20 | 30 |
| Slope [] | 0.02 | 0.02 | 0.02 |
| Diameter [] | 0.25 | 0.4 | 0.25 |
| 5702 | 1628 | 7127 | |
| Sum of edge weights from S3 to T | 7330 | 8553 | |
| [] | 0.5 | 1 | 0 |
| Design Constraints | Threshold Values |
|---|---|
| Minimum Diameter | 0.25 (m) |
| Discrete Set of Diameters From Commercial List [32] | 0.25, 0.3, 0.35, 0.38, 0.4, 0.45,0.5, 0.53, 0.6, 0.7, 0.8, 0.9, 1, 1.05, 1.20, 1.35, 1.40, 1.5 (m) |
| Minimum Cover Depth | 1.5 (m) |
| Maximum Cover Depth | 8 (m) |
| Minimum Slope [32] | 0.3% |
| Minimum Velocity | 0.5 (m/s) |
| Maximum Velocity [32] | 5 (m/s) |
| Ratio of Design Flow Height to the Diameter | 0.9 |
| No. of Conduits | No. of Junctions | Total Area [ha] | Effective Impervious Area [ha] | Total Sewer Length [Km] | Maximum Throttle Flow from Storage Unit [L/s] | No. of Population |
|---|---|---|---|---|---|---|
| 276 | 237 | 21.94 | 11.82 | 7 | 250 | 600 |
| Euler II Rainfall Characteristics | ||||||
|---|---|---|---|---|---|---|
| Initial return periods (years) | 5 | 10 | 20 | 50 | 100 | 200 |
| Urbanized return periods (years) | 8.06 | 16.12 | 32.24 | 80.61 | 161.22 | 322.44 |
| Precipitation volume (mm) | 45.97 | 53.97 | 62.05 | 72.75 | 80.83 | 88.91 |
© 2020 by the authors. Licensee MDPI, Basel, Switzerland. This article is an open access article distributed under the terms and conditions of the Creative Commons Attribution (CC BY) license (http://creativecommons.org/licenses/by/4.0/).
Share and Cite
Hesarkazzazi, S.; Hajibabaei, M.; Reyes-Silva, J.D.; Krebs, P.; Sitzenfrei, R. Assessing Redundancy in Stormwater Structures Under Hydraulic Design. Water 2020, 12, 1003. https://doi.org/10.3390/w12041003
Hesarkazzazi S, Hajibabaei M, Reyes-Silva JD, Krebs P, Sitzenfrei R. Assessing Redundancy in Stormwater Structures Under Hydraulic Design. Water. 2020; 12(4):1003. https://doi.org/10.3390/w12041003
Chicago/Turabian StyleHesarkazzazi, Sina, Mohsen Hajibabaei, Julian David Reyes-Silva, Peter Krebs, and Robert Sitzenfrei. 2020. "Assessing Redundancy in Stormwater Structures Under Hydraulic Design" Water 12, no. 4: 1003. https://doi.org/10.3390/w12041003