Assessment of Water Security in Socially Excluded Areas in Kolkata, India: An Approach Focusing on Water, Sanitation and Hygiene


Abstract
:1. Introduction
- (1)
- Provide a new understanding of water security in socially excluded areas in Kolkata using ‘Slum Data’ extracted from the 2011 Census of India report.
- (2)
- Show the variation in water security across and within areas defined as slums, by focusing on WaSH and identify the key socio-economic factors affecting urban water security of socially excluded population in Kolkata based on primary data collected in the frame of this study.
2. State of the Art
2.1. Water Security and Human Rights
- Availability, corresponding to sufficient and continuous water supply for personal and domestic uses, including drinking and food preparation, personal hygiene, washing of clothes, cleaning, and other aspects of domestic hygiene, as well as facilities and services for the safe disposal of human excreta (i.e., urine and faeces) [52].
- Accessibility, implying that water and sanitation facilities must be located or constructed in such a way that they are always accessible to everybody. Safe access is particularly important regarding to sanitation both for people with constrained physical movement and particularly women, girls and trans* who may face safety risks [53,54].
- Quality and safety, implying that water quality must be safe for human consumption (i.e., drinking and food preparation) and for personal and domestic hygiene. This means it must be free from microorganisms, chemical substances, and radiological hazards that constitute a threat to a person’s health both short term and over a lifetime of consumption. Sanitation facilities must be safe to use and prevent contact between people and human excreta [52].
- Acceptability, meaning that water and sanitation facilities must meet social or cultural norms from a user’s perspective, i.e., regarding the odor or color of drinking water, or the privacy of sanitation facilities. In most cultures, gender-specific sanitation facilities will be required in public spaces and institutions [54,55].
- Affordability, including that individual and household expenditure on water and sanitation services, as well as associated hygiene, must be affordable for people without forcing them to resort to other, unsafe alternatives or limiting their capacity to acquire other basic goods and services (such as food, housing, or education) guaranteed by other human rights [56,57].
2.2. Water Security in Kolkata’s Deprived Areas
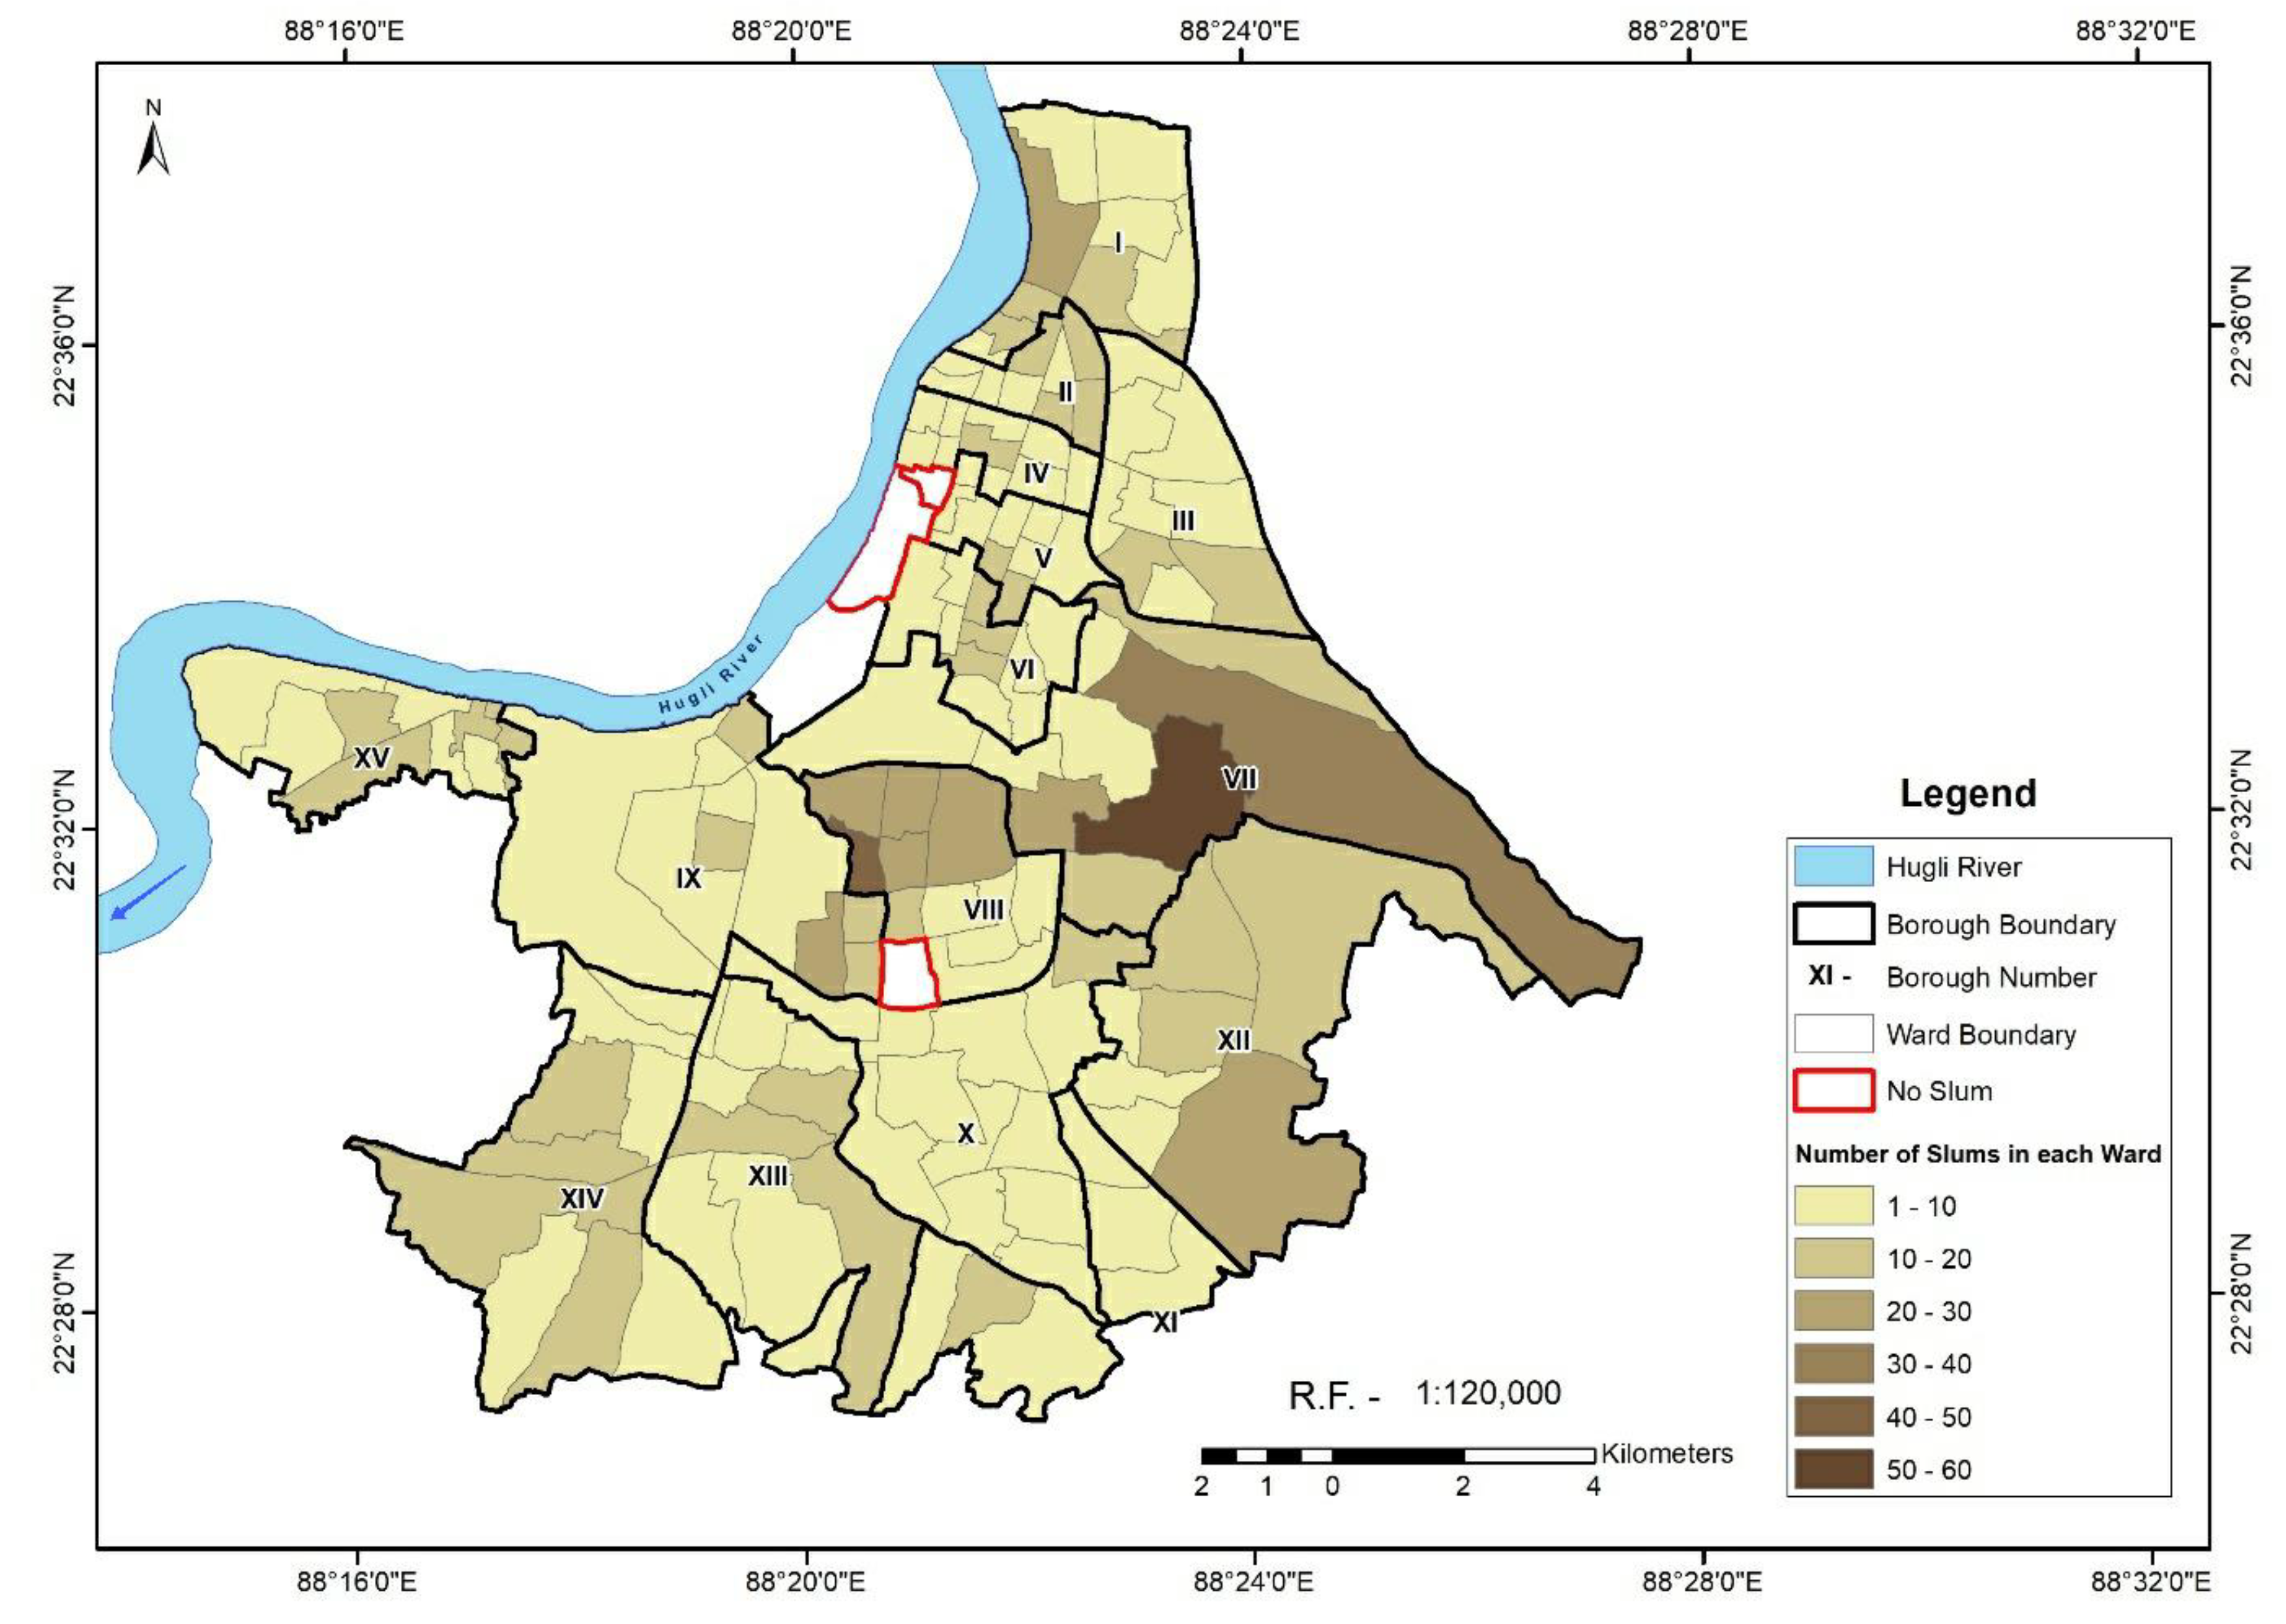
3. Study Area
4. Methods
4.1. Data
4.2. Data Processing
5. Results
5.1. Social Exclusion and WaSH Provisions in Slums
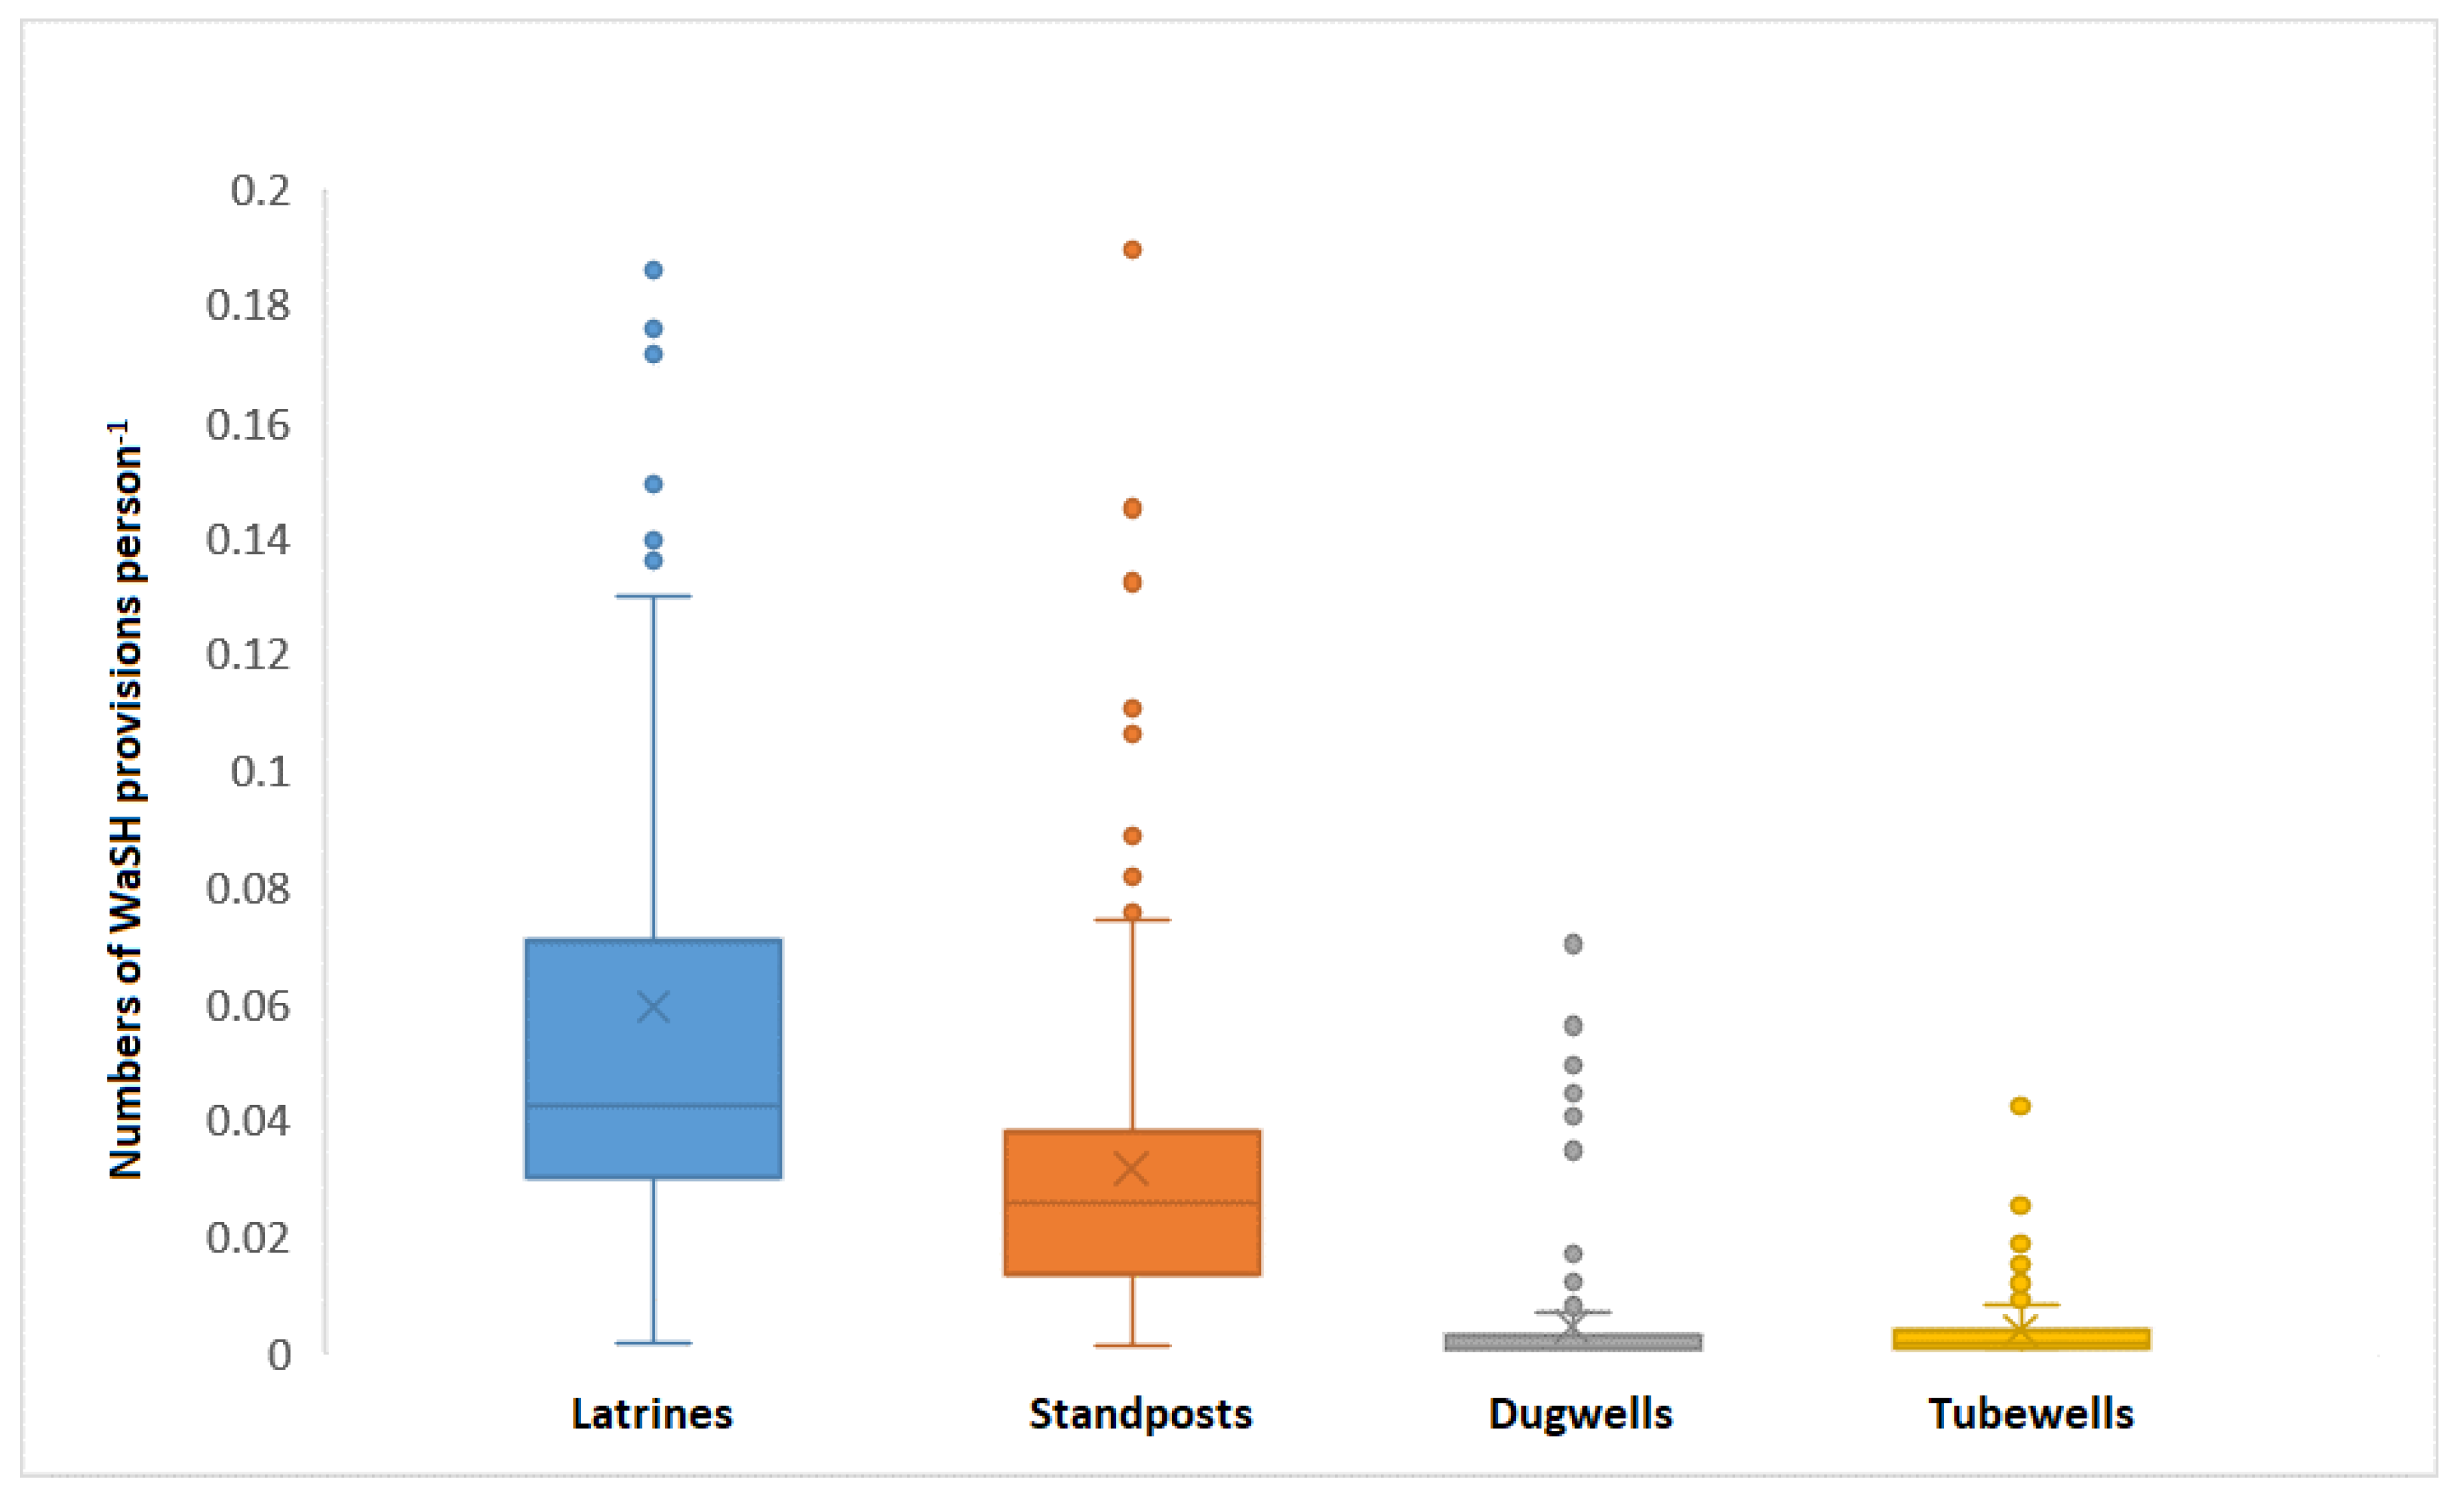
5.2. WaSH Provisions in Slum and Non-Slum Areas of Kolkata City
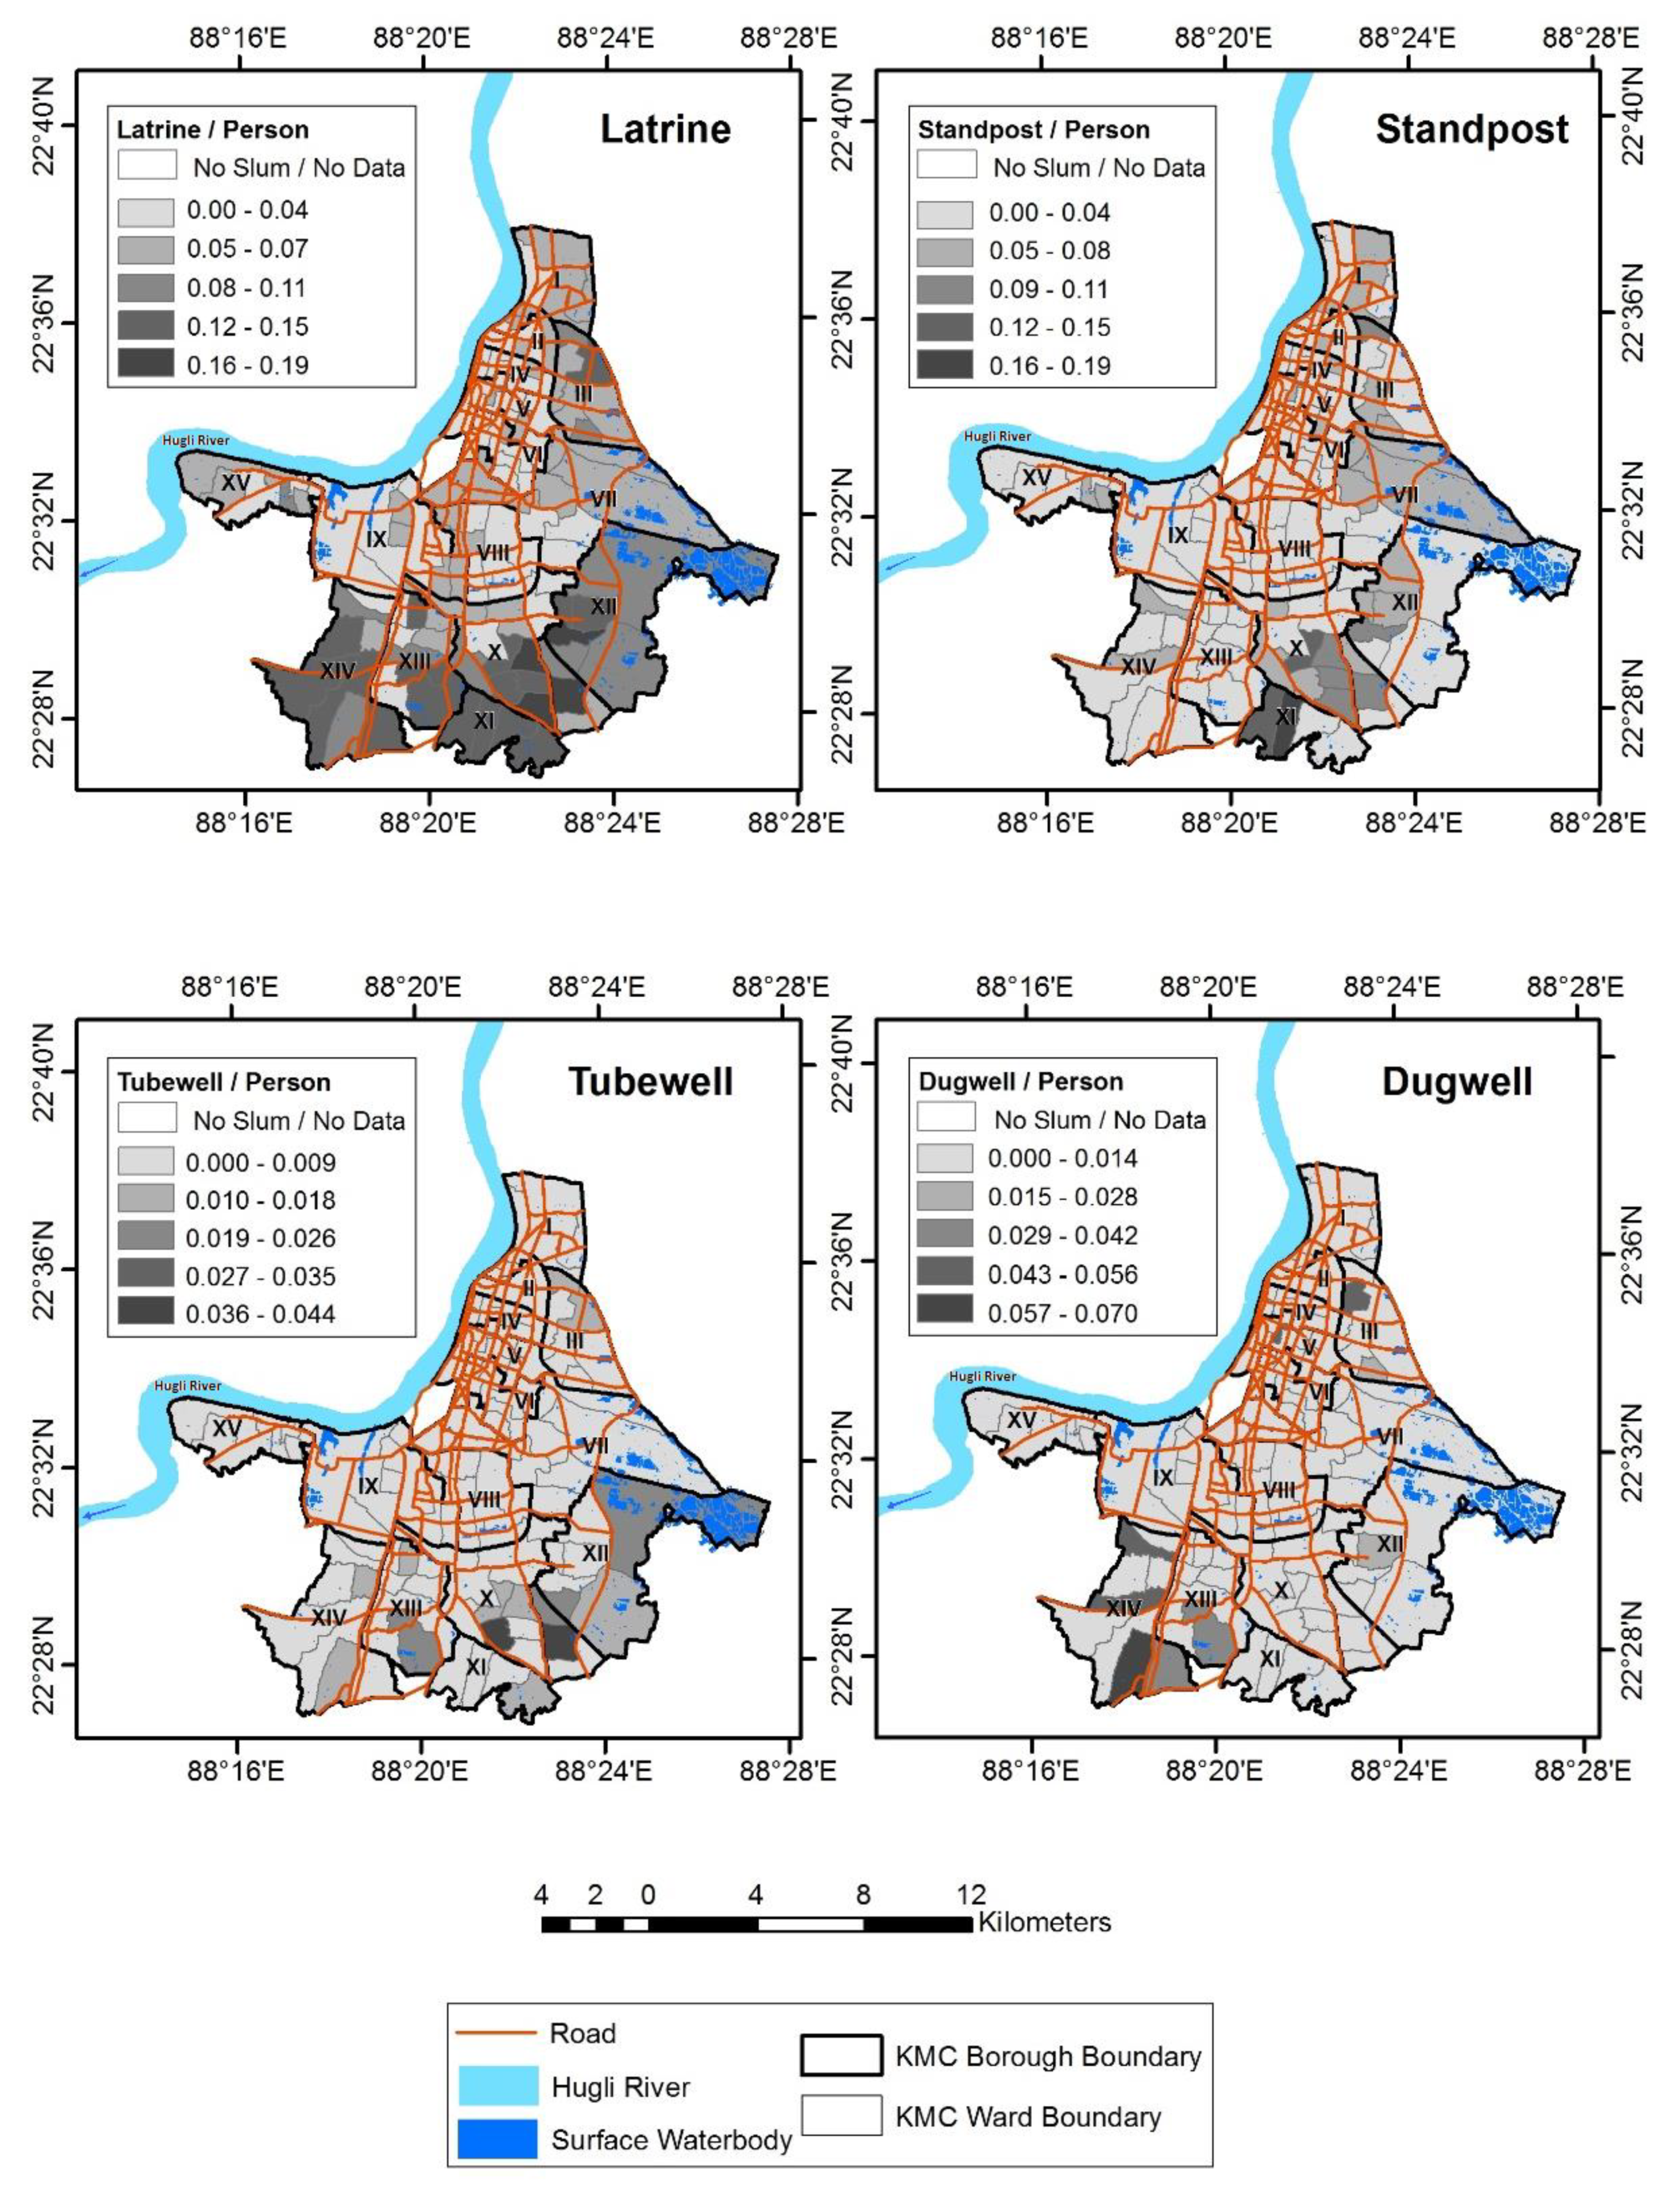
5.2.1. WaSH Provisions in Slums: Ward Wise Variation
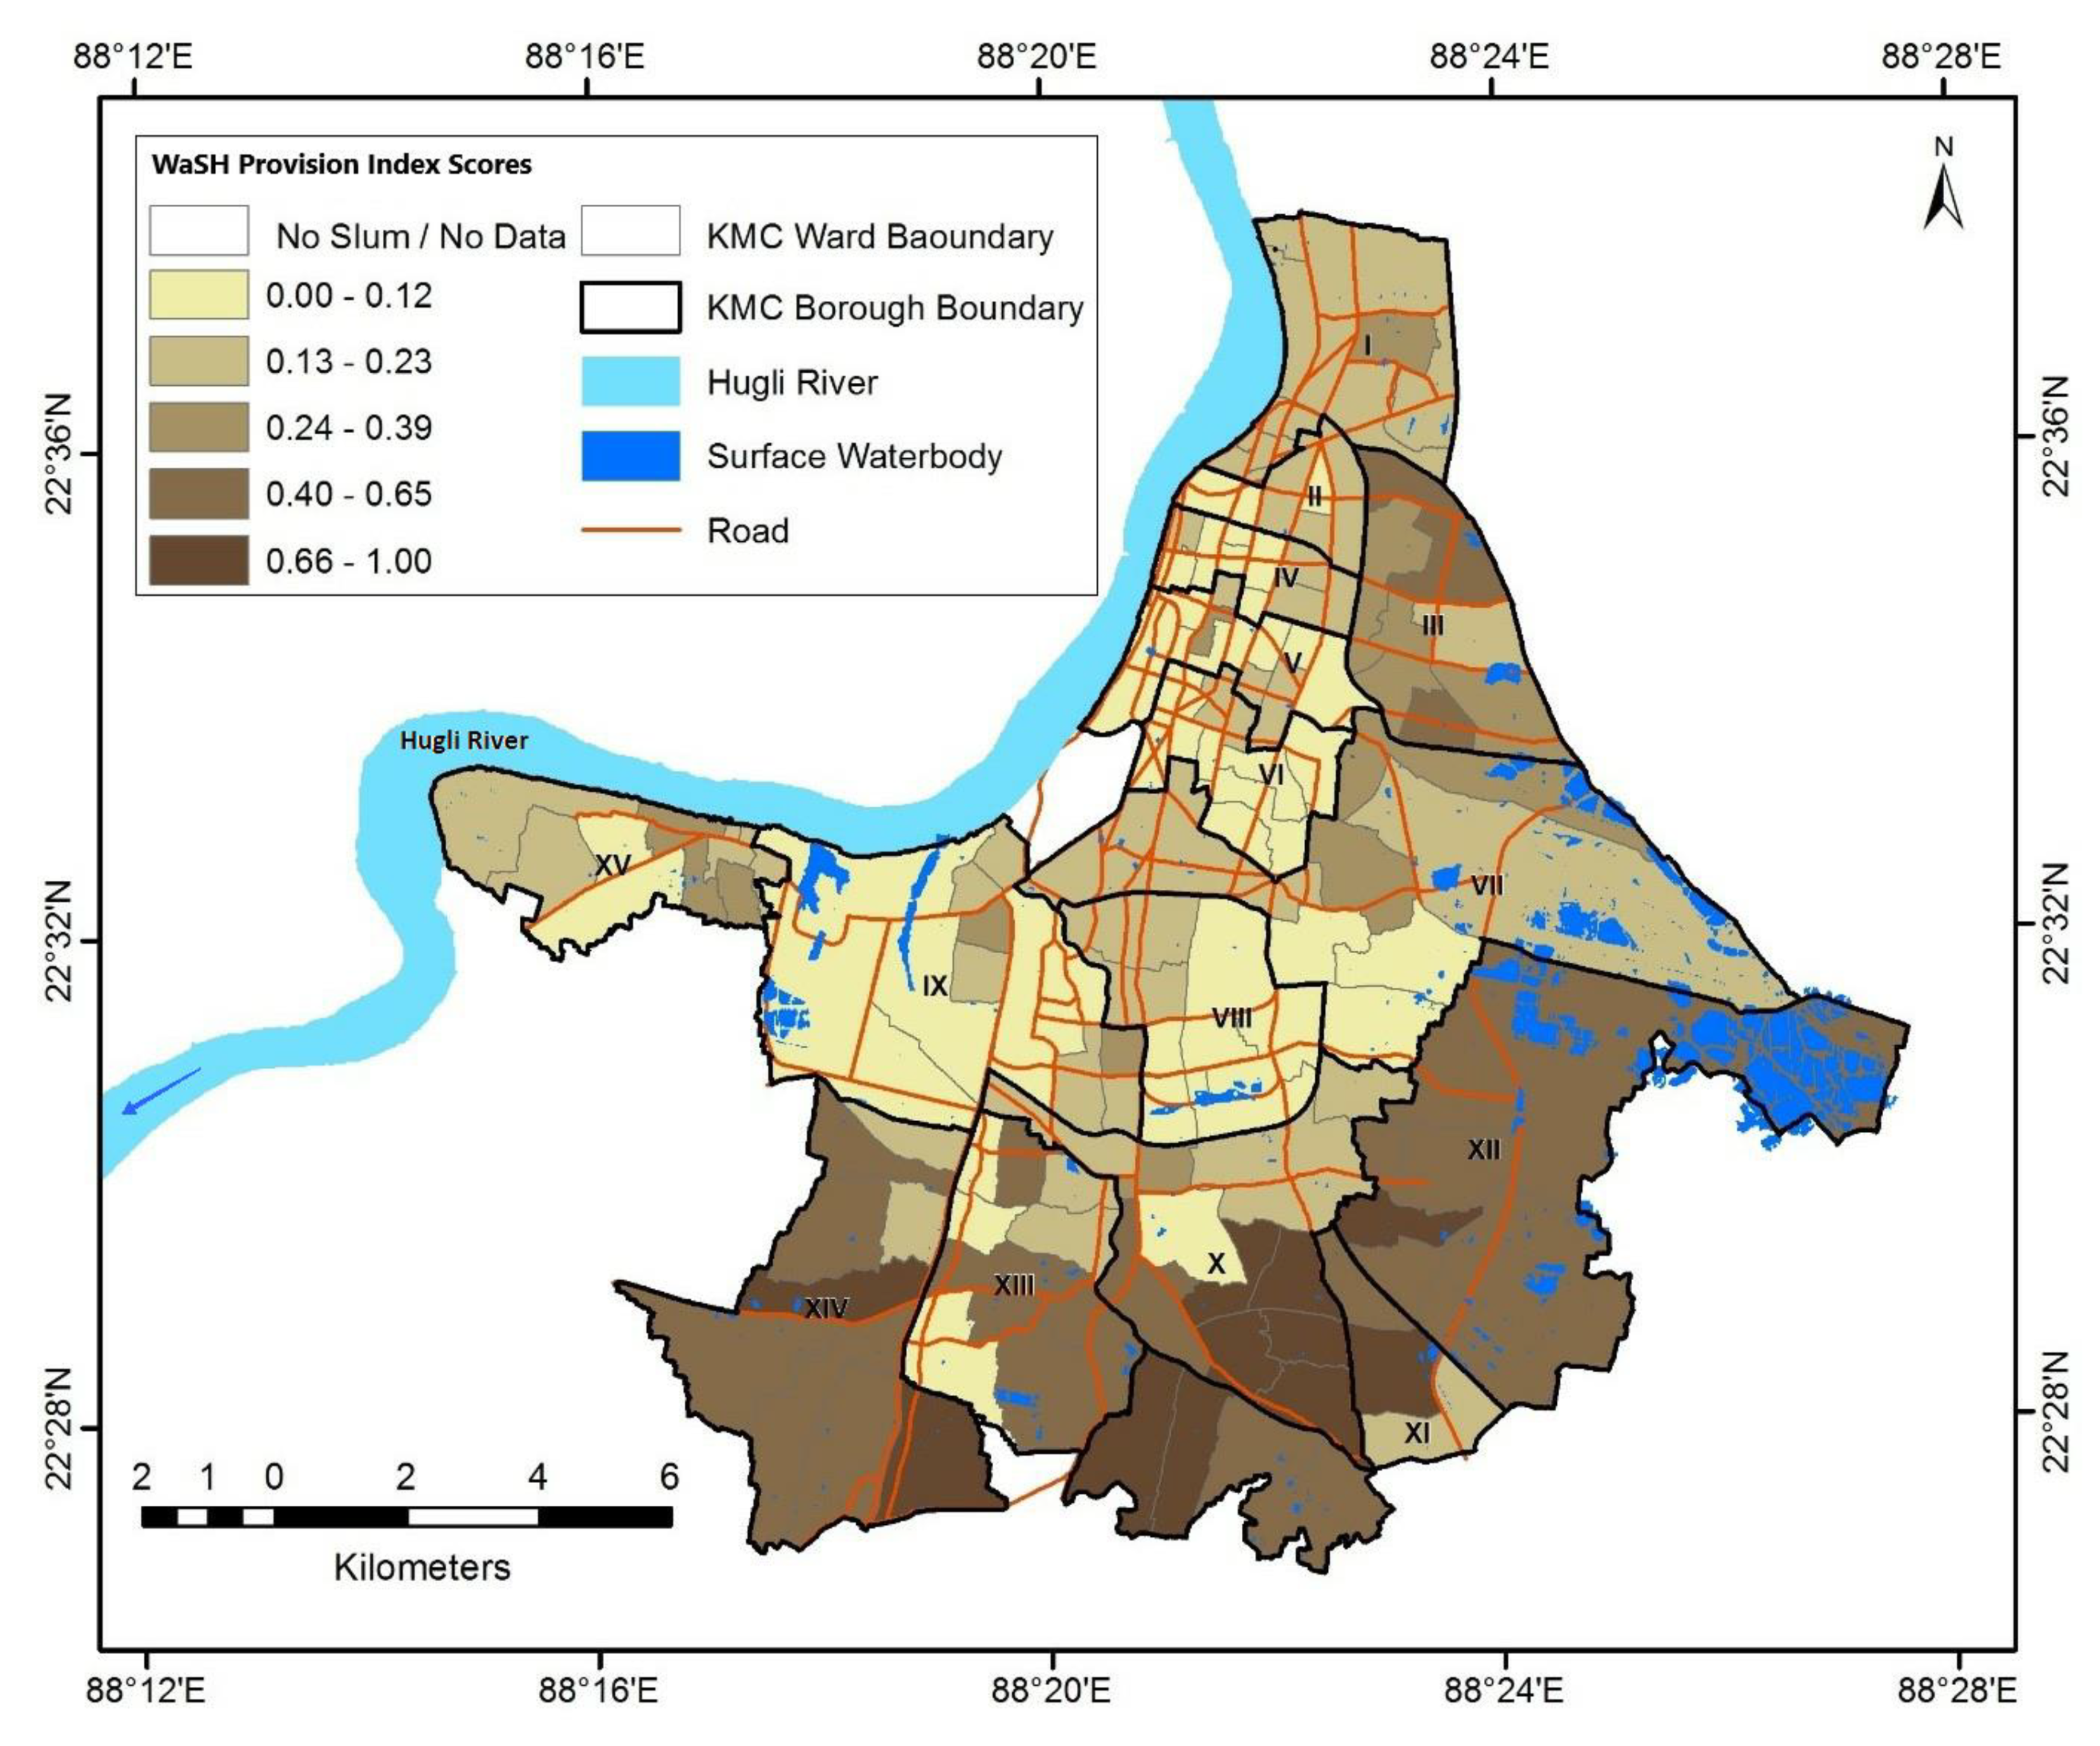
5.2.2. Ward Wise Distribution of WaSH Provision (WP) Index for Slums
6. Discussion
6.1. Variation in Water Security Across and Within Areas Defined as Slums in Kolkata
6.2. Assessing Water Insecurity from an Exclusion Perspective for Socially Excluded Areas in Kolkata
7. Conclusions
Author Contributions
Funding
Acknowledgments
Conflicts of Interest
Appendix A

| Caste | Total | ||||||
|---|---|---|---|---|---|---|---|
| General | SC/ST/OBC | Tribal | NA | ||||
| Source of Water | Direct Piped-water supply by Corporation to the house | Count | 535 | 73 | 0 | 2 | 610 |
| % within Source of Water | 87.7% | 12.0% | 0.0% | 0.3% | 100.0% | ||
| % within Caste | 82.3% | 73.0% | 0.0% | 50.0% | 80.8% | ||
| Standpost outside the houses | Count | 53 | 18 | 0 | 2 | 73 | |
| % within Source of Water | 72.6% | 24.7% | 0.0% | 2.7% | 100.0% | ||
| % within Caste | 8.2% | 18.0% | 0.0% | 50.0% | 9.7% | ||
| Dugwell/Tubewell | Count | 3 | 1 | 0 | 0 | 4 | |
| % within Source of Water | 75.0% | 25.0% | 0.0% | 0.0% | 100.0% | ||
| % within Caste | 0.5% | 1.0% | 0.0% | 0.0% | 0.5% | ||
| Waterbody nearby | Count | 1 | 1 | 0 | 0 | 2 | |
| % within Source of Water | 50.0% | 50.0% | 0.0% | 0.0% | 100.0% | ||
| % within Caste | 0.2% | 1.0% | 0.0% | 0.0% | 0.3% | ||
| Other | Count | 48 | 4 | 1 | 0 | 53 | |
| % within Source of Water | 90.6% | 7.5% | 1.9% | 0.0% | 100.0% | ||
| % within Caste | 7.4% | 4.0% | 100.0% | 0.0% | 7.0% | ||
| NA | Count | 10 | 3 | 0 | 0 | 13 | |
| % within Source of Water | 76.9% | 23.1% | 0.0% | 0.0% | 100.0% | ||
| % within Caste | 1.5% | 3.0% | 0.0% | 0.0% | 1.7% | ||
| Total | Count | 650 | 100 | 1 | 4 | 755 | |
| % within Source of Water | 86.1% | 13.2% | 0.1% | 0.5% | 100.0% | ||
| % within Caste | 100.0% | 100.0% | 100.0% | 100.0% | 100.0% | ||
Appendix B
| Ethnic group (Based on Main Language Spoken) | Total | ||||||
|---|---|---|---|---|---|---|---|
| Bengali | Other Indian | non-Indian | NA | ||||
| Source of Water | Direct Piped-water supply by Corporation to the house | Count | 509 | 97 | 1 | 3 | 610 |
| % within Source of Water | 83.4% | 15.9% | 0.2% | 0.5% | 100.0% | ||
| % within Ethnic group | 83.7% | 68.8% | 50.0% | 75.0% | 80.8% | ||
| Standpost outside the houses | Count | 39 | 33 | 0 | 1 | 73 | |
| % within Source of Water | 53.4% | 45.2% | 0.0% | 1.4% | 100.0% | ||
| % within Ethnic group | 6.4% | 23.4% | 0.0% | 25.0% | 9.7% | ||
| Dugwell/Tubewell | Count | 3 | 0 | 1 | 0 | 4 | |
| % within Source of Water | 75.0% | 0.0% | 25.0% | 0.0% | 100.0% | ||
| % within Ethnic group | 0.5% | 0.0% | 50.0% | 0.0% | 0.5% | ||
| Waterbody nearby | Count | 1 | 1 | 0 | 0 | 2 | |
| % within Source of Water | 50.0% | 50.0% | 0.0% | 0.0% | 100.0% | ||
| % within Ethnic group | 0.2% | 0.7% | 0.0% | 0.0% | 0.3% | ||
| Other | Count | 46 | 7 | 0 | 0 | 53 | |
| % within Source of Water | 86.8% | 13.2% | 0.0% | 0.0% | 100.0% | ||
| % within Ethnic group | 7.6% | 5.0% | 0.0% | 0.0% | 7.0% | ||
| NA | Count | 10 | 3 | 0 | 0 | 13 | |
| % within Source of Water | 76.9% | 23.1% | 0.0% | 0.0% | 100.0% | ||
| % within Ethnic group | 1.6% | 2.1% | 0.0% | 0.0% | 1.7% | ||
| Total | Count | 608 | 141 | 2 | 4 | 755 | |
| % within Source of Water | 80.5% | 18.7% | 0.3% | 0.5% | 100.0% | ||
| % within Ethnic group | 100.0% | 100.0% | 100.0% | 100.0% | 100.0% | ||
Appendix C
| Religion | Total | ||||||
|---|---|---|---|---|---|---|---|
| Hindu | Muslim | Other | NA | ||||
| Source of Water | Direct Piped-water supply by Corporation to the house | Count | 528 | 56 | 23 | 3 | 610 |
| % within Source of Water | 86.6% | 9.2% | 3.8% | 0.5% | 100.0% | ||
| % within Religion | 82.4% | 70.0% | 79.3% | 60.0% | 80.8% | ||
| Standpost outside the houses | Count | 60 | 7 | 5 | 1 | 73 | |
| % within Source of Water | 82.2% | 9.6% | 6.8% | 1.4% | 100.0% | ||
| % within Religion | 9.4% | 8.8% | 17.2% | 20.0% | 9.7% | ||
| Dugwell/Tubewell | Count | 3 | 0 | 0 | 1 | 4 | |
| % within Source of Water | 75.0% | 0.0% | 0.0% | 25.0% | 100.0% | ||
| % within Religion | 0.5% | 0.0% | 0.0% | 20.0% | 0.5% | ||
| Waterbody nearby | Count | 1 | 1 | 0 | 0 | 2 | |
| % within Source of Water | 50.0% | 50.0% | 0.0% | 0.0% | 100.0% | ||
| % within Religion | 0.2% | 1.3% | 0.0% | 0.0% | 0.3% | ||
| Other | Count | 40 | 12 | 1 | 0 | 53 | |
| % within Source of Water | 75.5% | 22.6% | 1.9% | 0.0% | 100.0% | ||
| % within Religion | 6.2% | 15.0% | 3.4% | 0.0% | 7.0% | ||
| NA | Count | 9 | 4 | 0 | 0 | 13 | |
| % within Source of Water | 69.2% | 30.8% | 0.0% | 0.0% | 100.0% | ||
| % within Religion | 1.4% | 5.0% | 0.0% | 0.0% | 1.7% | ||
| Total | Count | 641 | 80 | 29 | 5 | 755 | |
| % within Source of Water | 84.9% | 10.6% | 3.8% | 0.7% | 100.0% | ||
| % within Religion | 100.0% | 100.0% | 100.0% | 100.0% | 100.0% | ||
Appendix D
| Gender of the Respondent | Total | ||||||||||
|---|---|---|---|---|---|---|---|---|---|---|---|
| Female | Male | Trans | Intersex | Other | 5 | 7 | NA | ||||
| Source of Water | Direct Piped-water supply by Corporation to the house | Count | 153 | 212 | 103 | 70 | 35 | 1 | 1 | 32 | 607 |
| % within Source of Water | 25.2% | 34.9% | 17.0% | 11.5% | 5.8% | 0.2% | 0.2% | 5.3% | 100.0% | ||
| % within Gender of the respondent | 74.3% | 79.4% | 85.1% | 87.5% | 94.6% | 100.0% | 100.0% | 82.1% | 80.7% | ||
| Standpost outside the houses | Count | 20 | 31 | 13 | 6 | 0 | 0 | 0 | 3 | 73 | |
| % within Source of Water | 27.4% | 42.5% | 17.8% | 8.2% | 0.0% | 0.0% | 0.0% | 4.1% | 100.0% | ||
| % within Gender of the respondent | 9.7% | 11.6% | 10.7% | 7.5% | 0.0% | 0.0% | 0.0% | 7.7% | 9.7% | ||
| Dugwell/Tubewell | Count | 0 | 2 | 1 | 1 | 0 | 0 | 0 | 0 | 4 | |
| % within Source of Water | 0.0% | 50.0% | 25.0% | 25.0% | 0.0% | 0.0% | 0.0% | 0.0% | 100.0% | ||
| % within Gender of the respondent | 0.0% | 0.7% | 0.8% | 1.3% | 0.0% | 0.0% | 0.0% | 0.0% | 0.5% | ||
| Waterbody nearby | Count | 0 | 0 | 2 | 0 | 0 | 0 | 0 | 0 | 2 | |
| % within Source of Water | 0.0% | 0.0% | 100.0% | 0.0% | 0.0% | 0.0% | 0.0% | 0.0% | 100.0% | ||
| % within Gender of the respondent | 0.0% | 0.0% | 1.7% | 0.0% | 0.0% | 0.0% | 0.0% | 0.0% | 0.3% | ||
| Other | Count | 26 | 20 | 1 | 1 | 2 | 0 | 0 | 3 | 53 | |
| % within Source of Water | 49.1% | 37.7% | 1.9% | 1.9% | 3.8% | 0.0% | 0.0% | 5.7% | 100.0% | ||
| % within Gender of the respondent | 12.6% | 7.5% | 0.8% | 1.3% | 5.4% | 0.0% | 0.0% | 7.7% | 7.0% | ||
| NA | Count | 7 | 2 | 1 | 2 | 0 | 0 | 0 | 1 | 13 | |
| % within Source of Water | 53.8% | 15.4% | 7.7% | 15.4% | 0.0% | 0.0% | 0.0% | 7.7% | 100.0% | ||
| % within Gender of the respondent | 3.4% | 0.7% | 0.8% | 2.5% | 0.0% | 0.0% | 0.0% | 2.6% | 1.7% | ||
| Total | Count | 206 | 267 | 121 | 80 | 37 | 1 | 1 | 39 | 752 | |
| % within Source of Water | 27.4% | 35.5% | 16.1% | 10.6% | 4.9% | 0.1% | 0.1% | 5.2% | 100.0% | ||
| % within Gender of the respondent | 100.0% | 100.0% | 100.0% | 100.0% | 100.0% | 100.0% | 100.0% | 100.0% | 100.0% | ||
Appendix E
| Highest Level of Education | Total | ||||||||
|---|---|---|---|---|---|---|---|---|---|
| Primary Education | Secondary Education | College | Postgrad | 8th | 666 | ||||
| Source of Water | Direct Piped-water supply by Corporation to the house | Count | 115 | 212 | 212 | 61 | 1 | 8 | 609 |
| % within Source of Water | 18.9% | 34.8% | 34.8% | 10.0% | 0.2% | 1.3% | 100.0% | ||
| % within highest level of education | 72.3% | 87.6% | 80.6% | 83.6% | 33.3% | 57.1% | 80.8% | ||
| Standpost outside the houses | Count | 34 | 16 | 15 | 3 | 0 | 5 | 73 | |
| % within Source of Water | 46.6% | 21.9% | 20.5% | 4.1% | 0.0% | 6.8% | 100.0% | ||
| % within highest level of education | 21.4% | 6.6% | 5.7% | 4.1% | 0.0% | 35.7% | 9.7% | ||
| Dugwell/Tubewell | Count | 0 | 2 | 0 | 1 | 1 | 0 | 4 | |
| % within Source of Water | 0.0% | 50.0% | 0.0% | 25.0% | 25.0% | 0.0% | 100.0% | ||
| % within highest level of education | 0.0% | 0.8% | 0.0% | 1.4% | 33.3% | 0.0% | 0.5% | ||
| Waterbody nearby | Count | 0 | 0 | 0 | 2 | 0 | 0 | 2 | |
| % within Source of Water | 0.0% | 0.0% | 0.0% | 100.0% | 0.0% | 0.0% | 100.0% | ||
| % within highest level of education | 0.0% | 0.0% | 0.0% | 2.7% | 0.0% | 0.0% | 0.3% | ||
| Other | Count | 7 | 9 | 31 | 4 | 1 | 1 | 53 | |
| % within Source of Water | 13.2% | 17.0% | 58.5% | 7.5% | 1.9% | 1.9% | 100.0% | ||
| % within highest level of education | 4.4% | 3.7% | 11.8% | 5.5% | 33.3% | 7.1% | 7.0% | ||
| NA | Count | 3 | 3 | 5 | 2 | 0 | 0 | 13 | |
| % within Source of Water | 23.1% | 23.1% | 38.5% | 15.4% | 0.0% | 0.0% | 100.0% | ||
| % within highest level of education | 1.9% | 1.2% | 1.9% | 2.7% | 0.0% | 0.0% | 1.7% | ||
| Total | Count | 159 | 242 | 263 | 73 | 3 | 14 | 754 | |
| % within Source of Water | 21.1% | 32.1% | 34.9% | 9.7% | 0.4% | 1.9% | 100.0% | ||
| % within highest level of education | 100.0% | 100.0% | 100.0% | 100.0% | 100.0% | 100.0% | 100.0% | ||
Appendix F
| Occupation | Total | ||||||||||||||||
|---|---|---|---|---|---|---|---|---|---|---|---|---|---|---|---|---|---|
| Job—Undefined | Job Organised | Job Unorganised | Business—Undefined | Business Organised | Business Unorganised | StudentUndefined | School | College | University | Household | Household | Other | NA | ||||
| Source of Water | Direct Piped-water supply by Corporation to the house | Count | 8 | 127 | 11 | 2 | 108 | 14 | 1 | 21 | 41 | 11 | 228 | 1 | 25 | 11 | 609 |
| % within Source of Water | 1.3% | 20.9% | 1.8% | 0.3% | 17.7% | 2.3% | 0.2% | 3.4% | 6.7% | 1.8% | 37.4% | 0.2% | 4.1% | 1.8% | 100.0% | ||
| % within Occupation | 80.0% | 83.0% | 84.6% | 100.0% | 80.0% | 53.8% | 100.0% | 100.0% | 85.4% | 73.3% | 82.3% | 100.0% | 83.3% | 50.0% | 80.8% | ||
| Standpost outside the houses | Count | 0 | 8 | 2 | 0 | 9 | 11 | 0 | 0 | 2 | 2 | 28 | 0 | 2 | 9 | 73 | |
| % within Source of Water | 0.0% | 11.0% | 2.7% | 0.0% | 12.3% | 15.1% | 0.0% | 0.0% | 2.7% | 2.7% | 38.4% | 0.0% | 2.7% | 12.3% | 100.0% | ||
| % within Occupation | 0.0% | 5.2% | 15.4% | 0.0% | 6.7% | 42.3% | 0.0% | 0.0% | 4.2% | 13.3% | 10.1% | 0.0% | 6.7% | 40.9% | 9.7% | ||
| Dugwell/Tubewell | Count | 0 | 0 | 0 | 0 | 2 | 0 | 0 | 0 | 0 | 0 | 0 | 0 | 1 | 1 | 4 | |
| % within Source of Water | 0.0% | 0.0% | 0.0% | 0.0% | 50.0% | 0.0% | 0.0% | 0.0% | 0.0% | 0.0% | 0.0% | 0.0% | 25.0% | 25.0% | 100.0% | ||
| % within Occupation | 0.0% | 0.0% | 0.0% | 0.0% | 1.5% | 0.0% | 0.0% | 0.0% | 0.0% | 0.0% | 0.0% | 0.0% | 3.3% | 4.5% | 0.5% | ||
| Waterbody nearby | Count | 0 | 1 | 0 | 0 | 0 | 0 | 0 | 0 | 0 | 0 | 0 | 0 | 0 | 1 | 2 | |
| % within Source of Water | 0.0% | 50.0% | 0.0% | 0.0% | 0.0% | 0.0% | 0.0% | 0.0% | 0.0% | 0.0% | 0.0% | 0.0% | 0.0% | 50.0% | 100.0% | ||
| % within Occupation | 0.0% | 0.7% | 0.0% | 0.0% | 0.0% | 0.0% | 0.0% | 0.0% | 0.0% | 0.0% | 0.0% | 0.0% | 0.0% | 4.5% | 0.3% | ||
| Other | Count | 1 | 13 | 0 | 0 | 14 | 1 | 0 | 0 | 5 | 2 | 15 | 0 | 2 | 0 | 53 | |
| % within Source of Water | 1.9% | 24.5% | 0.0% | 0.0% | 26.4% | 1.9% | 0.0% | 0.0% | 9.4% | 3.8% | 28.3% | 0.0% | 3.8% | 0.0% | 100.0% | ||
| % within Occupation | 10.0% | 8.5% | 0.0% | 0.0% | 10.4% | 3.8% | 0.0% | 0.0% | 10.4% | 13.3% | 5.4% | 0.0% | 6.7% | 0.0% | 7.0% | ||
| NA | Count | 1 | 4 | 0 | 0 | 2 | 0 | 0 | 0 | 0 | 0 | 6 | 0 | 0 | 0 | 13 | |
| % within Source of Water | 7.7% | 30.8% | 0.0% | 0.0% | 15.4% | 0.0% | 0.0% | 0.0% | 0.0% | 0.0% | 46.2% | 0.0% | 0.0% | 0.0% | 100.0% | ||
| % within Occupation | 10.0% | 2.6% | 0.0% | 0.0% | 1.5% | 0.0% | 0.0% | 0.0% | 0.0% | 0.0% | 2.2% | 0.0% | 0.0% | 0.0% | 1.7% | ||
| Total | Count | 10 | 153 | 13 | 2 | 135 | 26 | 1 | 21 | 48 | 15 | 277 | 1 | 30 | 22 | 754 | |
| % within Source of Water | 1.3% | 20.3% | 1.7% | 0.3% | 17.9% | 3.4% | 0.1% | 2.8% | 6.4% | 2.0% | 36.7% | 0.1% | 4.0% | 2.9% | 100.0% | ||
| % within Occupation | 100.0% | 100.0% | 100.0% | 100.0% | 100.0% | 100.0% | 100.0% | 100.0% | 100.0% | 100.0% | 100.0% | 100.0% | 100.0% | 100.0% | 100.0% | ||
Appendix G
| Caste | Total | ||||||
|---|---|---|---|---|---|---|---|
| General | SC/ST/OBC | Tribal | 666 | ||||
| Presence of toilet in the house (Y/N) | Yes | Count | 455 | 72 | 0 | 2 | 529 |
| % within Presence of toilet in the house (Y/N) | 86.0% | 13.6% | 0.0% | 0.4% | 100.0% | ||
| % within Caste | 70.0% | 71.3% | 0.0% | 50.0% | 70.0% | ||
| No | Count | 136 | 20 | 0 | 0 | 156 | |
| % within Presence of toilet in the house (Y/N) | 87.2% | 12.8% | 0.0% | 0.0% | 100.0% | ||
| % within Caste | 20.9% | 19.8% | 0.0% | 0.0% | 20.6% | ||
| NA | Count | 59 | 9 | 1 | 2 | 71 | |
| % within Presence of toilet in the house (Y/N) | 83.1% | 12.7% | 1.4% | 2.8% | 100.0% | ||
| % within Caste | 9.1% | 8.9% | 100.0% | 50.0% | 9.4% | ||
| Total | Count | 650 | 101 | 1 | 4 | 756 | |
| % within Presence of toilet in the house (Y/N) | 86.0% | 13.4% | 0.1% | 0.5% | 100.0% | ||
| % within Caste | 100.0% | 100.0% | 100.0% | 100.0% | 100.0% | ||
Appendix H
| Ethnic Group (Based on Main Language Spoken) | Total | ||||||
|---|---|---|---|---|---|---|---|
| Bengali | Other Indian | Non-Indian | NA | ||||
| Presence of toilet in the house (Y/N) | Yes | Count | 438 | 90 | 0 | 1 | 529 |
| % within Presence of toilet in the house (Y/N) | 82.8% | 17.0% | 0.0% | 0.2% | 100.0% | ||
| % within Ethnic group | 71.9% | 63.8% | 0.0% | 25.0% | 70.0% | ||
| No | Count | 116 | 38 | 1 | 1 | 156 | |
| % within Presence of toilet in the house (Y/N) | 74.4% | 24.4% | 0.6% | 0.6% | 100.0% | ||
| % within Ethnic group | 19.0% | 27.0% | 50.0% | 25.0% | 20.6% | ||
| NA | Count | 55 | 13 | 1 | 2 | 71 | |
| % within Presence of toilet in the house (Y/N) | 77.5% | 18.3% | 1.4% | 2.8% | 100.0% | ||
| % within Ethnic group | 9.0% | 9.2% | 50.0% | 50.0% | 9.4% | ||
| Total | Count | 609 | 141 | 2 | 4 | 756 | |
| % within Presence of toilet in the house (Y/N) | 80.6% | 18.7% | 0.3% | 0.5% | 100.0% | ||
| % within Ethnic group | 100.0% | 100.0% | 100.0% | 100.0% | 100.0% | ||
Appendix I
| Religion | Total | ||||||
|---|---|---|---|---|---|---|---|
| Hindu | Muslim | Other | NA | ||||
| Presence of toilet in the house (Y/N) | Yes | Count | 456 | 57 | 14 | 2 | 529 |
| % within Presence of toilet in the house (Y/N) | 86.2% | 10.8% | 2.6% | 0.4% | 100.0% | ||
| % within Religion | 71.1% | 70.4% | 48.3% | 40.0% | 70.0% | ||
| No | Count | 131 | 12 | 13 | 0 | 156 | |
| % within Presence of toilet in the house (Y/N) | 84.0% | 7.7% | 8.3% | 0.0% | 100.0% | ||
| % within Religion | 20.4% | 14.8% | 44.8% | 0.0% | 20.6% | ||
| NA | Count | 54 | 12 | 2 | 3 | 71 | |
| % within Presence of toilet in the house (Y/N) | 76.1% | 16.9% | 2.8% | 4.2% | 100.0% | ||
| % within Religion | 8.4% | 14.8% | 6.9% | 60.0% | 9.4% | ||
| Total | Count | 641 | 81 | 29 | 5 | 756 | |
| % within Presence of toilet in the house (Y/N) | 84.8% | 10.7% | 3.8% | 0.7% | 100.0% | ||
| % within Religion | 100.0% | 100.0% | 100.0% | 100.0% | 100.0% | ||
Appendix J
| Gender of the Respondent | Total | ||||||||||
|---|---|---|---|---|---|---|---|---|---|---|---|
| Female | Male | Trans | Intersex | Other | 5 | 7 | NA | ||||
| Presence of toilet in the house (Y/N) | Yes | Count | 135 | 178 | 84 | 69 | 34 | 1 | 0 | 27 | 528 |
| % within Presence of toilet in the house (Y/N) | 25.6% | 33.7% | 15.9% | 13.1% | 6.4% | 0.2% | 0.0% | 5.1% | 100.0% | ||
| % within Gender of the respondent | 65.5% | 66.4% | 69.4% | 86.3% | 91.9% | 100.0% | 0.0% | 69.2% | 70.1% | ||
| No | Count | 41 | 68 | 34 | 5 | 3 | 0 | 1 | 3 | 155 | |
| % within Presence of toilet in the house (Y/N) | 26.5% | 43.9% | 21.9% | 3.2% | 1.9% | 0.0% | 0.6% | 1.9% | 100.0% | ||
| % within Gender of the respondent | 19.9% | 25.4% | 28.1% | 6.3% | 8.1% | 0.0% | 100.0% | 7.7% | 20.6% | ||
| NA | Count | 30 | 22 | 3 | 6 | 0 | 0 | 0 | 9 | 70 | |
| % within Presence of toilet in the house (Y/N) | 42.9% | 31.4% | 4.3% | 8.6% | 0.0% | 0.0% | 0.0% | 12.9% | 100.0% | ||
| % within Gender of the respondent | 14.6% | 8.2% | 2.5% | 7.5% | 0.0% | 0.0% | 0.0% | 23.1% | 9.3% | ||
| Total | Count | 206 | 268 | 121 | 80 | 37 | 1 | 1 | 39 | 753 | |
| % within Presence of toilet in the house (Y/N) | 27.4% | 35.6% | 16.1% | 10.6% | 4.9% | 0.1% | 0.1% | 5.2% | 100.0% | ||
| % within Gender of the respondent | 100.0% | 100.0% | 100.0% | 100.0% | 100.0% | 100.0% | 100.0% | 100.0% | 100.0% | ||
Appendix K
| Occupation | Total | ||||||||||||||||
|---|---|---|---|---|---|---|---|---|---|---|---|---|---|---|---|---|---|
| Job—Undefined | Job Organised | Job Unorganised | Business—Undefined | Business Organised | Business Unorganised | Student—Undefined | School | College | University | Household | Household | Other | NA | ||||
| Presence of toilet in the house (Y/N) | Yes | Count | 7 | 122 | 4 | 0 | 106 | 14 | 1 | 15 | 41 | 11 | 174 | 1 | 22 | 11 | 529 |
| % within Presence of toilet in the house (Y/N) | 1.3% | 23.1% | 0.8% | 0.0% | 20.0% | 2.6% | 0.2% | 2.8% | 7.8% | 2.1% | 32.9% | 0.2% | 4.2% | 2.1% | 100.0% | ||
| % within Occupation | 70.0% | 79.7% | 30.8% | 0.0% | 77.9% | 53.8% | 100.0% | 71.4% | 85.4% | 73.3% | 62.8% | 100.0% | 73.3% | 50.0% | 70.1% | ||
| No | Count | 1 | 20 | 9 | 2 | 20 | 10 | 0 | 3 | 3 | 2 | 74 | 0 | 7 | 4 | 155 | |
| % within Presence of toilet in the house (Y/N) | 0.6% | 12.9% | 5.8% | 1.3% | 12.9% | 6.5% | 0.0% | 1.9% | 1.9% | 1.3% | 47.7% | 0.0% | 4.5% | 2.6% | 100.0% | ||
| % within Occupation | 10.0% | 13.1% | 69.2% | 100.0% | 14.7% | 38.5% | 0.0% | 14.3% | 6.3% | 13.3% | 26.7% | 0.0% | 23.3% | 18.2% | 20.5% | ||
| NA | Count | 2 | 11 | 0 | 0 | 10 | 2 | 0 | 3 | 4 | 2 | 29 | 0 | 1 | 7 | 71 | |
| % within Presence of toilet in the house (Y/N) | 2.8% | 15.5% | 0.0% | 0.0% | 14.1% | 2.8% | 0.0% | 4.2% | 5.6% | 2.8% | 40.8% | 0.0% | 1.4% | 9.9% | 100.0% | ||
| % within Occupation | 20.0% | 7.2% | 0.0% | 0.0% | 7.4% | 7.7% | 0.0% | 14.3% | 8.3% | 13.3% | 10.5% | 0.0% | 3.3% | 31.8% | 9.4% | ||
| Total | Count | 10 | 153 | 13 | 2 | 136 | 26 | 1 | 21 | 48 | 15 | 277 | 1 | 30 | 22 | 755 | |
| % within Presence of toilet in the house (Y/N) | 1.3% | 20.3% | 1.7% | 0.3% | 18.0% | 3.4% | 0.1% | 2.8% | 6.4% | 2.0% | 36.7% | 0.1% | 4.0% | 2.9% | 100.0% | ||
| % within Occupation | 100.0% | 100.0% | 100.0% | 100.0% | 100.0% | 100.0% | 100.0% | 100.0% | 100.0% | 100.0% | 100.0% | 100.0% | 100.0% | 100.0% | 100.0% | ||
References
- Massey, D.; Allen, J.; Pile, S. (Eds.) City Worlds; Routledge: London, UK; New York, NY, USA, 1999. [Google Scholar]
- Ilesanmi, A.O. Urban sustainability in the context of Lagos mega-city. J. Geogr. Reg. Plan. 2010, 3, 240–252. [Google Scholar]
- Wetlands International. WaSH and Water Security. Integration and the Role of Civil Society; Wetlands International: Wageningen, The Netherlands, 2017. [Google Scholar]
- Niemczynowicz, J. Megacities from a Water Perspective. Water Int. 1996, 21, 198–205. [Google Scholar] [CrossRef]
- United Nations. The Millennium Development Goals Report 2012; United Nations: New York, NY, USA, 2012. [Google Scholar]
- Mukherjee, S.; Bebermeier, W.; Schütt, B. An Overview of the Impacts of Land Use Land Cover Changes (1980–2014) on Urban Water Security of Kolkata. Land 2018, 7, 91. [Google Scholar] [CrossRef] [Green Version]
- Sommer, M.; Ferron, S.; Cavill, S.; House, S. Violence, gender and WaSH: Spurring action on a complex, under-documented and sensitive topic. Environ. Urban 2015, 27, 105–116. [Google Scholar] [CrossRef]
- Brears, R.C. Urban Water Security; John Wiley & Sons: Hoboken, NJ, USA, 2017. [Google Scholar]
- Falkenmark, M.; Widstrand, C. Population and Water Resources: A Delicate Balance; Population Reference Bureau: Washington, DC, USA, 1992. [Google Scholar]
- Ravell, J. Population Growth, Urbanisation and Water Security: A Case Study of Greater Brisbane; Water Supply & Urbanization: Brisbane, Australia, 2014; Available online: https://www.academia.edu/7132376/Population_growth_urbanisation_and_water_security_A_case_study_of_Greater_Brisbane (accessed on 6 May 2019).
- Bakker, K.; Morinville, C. The governance dimensions of water security: A review. Philos. Trans. R. Soc. A 2013, 371, 20130116. [Google Scholar] [CrossRef]
- Biggs, E.M.; Duncan, J.M.A.; Atkinson, P.M.; Dash, J. Plenty of water, not enough strategy: How inadequate accessibility, poor governance and a volatile government can tip the balance against ensuring water security: The case of Nepal. Environ. Sci. Policy 2013, 33, 388–394. [Google Scholar] [CrossRef]
- Cook, C.; Bakker, K. Water security: Debating an emerging paradigm. Glob. Environ. Chang. 2012, 22, 94–102. [Google Scholar] [CrossRef]
- Piesse, M. Water Security in Urban India: Water Supply and Human Health; Future Directions International: Dalkeith, Australia, 2015; Available online: http://futuredirections.org.au/wp-content/uploads/2015/09/Water_Security_in_Urban_India_Water_Supply_and_Human_Health.pdf (accessed on 7 March 2018).
- Blanca, F.M. Water security in an urbanized world: An equity perspective. Habitat Int. 2017. [Google Scholar] [CrossRef]
- Goff, M.; Crow, B. What is water equity? The unfortunate consequences of a global focus on ‘drinking water’. Water Int. 2014, 39, 159–171. [Google Scholar] [CrossRef]
- Jepson, W.; Budds, J.; Eichelberger, L.; Harris, L.; Norman, E.; O’Reilly, K.; Pearson, A.; Shah, S.; Shinn, J.; Staddon, C.; et al. Advancing human capabilities for water security: A relational approach. Water Secur. 2017, 1, 46–52. [Google Scholar] [CrossRef]
- UN-Habitat. State of the World’s Cities 2008/2009—Harmonious Cities; UN-Habitat: Nairobi, Kenya, 2008. [Google Scholar]
- Mayne, A. The History of a Global Injustice; University of Chicago Press: Chicago, IL, USA, 2017. [Google Scholar]
- Subbaraman, R.; Murthy, S. The Right to Water in the Slums of Mumbai, India 2015. Bull. World Health Organ. 2015, 93, 815–816. Available online: https://ssrn.com/abstract=3149943 (accessed on 6 May 2019).
- United Nations Human Settlements Programme (UN-Habitat). The Challenge of Slums: Global Report on Human Settlements; Earthscan Publications Ltd.: London, UK, 2003. [Google Scholar]
- Ravallion, M.; Chen, S.; Sangraula, P. The Urbanization of Global Poverty. Development Research Group; World Bank: Washington, DC, USA, 2007; Available online: http://siteresources.worldbank.org/INTDECINEQ/Resources/Urbanizationpoverty.pdf (accessed on 5 December 2019).
- United Nations Children’s Fund (UNICEF) and World Health Organization (UNICEF/WHO). Progress on Household Drinking Water, Sanitation and Hygiene 2000–2017. Special Focus on Inequalities. New York. 2019. Available online: https://www.who.int/water_sanitation_health/publications/jmp-2019-full-report.pdf?ua=1 (accessed on 5 January 2020).
- Begum, H.; Moinuddin, G. Spatial dimension of social exclusion. An imperial investigation into the relationship of housing and social exclusion in the slums of Dhaka city. Manag. Res. Pract. 2010, 2, 314–328. [Google Scholar]
- Webb, P.; Iskandarani, M. Water Insecurity and the Poor: Issues and Research Needs, ZEF—Discussion Papers on Development Policy No. 2; Center for Development Research: Bonn, Germany, 1998; p. 66. [Google Scholar]
- Martine, G. Migration, Natural Increase and City Growth: The Case of Rio de Janiero. Intern. Migr. Lat. Am. 1972, 6, 200–215. [Google Scholar] [CrossRef]
- Marx, B.; Stoker, T.; Suri, T. The Economics of Slums in the Developing World. J. Econ. Perspect. 2013, 27, 187–210. [Google Scholar] [CrossRef] [Green Version]
- Schenk, C. Slum Diversity in Kolkata. Columbia Undergrad. J. South Asian Stud. 2010, 1, 91–108. [Google Scholar]
- Ghosh, S. Regional Disparities of Slums, 2013—An Overview with special emphasis to Kolkata. Int. J. Humanit. Soc. Sci. Invent. 2013, 2, 48–54. [Google Scholar]
- Levitas, R.; Pantazis, C.; Fahmy, E.; Gordon, D.; Loyd, E.; Patsios, D. The Multi-Dimensional Analysis of Social Exclusion; UK Office Social Exclusion Task Force: London, UK, 2007. [Google Scholar]
- Thorat, S. Economic Exclusion and Poverty in Asia: The Example of Caste in India. In 2020 Focus Brief on the World’s Poor and Hungry People; IFPRI: Washington, DC, USA, 2007. [Google Scholar]
- World Bank-Water and Sanitation Program (WSP). Gender in Water and Sanitation. Mainstreaming Gender in Water and Sanitation; World Bank: Washington, DC, USA, 2010. [Google Scholar]
- Sustainable Sanitation Alliance (SuSanA). SuSanA Factsheet: Integrating a Gender Perspective in Sustainable Sanitation. Eschborn: Sustainable Sanitation Alliance Working Group on Gender. 2009. Available online: http://www.susana.org/lang-en/library?view=ccbktypeitem&type=2&id=1187 (accessed on 5 January 2020).
- Benjamin, C.; Hueso, A. LGBTI and sanitation: What we know and what the gaps are. Local action with international cooperation to improve and sustain water, sanitation and hygiene services. In Proceedings of the 40th WEDC International Conference, Loughborough, UK, 24–28 July 2017; Available online: https://wedc-knowledge.lboro.ac.uk/resources/conference/40/Benjamin-2649.pdf (accessed on 5 January 2020).
- Das, B.; Khara, U.; Giri, P.; Bandyopadhyay, A. The Challenge of Slum Development in India: A Case Study of Meltala-Dasnagar Slum Area of Howrah Municipal Corporation. Int. J. Adv. Syst. Soc. Eng. Res. 2012, 2, 22–27. [Google Scholar]
- Ray, B. Quality of life in selected slums of Kolkata: A step forward in the era of pseudo-urbanisation. Local Environ. 2017, 22, 365–387. [Google Scholar] [CrossRef]
- Census of India. Primary Census 2011 Abstract for Slums; Office of the Registrar General and Census Commissioner: New Delhi, Indina, 2011. Available online: http://www.censusindia.gov.in/2011-Documents/Slum-26-09-13.pdf (accessed on 19 September 2016).
- Wutich, A.; Ragsdale, K. Water insecurity and emotional distress: Coping with supply, access, and seasonal variability of water in a Bolivian squatter settlement. Soc. Sci. Med. 2008, 67, 2116–2125. [Google Scholar] [CrossRef]
- Gleick, P. The human right to water. Water Policy 1998, 1, 487–503. [Google Scholar] [CrossRef]
- Satterthwaite, D. The Millennium Development Goals and urban poverty reduction: Great expectations and nonsense statistics. Environ. Urban. 2003, 15, 181–190. [Google Scholar] [CrossRef]
- Hadley, C.; Amber, W. Experience-based measures of food and water security: Biocultural approaches to grounded measures of insecurity. Hum. Organ. 2009, 68, 451–460. [Google Scholar] [CrossRef]
- World Health Organization and UNICEF. Progress on Sanitation and Drinking-Water-2013 Update; World Health Organization: Geneva, Switzerland, 2014. [Google Scholar]
- United Nations. UN Special Rapporteur’s Realizing the Rights to Water and Sanitation: A Handbook; UN: New York, NY, USA, 2014. [Google Scholar]
- UN-Water. Water Security and the Global Water Agenda; A UN-Water Analytical Brief; UNU-INWEH: Hamilton, ON, Canada, 2013. [Google Scholar]
- Chenoweth, J.; Malcolm, R.; Pedley, S.; Kaime, T. Household Water Security and the Human Right to Water and Sanitation. In Water Security: Principles, Perspectives and Practices; Lankford, B., Bakker, K., Zeitoun, M., Conway, D., Eds.; Routledge: New York, NY, USA; London, UK, 2013; pp. 307–318. [Google Scholar]
- United Nations. The Human Right to Water and Sanitation (Resolution Adopted by the General Assembly). UN Doc.64/292. 2010. Available online: http://www.un.org/ga/search/view_doc.asp?symboll=A/RES/64/292 (accessed on 6 December 2019).
- Boelens, R. The Shotgun Marriage. Water Security, Cultural Politics, and Forced Engagements between Official and Local Rights Frameworks. In Water Security: Principles, Perspectives and Practices; Lankford, B., Bakker, K., Zeitoun, M., Conway, D., Eds.; Routledge: New York, NY, USA; London, UK, 2013; pp. 239–255. [Google Scholar]
- Grey, D.; Sadoff, C.W. Sink or Swim? Water security for growth and development. Water Policy 2007, 9, 545–571. [Google Scholar] [CrossRef]
- Gutierrez, E. Boiling Point: Issues and Problems in Water Security and Sanitation; WaterAid Briefing Paper; Global Water Partnership: London, UK, 1999. [Google Scholar]
- Leb, C.; Wouters, P. The Water Security Paradox and International Law. Securitisation as an Obstacle to Achieving Water Security and the Role of Law in Desecuritising the World’s Most Precious Resource. In Water Security: Principles, Perspectives and Practices; Lankford, B., Bakker, K., Zeitoun, M., Conway, D., Eds.; Routledge: New York, NY, USA; London, UK, 2013; pp. 26–46. [Google Scholar]
- UNESCO. The United Nations World Water Development Report 2019: Leaving No One behind; UNESCO: Paris, France, 2019. [Google Scholar]
- Gleick, P.H. The World’s Water 2004–2005: The Biennial Report on Freshwater Resources; Island Press: Washington, DC, USA, 2004. [Google Scholar]
- World Health Organization (WHO). Guidelines on Sanitation and Health; World Health Organization: Geneva, Switzerland, 2018; Available online: https://apps.who.int/iris/bitstream/handle/10665/274939/9789241514705-eng.pdf?ua=1 (accessed on 5 January 2020).
- United Nations (UN). Background Paper Submitted by the Interagency Task Force on Gender and Water, Gender, Water and Sanitation. United Nations Commission on Sustainable Development, Twelfth Session, 14–30 April, Item on the Provisional Agenda, 2004. Available online: http://www.un.org/esa/sustdev/sdissues/water/GenderWaterTaskForce_CSD12finalreport.doc (accessed on 5 January 2020).
- World Health Organization (WHO). Guidelines for Drinking-Water Quality: Acceptability Aspects. Available online: https://www.who.int/water_sanitation_health/dwq/gdwq3_10.pdf (accessed on 6 January 2020).
- Smets, H. Access to drinking water at an affordable price in developing countries. Options Méditerranéennes A nº 2009, 57–68. [Google Scholar]
- Teodoro, M.P. Measuring Household Affordability for Water and Sewer Utilities. J. Am. Water Work. Assoc. 2018, 110, 13–24. Available online: https://awwa.onlinelibrary.wiley.com/doi/full/10.5942/jawwa.2018.110.0002 (accessed on 5 January 2020). [CrossRef]
- World Health Organisation (WHO)/United Nations Childrens Fund (UNICEF). Progress on Drinking Water and Sanitation—2012 Update; WHO & UNICEF: New York, NY, USA, 2012. [Google Scholar]
- Bradley, D.; Bartram, J. Domestic water and sanitation as water security: Monitoring, concepts and strategy. Philos. Trans. R. Soc. A 2013, 371, 20120420. [Google Scholar] [CrossRef] [Green Version]
- UNESCO. The United Nations World Water Development Report 2015: Water for a Sustainable World; UNESCO: Paris, France, 2015. [Google Scholar]
- Boelens, R.; Seemann, M. Forced engagements: Water security and local rights formalization in Yanque, Colca valley, Peru. Hum. Organ. 2014, 73, 1–12. [Google Scholar] [CrossRef]
- World Health Organization (WHO). World Health Organization Global Burden of Disease; 2004 Update; WHO: Geneva, Switzerland, 2008. [Google Scholar]
- Duflo, E.; Galiani, S.; Mobarak, M. Improving Access to Urban Services for the Poor: Open Issues and a Framework for a Future Research Agenda. J-PAL Urban Services Review Paper; Abdul Latif Jameel Poverty Action Lab: Cambridge, MA, USA, 2012. [Google Scholar]
- Schelwald-Van Der Kley, L.; Reijerkerk, L. Water: A Way of Life. Sustainable Water Management in a Cultural Context; CRC Press: Leiden, The Netherland, 2009. [Google Scholar]
- Warner, W.; Heeb, J.; Jenssen, P.; Gnanakan, K.; Conradin, K. M4-2: Socio-Cultural Aspects of Ecological Sanitation. PDF-Presentation. Aarau: Seecon. 2008. Available online: http://www.sswm.info/sites/default/files/reference_attachments/WARNER%20et%20al%202008%20Socio%20Cultural%20Aspects.pdf (accessed on 20 June 2018).
- Winter, S.; Dzombo, M.; Barchi, F. Exploring the complex relationship between women’s sanitation practices and household diarrhea in the slums of Nairobi: A cross-sectional study. BMC Infect. Dis. 2019, 19, 242. [Google Scholar] [CrossRef]
- UN-Women. We must Leverage Women’s Voice and Influence in Water Governance by Åsa Regnér, Deputy Executive Director of UN Women, at the World Water Week Celebration in Stockholm on 27 August. 2018. Available online: https://www.unwomen.org/en/news/stories/2018/8/speed-ded-regner-stockholm-world-water-week (accessed on 5 January 2020).
- Doshi, S. The Right to the Slum? Redevelopment, Rule and the Politics of Difference in Mumbai. UC Berkeley. 2011. Available online: https://escholarship.org/uc/item/4tx6v6sw (accessed on 5 December 2019).
- Furedy, C. Whose Responsibility? Dilemmas of Calcutta’s Bustee Policy in the Nineteenth Century. South Asia 1982, 5, 24–46. [Google Scholar] [CrossRef]
- Dutt, T.K. Hungry Bengal; Indian Printing Works: Lahore, India, 1944. [Google Scholar]
- Bose, R.; Ghosh, S. Slums in Kolkata: A socio-economic analysis. EEQEL 2015, 4, 134–148. [Google Scholar]
- McArthur, J.M.; Sikdar, P.K.; Leng, M.J.; Ghosal, U.; Sen, I. Groundwater Quality beneath an Asian Megacity on a Delta: Kolkata’s (Calcutta’s) Disappearing Arsenic and Present Manganese. Environ. Sci. Technol. 2018, 52, 5161–5172. [Google Scholar] [CrossRef]
- United States Environmental Protection Agency (EPA). Learn about Private Water Wells. 2019. Available online: https://www.epa.gov/privatewells/learn-about-private-water-wells (accessed on 5 January 2020).
- Boelens, R.; Vos, J.; Perreault, T. Introduction: The Multiple Challenges and Layers of Water Justice Struggles. In Water Justice; Boelens, R., Perreault, T., Vos, J., Eds.; Cambridge University Press: Cambridge, MA, USA, 2018; pp. 1–32. [Google Scholar]
- Crow, B.; Lu, F.; Ocampo-Raeder, C.; Boelens, R.; Dill, B.; Zwarteveen, M. Santa Cruz declaration on the global water crisis. Water Int. 2014, 39, 246–261. [Google Scholar]
- Escobar, A. Difference and conflict in the struggle over natural resources: A political ecology framework. Development 2006, 49, 6–13. [Google Scholar] [CrossRef]
- Harvey, D. Justice, Nature and the Geography of Difference; Blackwell Publishers: Cambridge, MA, USA; Oxford, UK, 1996. [Google Scholar]
- Perreault, T.; Wraight, S.; Perreault, M. The Social Life of Water: Histories and Geographies of Environmental Injustice in the Onondaga Lake Watershed; Justicia Hídrica: New York, NY, USA, 2011; Available online: www.justiciahidrica.org (accessed on 28 August 2019).
- Popay, J.; Escorel, S.; Hernandez, M.; Johnston, H.; Mathieson, J.; Rispel, L. Understanding and Tackling Social Exclusion: Final Report of the Social Exclusion Knowledge Network of the Commission on Social Determinants of Health; World Health Organization: Geneva, Switzerland, 2008. [Google Scholar]
- Cohen, B. Urbanization in developing countries: Current trends, future projections, and key challenges for sustainability. Technol. Soc. 2006, 28, 63–80. [Google Scholar] [CrossRef]
- Montgomery, M. The urban transformation of the developing world. Science 2008, 319, 761–764. [Google Scholar] [CrossRef] [Green Version]
- Mahabir, R.; Crooks, A.; Croitoru, A.; Agouris, P. The study of slums as social and physical constructs: Challenges and emerging research opportunities. Reg. Stud. Reg. Sci. 2016, 3, 399–419. [Google Scholar] [CrossRef] [Green Version]
- Kilroy, A. Intra-urban spatial inequalities: Cities as ‘urban regions. In Background Paper to the 2009 World Development Report; World Bank: Washington, DC, USA, 2007; Available online: http://siteresources.worldbank.org/INTWDR2009/Resources/42310061204741572978/Kilroy2.pdf (accessed on 18 March 2019).
- Martinez, J.; Mboup, G.; Sliuzas, R.; Stein, A. Trends in urban and slum indicators across developing world cities, 1990–2003. Habitat Int. 2008, 32, 86–108. [Google Scholar] [CrossRef]
- Hawkins, P.; Blackett, I.; Heymans, C. Poor-Inclusive Urban Sanitation: An Overview; World Bank: Washington, DC, USA, 2013; Available online: http://wedc.lboro.ac.uk/resources/pubs/WSP-Poor-Inclusive-Urban-Sanitation-Overview.pdf (accessed on 5 December 2019).
- Mosello, B.; Chambers, V.; Mason, N. Improving WaSH Service Delivery in Protracted Crises: The case of the Democratic Republic of Congo; Overseas Development Institute: London, UK, 2017. [Google Scholar]
- World Health Organisation (WHO)/United Nations Childrens Fund (UNICEF). Progress on Drinking Water and Sanitation—2014 Update; WHO & UNICEF: New York, NY, USA, 2014. [Google Scholar]
- Schreiber, F.; Carius, A. The Inclusive City: Urban Planning for Diversity and Social Cohesion. In State of the World: Can a City Be Sustainable? Worldwatch Institute, Ed.; Worldwatch Institute: Washington, DC, USA, 2016; pp. 123–141. [Google Scholar]
- Bhan, G.; Jana, A. Reading spatial inequality in urban India. Econ. Political Wkly. 2015, 50, 49–54. [Google Scholar]
- Haque, I. Discriminated urban spaces: A study of spatial segregation in urban West Bengal. Econ. Political Wkly. 2016, 51, 41–50. [Google Scholar]
- Hegde, S. India: Segregation in housing and ghettoization of cities. South Asia Citiz. 2013. Available online: http://www.sacw.net/article6363.html (accessed on 12 August 2019).
- Sidhwani, P. Spatial inequalities in big Indian cities. Econ. Political Wkly. 2015, 50, 55–62. [Google Scholar]
- Saroj, S.K.; Rana, M.J.; Choudhary, B.K.; Goli, S. WaSH Availability, Accessibility and Inequalities in Select Metro Cities of India. Sustain. Cities Soc. 2017, 29, 105268. [Google Scholar]
- Giles, H.; Brown, B. And Not a Drop to Drink’: Water and sanitation services to the urban poor in the developing world. Geogr. Assoc. 1997, 82, 97–109. Available online: http://www.jstor.org/stable/40572824 (accessed on 5 December 2019).
- Smith, L. The urban political ecology of water in Cape Town. Urban Forum 2001, 12, 204–224. [Google Scholar] [CrossRef]
- Chant, S.; Klett-Davies, M.; Ramalho, J. Challenges and Potential solutions for adolescent girls in urban settings: A rapid evidence review. In Gender and Adolescence: Global Evidence; The London School of Economics and Political Science: London, UK, 2017; Available online: http://eprints.lse.ac.uk/84297/1/Young%20Female%20Adolescents%20in%20Urban%20Areas%20RER%20FINAL.pdf (accessed on 5 January 2020).
- Corburn, J.; Hildebrand, C. Slum Sanitation and the Social Determinants of Women’s Health in Nairobi, Kenya. J. Environ. Public Health 2015, 2015, 209505. [Google Scholar] [CrossRef] [PubMed] [Green Version]
- Mohite, R.V.; Mohite, V.R. Menstrual hygiene practices among slum adolescent girls. Int. J. Community Med. Public Health 2016, 3, 1729–1734. [Google Scholar] [CrossRef]
- Parvez, A.; Rahman, M.M.; Sultana, S.; Shaheen, S.M. Prevalence of water-borne disease in farmgate slum of Dhaka city: A case study of disease propagation in Bangladesh. Pharmacologyonline 2019, 1, 55–63. [Google Scholar]
- Kundu, A. India’s sluggish urbanisation and its exclusionary development. In Urban Growth in Emerging Economies: Lessons from the BRICS; McGranahan, G., Martine, G., Eds.; Routledge: Abingdon, UK, 2014; pp. 191–232. [Google Scholar]
- Mahadevia, D. Branded and renewed? Policies, politics and processes of urban development in the reform era. Econ. Political Wkly. 2007, 46, 56–64. [Google Scholar]
- Murthy, S.L. Land security and the challenges of realizing the human rights to water and sanitation in the slums of Mumbai, India. Health Hum. Rights 2012, 14, 61–73. Available online: http://www.jstor.org/stable/healhumarigh.14.2.61 (accessed on 28 August 2019).
- Goli, S.; Arokiasamy, P.; Chattopadhyay, A. Living and health conditions of selected cities in India: Setting priorities for the National Urban Health Mission. Cities 2011, 28, 461–469. [Google Scholar] [CrossRef]
- Goli, S.; Doshi, R.; Arokiasamy, A. Pathways of economic inequalities in maternal and child health in urban India: A decomposition analysis. PLoS ONE 2013, 8, e58573. [Google Scholar] [CrossRef] [Green Version]
- Kumar, R.; Horwitz, P.; Milton, G.R.; Sellamuttu, S.S.; Buckton, S.T.; Davidson, N.C.; Pattnaik, A.K.; Zavagli, M.; Baker, C. Assessing wetland ecosystem services and poverty interlinkages: A general framework and case study. Hydrol. Sci. J. 2011, 56, 1602–1621. [Google Scholar] [CrossRef] [Green Version]
- Mayer, F.; Frantz, C.; Bruehlman-Senecal, E.; Dolliver, K. Why is nature beneficial? The role of connectedness to nature. Environ. Behav. 2009, 41, 607–643. [Google Scholar] [CrossRef]
- Aylward, B.; Bandyopadhyay, J.; Belausteguigotia, J.C.; Borkey, P.; Cassar, A.Z.; Meadors, L.; Saade, L.; Siebentritt, M.; Stein, R.; Tognetti, S.; et al. Freshwater ecosystem services. Ecosyst. Hum. Well-Being Policy Responses 2005, 3, 213–256. [Google Scholar]
- Nawab, B.; Nyborg, I.L.; Esser, K.B.; Jenssen, P.D. Cultural preferences in designing ecological sanitation systems in North West Frontier Province, Pakistan. J. Environ. Psychol. 2006, 26, 236–246. [Google Scholar] [CrossRef]
- Chiodelli, F.; Moroni, S. The complex nexus between informality and the law: Reconsidering unauthorised settlements in light of the concept of nomotropism. Geoforum 2014, 51, 161–168. [Google Scholar] [CrossRef]
- Tsenkova, S.; Potsiou, C.; Badyina, A. Self-Made Cities—In Search of Sustainable Solutions for Informal Settlements in the United Nations Economic Commissions for Europe Region; United Nations Economic Commission for Europe (UNECE), United Nations Publications: Geneva, Switzerland, 2009; p. 113. [Google Scholar]
- Mishra, V. Key challenges of marginalised communities on sanitation and hygiene and recommendations to clean India. In Proceedings of the 40th WEDC International Conference, Loughborough, UK, 24–28 July 2017. [Google Scholar]
- United Nations Human Rights Council (UNHRC). Report of the Independent Expert on the Issue of Human Rights Obligations Related to Access to Safe Drinking Water and Sanitation; UN Document A/HRC/15/31; UNHRC: Geneva, Switzerland, 2010. [Google Scholar]
- Uddin, N. Assessing urban sustainability of slum settlements in Bangladesh: Evidence from Chittagong city. J. Urban. Manag. 2018, 7, 32–42. [Google Scholar] [CrossRef]
- Dhall, P.; Boyce, P. Livelihood, Exclusion and Opportunity: Socioeconomic Welfare among Gender and Sexuality Non-Normative People in India; Institute of Development Studies: Brighton, UK, 2015. [Google Scholar]
- Boyce, P.; Boyce, P.; Brown, S.; Cavill, S.; Chaukekar, S.; Chisenga, B.; Dash, M.; Dasgupta, R.K.; De La Brosse, N.; Dhall, P.; et al. Transgender-inclusive sanitation: Insights from South Asia. Waterlines 2018, 37, 102–117. [Google Scholar] [CrossRef]
- Shrestha, S.; Aihara, Y.; Bhattarai, A.P.; Bista, N.; Kondo, N.; Futaba, K.; Nishida, K.; Shindo, J. Development of an objective water security index and assessment of its association with quality of life in urban areas of developing countries. SSM—Popul. Health 2018, 6, 276–285. [Google Scholar] [CrossRef]
- Sasidevan, D.; Santha, S.D. The social construction of water scarcity: An exploratory study along the “Bharathapuzha” in Kerala. Glocalism: J. Cult. Politics Innov. 2018, 3. [Google Scholar] [CrossRef]


| Gender | Literacy | Ethnicity (Based on Language Spoken) | Religion | ||||||||
|---|---|---|---|---|---|---|---|---|---|---|---|
| Families | Male Dwellers | Female Dwellers | Literate Dwellers | Bengali Speakers | Hindi Speakers | Urdu speakers | Other Language Speakers | Hindu | Muslim | Other Religions | |
| Latrines person−1 | |||||||||||
| Pearsons’s r | 0.781 ** | 0.718 ** | 0.707 ** | 0.733 ** | 0.795 ** | 0.323 ** | 0.178 * | 0.213 * | 0.734 ** | 0.192 * | 0.261 ** |
| Sig.(2-tailed) | 0.000 | 0.000 | 0.000 | 0.000 | 0.000 | 0.000 | 0.037 | 0.012 | 0.000 | 0.024 | 0.002 |
| N | 138 | 138 | 138 | 138 | 138 | 138 | 138 | 138 | 138 | 138 | 138 |
| Standposts person−1 | |||||||||||
| Pearsons’s r | 0.871 ** | 0.830 ** | 0.817 ** | 0.815 ** | 0.807 ** | 0.482 ** | 0.254 ** | 0.375 ** | 0.856 ** | 0.192 * | 0.409 ** |
| Sig.(2-tailed) | 0.000 | 0.000 | 0.000 | 0.000 | 0.000 | 0.000 | 0.003 | 0.000 | 0.000 | 0.024 | 0.000 |
| N | 138 | 138 | 138 | 138 | 138 | 138 | 138 | 138 | 138 | 138 | 138 |
| Dugwells person−1 | |||||||||||
| Pearsons’s r | 0.403 ** | 0.340 ** | 0.364 ** | 0.381 ** | 0.452 ** | 0.202 ** | - | - | 0.455 ** | - | - |
| Sig.(2-tailed) | 0.000 | 0.000 | 0.000 | 0.000 | 0.000 | 0.018 | 0.892 | 0.079 | 0.000 | 0.819 | 0.058 |
| N | 138 | 138 | 138 | 138 | 138 | 138 | 138 | 138 | 138 | 138 | 138 |
| Tubewells person−1 | |||||||||||
| Pearsons’s r | 0.369 ** | 0.369 ** | 0.337 ** | 0.349 ** | 0.509 ** | - | - | - | 0.410 ** | - | - |
| Sig.(2-tailed) | 0.000 | 0.000 | 0.000 | 0.000 | 0.000 | 0.883 | 0.659 | 0.979 | 0.000 | 0.503 | 0.820 |
| N | 138 | 138 | 138 | 138 | 138 | 138 | 138 | 138 | 138 | 138 | 138 |
| WaSH Provisions and Gender Characteristics | Statistical Measure | Value | df | Asymptotic Significance (2-sided) |
|---|---|---|---|---|
| Ward and Direct piped water supply to the house | Pearson Chi-Square | 670.72 | 372 | 0.000 |
| Likelihood Ratio | 279.66 | 372 | 1.000 | |
| Linear-by-Linear Association | 0.06 | 1 | 0.801 | |
| N of Valid Cases | 755 | |||
| Ward and Presence of Toilets in the house | Pearson Chi-Square | 764.73 | 124 | 0.000 |
| Likelihood Ratio | 719.22 | 124 | 0.000 | |
| Linear-by-Linear Association | 42.50 | 1 | 0.000 | |
| N of Valid Cases | 755 | |||
| Presence of Toilets in the house and Gender characteristics | Pearson Chi-Square | 239.75 | 8 | 0.000 |
| Likelihood Ratio | 259.28 | 8 | 0.000 | |
| Linear-by-Linear Association | 32.13 | 1 | 0.000 | |
| N of Valid Cases | 755 |
© 2020 by the authors. Licensee MDPI, Basel, Switzerland. This article is an open access article distributed under the terms and conditions of the Creative Commons Attribution (CC BY) license (http://creativecommons.org/licenses/by/4.0/).
Share and Cite
Mukherjee, S.; Sundberg, T.; Schütt, B. Assessment of Water Security in Socially Excluded Areas in Kolkata, India: An Approach Focusing on Water, Sanitation and Hygiene. Water 2020, 12, 746. https://doi.org/10.3390/w12030746
Mukherjee S, Sundberg T, Schütt B. Assessment of Water Security in Socially Excluded Areas in Kolkata, India: An Approach Focusing on Water, Sanitation and Hygiene. Water. 2020; 12(3):746. https://doi.org/10.3390/w12030746
Chicago/Turabian StyleMukherjee, Subham, Trude Sundberg, and Brigitta Schütt. 2020. "Assessment of Water Security in Socially Excluded Areas in Kolkata, India: An Approach Focusing on Water, Sanitation and Hygiene" Water 12, no. 3: 746. https://doi.org/10.3390/w12030746
APA StyleMukherjee, S., Sundberg, T., & Schütt, B. (2020). Assessment of Water Security in Socially Excluded Areas in Kolkata, India: An Approach Focusing on Water, Sanitation and Hygiene. Water, 12(3), 746. https://doi.org/10.3390/w12030746