Combined Electrocoagulation and Chemical Coagulation in Treating Brewery Wastewater


Abstract
1. Introduction
2. Materials and Methods
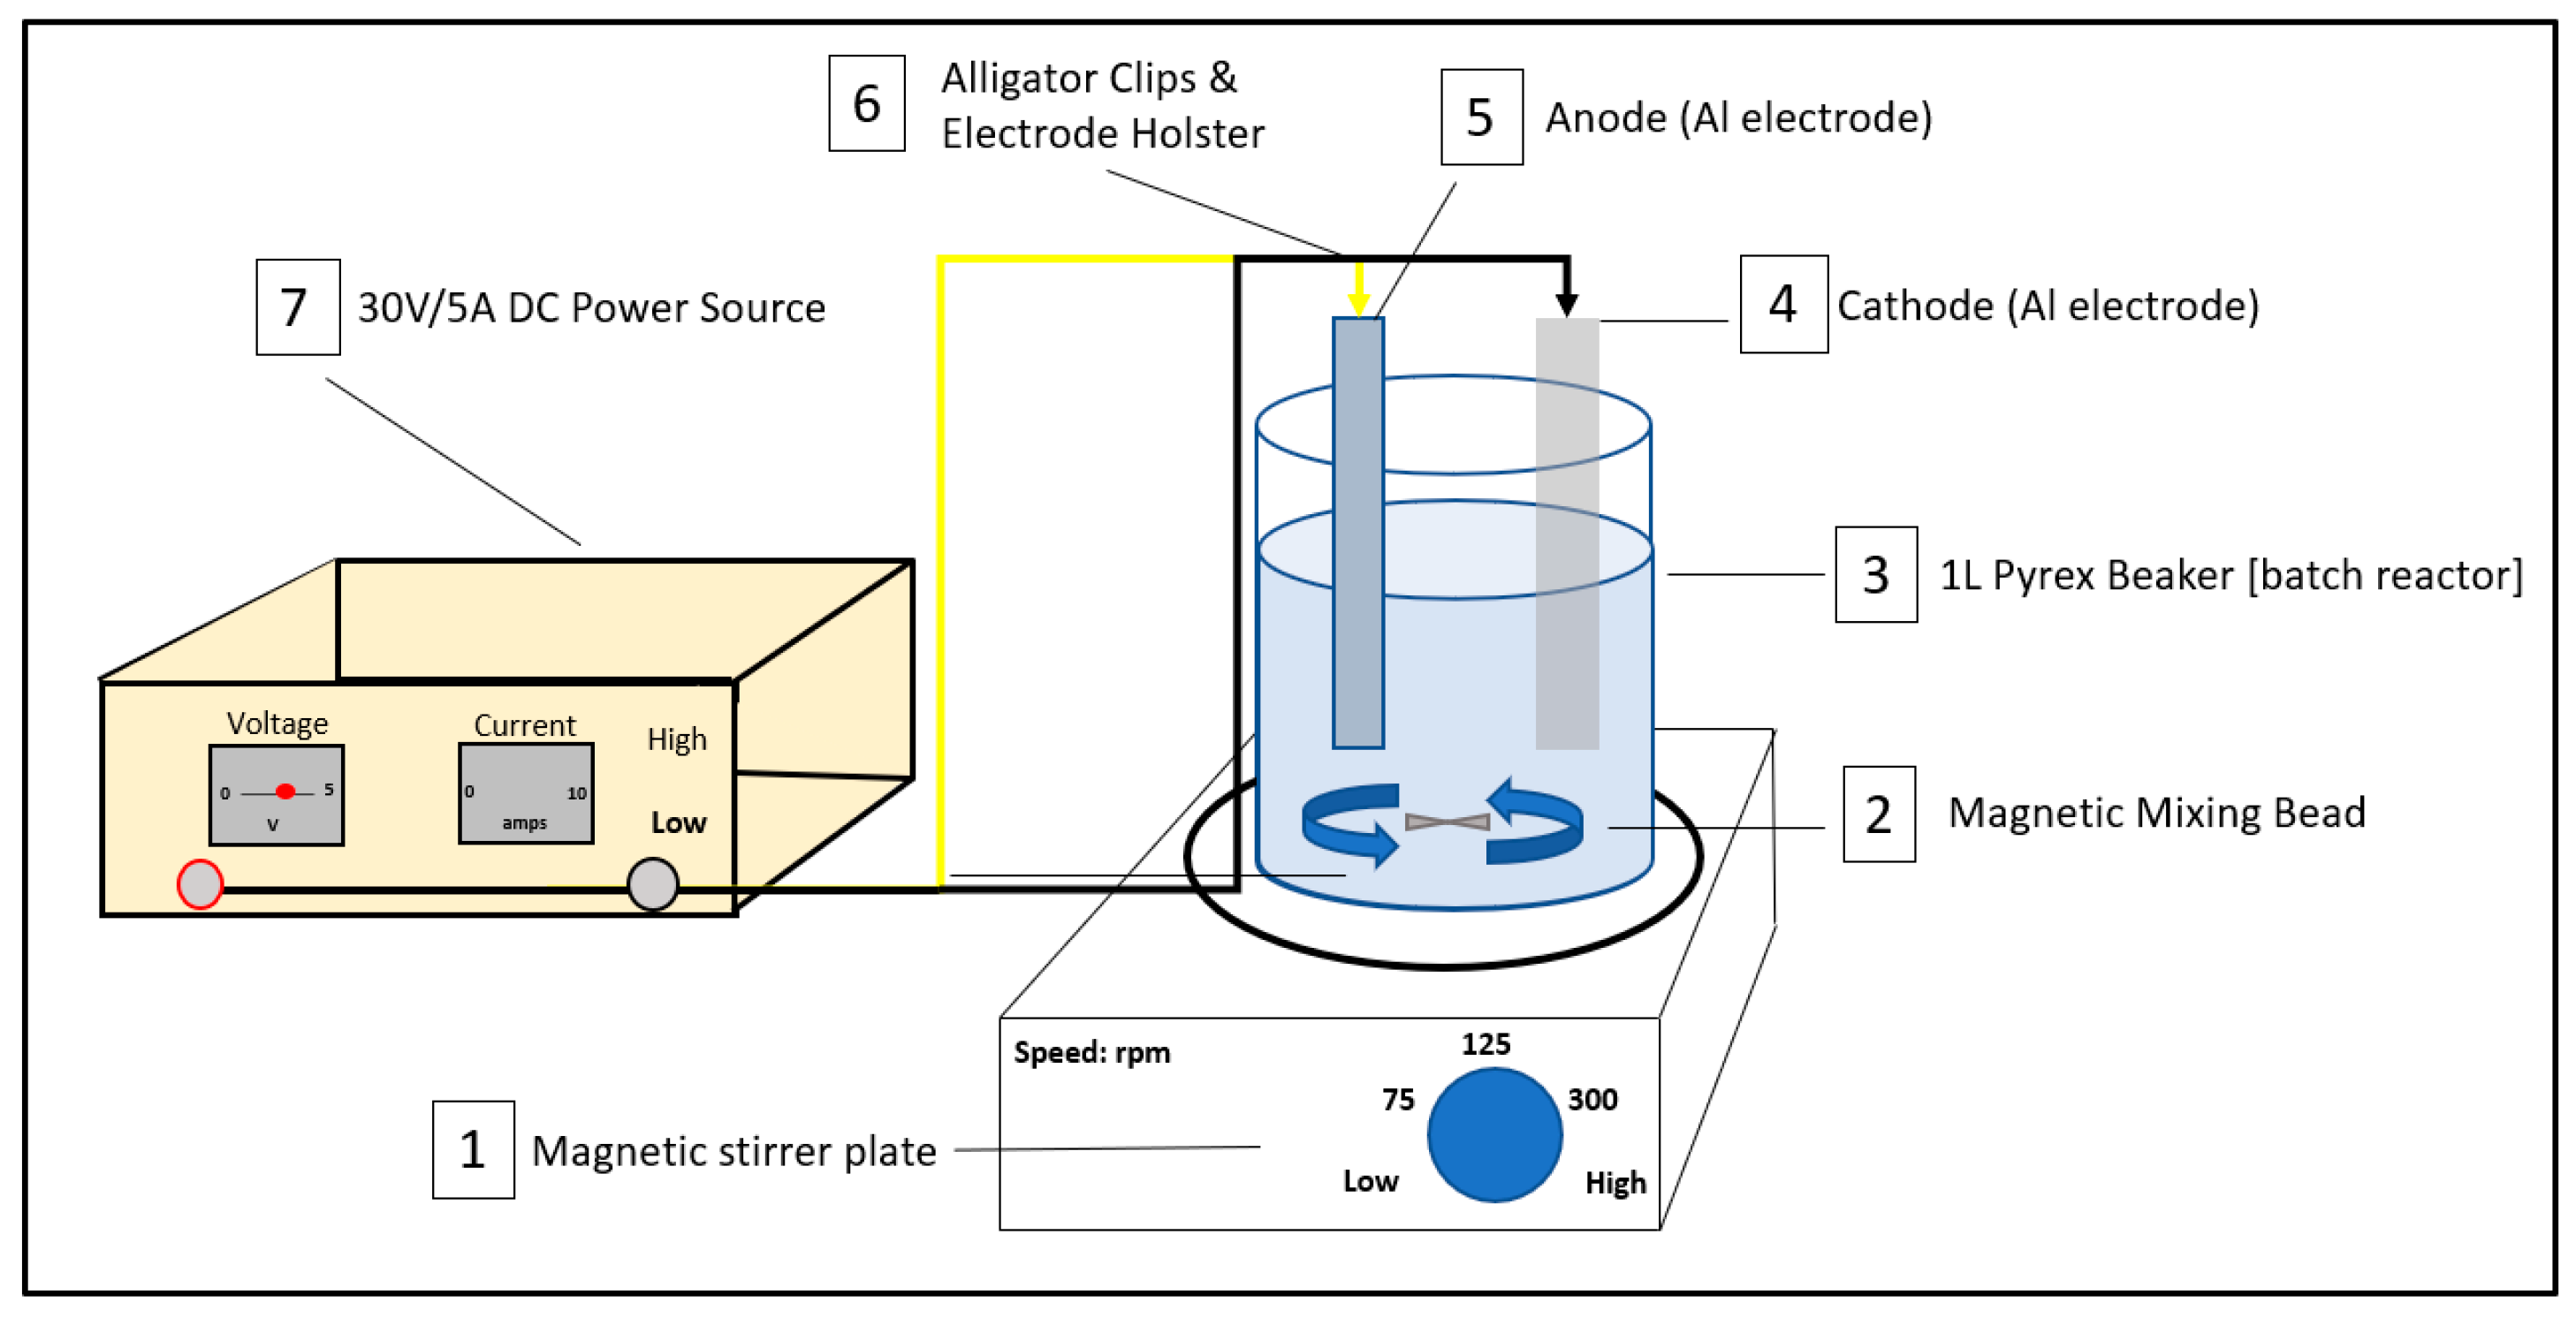
2.1. Electro-Coagulation (EC)
2.2. Electro-Coagulation Followed by Chemical Coagulation (EC-CC)
2.3. Chemical Coagulation and Post Electrocoagulation (CC-EC)
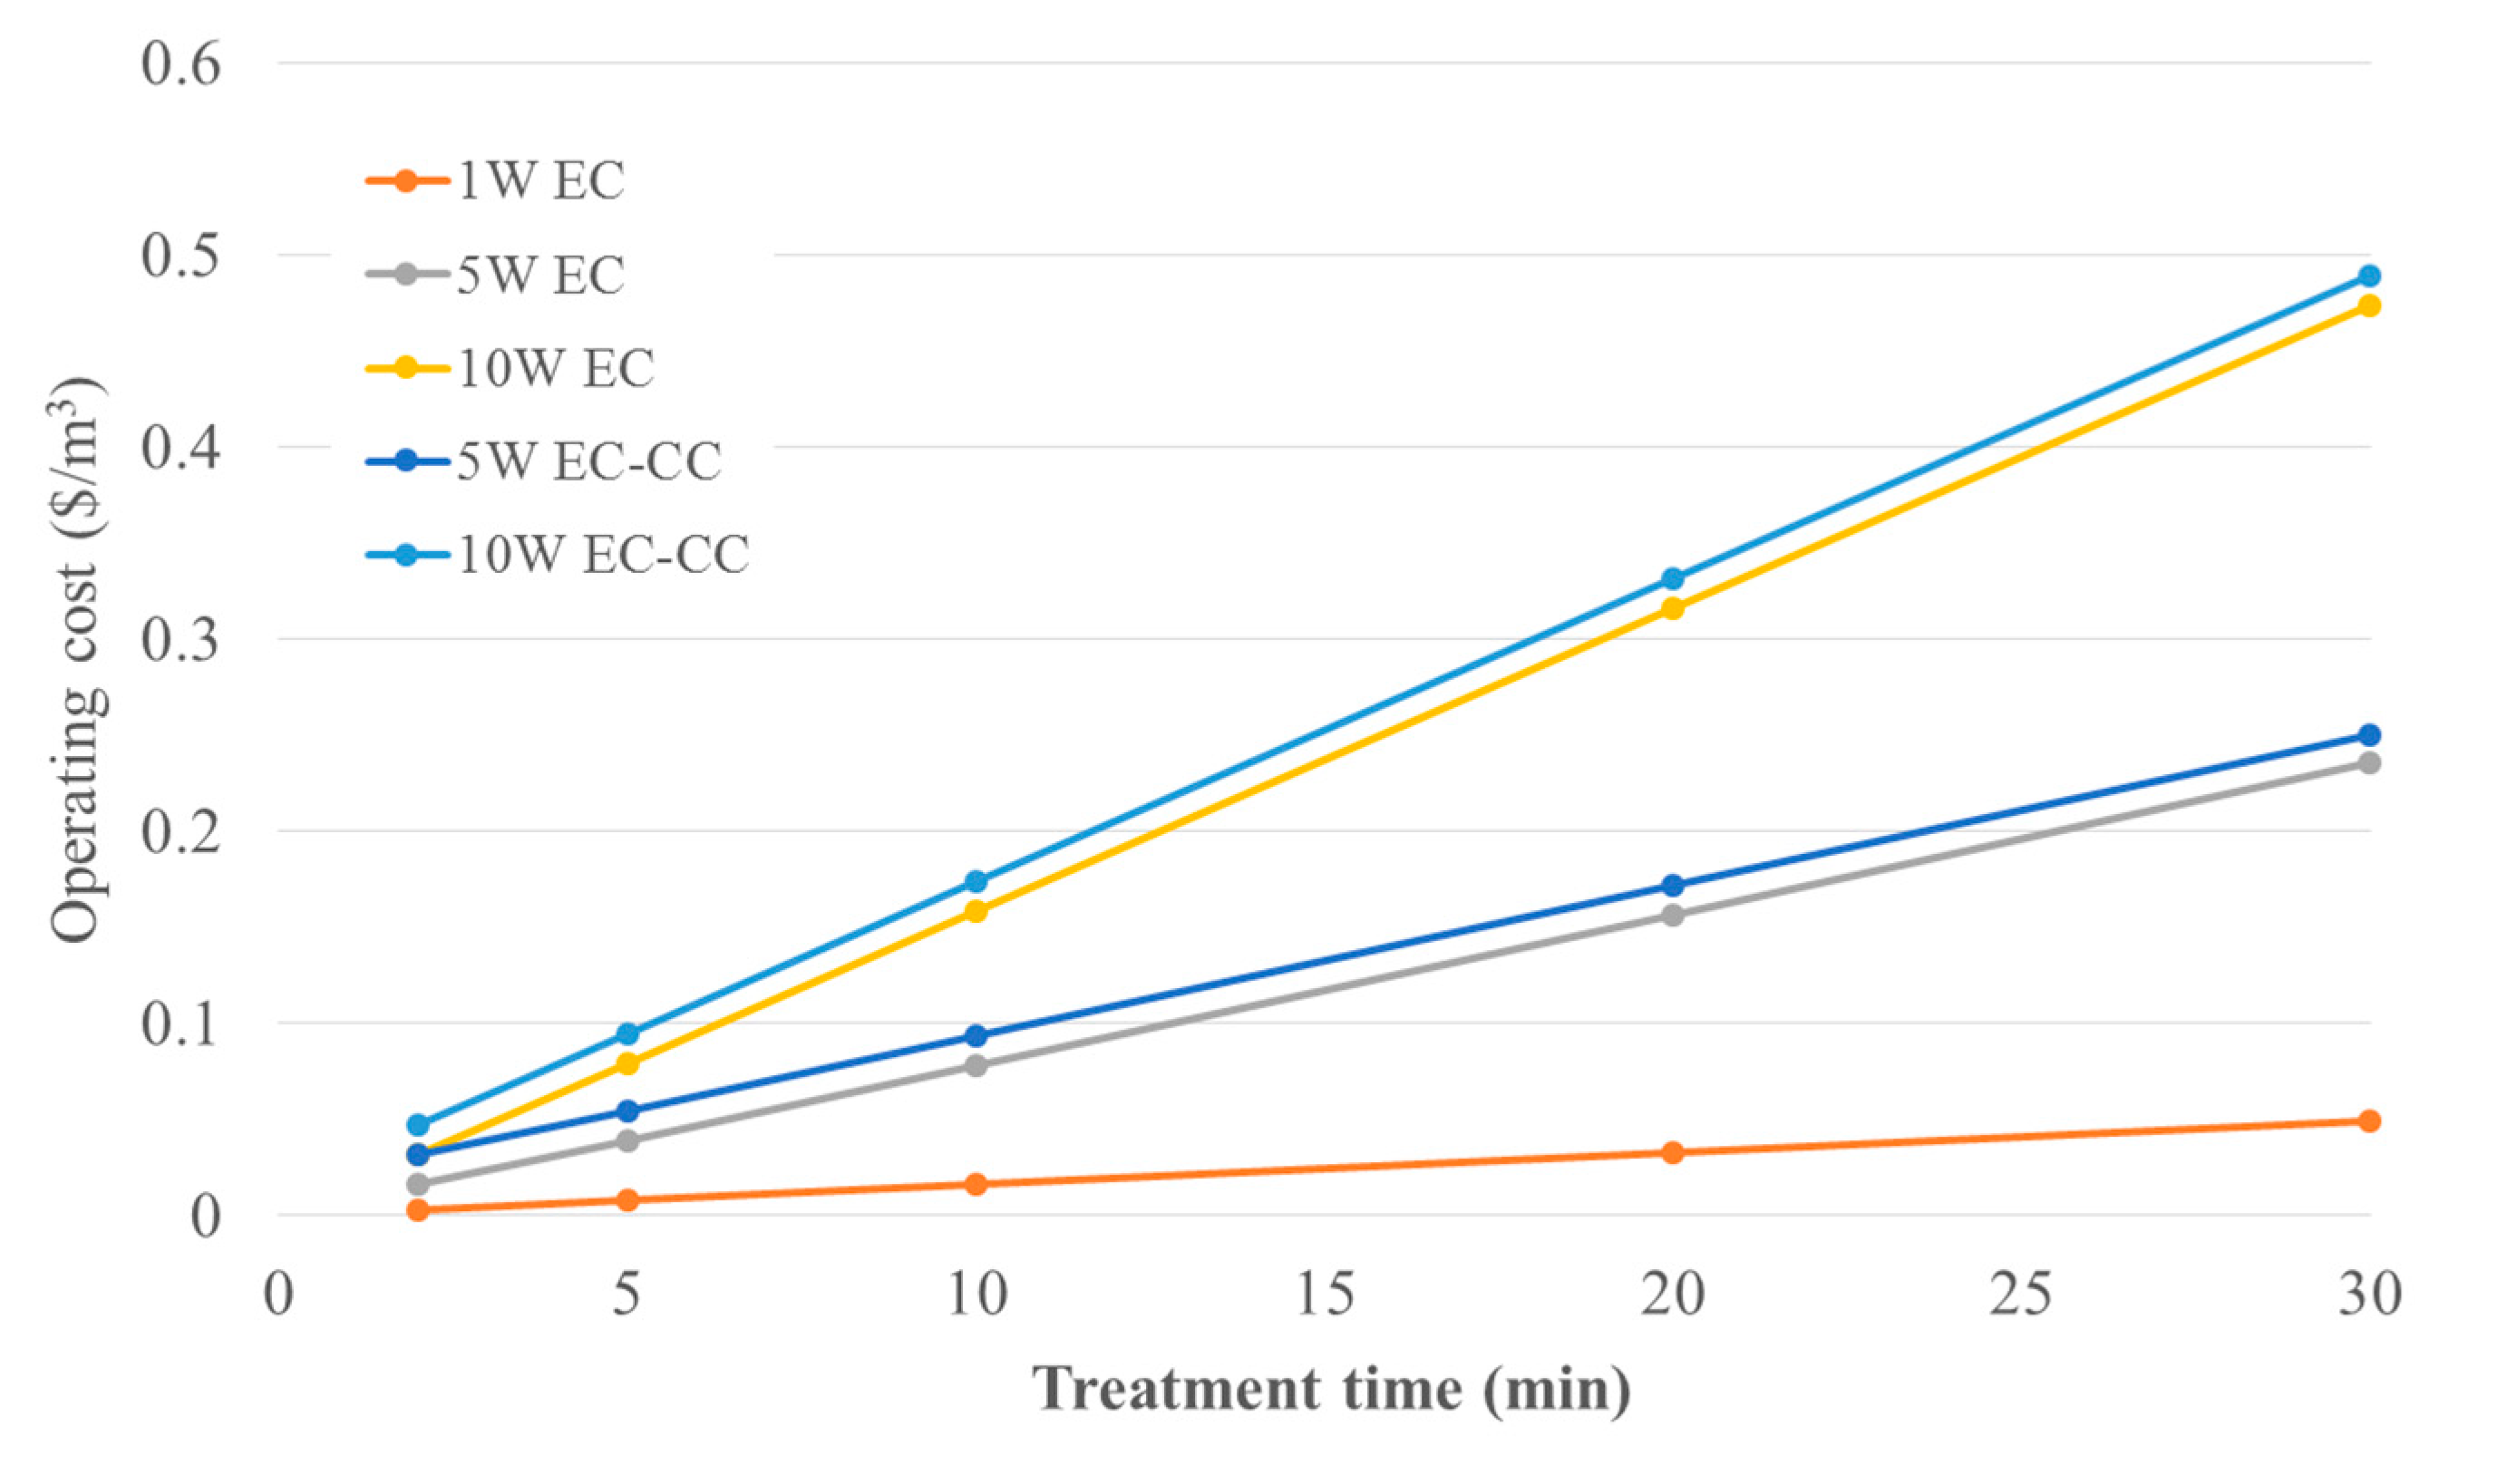
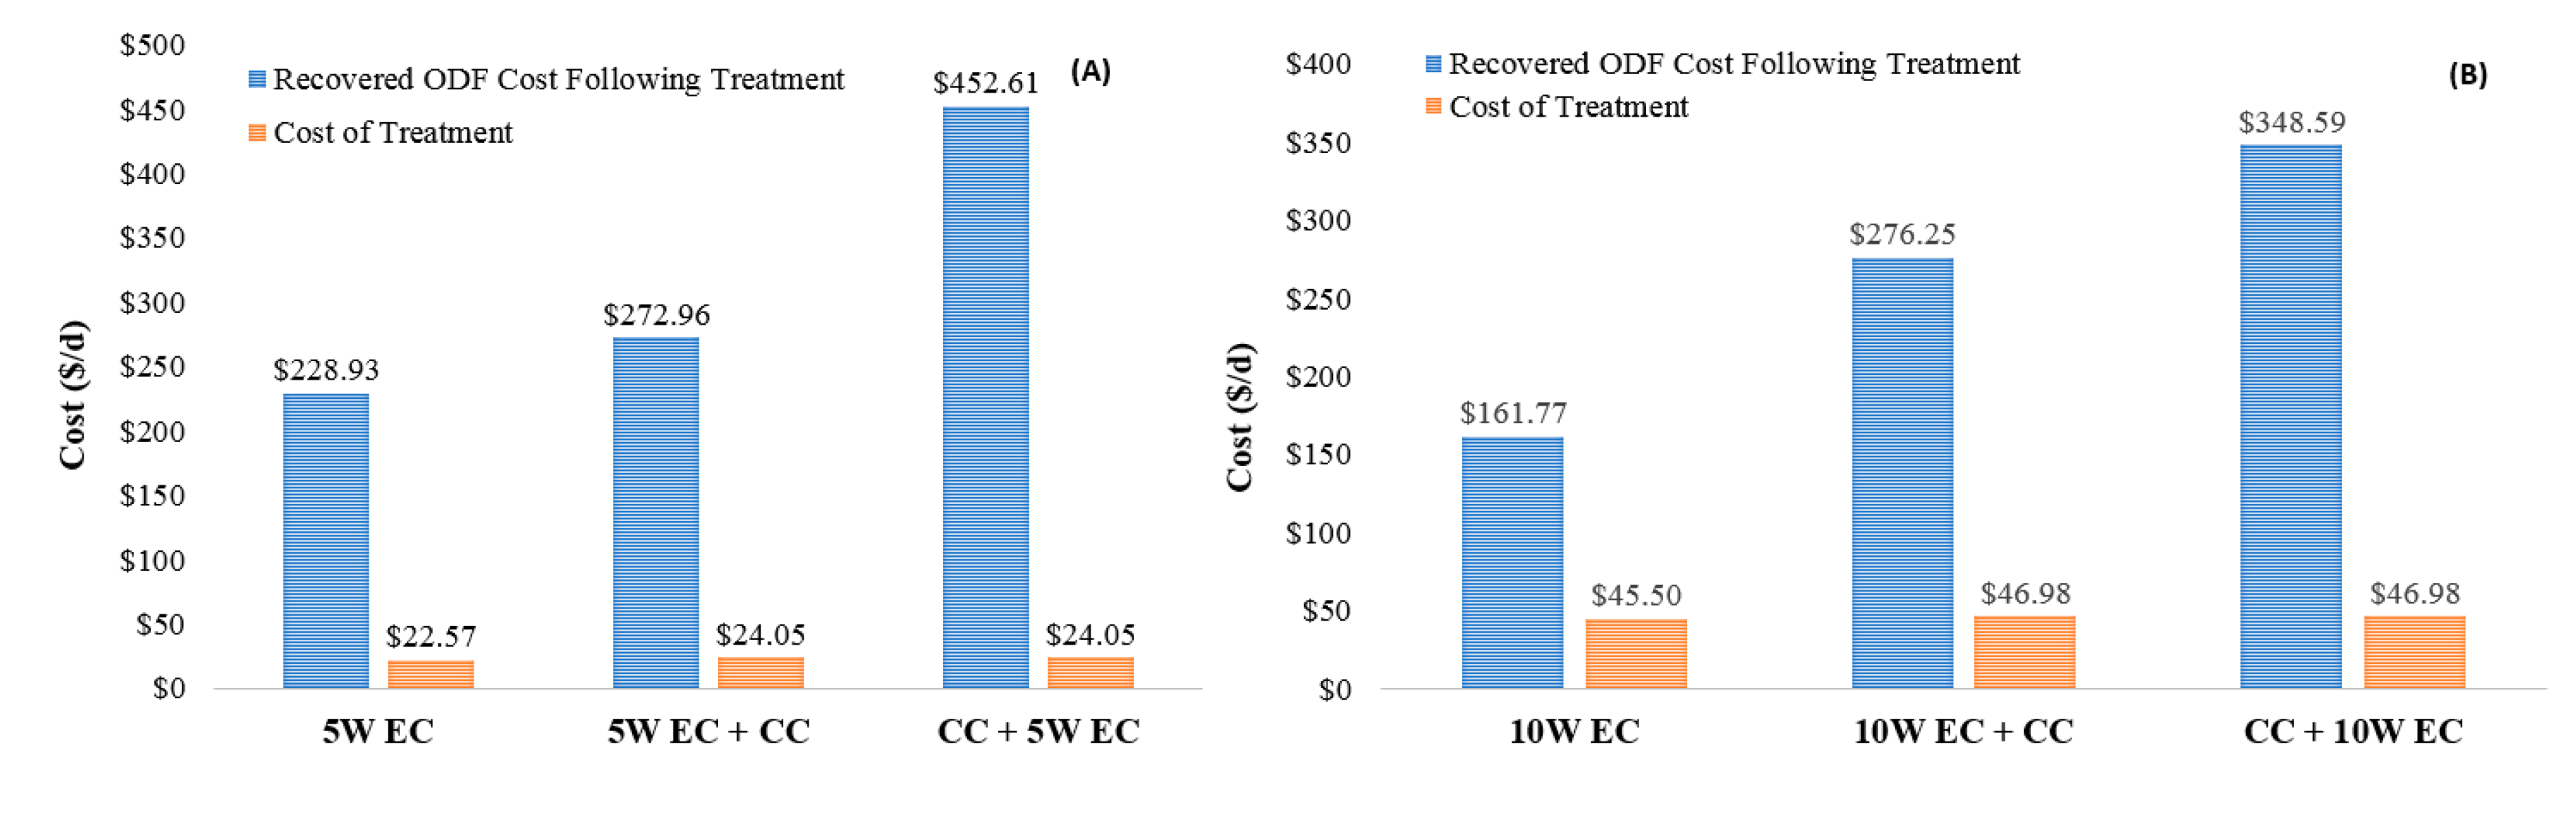
2.4. Economic Calculation
3. Results
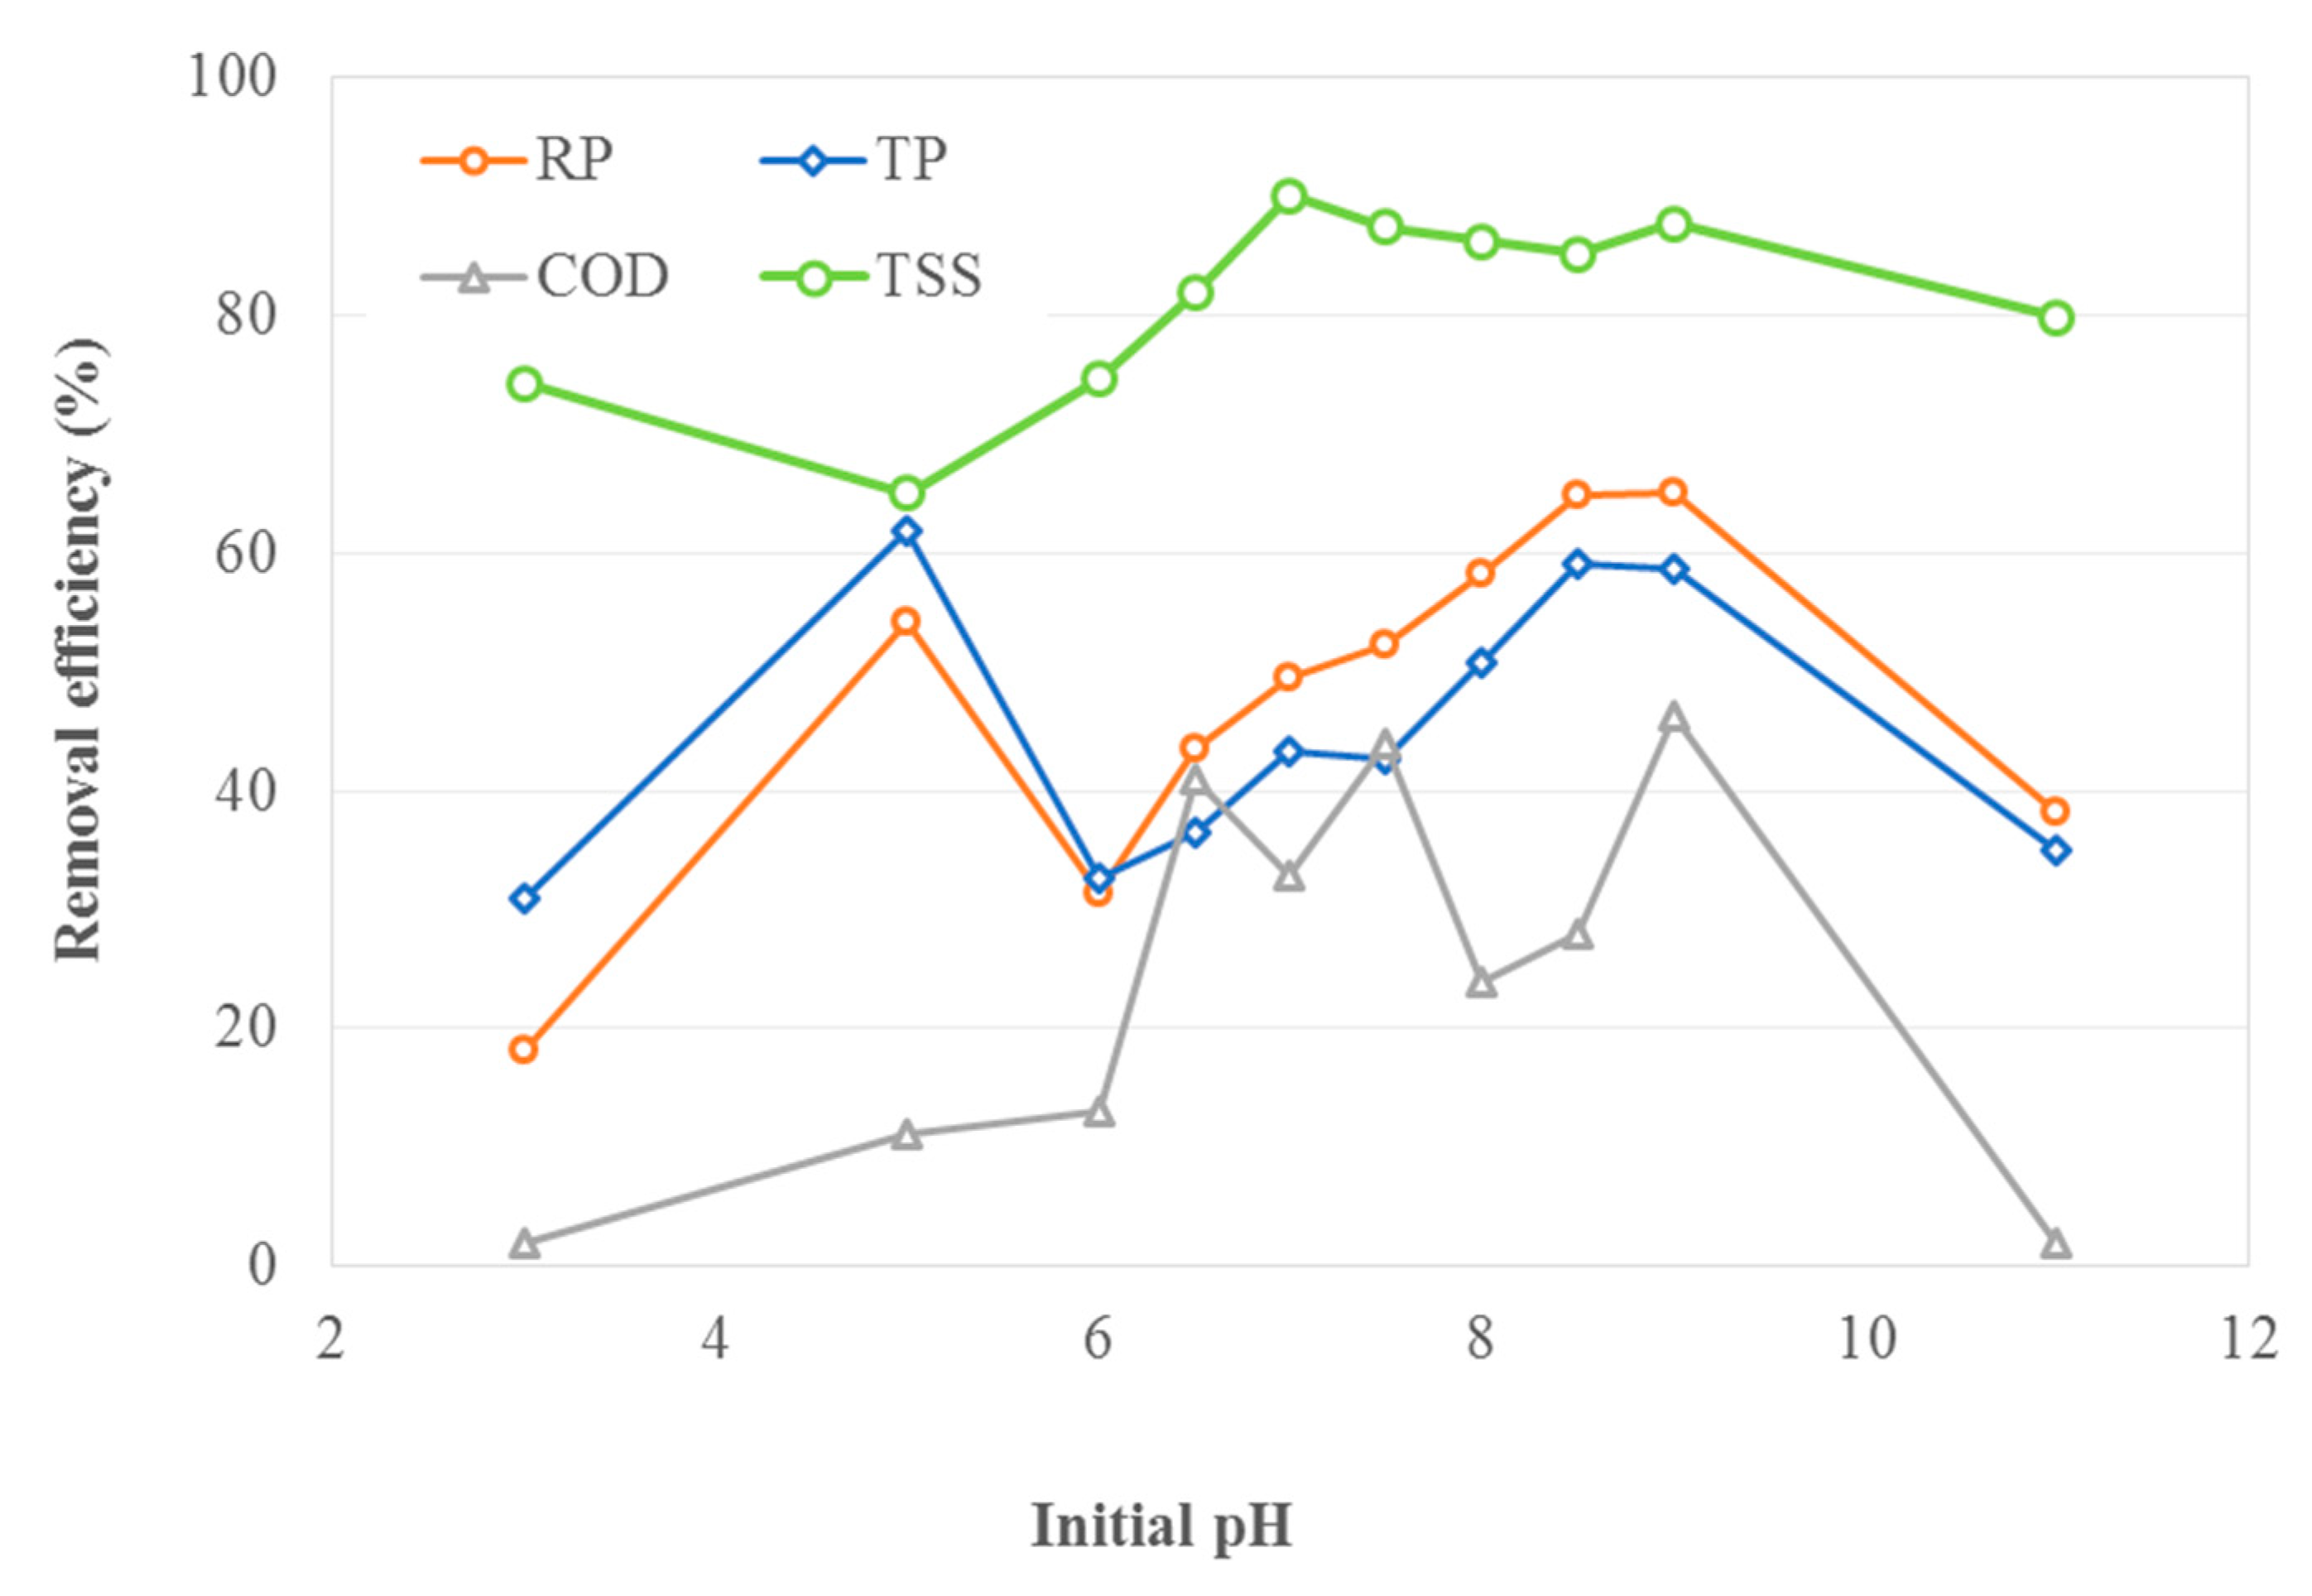
3.1. Effect of Initial pH
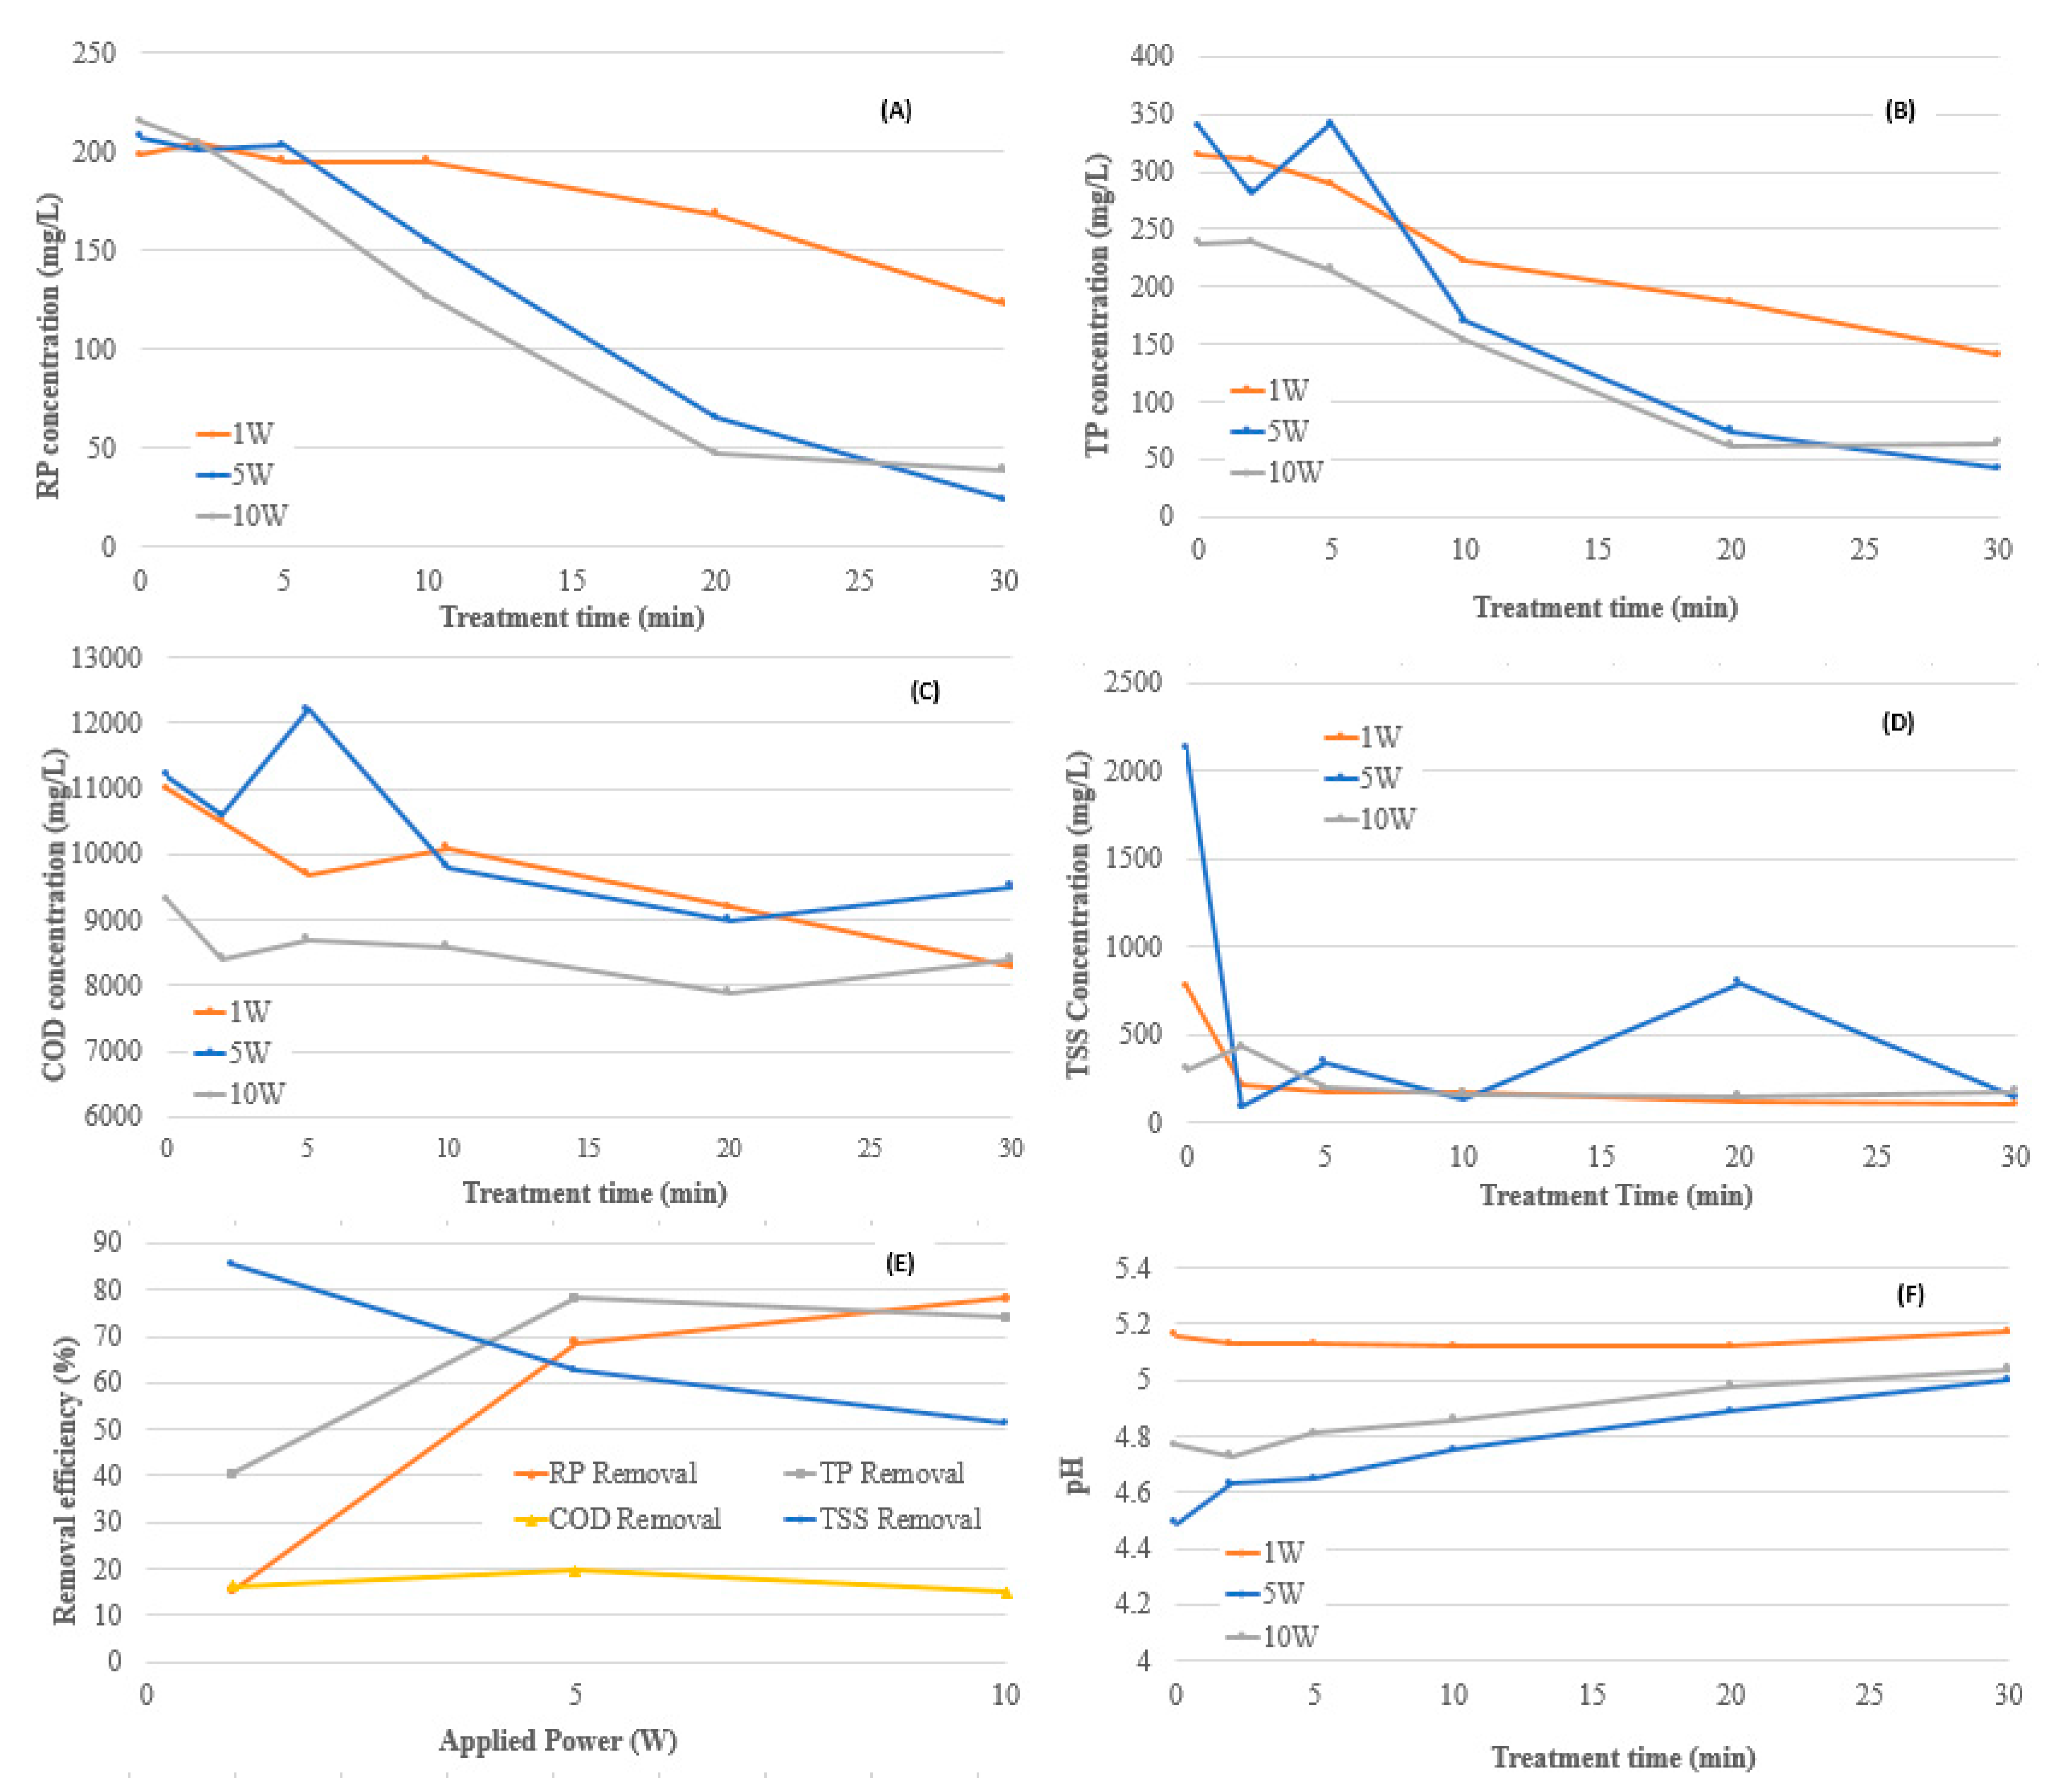
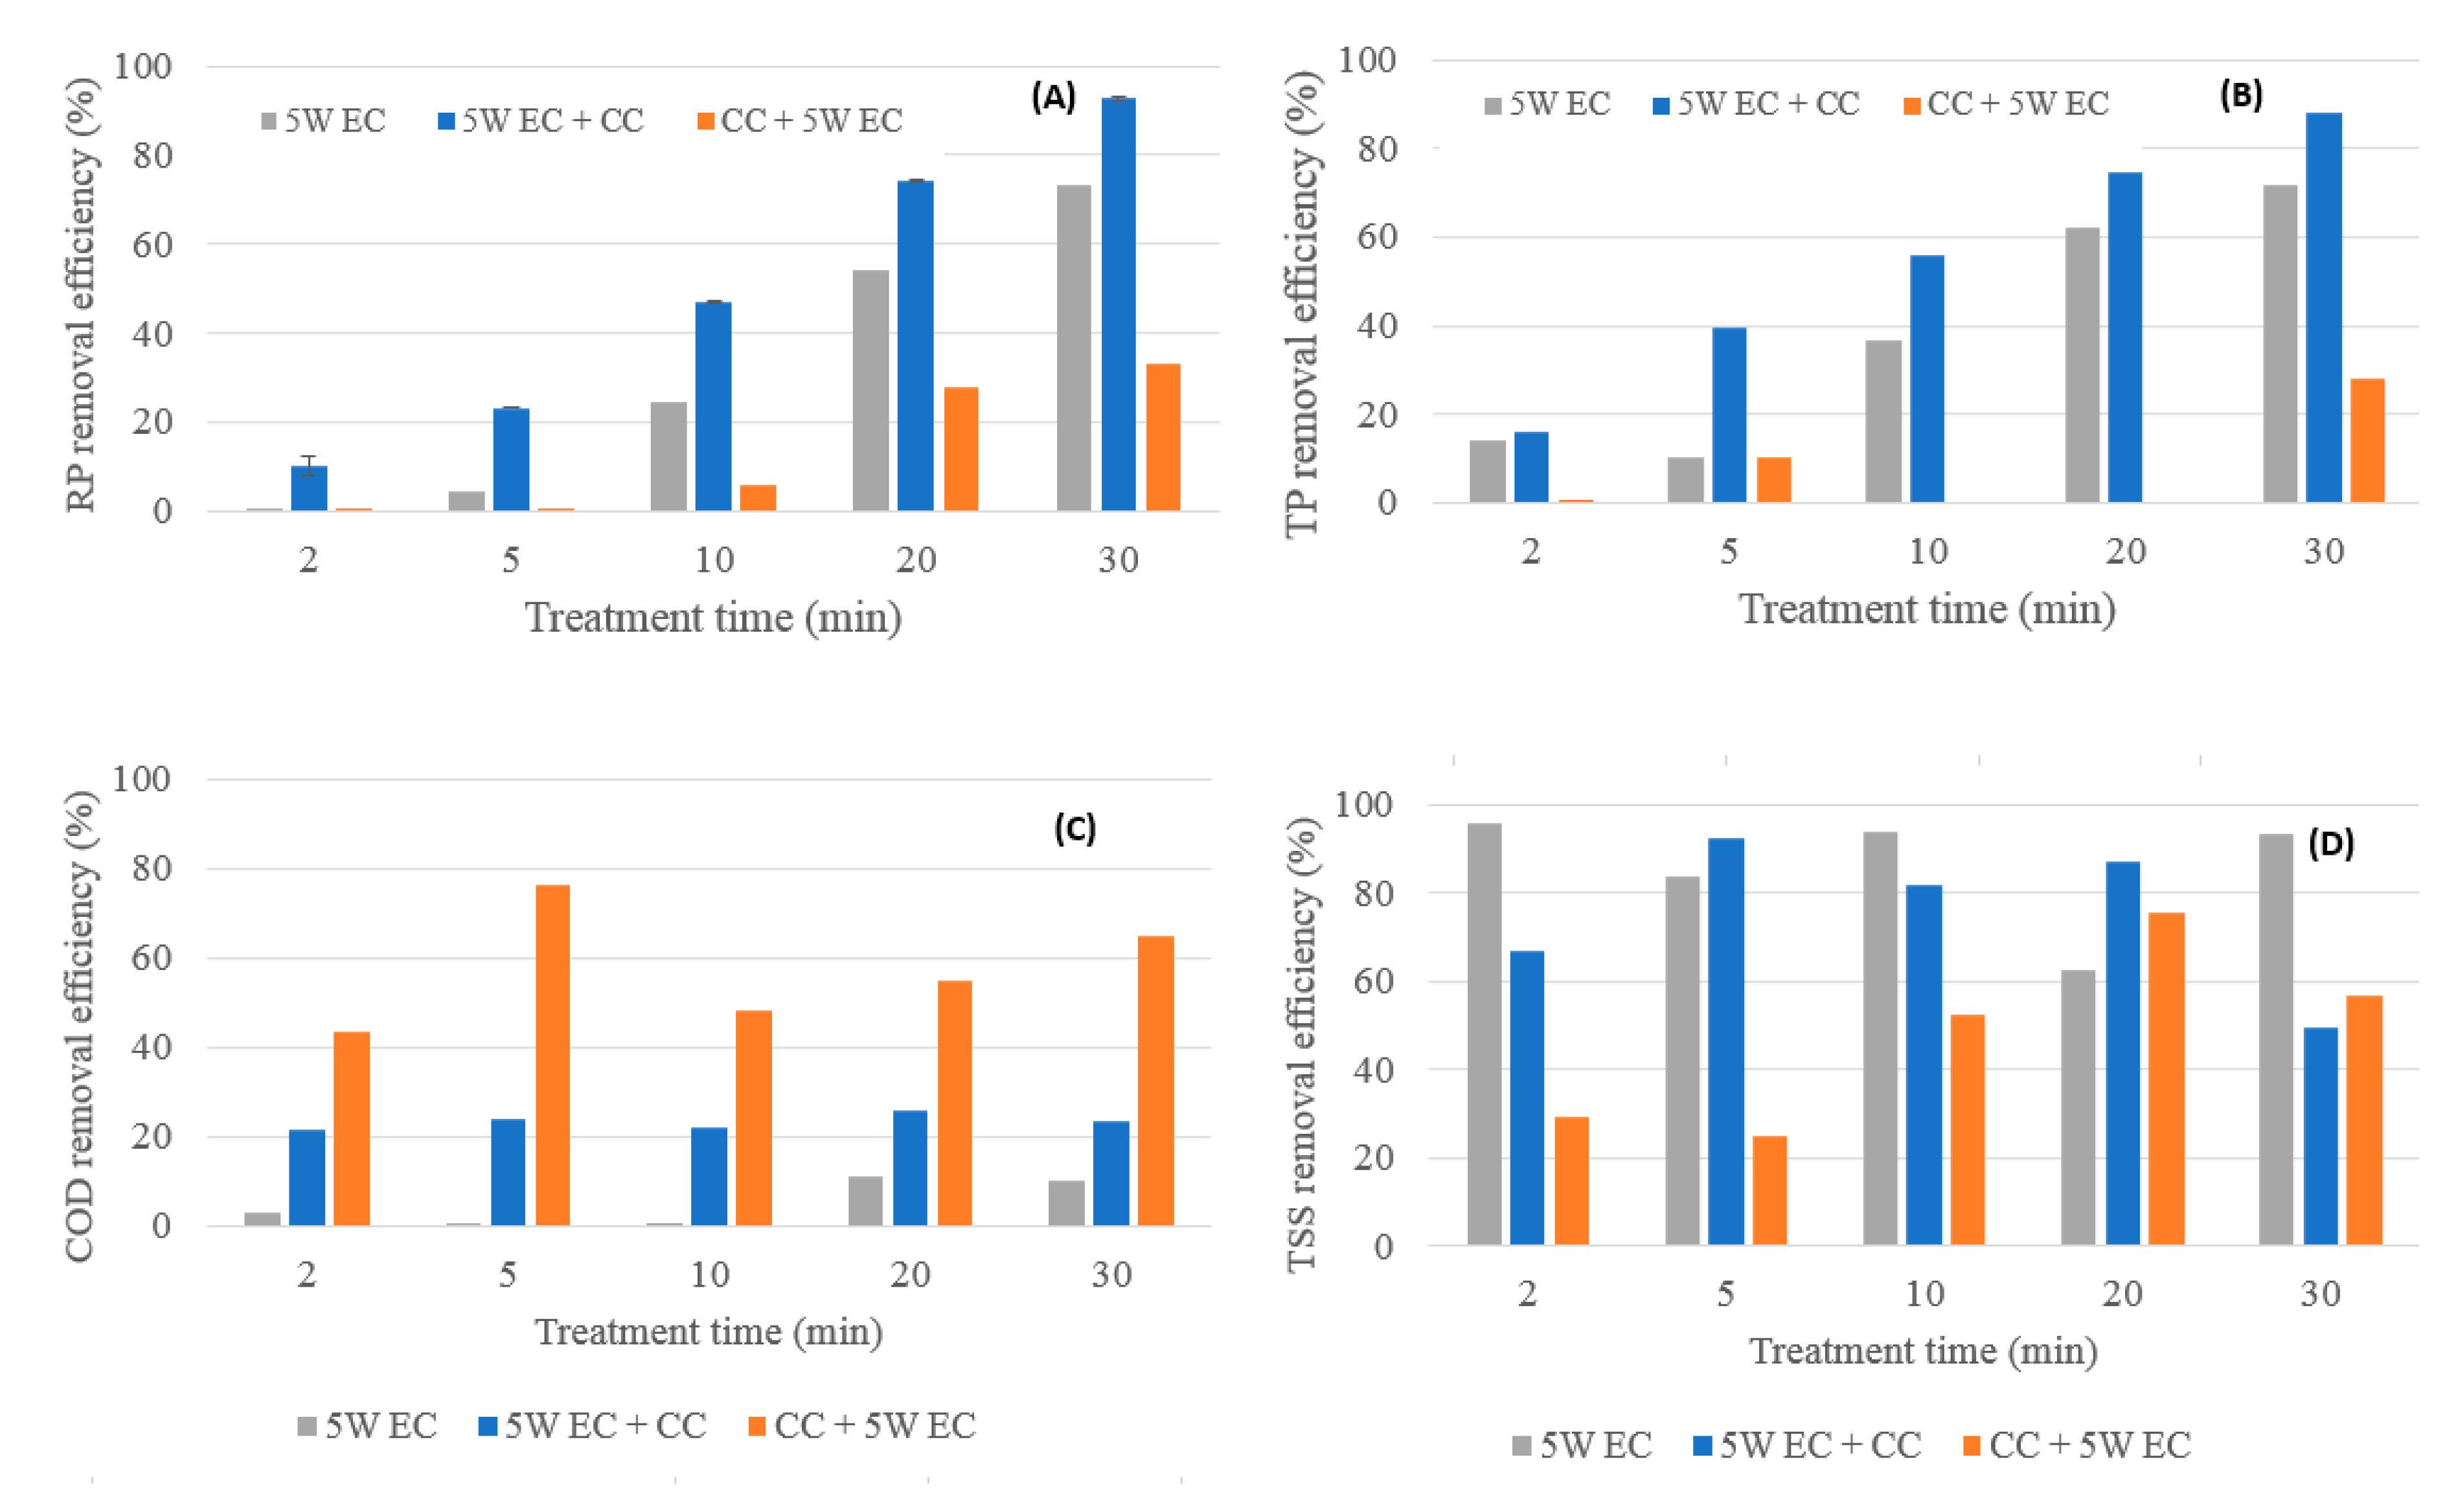
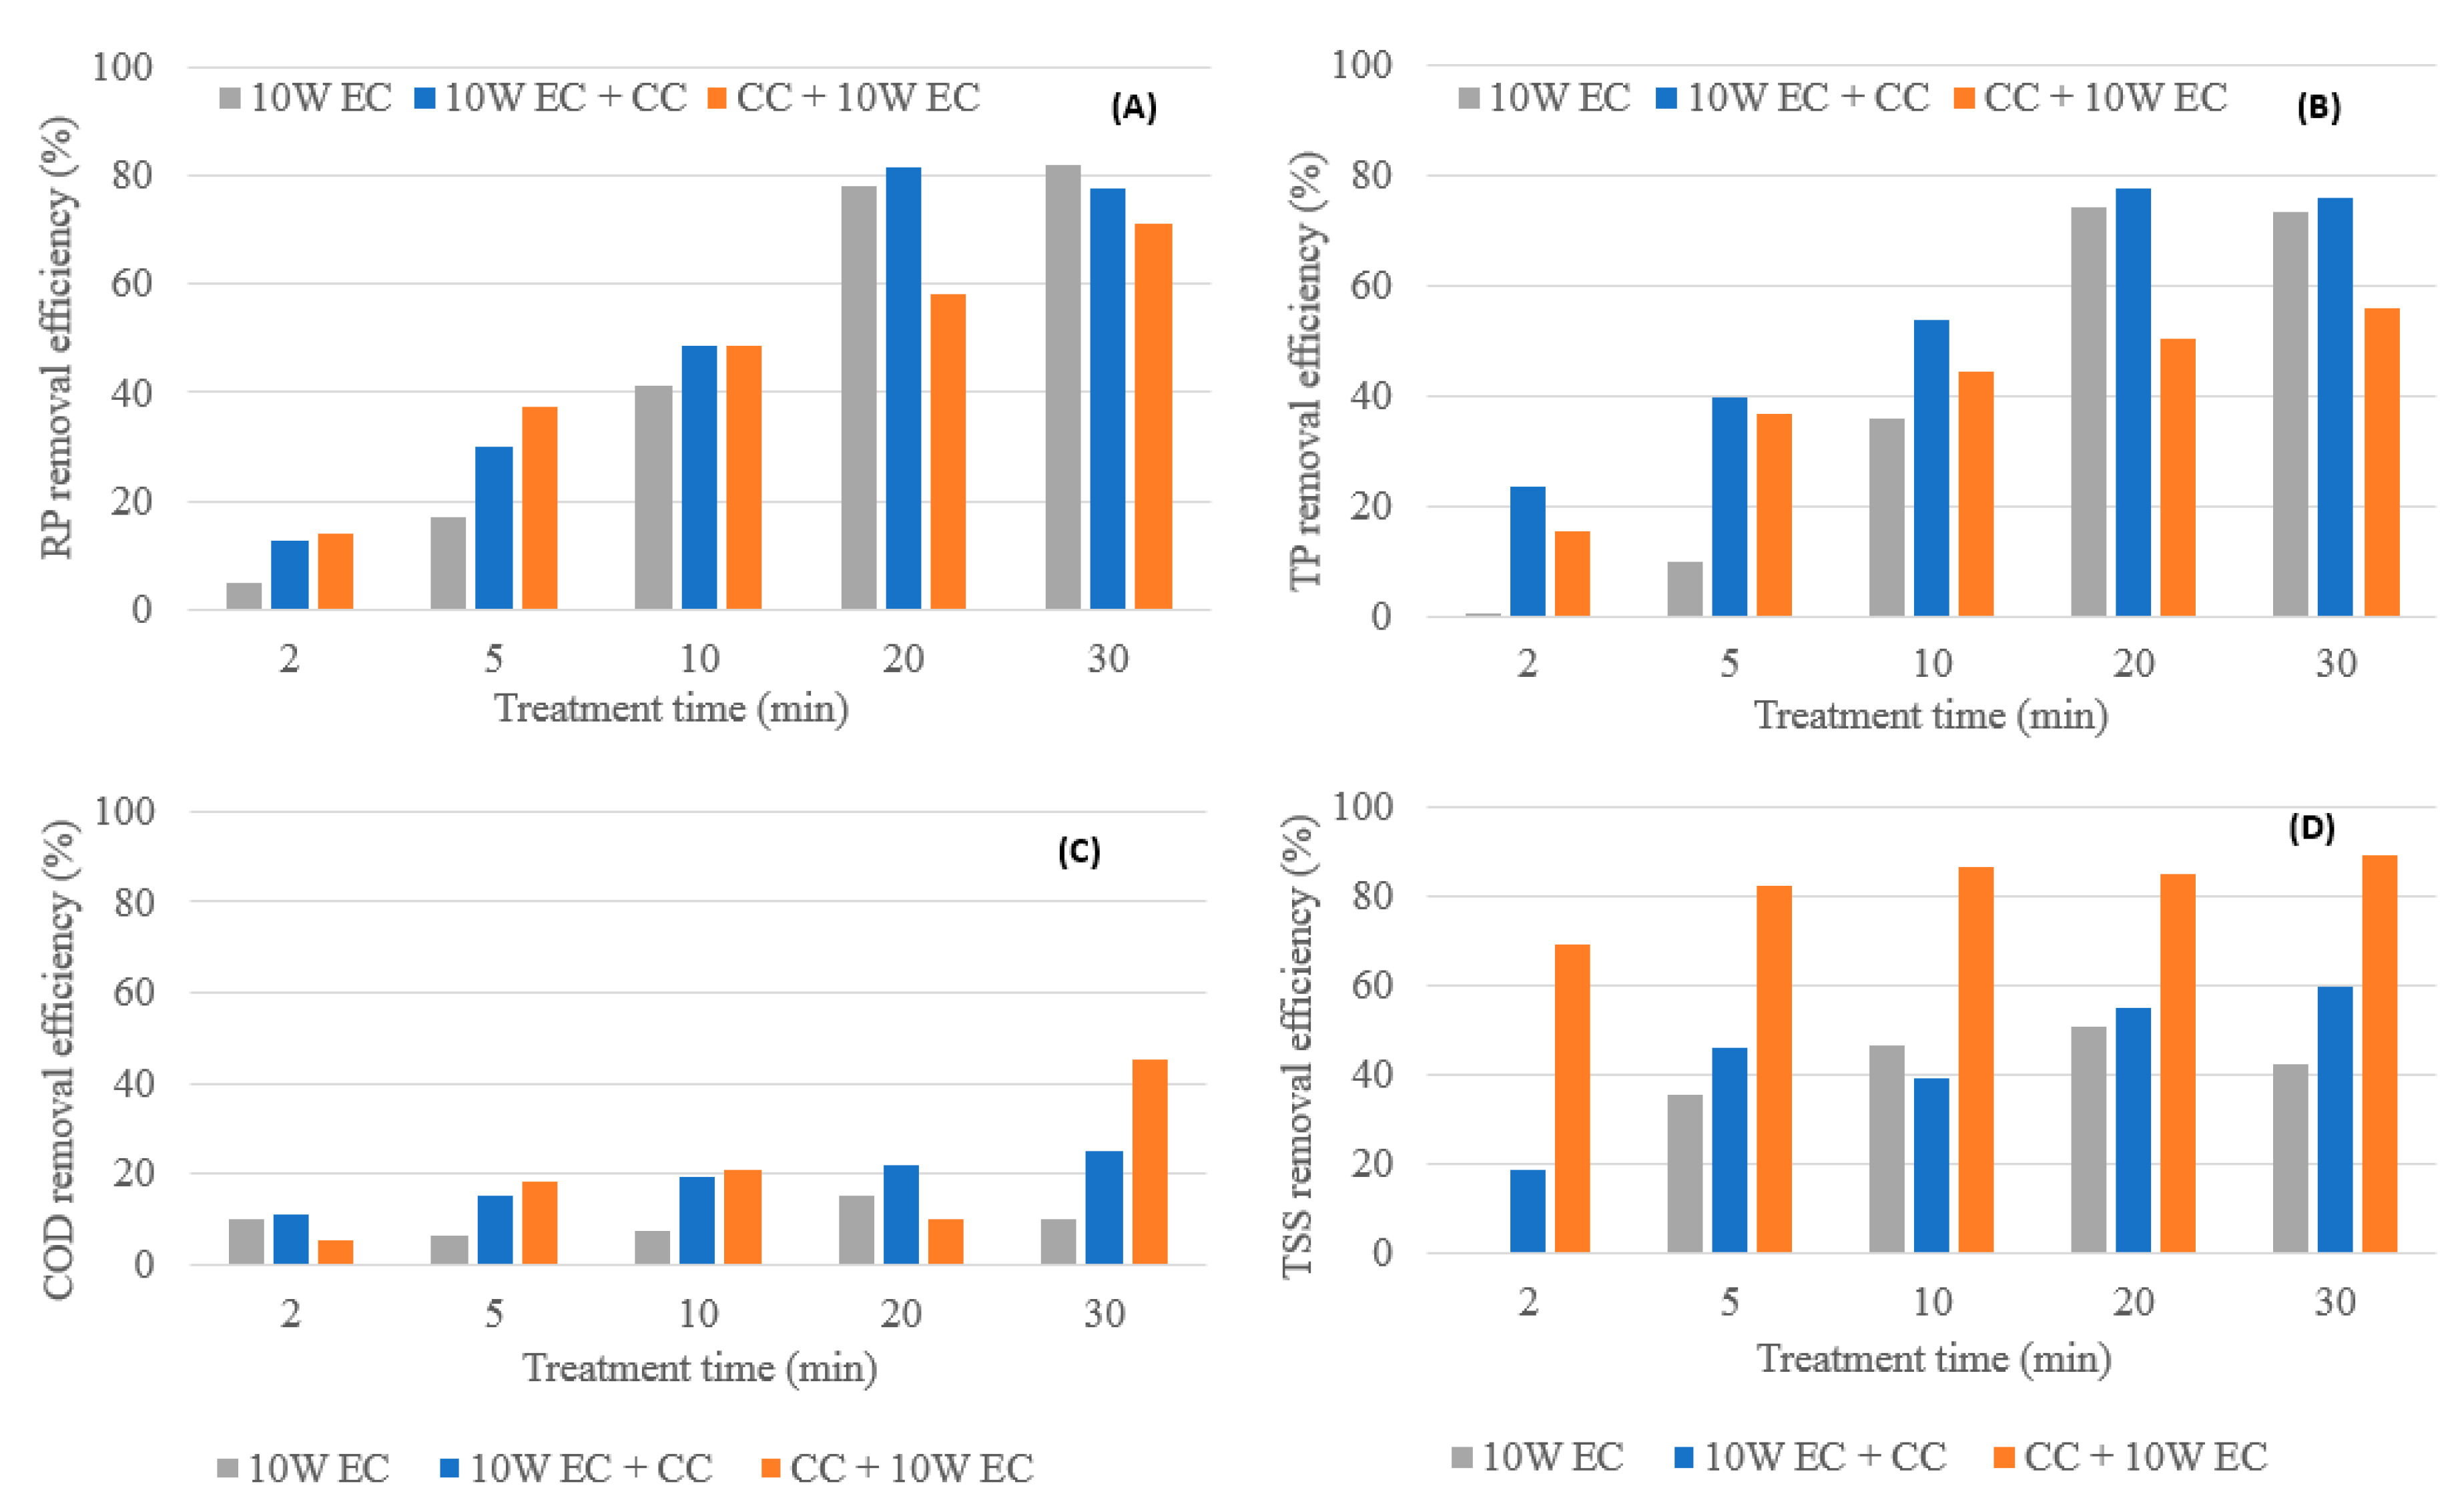
3.2. Effect of Applied Power
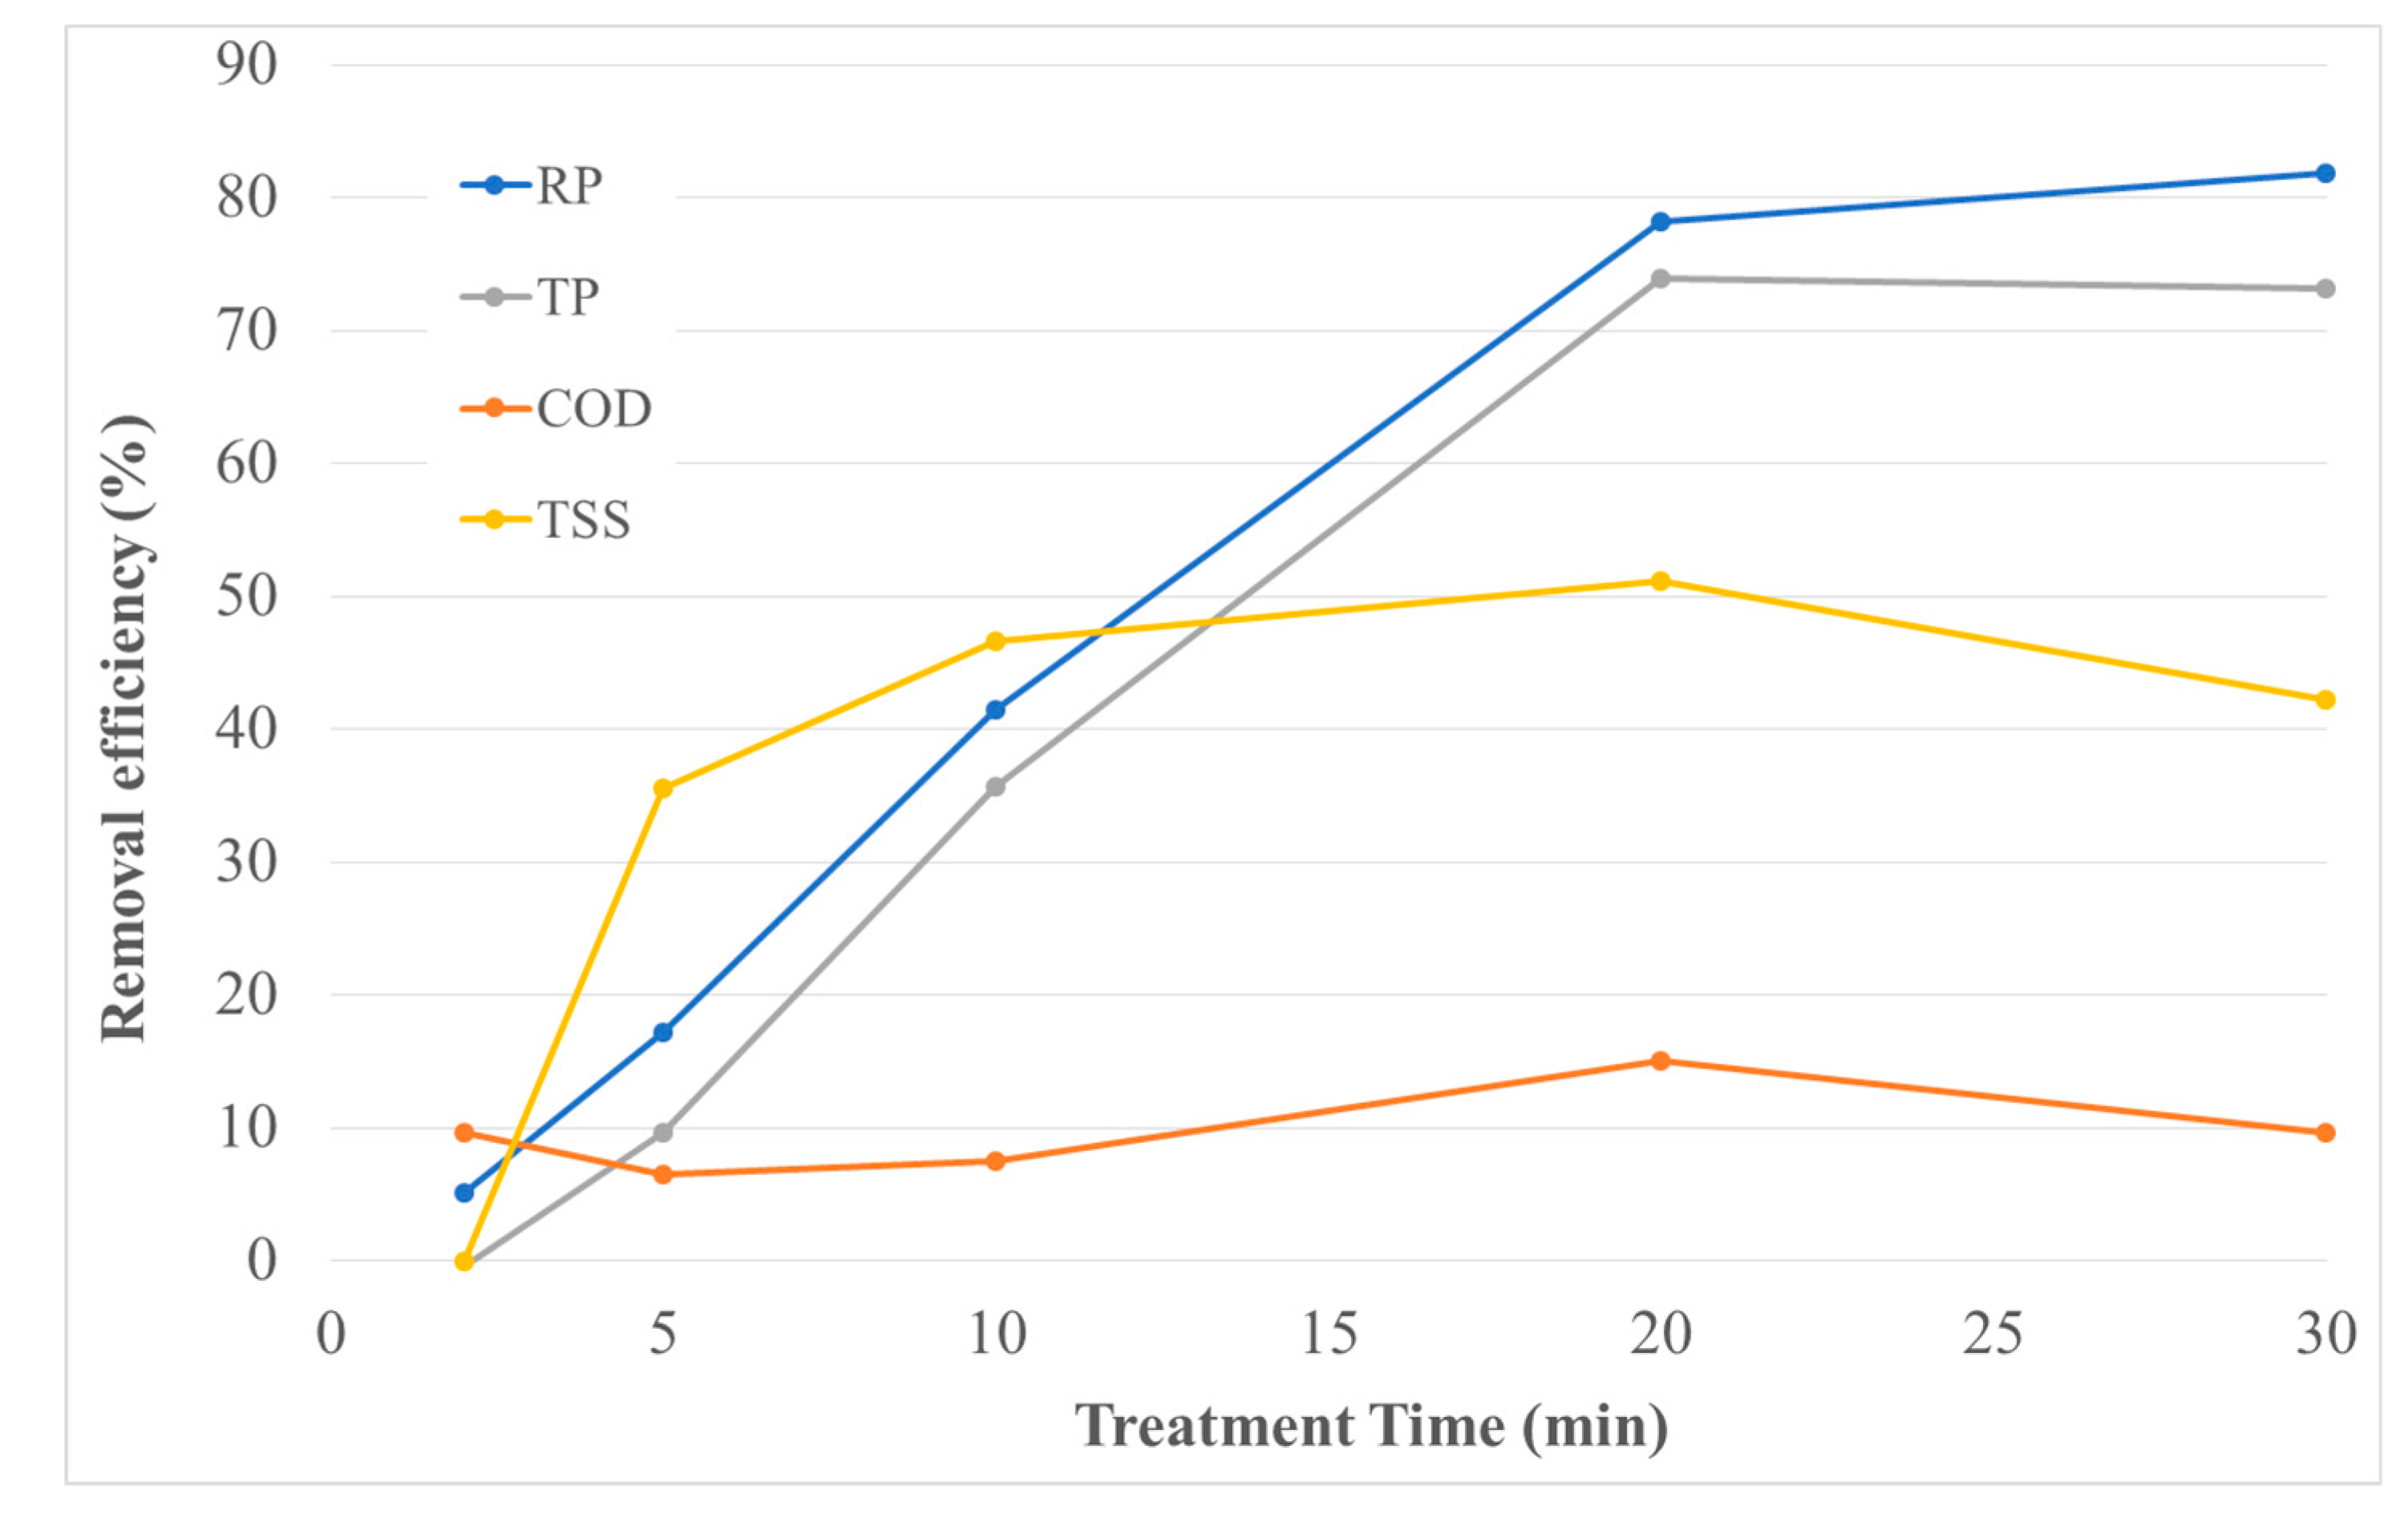
3.3. Effect of Electrolysis Time
3.4. Economic Evaluation
4. Conclusions
Author Contributions
Funding
Conflicts of Interest
References
- Brito, A.G.; Peixoto, J.; Oliveria, J.M.; Oliveria, J.A.; Costa, C.; Nogueira, R.; Rodrigues, A. Brewery and winery wastewater treatment: Some focal points of design and operation. In Utilization of By-Products and Treatment of Waste in the Food Industry; Springer: New York, NY, USA, 2006; pp. 109–131. [Google Scholar] [CrossRef]
- Di Biase, A.; Devlin, T.R.; Kowalski, M.S.; Oleszkiewicz, J.A. Performance and design considerations for an anaerobic moving bed biofilm reactor treating brewery wastewater: Impact of surface area loading rate and temperature. J. Environ. Manag. 2018, 216, 392–398. [Google Scholar] [CrossRef]
- Beer Canada. National Overview. Available online: http://industry.beercanada.com/national-overview (accessed on 12 October 2018).
- Simate, G.; Cluett, J.; Iyuke, S.; Musapatika, E.; Ndlovu, S.; Walubita, L.; Alvarez, A. The treatment of brewery wastewater for reuse: State of the art. Desalination 2011, 273, 235–247. [Google Scholar] [CrossRef]
- Stantec Ltd. Over Strength Surcharge Review for Toronto Water, City of Toronto (Tech.). 2012. Available online: https://www.toronto.ca/legdocs/mmis/2012/pw/bgrd/backgroundfile-50669.pdf (accessed on 12 October 2018).
- Eyvaz, M. Treatment of Brewery Wastewater with Electrocoagulation: Improving the process performance by using alternating pulse current. Int. J. Electrochem. Sci. 2016, 11, 4988–5008. [Google Scholar] [CrossRef]
- Tejedor-Sanz, S.; Ortiz, J.M.; Esteve-Núñez, A. Merging microbial electrochemical systems with electrocoagulation pretreatment for achieving a complete treatment of brewery wastewater. Chem. Eng. J. 2017, 330, 1068–1074. [Google Scholar] [CrossRef]
- Hakizimana, J.N.; Gourich, B.; Chafi, M.; Stiriba, Y.; Vial, C.; Drogui, P.; Naja, J. Electrocoagulation process in water treatment: A review of electrocoagulation modeling approaches. Desalination 2017, 404, 1–21. [Google Scholar] [CrossRef]
- Chen, G.; Chen, X.; Yue, P.L. Electrocoagulation and electrofloatation of restaurant wastewater. J. Environ. Eng. 2000, 126, 858–863. [Google Scholar] [CrossRef]
- Brahmi, K.; Bouguerra, W.; Hamrouni, B.; Elaloui, E.; Loungou, M.; Tlili, Z. Investigation of electrocoagulation reactor design parameters effect on the removal of cadmium from synthetic and phosphate industrial wastewater. Arab. J. Chem. 2015, 12, 1848–1859. [Google Scholar] [CrossRef]
- Harif, T.; Khai, M.; Adin, A. Electrocoagulation versus chemical coagulation: Coagulation/flocculation mechanisms and resulting floc characteristics. Water Resour. 2012, 46, 3177–3188. [Google Scholar] [CrossRef]
- Shamaei, L.; Khorshidi, B.; Perdicakis, B.; Sadrzadeh, M. Treatment of oil sands produced water using combined electrocoagulation and chemical coagulation techniques. Sci. Total Environ. 2018, 645, 560–572. [Google Scholar] [CrossRef]
- Elazzouzi, M.; El Kasmi, A.; Haboubi, K.; Elyoubi, M.S. A novel electrocoagulation process using insulated edges of Al electrodes for enhancement of urban wastewater treatment: Techno-economic study. Process Saf. Environ. Prot. 2018, 116, 506–515. [Google Scholar] [CrossRef]
- Can, O.T.; Kobya, M.; Demirbas, E.; Bayramoglu, M. Treatment of the textile wastewater by combined electrocoagulation. Chemosphere 2006, 62, 181–187. [Google Scholar] [CrossRef] [PubMed]
- Attour, A.; Touati, M.; Tlili, M.; Amor, M.B.; Lapicque, F.; Leclerc, J.-P. Influence of operating parameters on phosphate removal from water by electrocoagulation using aluminum electrodes. Sep. Purif. Technol. 2014, 123, 124–129. [Google Scholar] [CrossRef]
- Akbal, F.; Camci, S. Comparison of electrocoagulation and chemical coagulation for heavy metal removal. Chem. Eng. Technol. 2010, 33, 1655–1664. [Google Scholar] [CrossRef]
- Liu, H.; Zhao, X.; Qu, J. Electrocoagulation in Water Treatment. In Electrochemistry for the Environment; Comninellis, C., Chen, G., Eds.; Springer: New York, NY, USA, 2010. [Google Scholar] [CrossRef]
- El-Ashtoukhy, E.-S.Z.; El-Taweel, Y.A.; Abdelwahab, O.; Nassef, E.M. Treatment of petrochemical wastewater containing phenolic compounds by electrocoagulation using a fixed bed electrochemical reactor. Int. J. Electrochem. Sci. 2013, 8, 1534–1550. Available online: http://www.electrochemsci.org/papers/vol8/80101534.pdf (accessed on 12 October 2018).
- Dizge, N.; Akarsu, C.; Ozay, Y.; Gulsen, H.E.; Adiguzel, S.K.; Mazmanci, M.A. Sono-assisted electrocoagulation and cross-flow membrane processes for brewery wastewater treatment. J. Water Process Eng. 2018, 21, 52–60. [Google Scholar] [CrossRef]
- Franco, D.; Lee, J.; Arbelaez, S.; Cohen, N.; Kim, J.-Y. Removal of phosphate from surface and wastewater via electrocoagulation. Ecol. Eng. 2017, 108, 589–596. [Google Scholar] [CrossRef]
- Sahu, O.; Mazumdar, B.; Chaudhari, P.K. Treatment of wastewater by electrocoagulation: A review. Environ. Sci. Pollut. Res. 2014, 21, 2397–2413. [Google Scholar] [CrossRef]
- Shalaby, A.; Nassef, E.; Mubark, A.; Hussein, M. Phosphate removal from wastewater by electrocoagulation using aluminum electrodes. Am. J. Environ. Eng. Sci. 2014, 1, 90–98. Available online: http://www.openscienceonline.com/journal/ajees (accessed on 12 October 2018).
- Ni’am, M.-F.; Othman, F.; Sohaili, J.; Fauzia, Z. Electrocoagulation technique in enhancing COD and suspended solids removal to improve wastewater quality. Water Sci. Technol. 2007, 56, 47–53. [Google Scholar] [CrossRef]
- Ontario Energy Board. Time-of-Use Rates for Electricity, November 2018. Available online: https://www.guelphhydro.com/en/rates-and-service-charges/time-of-use-rates-for-electricity.aspx (accessed on 9 February 2019).
- Murthy, Z.V.P.; Nancy, C.; Kant, A. Separation of pollutants from restaurant wastewater by electrocoagulation. Sep. Sci. Technol. 2007, 42, 819–833. [Google Scholar] [CrossRef]
- Choi, H.-J. Parametric study of brewery wastewater effluent treatment using Chlorella vulgaris microalgae. Environ. Eng. Res. 2016, 21, 401–408. [Google Scholar] [CrossRef]


© 2020 by the authors. Licensee MDPI, Basel, Switzerland. This article is an open access article distributed under the terms and conditions of the Creative Commons Attribution (CC BY) license (http://creativecommons.org/licenses/by/4.0/).
Share and Cite
Swain, K.; Abbassi, B.; Kinsley, C. Combined Electrocoagulation and Chemical Coagulation in Treating Brewery Wastewater. Water 2020, 12, 726. https://doi.org/10.3390/w12030726
Swain K, Abbassi B, Kinsley C. Combined Electrocoagulation and Chemical Coagulation in Treating Brewery Wastewater. Water. 2020; 12(3):726. https://doi.org/10.3390/w12030726
Chicago/Turabian StyleSwain, Kimberly, Bassim Abbassi, and Chris Kinsley. 2020. "Combined Electrocoagulation and Chemical Coagulation in Treating Brewery Wastewater" Water 12, no. 3: 726. https://doi.org/10.3390/w12030726
APA StyleSwain, K., Abbassi, B., & Kinsley, C. (2020). Combined Electrocoagulation and Chemical Coagulation in Treating Brewery Wastewater. Water, 12(3), 726. https://doi.org/10.3390/w12030726