Rethinking the Framework of Smart Water System: A Review


Abstract
1. Introduction
2. Literature Review of SWS
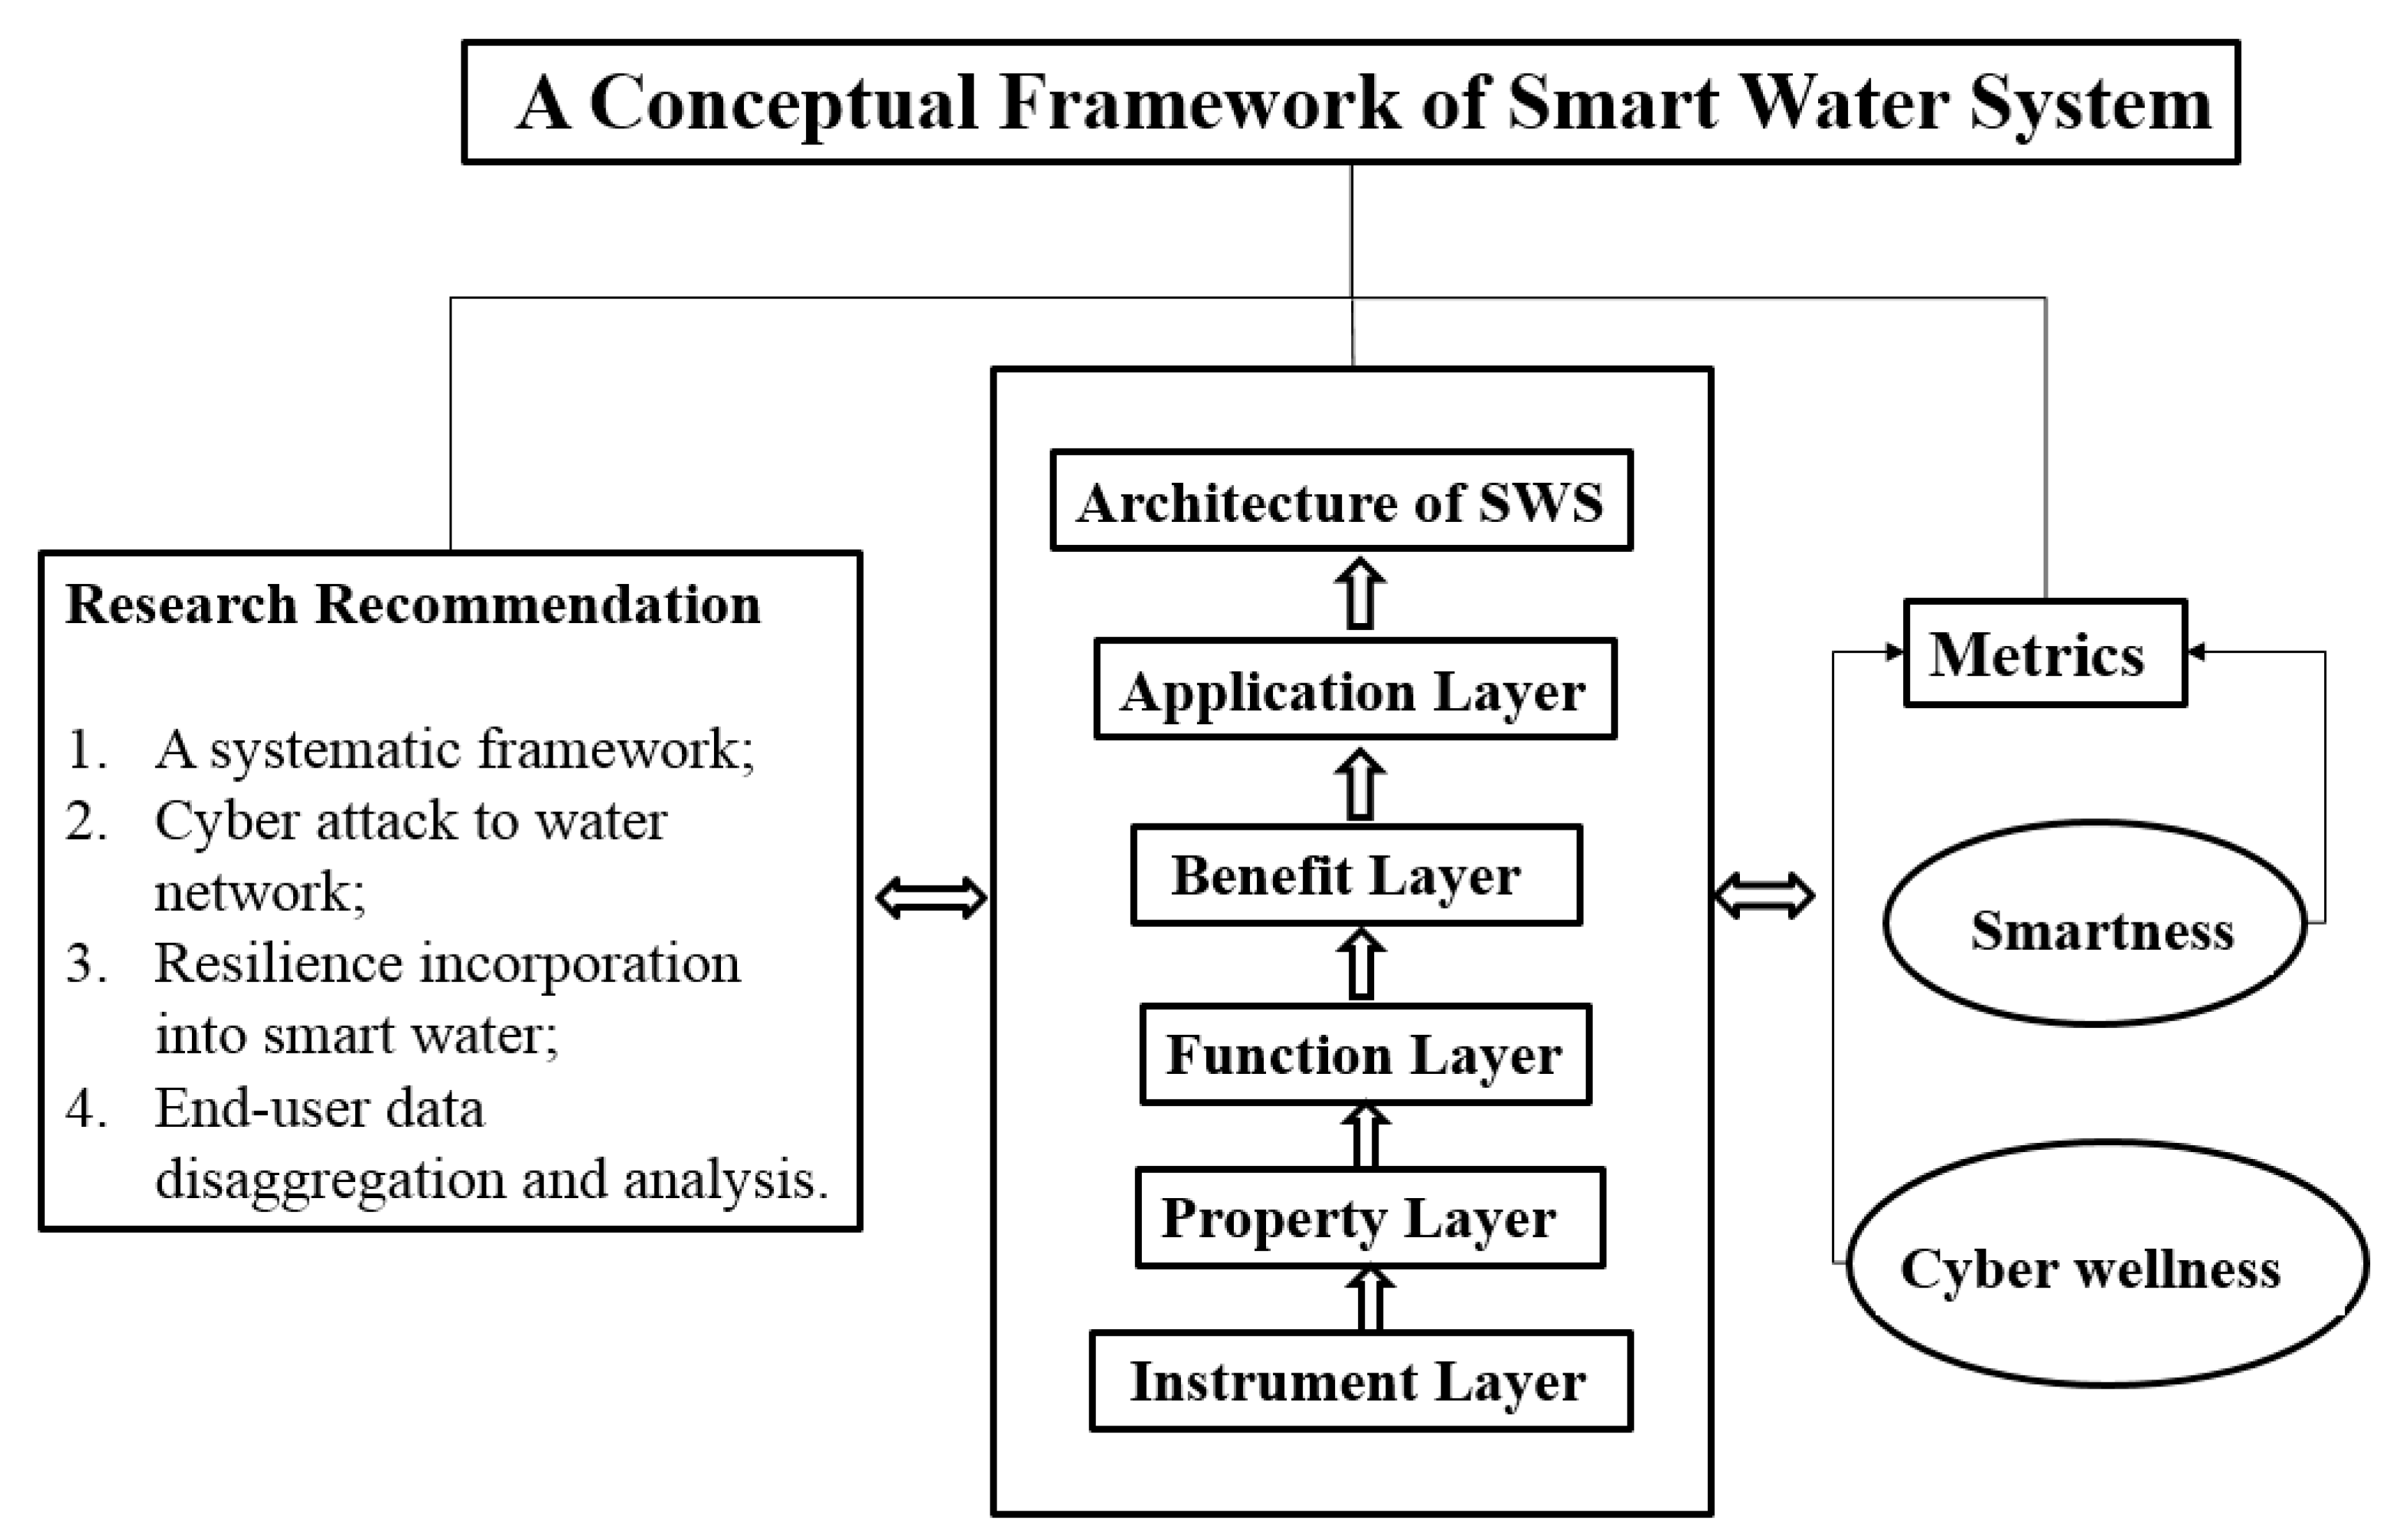
3. A Systematic Framework of SWS
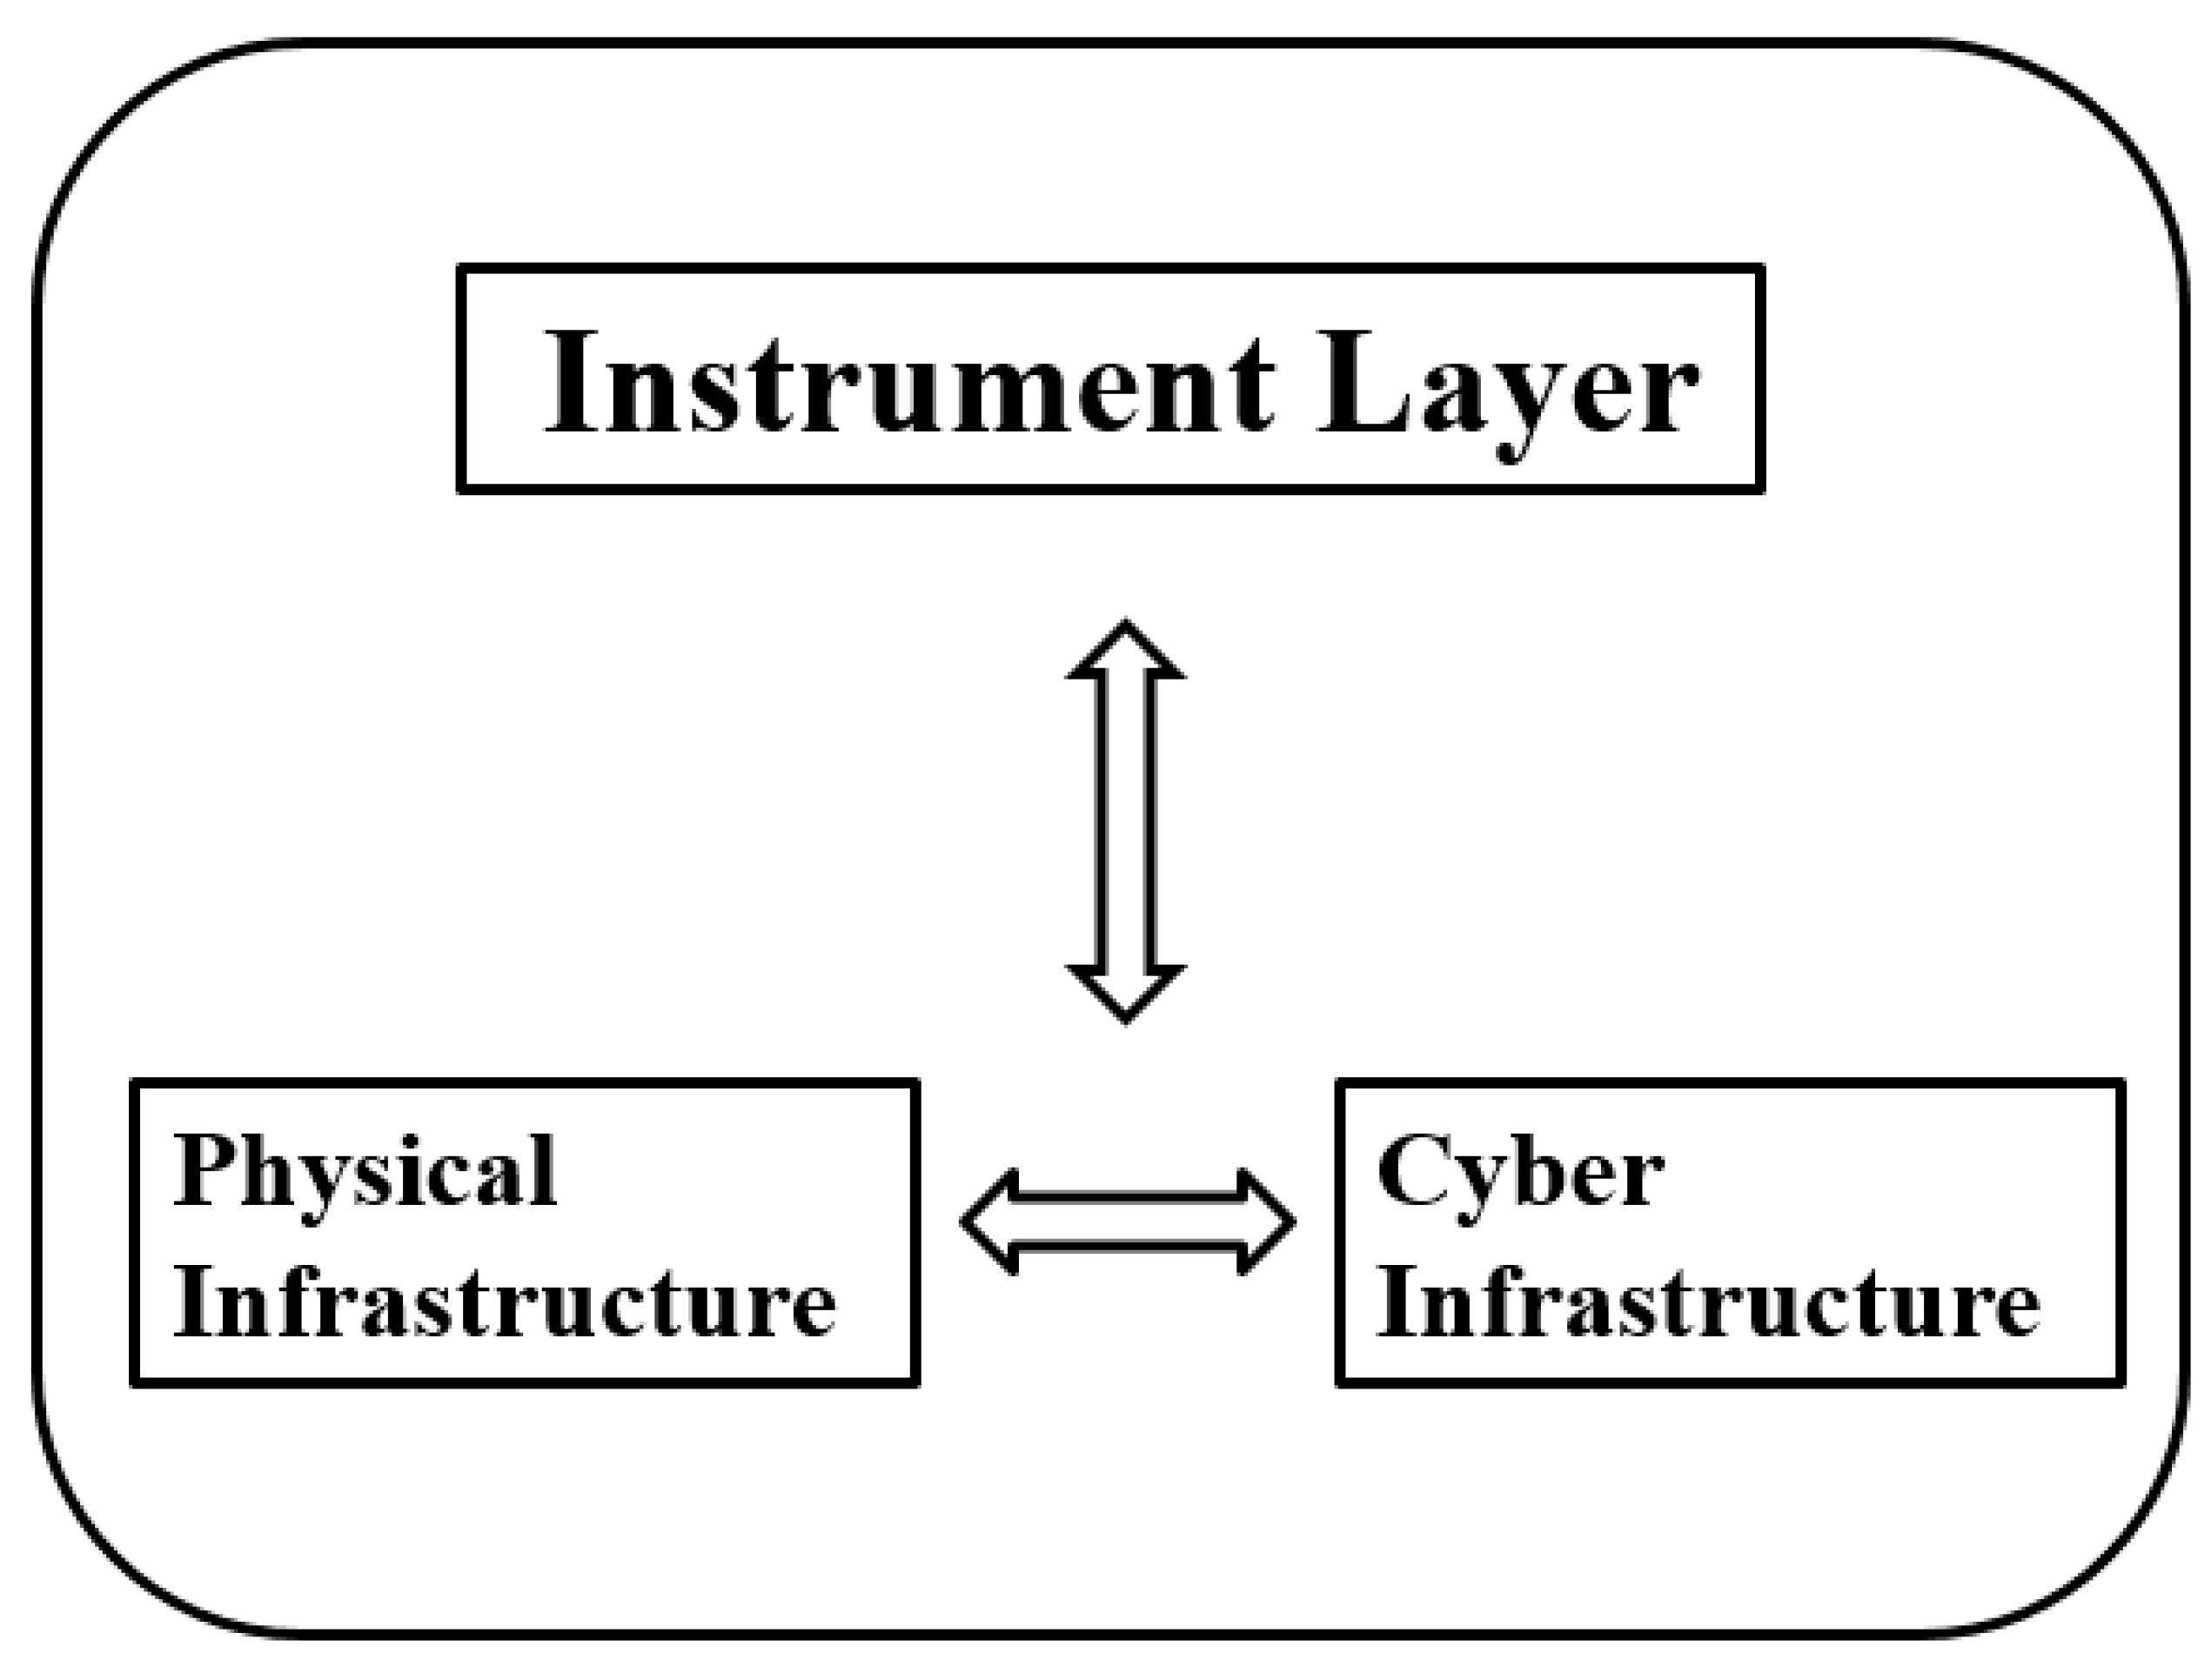
3.1. Instruments Layer
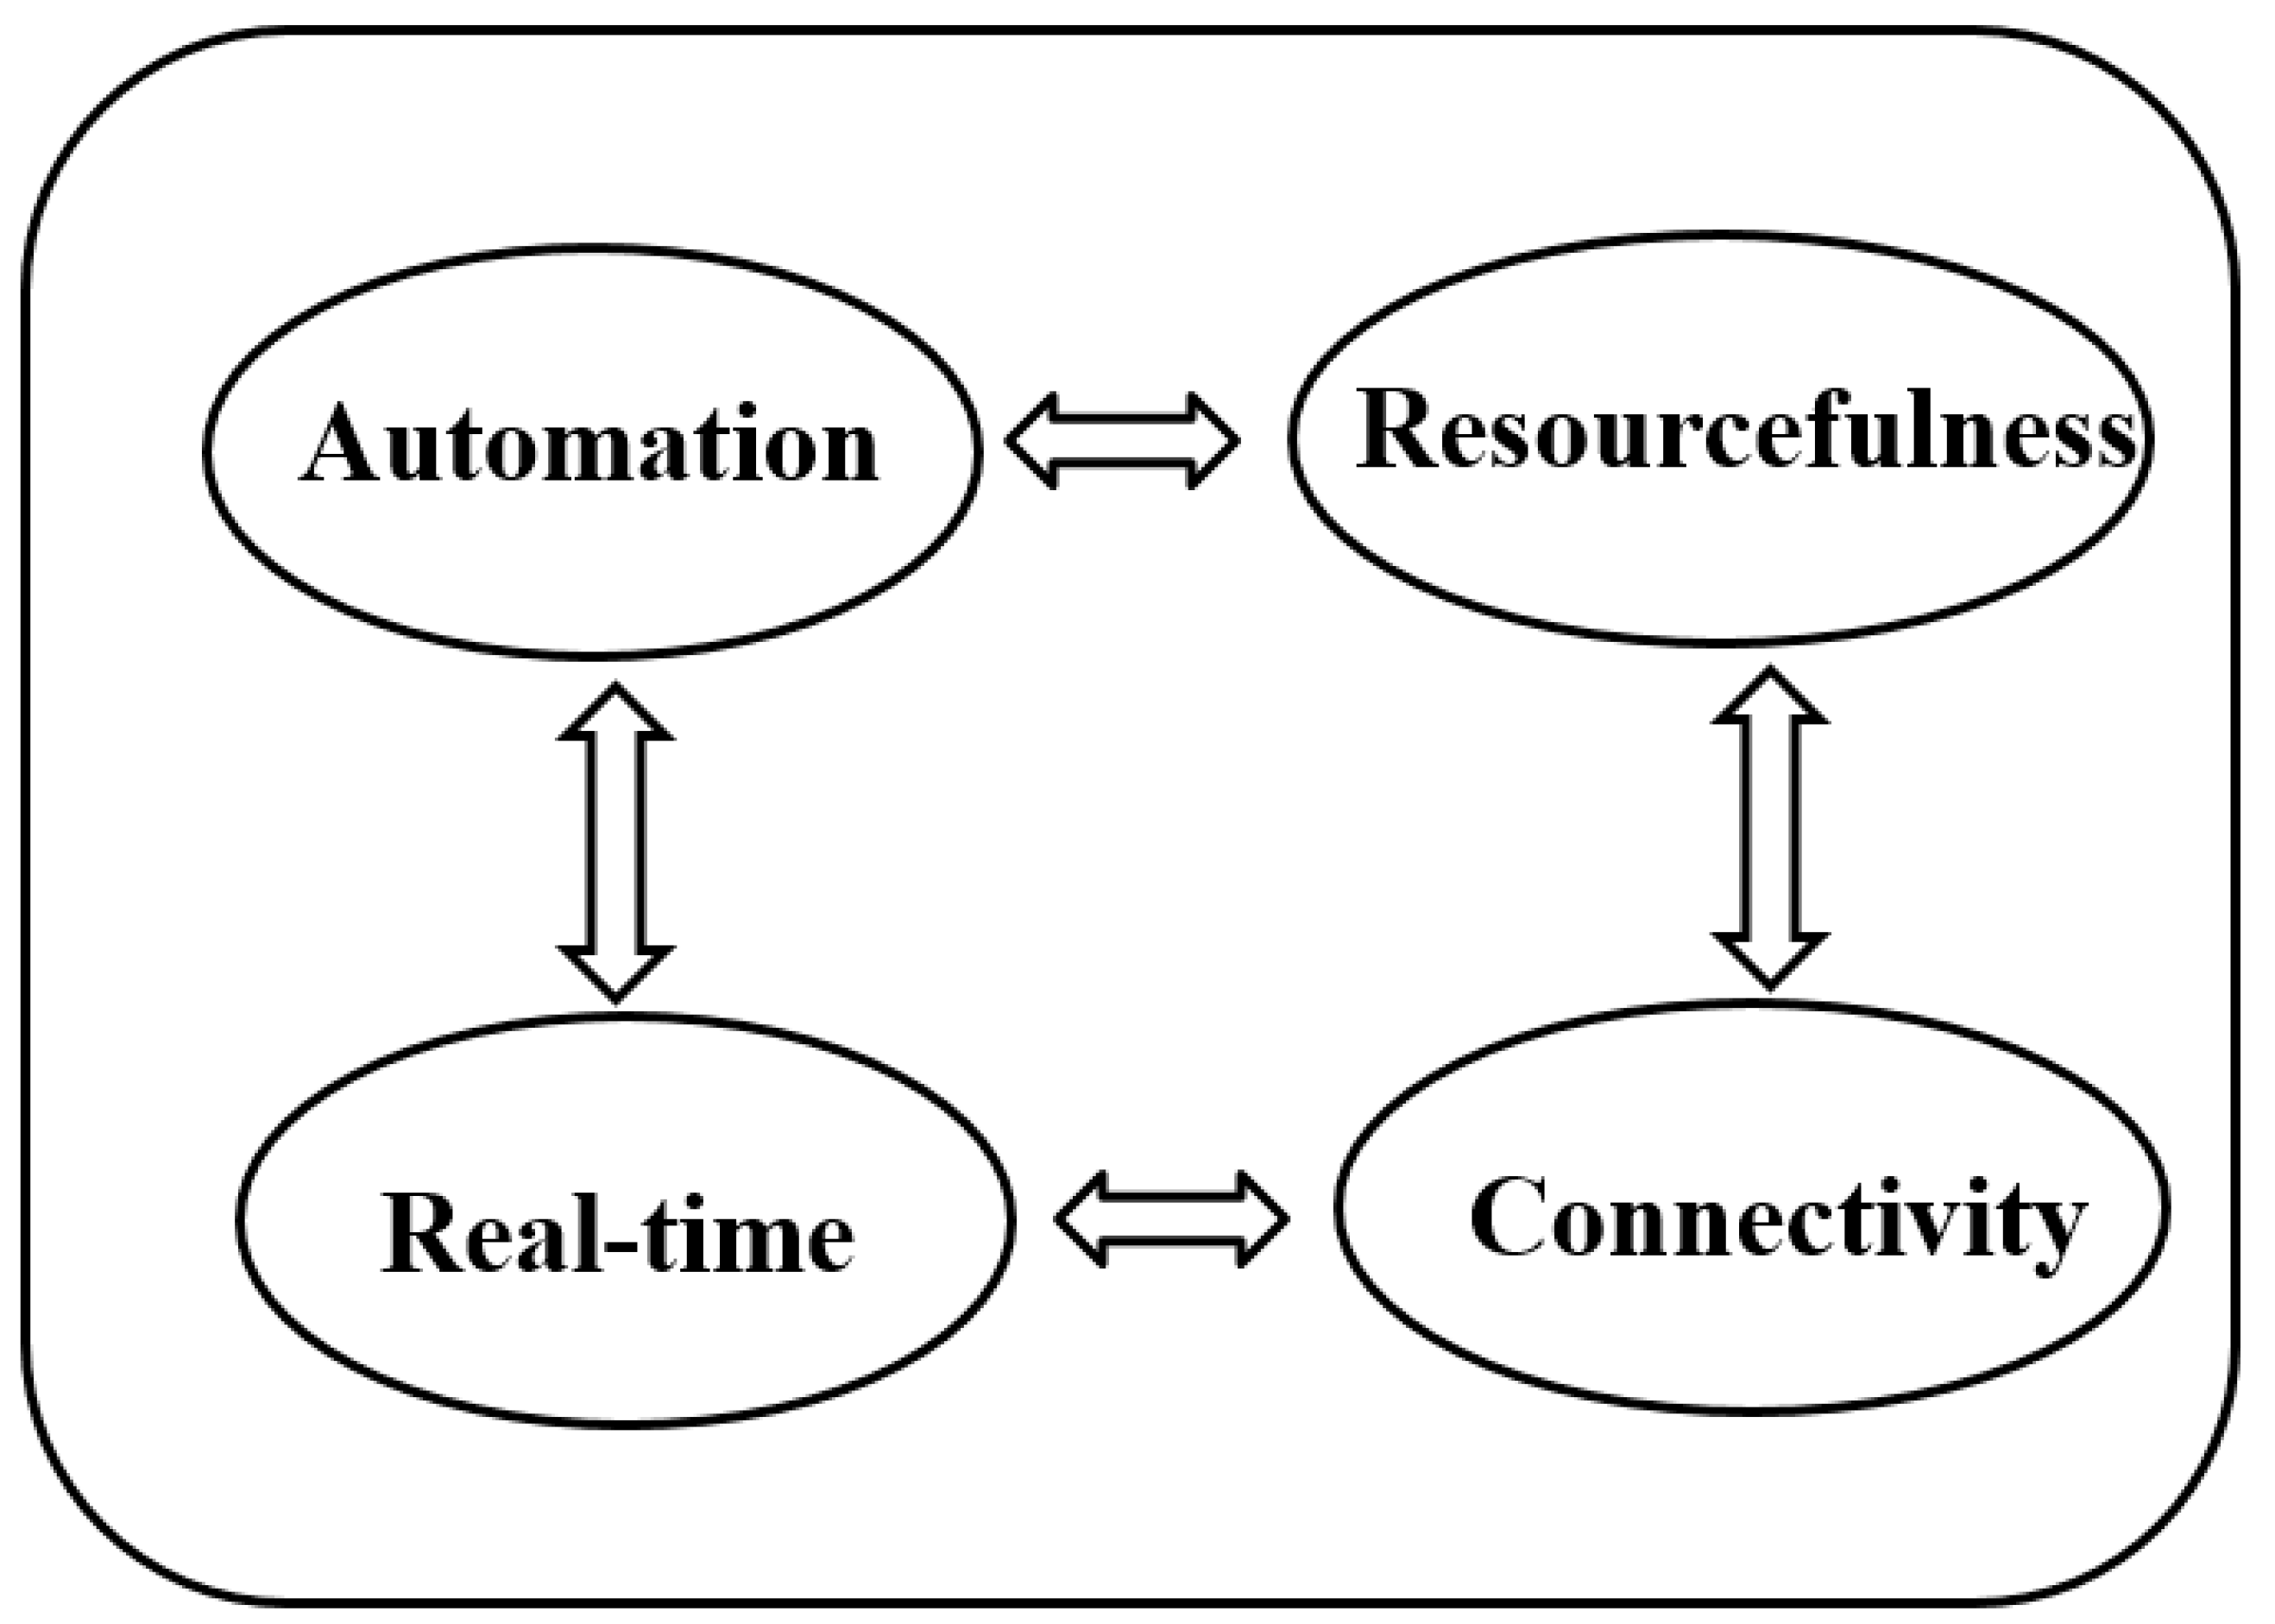
3.2. Property Layer
3.3. Function Layer
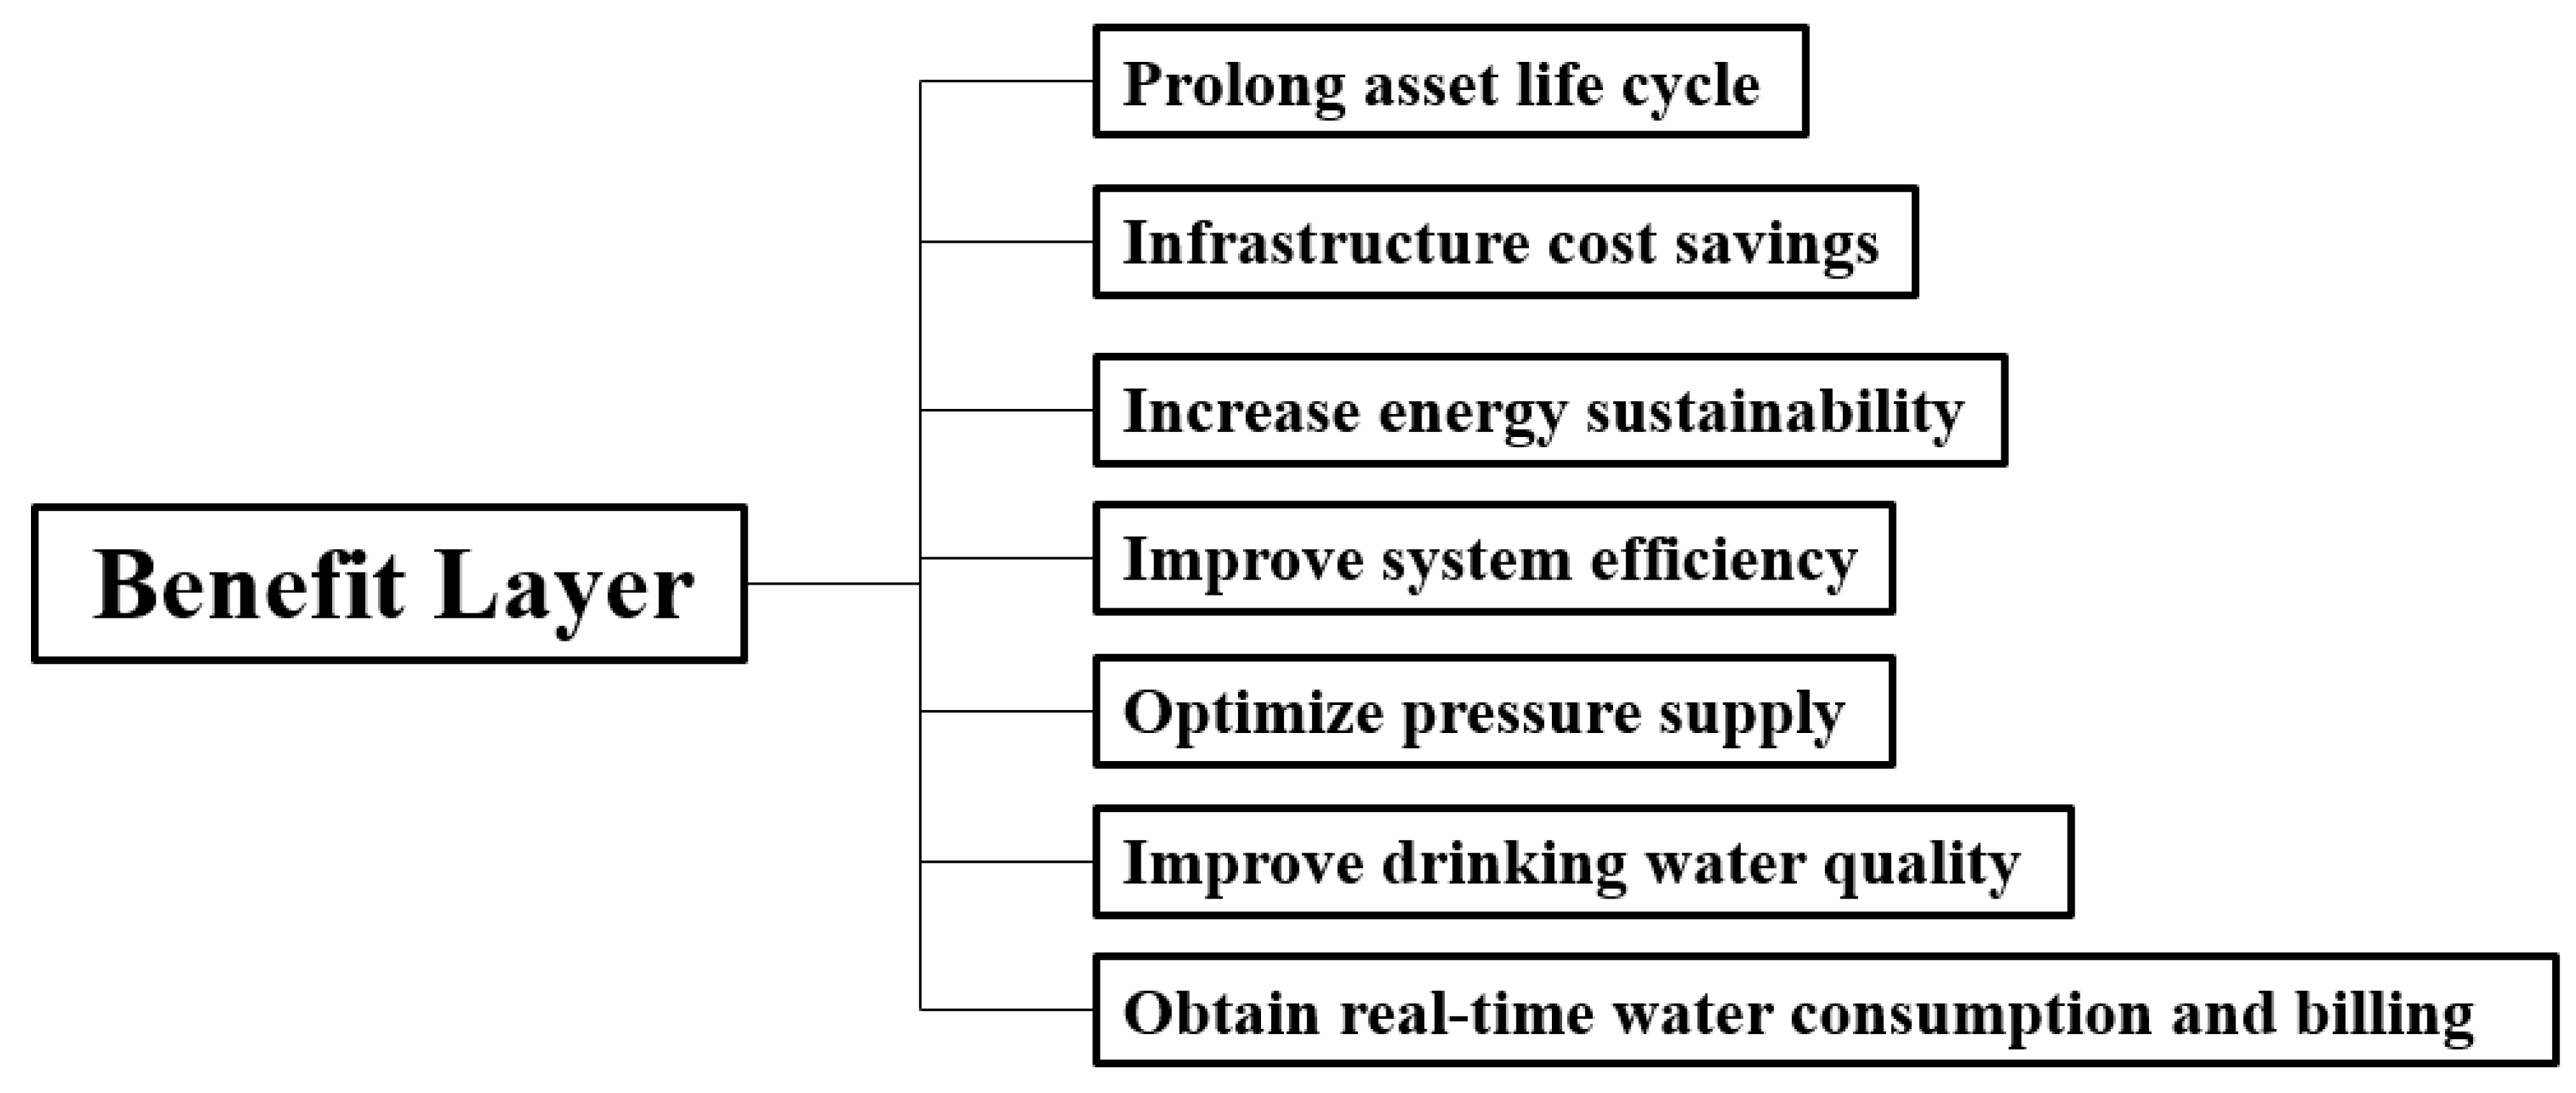
3.4. Benefit Layer
3.4.1. Prolong Asset Life Cycle and Cost Saving
3.4.2. Reduce Energy Loss and Improve System Efficiency
3.4.3. Optimize Pressure Supply and Water Quality
3.4.4. Obtain Real-Time Water Consumption and Consumer Billing
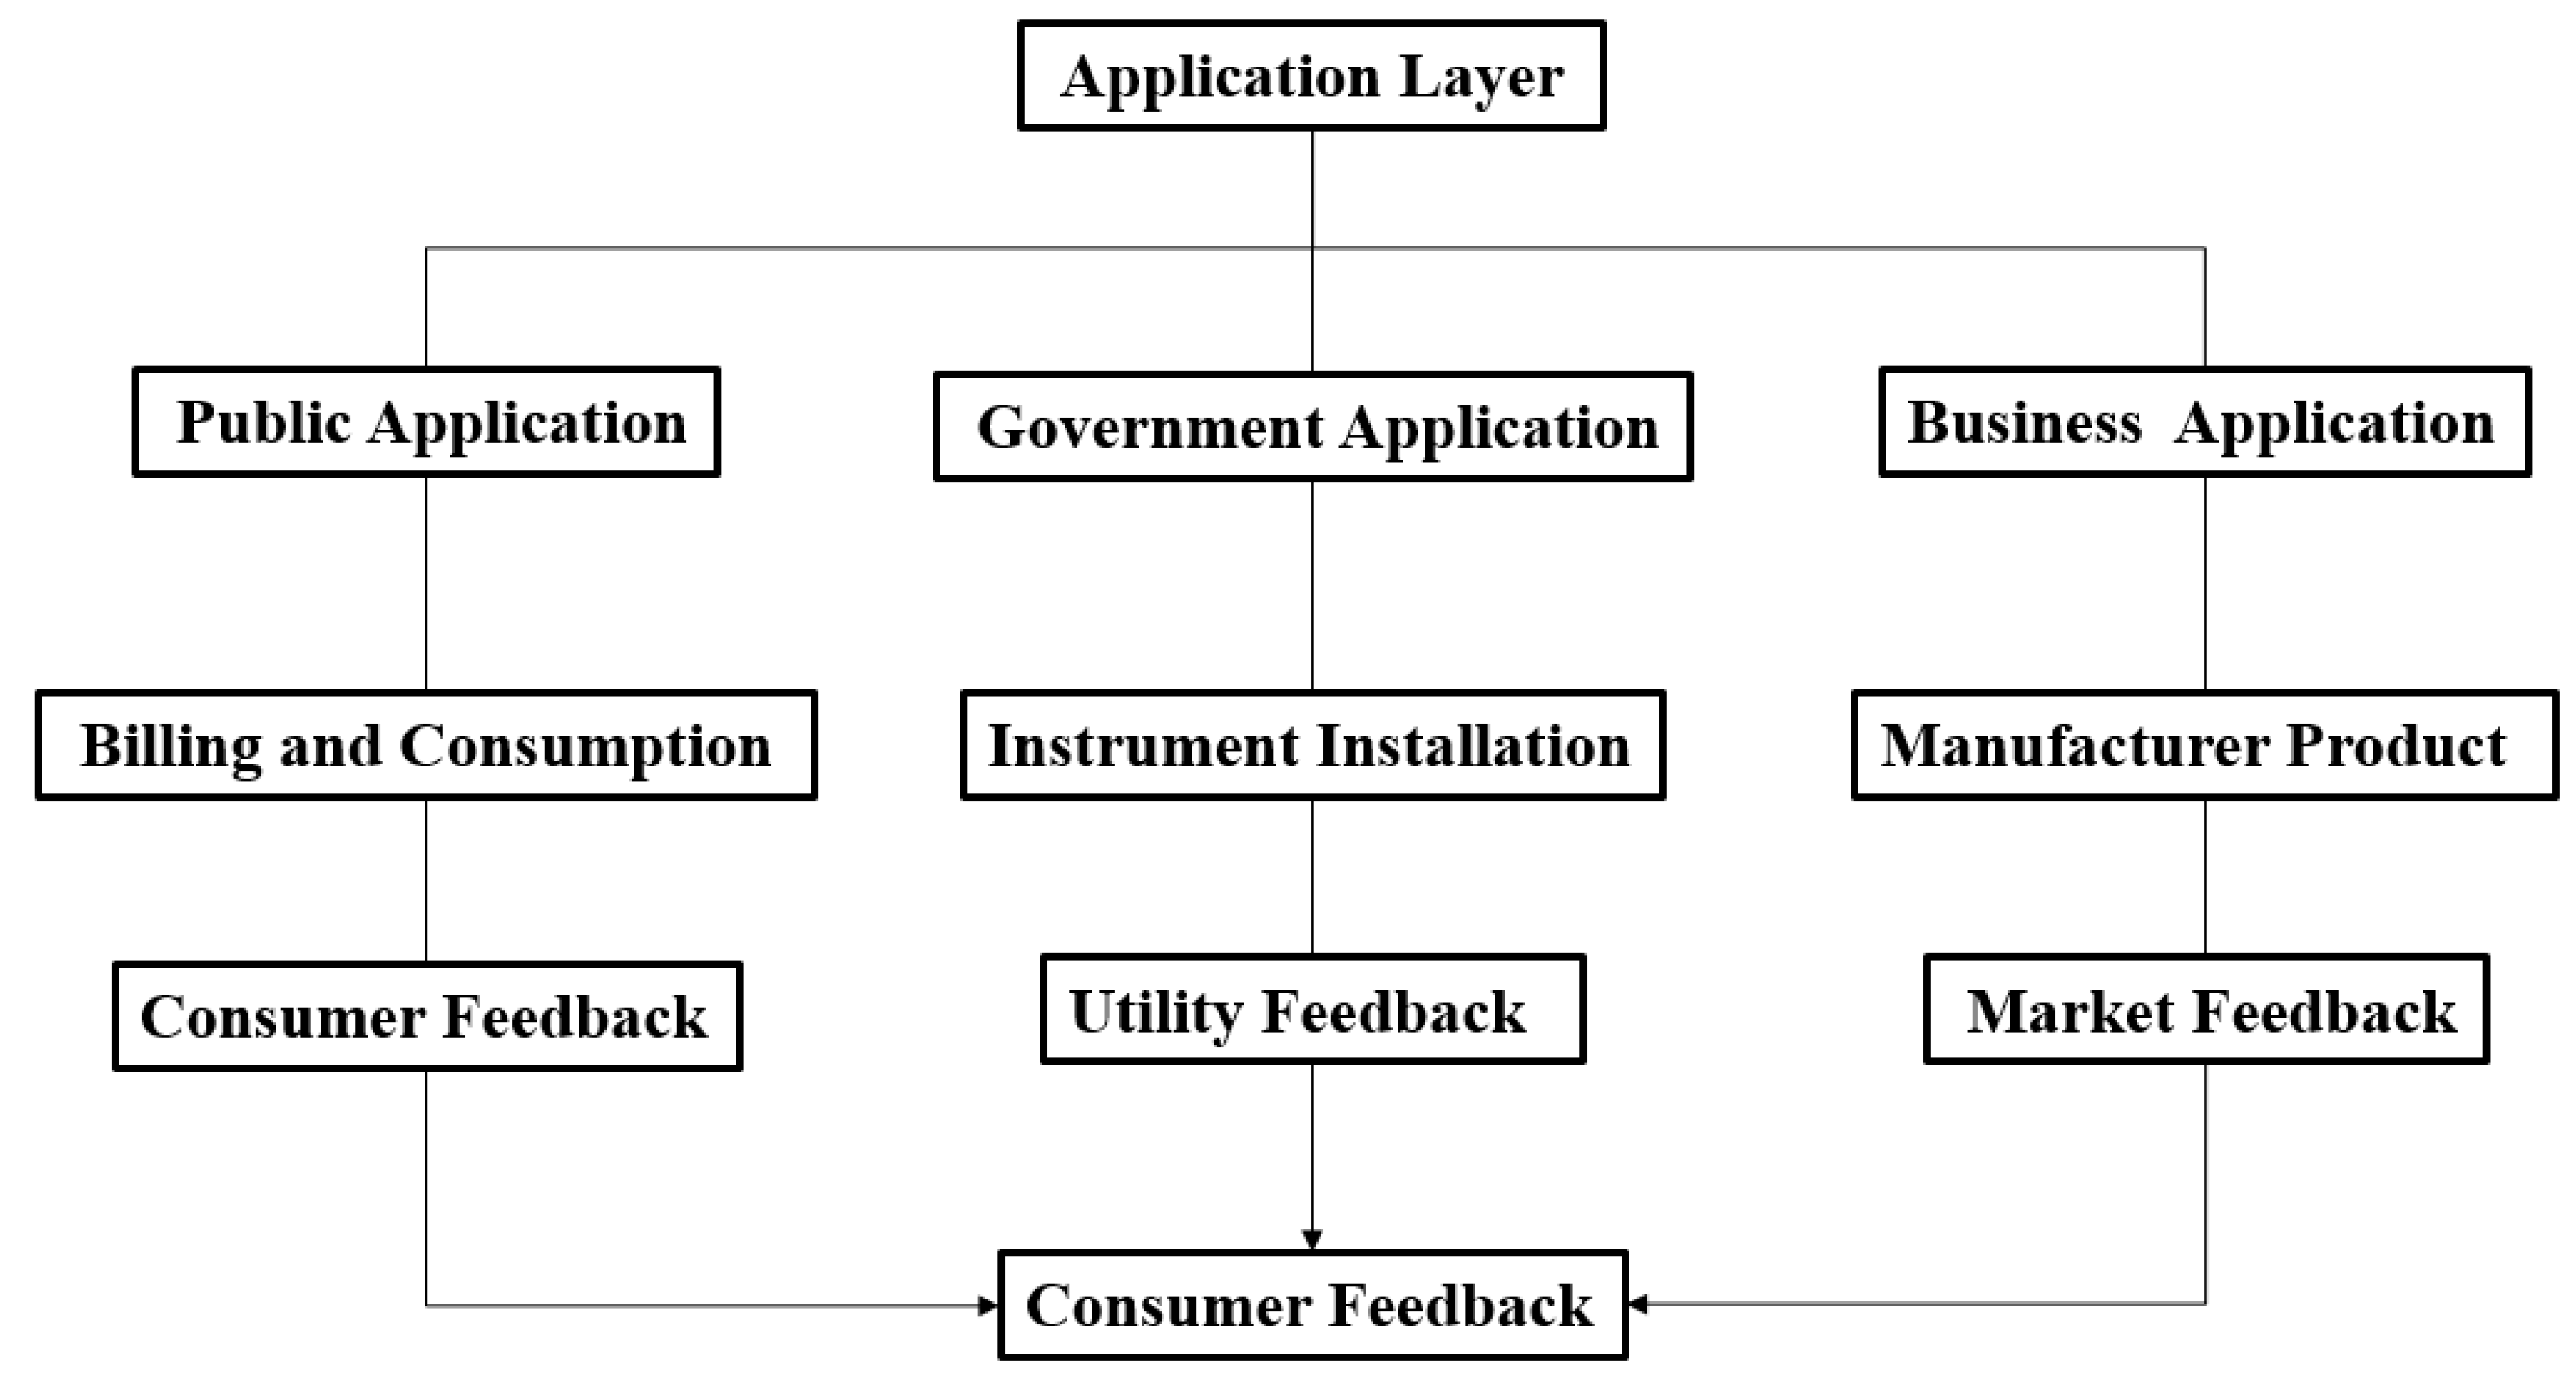
3.5. Application Layer
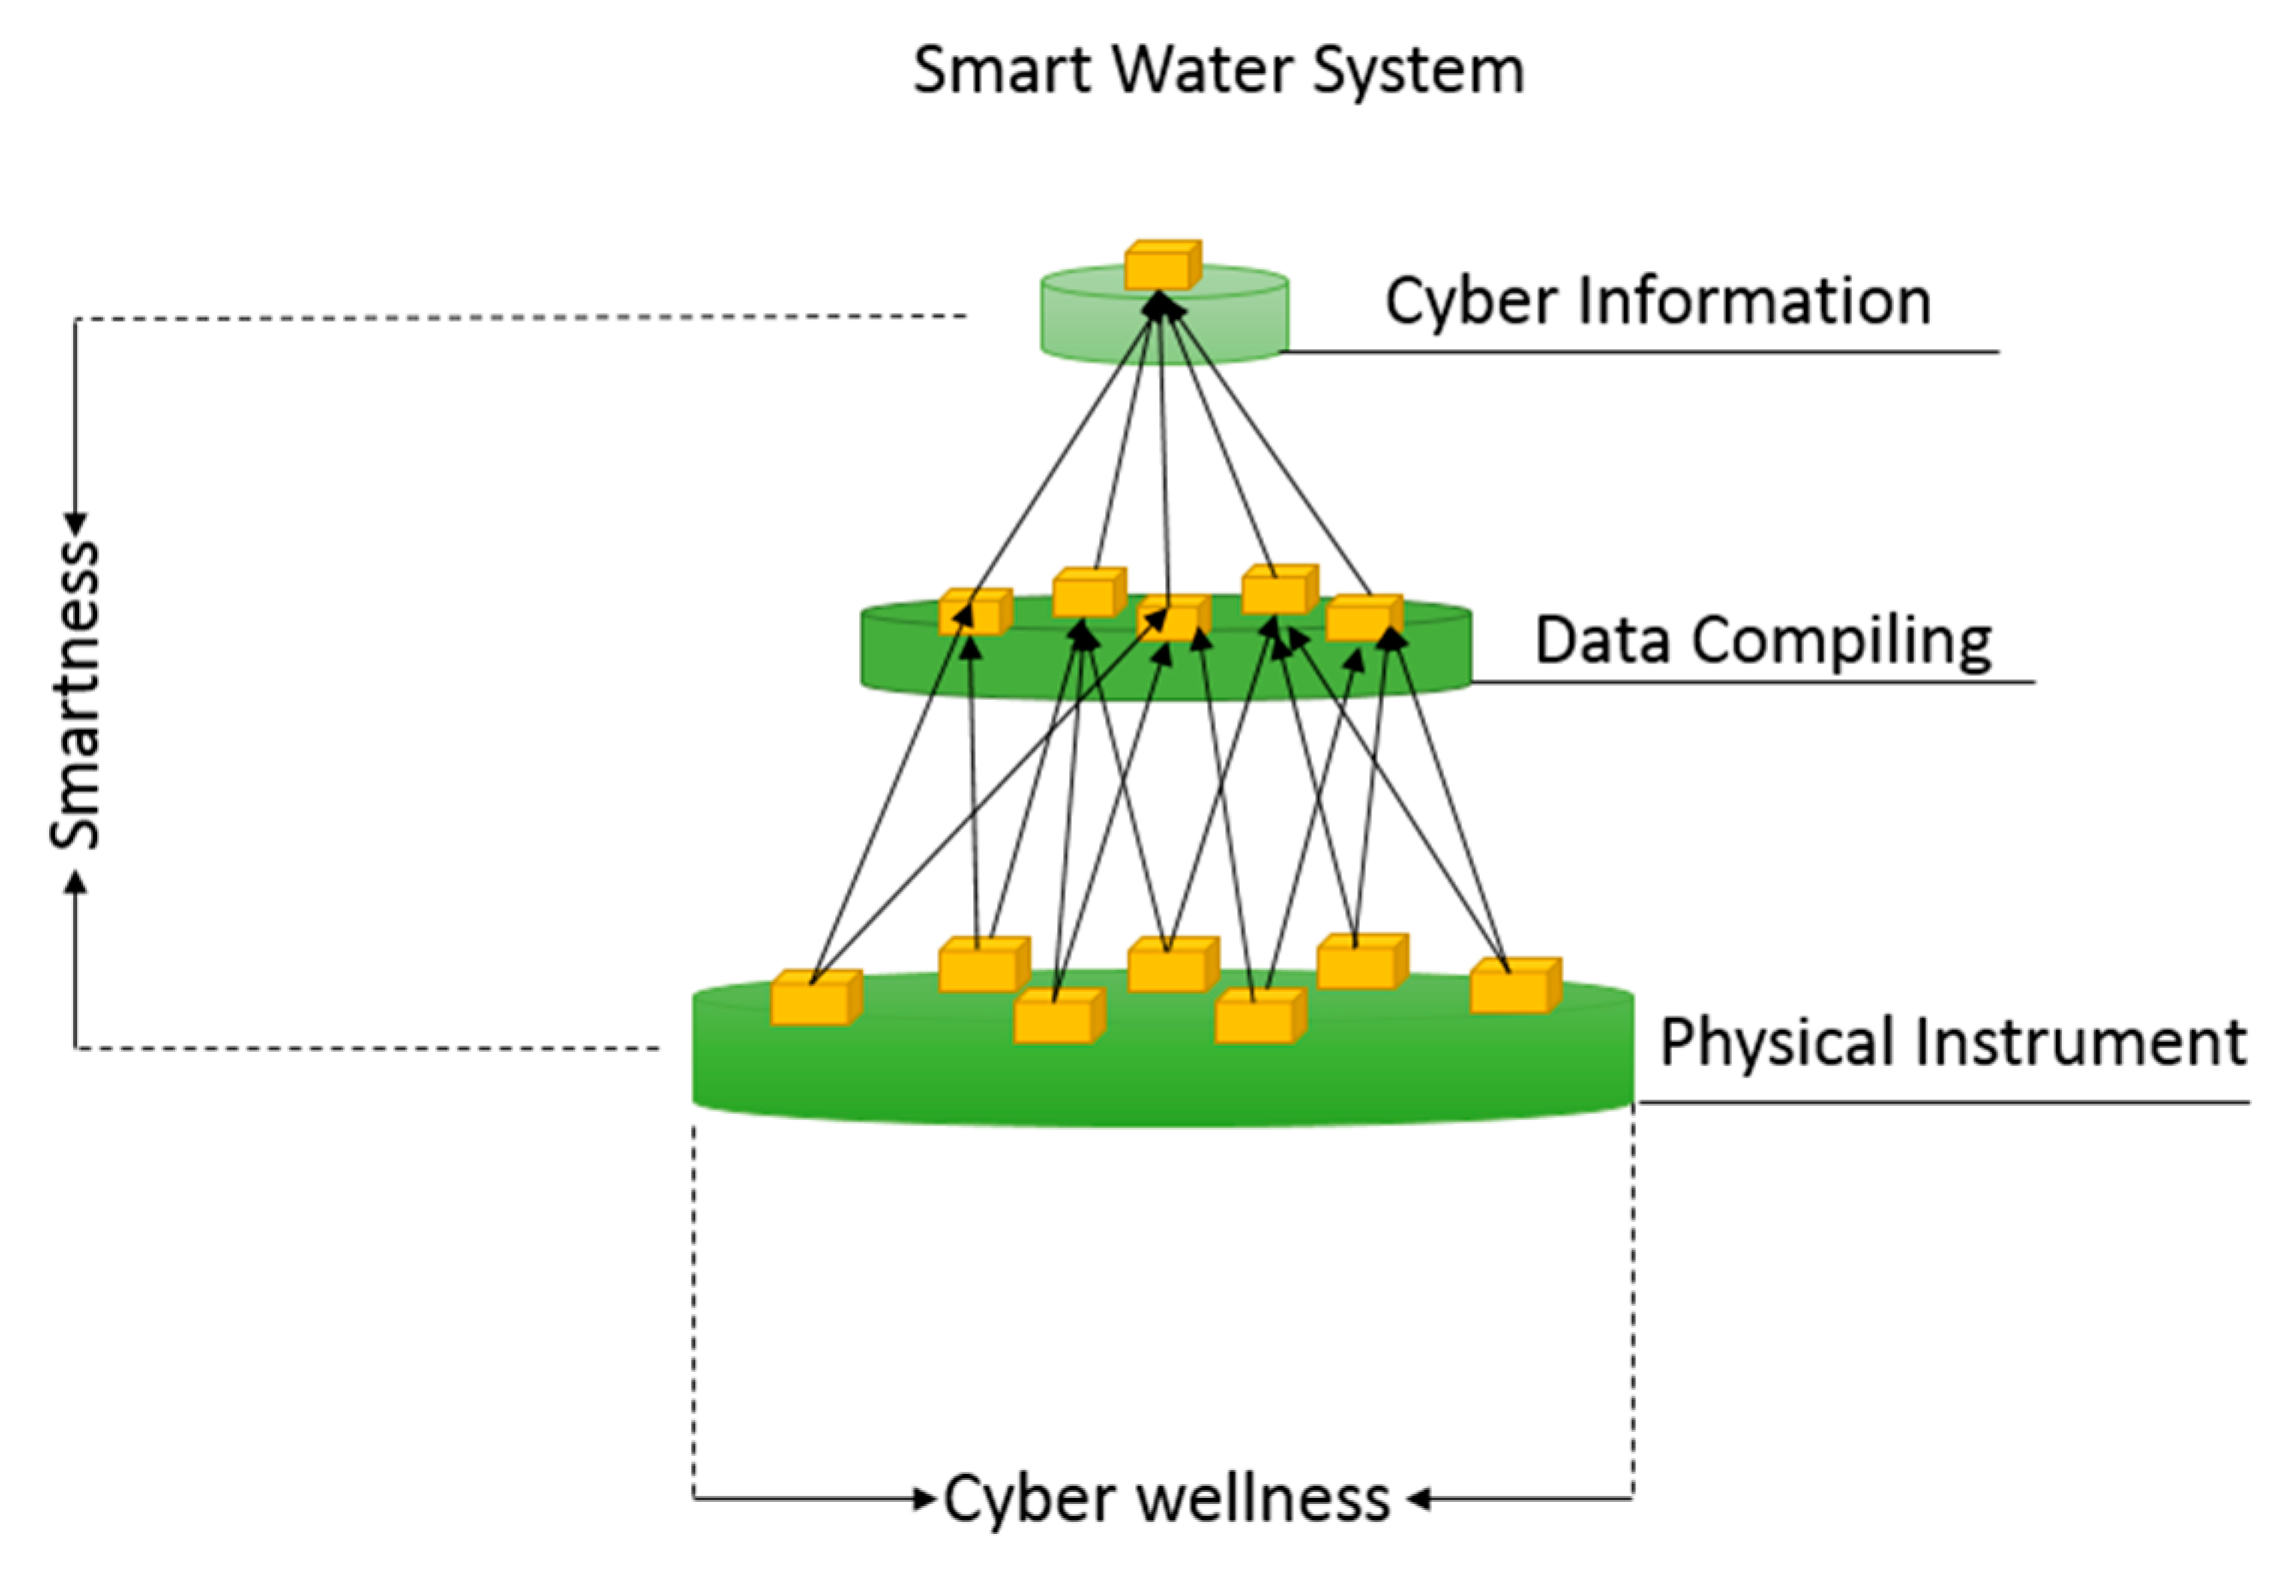
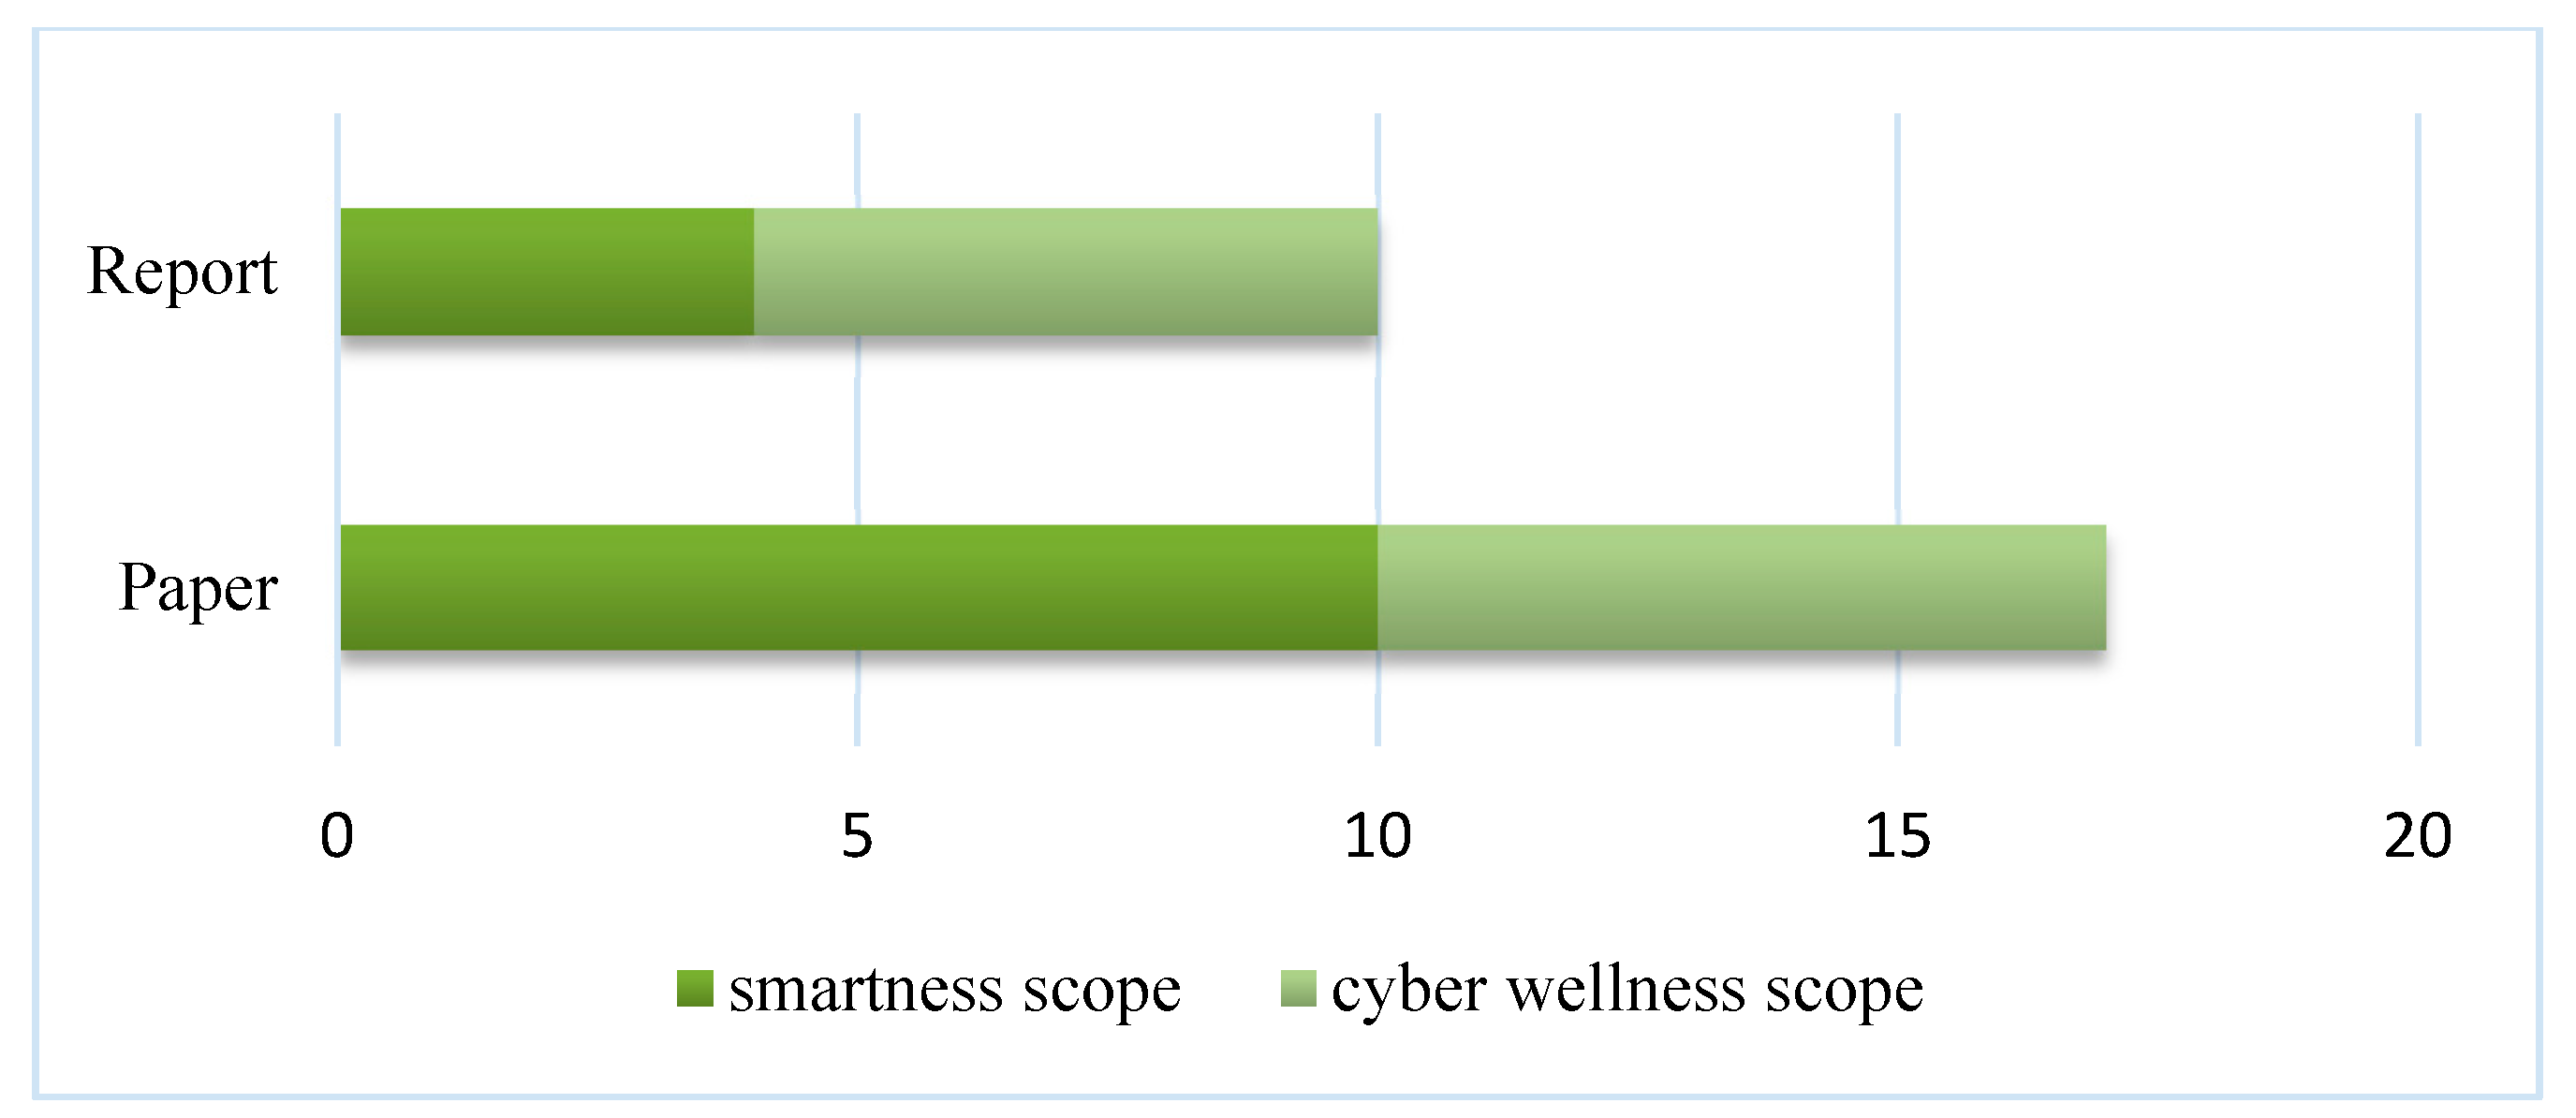
4. Metrics for SWS
4.1. Smartness
4.2. Cyber Wellness
5. Future Research Recommendations
5.1. Cyberattack to Smart Water Micro-Components
5.2. Resilience Incorporation into Smart Water System
5.3. Smart Water (End-User) Data Disaggregation and Analysis
6. Conclusions
- The lack of consensus in the definition and architecture of a smart water system and metrics of intelligent water system assessment is hindering the process of smart techniques entering the water sector;
- A systematic and comprehensive smart water system framework is put forward including critical elements like the definition, architecture, metrics, and research directions, which can be directly applicable for education, research, and public knowledge;
- Two conceptual metrics (smartness and cyber wellness) to evaluate the performance of the smart water system are proposed to characterize system efficiency and information security;
- Existing challenges drive concentration on future research directions, and these future tasks can be viewed as a synthetic work where the academia, industry, and government will join in together.
Author Contributions
Funding
Acknowledgments
Conflicts of Interest
References
- UN DESA. World Urbanization Prospects: The 2018 Revision; United Nations: New York, NY, USA, 2019. [Google Scholar]
- The World Bank Group. The World Bank Population Growth (Annual %); The World Bank: Washington, DC, USA, 2018. [Google Scholar]
- Butler, D.; Farmani, R.; Fu, G.; Ward, S.; Diao, K.; Astaraie-Imani, M. A New Approach to Urban Water Management: Safe and Sure. Procedia Eng. 2014, 89, 347–354. [Google Scholar] [CrossRef]
- Collins, A. The Global Risks Report 2018, 13th ed.; World Economic Forum: Geneva, Switzerland, 2013; ISBN 978-1-944835-15-6. [Google Scholar]
- Tao, T.; Xin, K. Public health: A sustainable plan for China’s drinking water. Nature 2014, 511, 527. [Google Scholar] [CrossRef] [PubMed]
- Tao, T.; Li, J.; Xin, K.; Liu, P.; Xiong, X. Division method for water distribution networks in hilly areas. Water Sci. Technol. Water Supply 2016, 3, 727–736. [Google Scholar] [CrossRef]
- Lee, S.W.; Sarp, S.; Jeon, D.J.; Kim, J.H. Smart water grid: The future water management platform. Desalin. Water Treat. 2015, 55, 339–346. [Google Scholar] [CrossRef]
- Maxmen, A. As Cape Town water crisis deepens, scientists prepare for ‘Day Zero’. Nature 2018, 554, 7690. [Google Scholar] [CrossRef]
- Booysen, M.J.; Visser, M.; Burger, R. Temporal case study of household behavioural response to Cape Town’s “Day Zero” using smart meter data. Water Res. 2019, 149, 414–420. [Google Scholar] [CrossRef]
- Nguyen, K.A.; Stewart, R.A.; Zhang, H.; Sahin, O.; Siriwardene, N. Re-engineering traditional urban water management practices with smart metering and informatics. Environ. Model. Softw. 2018, 101, 256–267. [Google Scholar] [CrossRef]
- Choi, G.W.; Chong, K.Y.; Kim, S.J.; Ryu, T.S. SWMI: New paradigm of water resources management for SDGs. Smart Water 2016, 1, 3. [Google Scholar] [CrossRef][Green Version]
- Sonaje, N.P.; Joshi, M.G. A Review of Modeling an Application of Water Distribution Networks (WDN) Softwares. Int. J. Tech. Res. Appl. 2015, 3, 174–178. [Google Scholar]
- Liu, X.; Tian, Y.; Lei, X.; Wang, H.; Liu, Z.; Wang, J. An improved self-adaptive grey wolf optimizer for the daily optimal operation of cascade pumping stations. Appl. Soft Comput. J. 2019, 75, 473–493. [Google Scholar] [CrossRef]
- Leitão, P.; Colombo, A.W.; Karnouskos, S. Industrial automation based on cyber-physical systems technologies: Prototype implementations and challenges. Comput. Ind. 2016, 81, 11–25. [Google Scholar] [CrossRef]
- NET Plateform. Smart cities applications and requirements. City, 20 May 2011; 1–39. [Google Scholar]
- Hayes, J.; Goonetilleke, A. Building Community Resilience ± Learning from the 2011 Floods in Southeast Queensland, Australia. In Proceedings of the 8th Annual Conference of International Institute for Infrastructure, Renewal and Reconstruction: International Conference on Disaster Management (IIIRR 2012), Kumamoto, Japan, 24–26 August 2012. [Google Scholar]
- Allen, M.; Preis, A.; Iqbal, M.; Whittle, A.J. Case study: A smart water grid in Singapore. Water Pract. Technol. 2012, 7, 4. [Google Scholar] [CrossRef]
- Barsugli, J.; Anderson, C.; Smith, J.B.; Vogel, J.M. Options for Improving Climate Modeling to Assist Water Utility Planning for Climate Change; University of Colorado at Boulder: Denver, CO, USA, 2009. [Google Scholar]
- Arregui, F.J.; Gavara, F.J.; Soriano, J.; Pastor-Jabaloyes, L. Performance analysis of aging single-jet water meters for measuring residential water consumption. Water 2018, 10, 612. [Google Scholar] [CrossRef]
- Ribeiro, R.; Loureiro, D.; Barateiro, J.; Smith, J.R.; Rebelo, M.; Kossieris, P.; Gerakopoulou, P.; Makropoulos, C.; Vieira, P.; Mansfield, L. Framework for technical evaluation of decision support systems based on water smart metering: The iWIDGET case. Procedia Eng. 2015, 119, 1348–1355. [Google Scholar] [CrossRef][Green Version]
- Mounce, S.; Machell, J.; Boxall, J. Water quality event detection and customer complaint clustering analysis in distribution systems. Water Sci. Technol. Water Supply 2012, 12, 580–587. [Google Scholar] [CrossRef]
- Anzecc, A. Australian and New Zealand Guidelines for Fresh and Marine Water Quality. Natl. Water Qual. Manag. Strategy 2000, 1, 1–103. [Google Scholar]
- Albino, V.; Berardi, U.; Dangelico, R.M. Smart cities: Definitions, dimensions, performance, and initiatives. J. Urban Technol. 2015, 22, 3–21. [Google Scholar] [CrossRef]
- Hall, R.E.; Bowerman, B.; Braverman, J.; Taylor, J.; Todosow, H. The Vision of a Smart City. In Proceedings of the 2nd International Life Extension Technology Workshop, Paris, France, 28 September 2000. [Google Scholar]
- Höjer, M.; Wangel, J. Smart Sustainable Cities; Springer International Publishing: Cham, Switzerland, 2014; pp. 333–349. [Google Scholar]
- Owen, D.L. The Singapore water story. Int. J. Water Resour. Dev. 2013, 29, 290–293. [Google Scholar] [CrossRef]
- Gourbesville, P. Key Challenges for Smart Water. Procedia Eng. 2016, 154, 11–18. [Google Scholar] [CrossRef][Green Version]
- Boyle, T.; Giurco, D.; Mukheibir, P.; Liu, A.; Moy, C.; White, S.; Stewart, R. Intelligent metering for urban water: A review. Water 2013, 5, 1052–1081. [Google Scholar] [CrossRef]
- Fang, X.; Misra, S.; Xue, G.; Yang, D. Smart grid—The new and improved power grid: A survey. IEEE Commun. Surv. Tutor. 2012, 14, 944–980. [Google Scholar] [CrossRef]
- Balijepalli, V.S.K.M.; Pradhan, V.; Khaparde, S.A.; Shereef, R.M. Review of Demand Response under Smart Grid Paradigm. In Proceedings of the 2011 IEEE PES International Conference on Innovative Smart Grid Technologies-India, ISGT India 2011, Kollam, Kerala, India, 1–3 December 2011. [Google Scholar]
- Gelazanskas, L.; Gamage, K.A.A. Demand side management in smart grid: A review and proposals for future direction. Sustain. Cities Soc. 2014, 11, 22–30. [Google Scholar] [CrossRef]
- ITU. Global Cybersecurity Index & Cyberwellness Profiles; International Telecommunication Union: Geneva, Switzerland, 2015; ISBN 9789261250614. [Google Scholar]
- Hagar, J.; Murray, R.; Haxton, T.; Hall, J.; McKenna, S. Using the CANARY Event Detection Software to Enhance Security and Improve Water Quality. In Proceedings of the World Environmental and Water Resources Congress 2013: Showcasing the Future—Proceedings of the 2013 Congress, Cincinnati, OH, USA, 19–23 May 2013. [Google Scholar]
- University of Oxford Smart Water System. Available online: https://assets.publishing.service.gov.uk/media/57a08ab9e5274a31e000073c/SmartWaterSystems_FinalReport-Main_Reduced__April2011.pdf (accessed on 9 June 2018).
- DNV GL. Global Opportunity Report 2015. Available online: https://issuu.com/dnvgl/docs/globalopportunityreport/14 (accessed on 10 December 2019).
- DNV GL. Global Opportunity Report 2016. Available online: https://issuu.com/dnvgl/docs/the-2016-global-opportunity-report (accessed on 10 December 2019).
- United Nations Global Compact Global Opportunity Report 2017. Available online: https://www.unglobalcompact.org/library/5081 (accessed on 10 December 2019).
- DNV GL. Global Opportunity Report 2018. Available online: https://www.dnvgl.com/feature/gor2018.html (accessed on 12 October 2019).
- Colorado State University. Smart Water Grid-Plan B Technical Final Report. Available online: https://www.engr.colostate.edu/~pierre/ce_old/Projects/Rising Stars Website/Martyusheva,Olga_PlanB_TechnicalReport.pdf (accessed on 12 October 2019).
- The Smart Water Networks Forum What is a Smart Water Network? Available online: https://www.swan-forum.com/swan-tools/what-is-a-swn/ (accessed on 18 October 2019).
- Dragan Savic Intelligent/Smart Water System. Available online: https://www.slideshare.net/gidrasavic/intelligent-smart-water-systems (accessed on 12 October 2019).
- Li, J.; Lee, S.; Shin, S.; Burian, S. Using a Micro-Test-Bed Water Network to Investigate Smart Meter Data Connections to Hydraulic Models. In Proceedings of the World Environmental and Water Resources Congress 2018: Hydraulics and Waterways, Water Distribution Systems Analysis, and Smart Water—Selected Papers from the World Environmental and Water Resources Congress 2018, Minneapolis, MN, USA, 3–7 June 2018. [Google Scholar]
- Ye, Y.; Liang, L.; Zhao, H.; Jiang, Y. The System Architecture of Smart Water Grid for Water Security. Procedia Eng. 2016, 154, 361–368. [Google Scholar] [CrossRef]
- Günther, M.; Camhy, D.; Steffelbauer, D.; Neumayer, M.; Fuchs-Hanusch, D. Showcasing a smart water network based on an experimental water distribution system. Procedia Eng. 2015, 119, 450–457. [Google Scholar] [CrossRef]
- Mutchek, M.; Williams, E. Moving Towards Sustainable and Resilient Smart Water Grids. Challenges 2014, 5, 123–137. [Google Scholar] [CrossRef]
- Li, J.; Bao, S.; Burian, S. Real-time data assimilation potential to connect micro-smart water test bed and hydraulic model. H2Open J. 2019, 2, 71–82. [Google Scholar] [CrossRef]
- McKenna, K.; Keane, A. Residential Load Modeling of Price-Based Demand Response for Network Impact Studies. IEEE Trans. Smart Grid 2016, 7, 2285–2294. [Google Scholar] [CrossRef]
- Oracle. Smart Metering for Water Utilities; Oracle Corporation: Redwood Shores, CA, USA, 2009. [Google Scholar]
- Beal, C.; Flynn, J. The 2014 Review of Smart Metering and Intelligent Water Networks in Australia & New Zealand. In Proceedings of the Report prepared for WSAA by the Smart Water Research Centre, Griffith University, Queensland, Australia, 1 November 2014. [Google Scholar]
- Murray, R.; Haxton, T.; McKenna, S.; Hart, D.; Umberg, K.; Hall, J.; Lee, Y.; Tyree, M.; Hartman, D. Case Study Application of the CANARY Event Detection Software. In Proceedings of the Water Quality Technology Conference and Exposition 2010, Savannah, GA, USA, 14–18 November 2010. [Google Scholar]
- U.S. Department of Energy. 2014 Smart Grid System Report; The U.S. Department of Energy: Washington, DC, USA, 2014; ISBN 2025863098.
- Batty, M.; Axhausen, K.W.; Giannotti, F.; Pozdnoukhov, A.; Bazzani, A.; Wachowicz, M.; Ouzounis, G.; Portugali, Y. Smart cities of the future. Eur. Phys. J. Spec. Top. 2012, 214, 481–518. [Google Scholar] [CrossRef]
- Kartakis, S.; Abraham, E.; McCann, J.A. WaterBox: A Testbed for Monitoring And Controlling Smart Water Networks. In Proceedings of the 1st ACM International Workshop on Cyber-Physical Systems for Smart Water Networks, CySWater 2015, Seattle, WA, USA, 14–16 April 2015. [Google Scholar]
- Koo, D.; Piratla, K.; Matthews, C.J. Towards Sustainable Water Supply: Schematic Development of Big Data Collection Using Internet of Things (IoT). Procedia Eng. 2015, 118, 489–497. [Google Scholar] [CrossRef]
- Luciani, C.; Casellato, F.; Alvisi, S.; Franchini, M. From Water Consumption Smart Metering to Leakage Characterization at District and User Level: The GST4Water Project. Proceedings 2018, 2, 675. [Google Scholar] [CrossRef]
- Gabrielli, L.; Pizzichini, M.; Spinsante, S.; Squartini, S.; Gavazzi, R. Smart Water Grids for Smart Cities: A Sustainable Prototype Demonstrator. In Proceedings of the EuCNC 2014—European Conference on Networks and Communications, Bologna, Italy, 23–26 June 2014. [Google Scholar]
- Chen, Y.; Han, D. Water quality monitoring in smart city: A pilot project. Autom. Constr. 2018, 89, 307–316. [Google Scholar] [CrossRef]
- Helmbrecht, J.; Pastor, J.; Moya, C. Smart Solution to Improve Water-energy Nexus for Water Supply Systems. Procedia Eng. 2017, 186, 101–109. [Google Scholar] [CrossRef]
- Wu, Z.Y.; El-Maghraby, M.; Pathak, S. Applications of deep learning for smart water networks. Procedia Eng. 2015, 119, 479–485. [Google Scholar] [CrossRef]
- Hatchett, S.; Uber, J.; Boccelli, D.; Haxton, T.; Janke, R.; Kramer, A.; Matracia, A.; Panguluri, S. Real-Time Distribution System Modeling: Development, Application, and Insights. In Proceedings of the Urban Water Management: Challenges and Oppurtunities—11th International Conference on Computing and Control for the Water Industry, CCWI 2011, Exeter, UK, 5–7 September 2011. [Google Scholar]
- Ntuli, N.; Abu-Mahfouz, A. A Simple Security Architecture for Smart Water Management System. Procedia Comput. Sci. 2016, 83, 1164–1169. [Google Scholar] [CrossRef]
- The Smart Water Networks Forum Swan Workgroups. Available online: https://www.swan-forum.com/workgroups/ (accessed on 10 December 2019).
- Li, J.; Lee, S.; Shin, S.; Burian, S. Using a Micro-Test-Bed Water Network to Investigate Smart Meter Data Connections to Hydraulic Models. In Proceedings of the World Environmental and Water Resources Congress 2018: Hydraulics and Waterways, Water Distribution Systems Analysis, and Smart Water, Reston, VA, USA, 3–7 June 2018; 2018; pp. 342–350. [Google Scholar]
- Kamienski, C.; Soininen, J.P.; Taumberger, M.; Dantas, R.; Toscano, A.; Cinotti, T.S.; Maia, R.F.; Neto, A.T. Smart water management platform: IoT-based precision irrigation for agriculture. Sensors 2019, 19, 276. [Google Scholar] [CrossRef] [PubMed]
- Bragalli, C.; Neri, M.; Toth, E. Effectiveness of smart meter-based urban water loss assessment in a real network with synchronous and incomplete readings. Environ. Model. Softw. 2019, 112, 128–142. [Google Scholar] [CrossRef]
- Alvisi, S.; Casellato, F.; Franchini, M.; Govoni, M.; Luciani, C.; Poltronieri, F.; Riberto, G.; Stefanelli, C.; Tortonesi, M. Wireless middleware solutions for smart water metering. Sensors 2019, 19, 1853. [Google Scholar] [CrossRef]
- Cominola, A.; Giuliani, M.; Castelletti, A.; Rosenberg, D.E.; Abdallah, A.M. Implications of data sampling resolution on water use simulation, end-use disaggregation, and demand management. Environ. Model. Softw. 2018, 102, 199–212. [Google Scholar] [CrossRef]
- Jha, M.K.; Sah, R.K.; Rashmitha, M.S.; Sinha, R.; Sujatha, B.; Suma, K.V. Smart Water Monitoring System for Real-Time Water Quality and Usage Monitoring. In Proceedings of the International Conference on Inventive Research in Computing Applications, ICIRCA 2018, Coimbatore, Tamil Nadu, India, 11–12 July 2018. [Google Scholar]
- Siew, C.; Tanyimboh, T.T. Pressure-Dependent EPANET Extension. Water Resour. Manag. 2012, 26, 1477–1498. [Google Scholar] [CrossRef]
- Pai, T.Y.; Lin, K.L.; Shie, J.L.; Chang, T.C.; Chen, B.Y. Predicting the co-melting temperatures of municipal solid waste incinerator fly ash and sewage sludge ash using grey model and neural network. Waste Manag. Res. 2011, 29, 284–293. [Google Scholar] [CrossRef]
- Monks, I.; Stewart, R.A.; Sahin, O.; Keller, R. Revealing unreported benefits of digital water metering: Literature review and expert opinions. Water 2019, 29, 838. [Google Scholar] [CrossRef]
- Stewart, R.A.; Nguyen, K.; Beal, C.; Zhang, H.; Sahin, O.; Bertone, E.; Vieira, A.S.; Castelletti, A.; Cominola, A.; Giuliani, M.; et al. Integrated intelligent water-energy metering systems and informatics: Visioning a digital multi-utility service provider. Environ. Model. Softw. 2018, 105, 94–117. [Google Scholar] [CrossRef]
- Beal, C.D.; Stewart, R.A. Identifying residential water end uses underpinning peak day and peak hour demand. J. Water Resour. Plan. Manag. 2014, 140, 04014008. [Google Scholar] [CrossRef]
- Romano, M.; Kapelan, Z. Adaptive water demand forecasting for near real-time management of smart water distribution systems. Environ. Model. Softw. 2014, 60, 265–276. [Google Scholar] [CrossRef]
- Public Utilities Board Singapore. Managing the water distribution network with a Smart Water Grid. Smart Water. 2016, 1, 1–13. [Google Scholar]
- Aşchilean, I.; Giurca, I. Choosing a water distribution pipe rehabilitation solution using the analytical network process method. Water 2018, 10, 484. [Google Scholar] [CrossRef]
- Fontana, N.; Giugni, M.; Glielmo, L.; Marini, G.; Zollo, R. Hydraulic and electric regulation of a prototype for real-time control of pressure and hydropower generation in a water distribution network. J. Water Resour. Plan. Manag. 2018, 144, 04018072. [Google Scholar] [CrossRef]
- Sitzenfrei, R.; Rauch, W. Optimizing small hydropower systems in water distribution systems based on long-time-series simulation and future scenarios. J. Water Resour. Plan. Manag. 2015, 141, 04015021. [Google Scholar] [CrossRef]
- Torcellini, P.A.; Long, N.; Judkoff, R.D. Consumptive Water Use for U.S. Power Production. In Proceedings of the 2004 Winter Meeting—Technical and Symposium Papers, American Society of Heating, Refrigerating and Air-Conditioning Engineers, Anaheim, CA, USA, 24–28 January 2004. [Google Scholar]
- Ton, D.T.; Smith, M.A. The U.S. Department of Energy’s Microgrid Initiative. Electr. J. 2012, 25, 84–94. [Google Scholar] [CrossRef]
- Di Nardo, A.; Di Natale, M.; Santonastaso, G.F.; Venticinque, S. An Automated Tool for Smart Water Network Partitioning. Water Resour. Manag. 2013, 27, 4493–4508. [Google Scholar] [CrossRef]
- U.S. EPA. CANARY User’s Manual Version 4.3.2; Sandia National Laboratories (SNL-NM): Albuquerque, NM, USA, 2012.
- Sønderlund, A.L.; Smith, J.R.; Hutton, C.J.; Kapelan, Z.; Savic, D. Effectiveness of smart meter-based consumption feedback in curbing household water use: Knowns and unknowns. J. Water Resour. Plan. Manag. 2016, 142, 04016060. [Google Scholar] [CrossRef]
- Cardell-Oliver, R.; Wang, J.; Gigney, H. Smart meter analytics to pinpoint opportunities for reducing household water use. J. Water Resour. Plan. Manag. 2016, 142, 04016007. [Google Scholar] [CrossRef]
- Brentan, B.; Meirelles, G.; Luvizotto, E.; Izquierdo, J. Joint operation of pressure-reducing valves and pumps for improving the efficiency of water distribution systems. J. Water Resour. Plan. Manag. 2018, 144, 04018055. [Google Scholar] [CrossRef]
- Murphy, J.J.; Dinar, A.; Howitt, R.E.; Rassenti, S.J.; Smith, V.L. The design of “Smart” water market institutions using laboratory experiments. Environ. Resour. Econ. 2000, 17, 375–394. [Google Scholar] [CrossRef]
- Marchese, D.; Linkov, I. Can You Be Smart and Resilient at the Same Time? Environ. Sci. Technol. 2017, 51, 5867–5868. [Google Scholar] [CrossRef]
- Jazri, H.; Jat, D.S. A Quick Cybersecurity Wellness Evaluation Framework for Critical Organizations. In Proceedings of the 2016 International Conference on ICT in Business, Industry, and Government, ICTBIG 2016, Indore, India, 18 November 2016. [Google Scholar]
- Dong, X.; Lin, H.; Tan, R.; Iyer, R.K.; Kalbarczyk, Z. Software-Defined Networking for Smart Grid Resilience: Opportunities and Challenges. In Proceedings of the CPSS 2015—1st ACM Workshop on Cyber-Physical System Security, Part of ASIACCS 2015, Denver, CO, USA, 16 October 2015; pp. 61–68. [Google Scholar]
- Hatchett, S.; Boccelli, D.; Uber, J.; Haxton, T.; Janke, R.; Kramer, A.; Matracia, A.; Panguluri, S. How Accurate Is a Hydraulic Model? In Proceedings of the Water Distribution Systems Analysis 2010—12th International Conference, WDSA 2010, Tucson, AZ, USA, 12–15 September 2010; pp. 1379–1389. [Google Scholar]
- Boulos, P.F.; Jacobsen, L.B.; Heath, J.E.; Kamojjala, S. Real-time modeling of water distribution systems: A case study. J. Am. Water Works Assoc. 2014, 106, E391–E401. [Google Scholar] [CrossRef]
- Taormina, R.; Galelli, S.; Tippenhauer, N.O.; Salomons, E.; Ostfeld, A. Characterizing cyber-physical attacks on water distribution systems. J. Water Resour. Plan. Manag. 2017, 143, 04017009. [Google Scholar] [CrossRef]
- Okeya, I.; Kapelan, Z.; Hutton, C.; Naga, D. Online modelling of water distribution system using Data Assimilation. Procedia Eng. 2014, 70, 1261–1270. [Google Scholar] [CrossRef]
- Sadler, J.M.; Goodall, J.L.; Behl, M.; Morsy, M.M.; Culver, T.B.; Bowes, B.D. Leveraging open source software and parallel computing for model predictive control of urban drainage systems using EPA-SWMM5. Environ. Model. Softw. 2019, 120, 104484. [Google Scholar] [CrossRef]
- International Telecommunication Union. ITU Guide to Developing a National Cybersecurity Strategy—Strategic Engagement in Cybersecurity. 2018. Available online: https://www.itu.int/dms_pub/itu-d/opb/str/D-STR-CYB_GUIDE.01-2018-PDF-E.pdf (accessed on 20 November 2019).
- Muhammad, A.; Haider, B.; Ahmad, Z. IoT Enabled Analysis of Irrigation Rosters in the Indus Basin Irrigation System. Procedia Eng. 2016, 154, 229–235. [Google Scholar] [CrossRef]
- Tonge, A.M. Cyber security: Challenges for society- literature review. IOSR J. Comput. Eng. 2013, 2, 67–75. [Google Scholar] [CrossRef]
- Sharpe, R.G.; Goodall, P.A.; Neal, A.D.; Conway, P.P.; West, A.A. Cyber-Physical Systems in the re-use, refurbishment and recycling of used Electrical and Electronic Equipment. J. Clean. Prod. 2018, 170, 351–361. [Google Scholar] [CrossRef]
- Lansey, K. Sustainable, Robust, Resilient, Water Distribution Systems. In Proceedings of the 14th Water Distribution Systems Analysis Conference 2012, WDSA 2012, Adelaide, Australia, 24–27 September 2012. [Google Scholar]
- Juan-García, P.; Butler, D.; Comas, J.; Darch, G.; Sweetapple, C.; Thornton, A.; Corominas, L. Resilience theory incorporated into urban wastewater systems management. State of the art. Water Res. 2017, 115, 149–161. [Google Scholar] [CrossRef]
- Todini, E. Looped water distribution networks design using a resilience index based heuristic approach. Urban Water 2000, 2, 115–122. [Google Scholar] [CrossRef]
- Youn, S.G.; Chung, E.S.; Kang, W.G.; Sung, J.H. Probabilistic estimation of the storage capacity of a rainwater harvesting system considering climate change. Resour. Conserv. Recycl. 2012, 65, 136–144. [Google Scholar] [CrossRef]
- Abdallah, A.M.; Rosenberg, D.E. Heterogeneous residential water and energy linkages and implications for conservation and management. J. Water Resour. Plan. Manag. 2014, 140, 288–297. [Google Scholar] [CrossRef]
- Horsburgh, J.S.; Leonardo, M.E.; Abdallah, A.M.; Rosenberg, D.E. Measuring water use, conservation, and differences by gender using an inexpensive, high frequency metering system. Environ. Model. Softw. 2017, 96, 83–94. [Google Scholar] [CrossRef]
- Nguyen, K.A.; Stewart, R.A.; Zhang, H. An autonomous and intelligent expert system for residential water end-use classification. Expert Syst. Appl. 2014, 41, 342–356. [Google Scholar] [CrossRef]
- Cominola, A.; Nguyen, K.; Giuliani, M.; Stewart, R.A.; Maier, H.R.; Castelletti, A. Data mining to uncover heterogeneous water use behaviors from smart meter data. Water Resour. Res. 2019, 55, 9315–9333. [Google Scholar] [CrossRef]
- Stewart, R.A.; Willis, R.; Giurco, D.; Panuwatwanich, K.; Capati, G. Web-based knowledge management system: Linking smart metering to the future of urban water planning. Aust. Plan. 2010, 47, 66–74. [Google Scholar] [CrossRef]
- Yuan, Z.; Olsson, G.; Cardell-Oliver, R.; van Schagen, K.; Marchi, A.; Deletic, A.; Urich, C.; Rauch, W.; Liu, Y.; Jiang, G. Sweating the assets—The role of instrumentation, control and automation in urban water systems. Water Res. 2019, 155, 381–402. [Google Scholar] [CrossRef] [PubMed]
- Cominola, A.; Giuliani, M.; Piga, D.; Castelletti, A.; Rizzoli, A.E. Benefits and challenges of using smart meters for advancing residential water demand modeling and management: A review. Environ. Model. Softw. 2015, 72, 198–214. [Google Scholar] [CrossRef]


| Reference Number | Smart Water Definition | Smart Water Structure | Smart Water Metrics | Future Research | ||||
|---|---|---|---|---|---|---|---|---|
| Instrument Layer | Property Layer | Function Layer | Benefit Layer | Application Layer | ||||
| [42] | Smart water is also called Smart Water Grid (SWG4), Internet of Water5, Smart Water Management, etc. | ● | ● | ● | ● | ● | ||
| [43] | Smart water grid is based on the Internet of Things and the structure of smart water system. | ● | ● | ● | ● | |||
| [44] | A smart water system (network) in water context comprises smart meters, smart valves, smart pumps, data communication, data management, data fusion, and analysis tools. | ● | ● | ● | ● | |||
| [45] | A smart water network should comprise smart meters, smart valves, and smart pumps. | ● | ● | . ● | ||||
| [46] | An advanced and intelligent water supply system and includes ICT integration of the water supply network. | ● | ● | ● | ● | |||
| [17] | Water management technologies converging with ICT have been called Smart Water Management (SWM) distinguished from traditional water management technologies. | ● | ● | ● | ● | ● | ● | |
| [47] | A Smart Water Grid system integrates information and communications technologies into the management of the water distribution system. | ● | ● | ● | ● | ● | . ● | |
| [48] | Smart water system illustrates many of the ways technology, middleware, and software help maximize the value of Smart Metering data to all stakeholders. | ● | ● | ● | ||||
| [33] | Not specified | ● | ● | |||||
| [34] | A smart water system offers a mechanism to capture and communicate data on water resources through hydro informatics systems. | ● | ● | ● | ||||
| [36] | Not specified | ● | ● | ● | ● | |||
| [37] | Not specified | ● | ● | ● | ● | |||
| [38] | Not specified | ● | ● | ● | ● | |||
| [39] | Smart water networks is a system composed of automation, sensing and communication tools. | ● | ● | ● | ● | |||
| [41] | A smart water system is an integrated set of products, solutions, and systems. | ● | ● | ● | ||||
| [49] | A smart water system is based on the smart metering system to collect real-time water data. | ● | ● | ● | ● | ● | ||
| [40] | Smart water networks are layered, as any data ecosystem is, starting from sensors, remote control, and enterprise data sources, through data collection and communications, data management and display, and up to data fusion and analysis. | ● | ● | ● | ● | |||
| [50] | Not specified | ● | ● | ● | ||||
| [51] | Not specified | |||||||
| [23] | Not specified | ● | ||||||
| [52] | A smart water system is designed to gather meaningful and actionable data about the flow, pressure, and distribution of a city’s water. | ● | ● | ● | ||||
| [53] | A smart water system uses data-driven components to help manage and operate the physical network of pipe. | ● | ● | ● | ● | |||
| [54] | Smart water system aims to deploy the Internet of Things (IoT) technology throughout the water supply infrastructure and consumers’ usage. | ● | ● | ● | ● | |||
| [43] | Smart water grid is based on the Internet of Things, mainly including hierarchy framework, technical system, and function framework. | ● | ● | ● | ● | ● | ● | |
| [20] | An assortment of components and procedures for the continuous monitoring and evaluation of water use. | ● | ● | ● | ||||
| [55] | A smart water architecture can be characterized by five layers: physical layer, sensing, and control layer, communication layer, data management layer, and data fusion layer. | ● | ● | ● | ||||
| [56] | A smart water grid is an innovative way to monitor water distribution networks. | ● | ● | ● | ● | |||
| [57] | A water smart grid would direct the innovative technologies suite to create a data-driven system for intelligent water resources management. | ● | ● | ● | ● | |||
| [58] | Smart water networks need online water monitoring for the collection and analysis of data. | ● | ● | ● | ● | |||
| [59] | Not specified | ● | ● | ● | ● | |||
| [60] | Not specified | ● | ● | |||||
| [61] | Smart water system requires many digital devices (sensors and actuators) to be deployed across the water distribution network to enable near real-time monitoring and control of the water grid components. | ● | ● | ● | ||||
| Components | Roles | Problems Solved |
|---|---|---|
| Smart Flow Sensors | Monitor flow | Water leakage, Pipe burst |
| Smart Pressure Sensor | Monitor pressure | Pressure instability, Water Loss, Energy Loss |
| Smart Valves | “Bi-direction” operation | Water leakage, Pipe burst |
| Smart Pumps | “Bi-direction” operation | Pressure unbalance, Energy loss |
| Smart Irrigation Controllers | “Bi-direction” operation | Water loss, Energy loss, Water Overuse |
| Smart Contaminant Sensor | Monitor water quality | Pipe deterioration, Water aging, Contaminant intrusion |
| Smart Flood Sensor | Monitor flood volume | Flood disaster, Water quality issues |
© 2020 by the authors. Licensee MDPI, Basel, Switzerland. This article is an open access article distributed under the terms and conditions of the Creative Commons Attribution (CC BY) license (http://creativecommons.org/licenses/by/4.0/).
Share and Cite
Li, J.; Yang, X.; Sitzenfrei, R. Rethinking the Framework of Smart Water System: A Review. Water 2020, 12, 412. https://doi.org/10.3390/w12020412
Li J, Yang X, Sitzenfrei R. Rethinking the Framework of Smart Water System: A Review. Water. 2020; 12(2):412. https://doi.org/10.3390/w12020412
Chicago/Turabian StyleLi, Jiada, Xiafei Yang, and Robert Sitzenfrei. 2020. "Rethinking the Framework of Smart Water System: A Review" Water 12, no. 2: 412. https://doi.org/10.3390/w12020412
APA StyleLi, J., Yang, X., & Sitzenfrei, R. (2020). Rethinking the Framework of Smart Water System: A Review. Water, 12(2), 412. https://doi.org/10.3390/w12020412