Article

Spatiotemporal Relationships of Phytoplankton Blooms, Drought, and Rainstorms in Freshwater Reservoirs

Department of Geology, University of GA, 210 Field Street, Athens, GA 30602, USA
*
Author to whom correspondence should be addressed.
Water 2020, 12(2), 404; https://doi.org/10.3390/w12020404
Submission received: 27 November 2019 / Revised: 25 January 2020 / Accepted: 27 January 2020 / Published: 3 February 2020
(This article belongs to the Special Issue Cyanobacterial Threat on Freshwater Safety)

Abstract

:
Algal blooms, especially those composed of toxic phytoplankton, are a global threat to eutrophic and mesotrophic freshwater reservoirs. While extreme hydrologic events such as flooding and drought have been shown to control bloom onset and success, the spatiotemporal dynamics of these relationships are still unclear for mesotrophic reservoirs. In this study, the relationships between hydrologic events and phytoplankton in Lake Allatoona and Lake Lanier, Georgia, United States, were characterized using historical and satellite datasets from 2008 to 2017 and statistical modeling. Results showed that the impact of stormflow and rainstorm events varied systematically from riverine to lacustrine reaches of the two reservoirs on weekly and monthly scales. Precipitation duration and stormflow were the most significant and best-fitting predictors of algal bloom biomass in deeper reaches of the two reservoirs, suggesting that algal blooms in more lacustrine environments may be better equipped for wet and stormy regimes than has been previously hypothesized.

Graphical Abstract

1. Introduction

Reservoirs are vital to freshwater resource management for drinking water and agricultural use, especially in regions with greater impacts of climate change and dense populations. Due to their often shallow and nutrient-rich waters, reservoirs are at risk of eutrophication and harmful algal blooms (HABs) [1]. These phytoplanktonic events pose water quality hazards such as hypoxia, fish kill, reduced biodiversity, and cyanobacterial toxicity [2,3]. The onset and success of these blooms in freshwater bodies are generally associated with local conditions such as high temperatures, plentiful bioavailable phosphorus, and long water residence times (Figure 1) [4,5,6]. Regional conditions which may affect algal blooms include hydrologic events such as severe or long-lasting drought or high-intensity rainstorms followed by calm weather [6,7,8,9].
The general paradigm for hydrologically instigated phytoplanktonic growth is the addition of drought or rainstorms to a lake or reservoir with local conditions already conducive to algal growth [8,10,11]. High-intensity rain events may supply dissolved nitrate and adsorbed phosphate, but also cause temporary disruptions to the stratification and water clarity [9,12,13]. Rain events may also increase advection through riverine-lacustrine gradients, altering the phytoplankton composition or seeding new populations [14,15]. Drought may increase retention times and thermal stratification of the water column or may increase nutrient availability through sediment resuspension due to decreased depth [10,16,17,18]. While these factors are recognized, there is still considerable uncertainty in the temporal or spatial scales of these interactions in various types of freshwater systems [7,19], for instance the role of lag time between a rainstorm and bloom event, or the importance of a hydrologic process at various depths or regimes [7]. While these dynamics have yet to be fully characterized for all lake and reservoir types, they are essential for management and prediction of phytoplankton blooms.
The current literature addressing the hydrologic drivers of algal blooms focuses on precipitation, drought, and climate impacts on discharge and retention time [6,11,14,15,20]. The compounding effects of local nutrient sources, geomorphology, trophic state, or temperature may even result in seemingly contradictory results between various studies [7,21,22]. Discharge, as an example, has been shown to be a source of nutrient rejuvenation [23,24,25,26,27]. In several studies, increased discharge and rainfall appeared to promote cyanobacterial HAB growth, although the positive effect comes after a temporal lag [14,28]. However, frequent flushing of the system may suppress growth of a bloom through colony dispersion or relocation to cooler or deeper waters [13,29,30,31]. Inversely, when discharge declines and the reservoir retention time increases, thermal stratification and an increase in biomass may take place [20].
The Southeastern United States Piedmont has experienced several periods of meteorological drought in the past half century [32]. In 2007, several months with little to no rain reduced the Lake Allatoona dam pool in the state of Georgia to a low of 238 m above sea level—18 m below the summer conservation level and more than 15 m below the decadal average (USGS gage number 02393500) [33]. As a result of periodic low flows and continuous nutrient influx to the reservoir, several significant algal blooms have occurred in the Allatoona reservoir during the past two decades [18,24,34]. We compared the relative drivers of blooms within Lake Allatoona to those in Lake Lanier to build on the conceptual model of algal blooms within mesotrophic to eutrophic reservoirs.
The purpose of this study was to determine the relationship between hydrologic dynamics and the occurrence of phytoplanktonic blooms in a typical Southeastern U.S. Piedmont reservoir characterized by mesotrophic conditions, varied river hydraulics, and a diverse microbiological community. While high resolution, antecedent water quality data such as nutrient concentration are not always available for reservoirs, data such as precipitation or drought dynamics may be obtained from widely available gage data. The utility of a hydrological statistical model would be potentially powerful for stakeholders and researchers alike, from easily accessible monitoring data. We tested whether long-term patterns of precipitation—especially rainstorm intensity and frequency—and hydrological drought severity correlate with algal bloom onset and severity in the Southeastern U.S. Piedmont Lakes Allatoona and Lanier. In situ historic datasets, remote sensing techniques, and field data were integrated to maximize the study’s spatial and temporal resolution. These relationships were further investigated using dimensional reduction and linear regression on both in situ and remotely sensed datasets from 2008 to 2017.

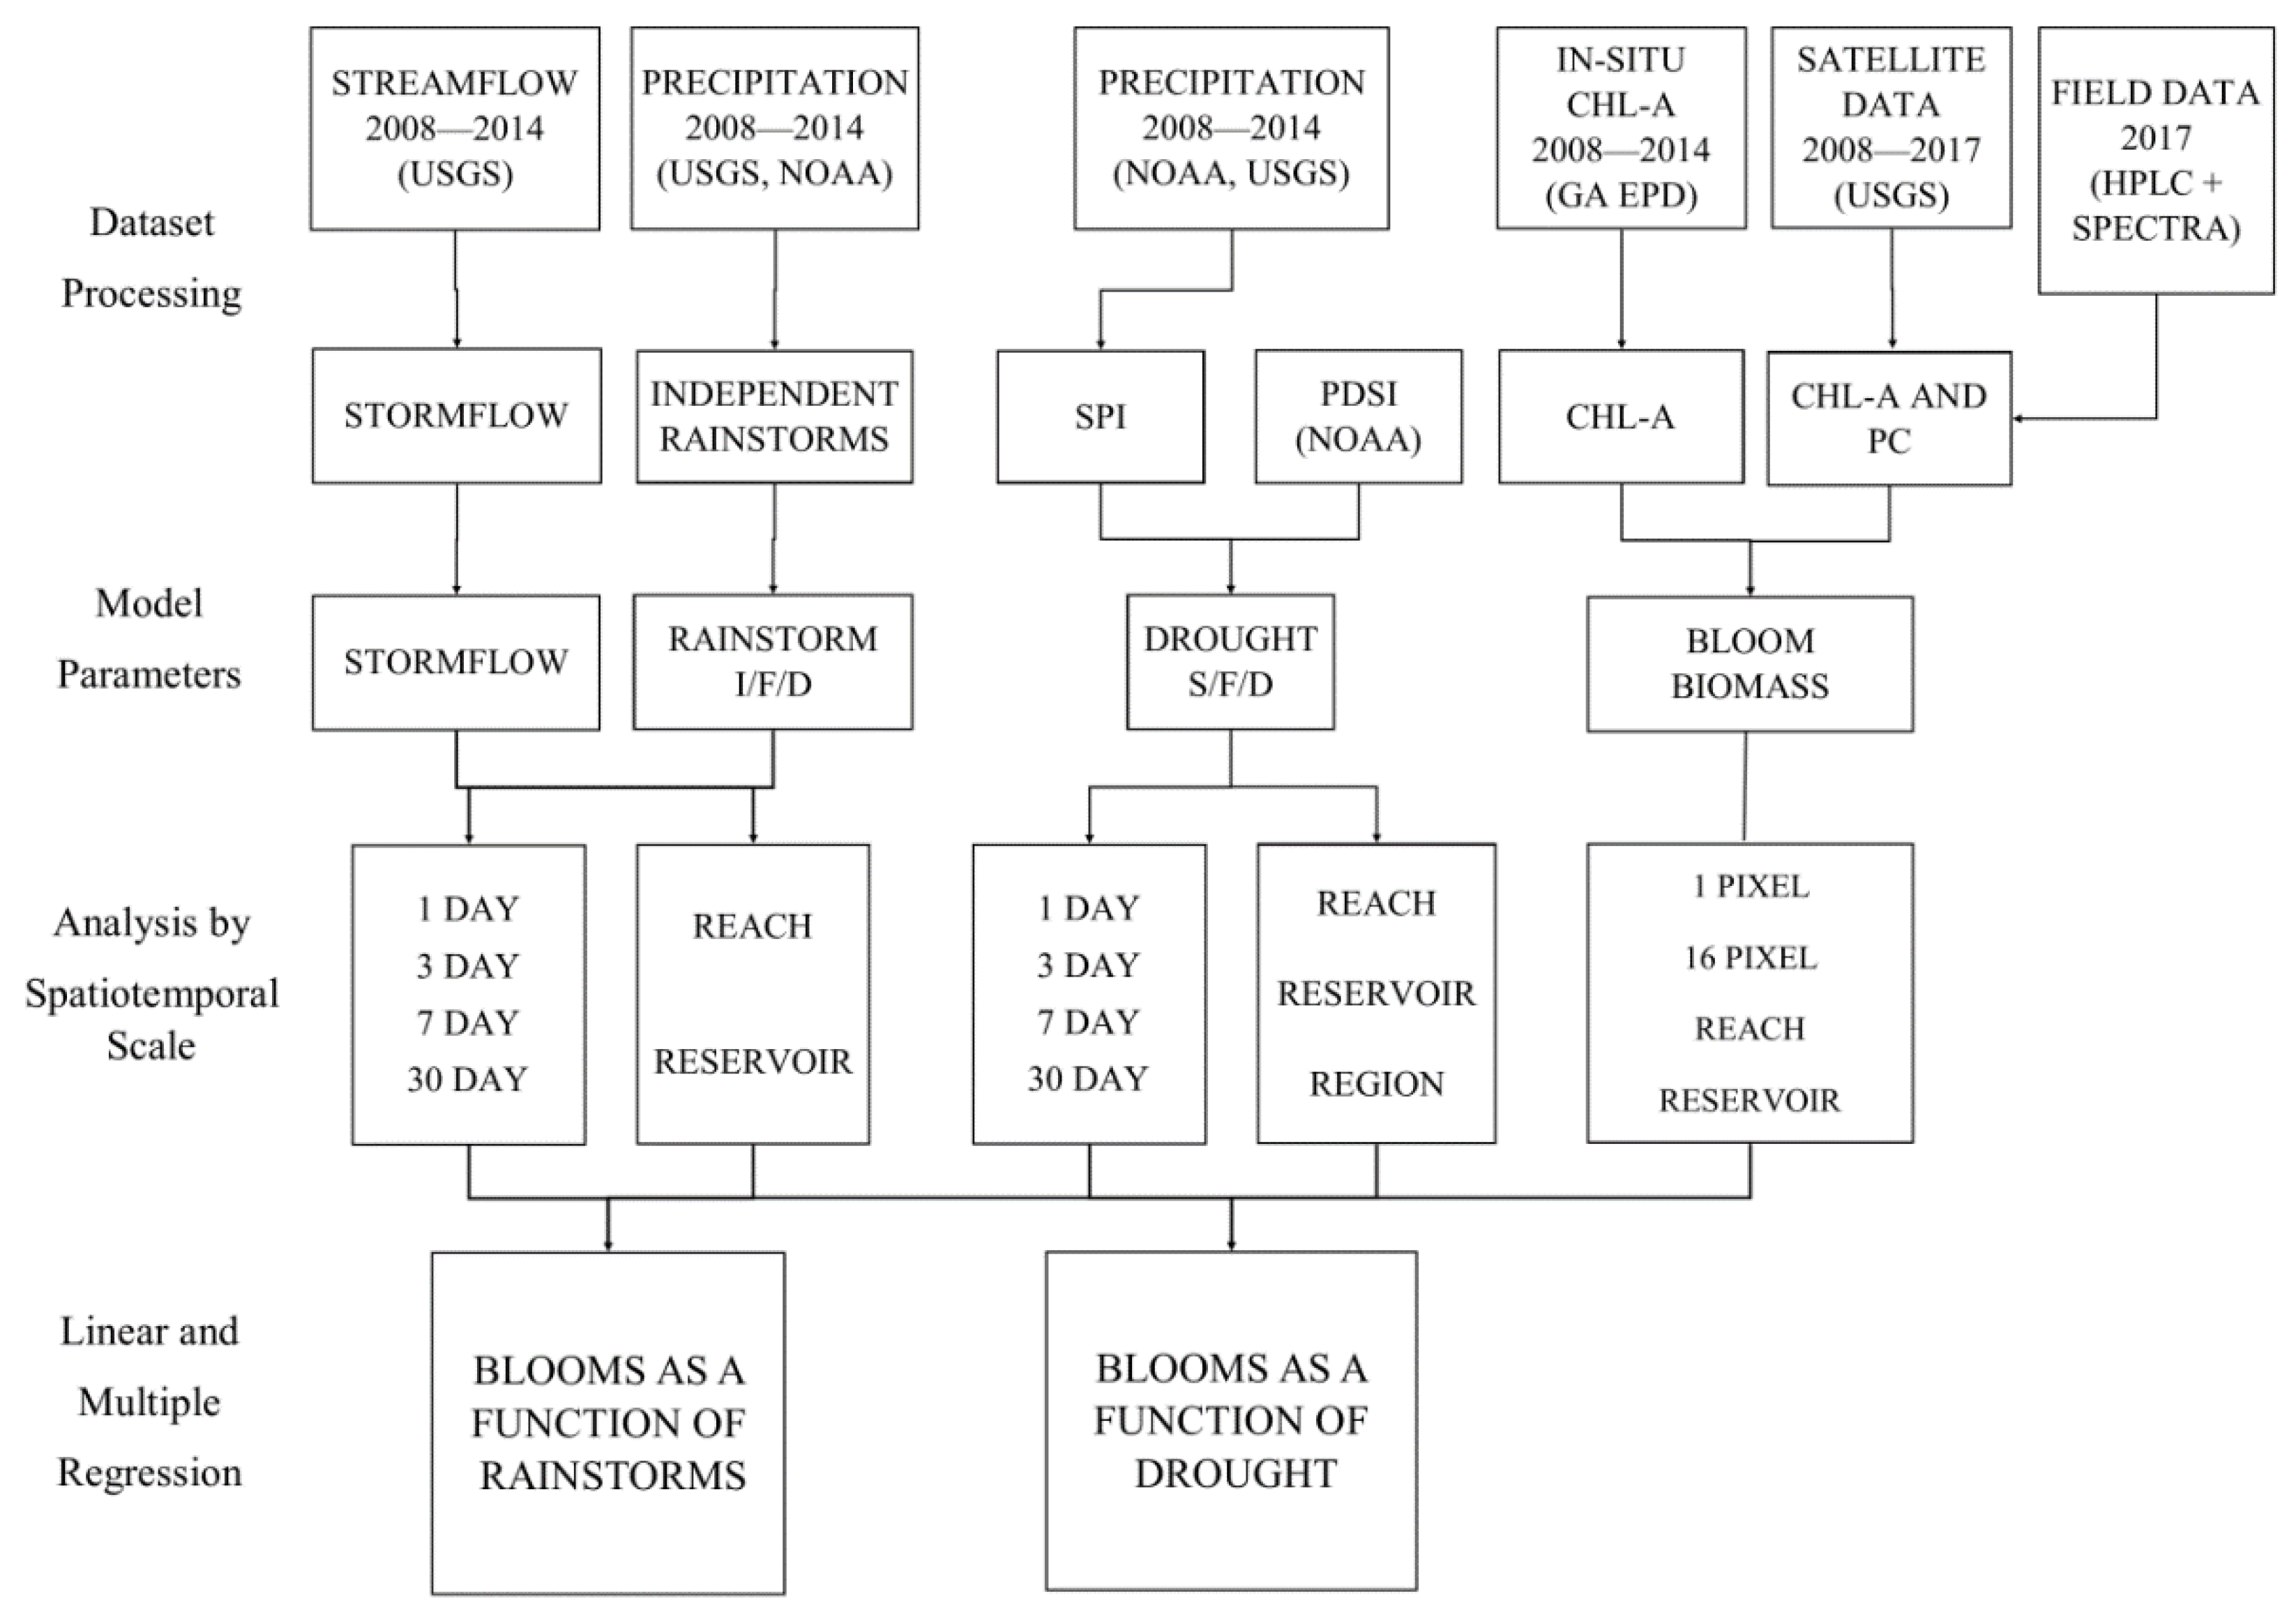
2. Materials and Methods
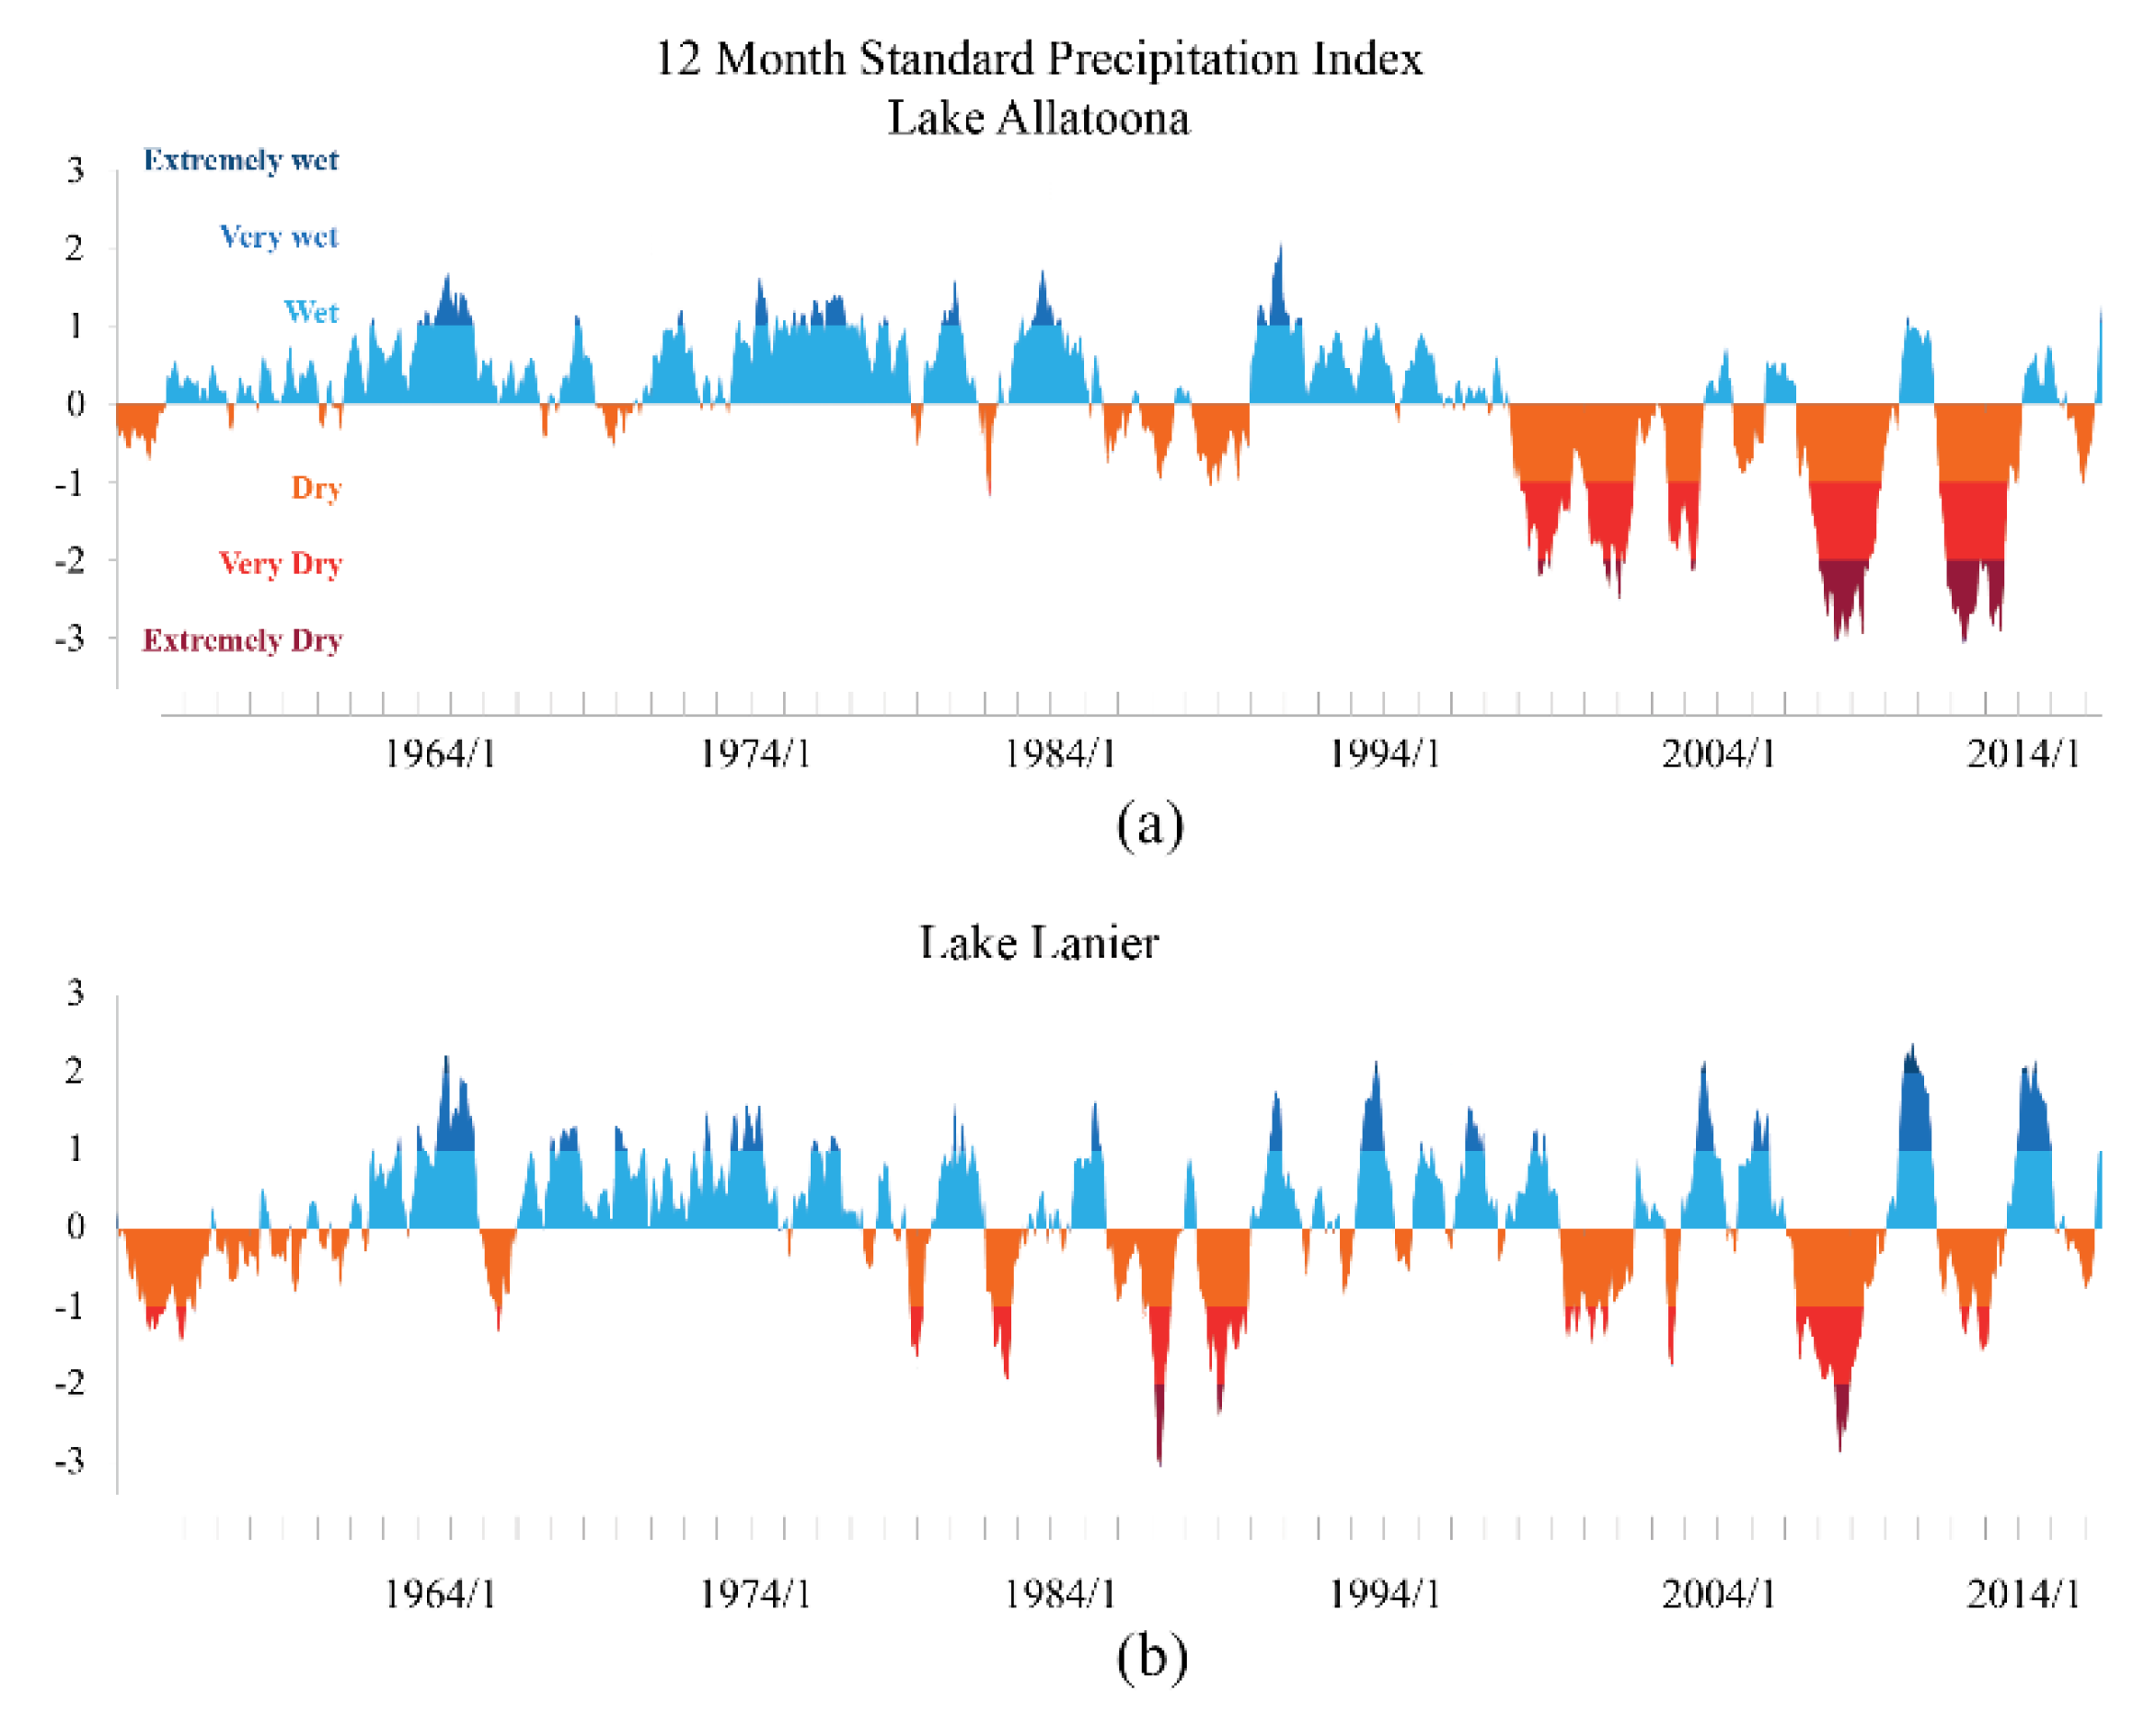
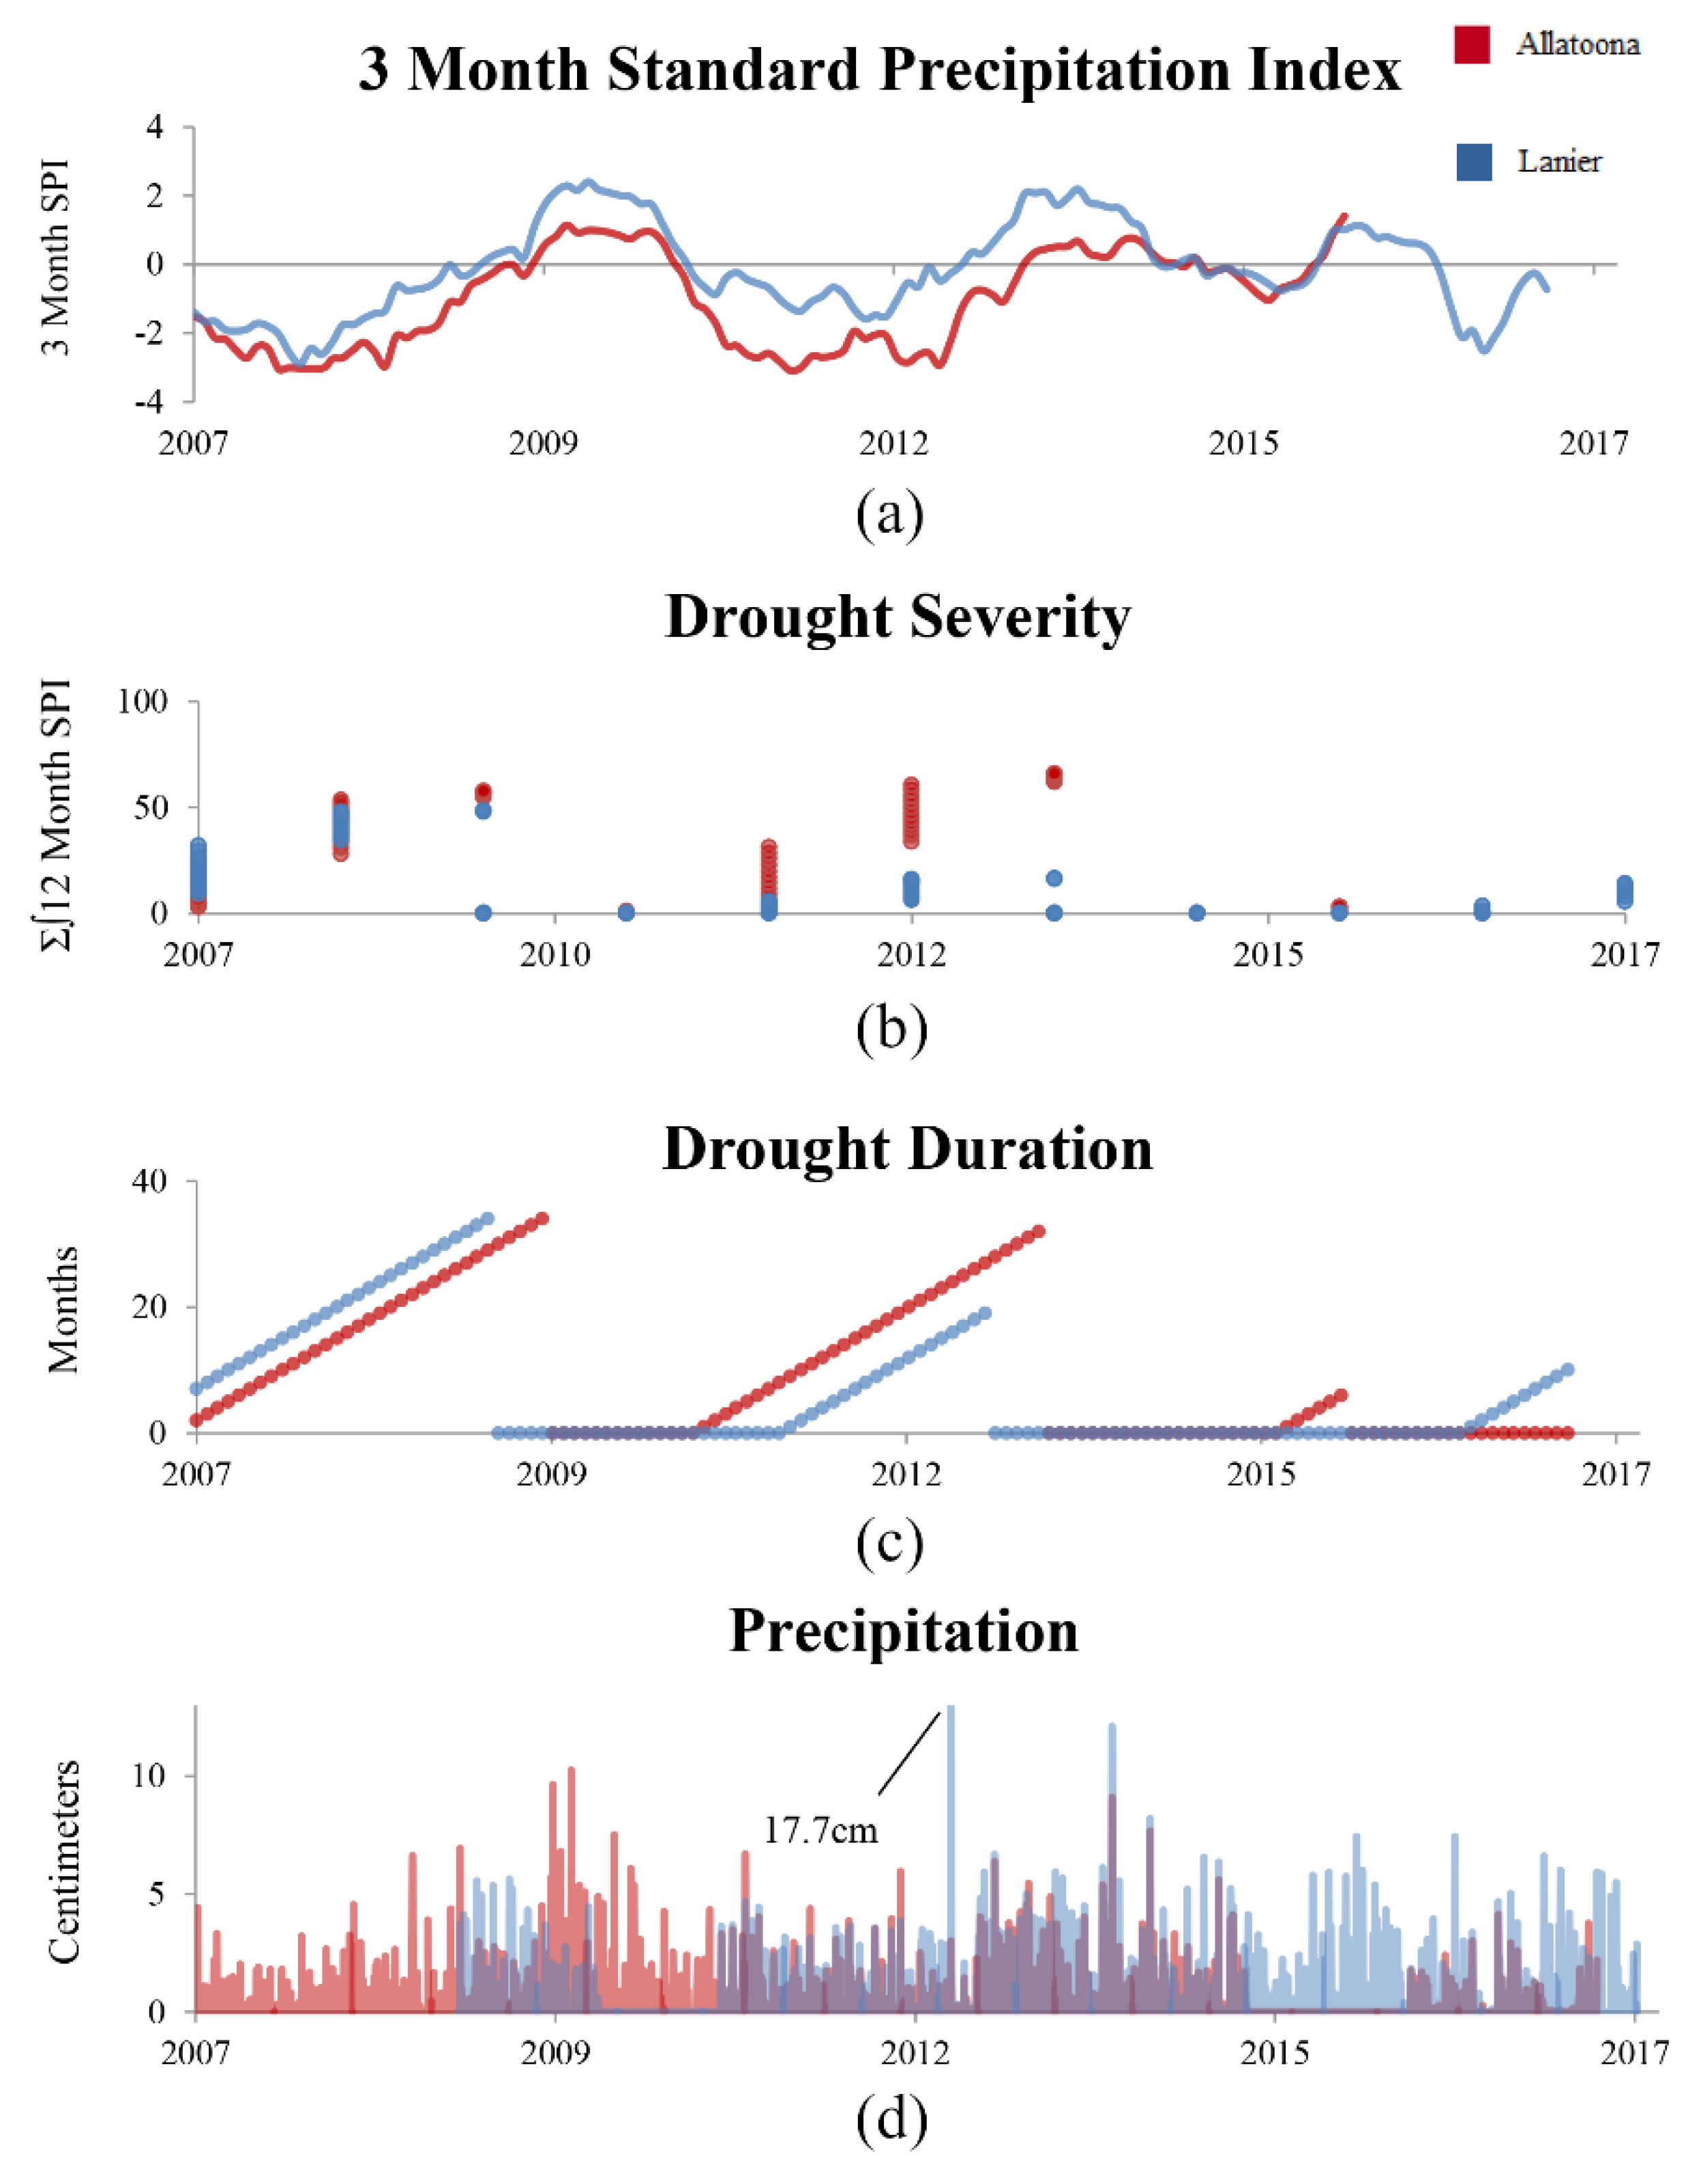
The hydrologic drivers of algal blooms considered in this study were drought, precipitation, and incoming streamflow at two reservoirs, Lake Allatoona and Lake Lanier, during the years 2008 to 2017 (Figure 2). Drought conditions at those locations were characterized using precipitation records from the United States Geological Survey (USGS) and the National Oceanic and Atmospheric Administration (NOAA), a constructed Standard Precipitation Index (SPI), and several NOAA drought indices such as the Palmer Drought Severity Index (PDSI). Drought events were categorized by severity, duration, and intensity (Figure 3). Independent precipitation events were also identified and categorized by rainfall intensity, frequency, and duration. Daily, weekly, and monthly streamflow data were gathered from USGS records for the major tributaries of the two reservoirs (e.g., Etowah River, Little River, and Chattahoochee River; Figure 4 and Figure 5). The photosynthetic pigment chlorophyll-a may be used as a proxy for algal biomass, and the type of phytoplankton may be characterized by the pigment phycocyanin, which is almost exclusively produced by cyanobacteria [35,36]. In situ chlorophyll-a concentrations obtained from the Georgia Environmental Protection Division (Georgia EPD) were used as the primary proxy for phytoplankton biomass, with water samples collected at Lake Allatoona and Lake Lanier monthly from April to October for the years 2008–2014. Our original study design called for modeled chlorophyll-a and phycocyanin to be extracted from Landsat satellite scenes from 2008 to 2017 to increase the length and the temporal density of the water quality dataset Figure A1). While we were unable to resolve the phycocyanin relationship with Landsat reflectance data during the field validation/calibration due to low in situ values, chlorophyll-a was still used as a remote sensing proxy for phytoplankton biomass (Figure 6). Physical and chemical water quality data gathered by the Georgia EPD were also obtained for the same duration (Figure 3). The in situ and remotely sensed proxies for algal biomass were analyzed as continuous data using ordinary least squares regression (OLSR), and bivariate linear models were fit to the data.
The two reservoirs, Lake Allatoona and Lake Lanier, were chosen for the study as representative of typical limnologic conditions for the recurrence of algal blooms in reservoirs in the Southeastern United States Piedmont (Figure 2) [24,37,38]. Both locations experience recurring algal blooms between May and October with a documented cyanobacterial component [18,24,39]. Phytoplankton and cyanobacteria data from the Environmental Protection Agency (EPA) National Lakes Assessment at Lake Allatoona show a population with potential for cyanotoxins: of the sampled phytoplankton in 2007, 45% were cyanobacteria by biovolume (predominantly Oscillatoria), and in 2012, the population was 17% cyanobacteria by biovolume [39,40]. The potentially toxigenic cyanobacteria genera also included Anabaena, Aphanizomenon, Aphanocapsa, and Cylindrospermopsis. Based on the EPA National Lakes Assessment 2012 measured concentrations of 0.14 μg/L microcystin, these populations have been shown to be toxin-producing in Lake Allatoona. While publicly available biovolume data were not found for Lake Lanier, potentially toxigenic genera were identified in a soft algae count by Georgia EPD during the study period at several tributaries to the reservoir, including Anabaena, Lyngbya, Phormidium, Pseudanabaena, Oscillatoria, and Tapinothrix [41].
These reservoirs provide drinking water to Gwinnett and Cobb County—a population of approximately 1.7 million people, as well as flood control and hydroelectric power. Lake Allatoona is a 0.45 km3 (367,000 acre-feet) reservoir created by a flood control dam northwest of the city of Atlanta, Georgia (Table A1) [33]. Allatoona is 27 km long but only 2 km wide at the widest point. Lake Lanier is a 1.3 km3 (1,050,000 acre-feet) reservoir directly northeast of Atlanta [42]. While Lake Allatoona drains a larger area, the reservoir area is smaller, resulting in a shorter average retention time compared to Lake Lanier (Table A1). Both reservoirs are primarily in the Georgia Piedmont (Figure 2), with a small portion of the Etowah watershed lying in the Blue Ridge [43]. Local climate is temperate to subtropical, with an average annual precipitation of 137 cm (54 inches). The majority of the rain falls in the winter months and sporadic July thunderstorms, and a warm dry period in the late summer [44,45]. Land use and land cover at the two watersheds is generally similar, with 62%–67% forested, 13%–18% developed, and 9%–15% used for agriculture, approximately half of which is used for poultry production (primarily broiler chicken houses) [46,47]. While the Georgia EPD designated use for both reservoirs is recreation, each has at least one associated Total Maximum Daily Load for chlorophyll-a due to nutrient over-enrichment [46,47].

2.1. Drought

Drought is defined using a variety of qualitative and quantitative metrics which often cross disciplines [32]. Drought was characterized for this study using hydrological and meteorological indices, including the PDSI, Palmer Hydrologic Drought Index (PHDI), Palmer Z-Index (ZNDX), and Palmer Modified Drought Index (PMDI), and the SPI (Figure 7 and Figure 8). These are all well-tested for representing the temporal variation in wet and dry periods as well as describing the magnitude of drought events and are used by NOAA and the U.S. Departments of Commerce and Agriculture [48]. The original PDSI classifies monthly weather conditions from >4, or extremely wet, to <−4, or extreme drought, using a water budget estimated from potential evapotranspiration, recharge, combined available moisture capacity, soil moisture loss, and runoff in a simulated soil bilayer [48]. The results are then scaled based on historical temperature and precipitation for the region. While caution is necessary when using single indices to define drought events, the indices are a robust metric when used in concert [32,48]. The four Palmer Indices used in this study were obtained from the National Centers for Environmental Information for Georgia Climate Division II and cover January 2007 to October 2017.
The SPI was constructed for the two reservoirs using precipitation data from the nearest rain gauge with a 30 year or longer record (Figure 7). The strength of using the SPI is the ability to compare values between regions, as the index does not represent the absolute values of precipitation, but rather a data-transformed probability of each month’s precipitation volume, based on historical norms [49]. The SPI also does not assume a Gaussian data distribution for precipitation values and is easily calculated for the time scale of interest [49]. The 3, 6, and 12 month SPI were constructed using data from Adairsville, near Lake Allatoona, and Gainesville, near Lake Lanier, using software obtained from the National Drought Mitigation Center [50]. A gamma distribution is fitted to the data by the software, obtaining monthly z-scores for precipitation which are then used to interpret drought [51]. Following McKee et al. [52], a drought event was considered to have begun when the SPI first fell below −1, ending when the values next became positive.
Drought severity, intensity, and duration were obtained from the 12 month SPI datasets, which are more representative of hydrologic drought than the 3 month index, a proxy for soil moisture, or the 6 month index, which has characteristics of both timescales [53]. Drought severity was defined as the absolute value of the cumulative area under the curve of the index and drought duration as the cumulative number of months since the event started. The drought intensity was defined as the running lowest SPI per event [54]. SPI data for the region were also obtained on 1 to 24 month scales from NOAA, but linear regression showed that the local SPI often explained a higher percent of the chlorophyll-a variance.

2.2. Rainstorms and Stormflow

Precipitation data were obtained from the watersheds of the Etowah River, the main tributary to Lake Allatoona, and the Chattahoochee River, which forms the valley of Lake Lanier (Figure 4). Unit hydrographs were constructed for the upper catchments. The lag time for the propagation of energy from observed rainstorm events to the reservoirs was estimated to be three hours for Lake Allatoona, and approximately six hours for Lake Lanier. Independent rainstorms, here defined as statistically discrete precipitation events, were also obtained with the separation method proposed by Restrepo-Posada and Eagleson [55]. A record of 15-minute precipitation depths was fitted with a gamma distribution, from which a Poisson cumulative distribution function of rainstorm arrivals was obtained using the bootstrap method. From the cumulative distribution function, a coefficient of variation was obtained, which represents the minimum period necessary to classify the next rainstorm as independent. This method is sensitive to missing data, and so the nearest rain gauge with a continuous record of at least ten years was used for each reservoir’s catchment. Independent rainstorm depth and duration were obtained, from which intensity (depth divided by duration), duration, and frequency (return period) were determined.
Discharge at the main tributaries for both reservoirs were defined as stormflow when the mean discharge on a flow duration curve had a probability exceedance between 0 and 0.5. Stormflow conditions in the Etowah Watershed were defined as discharge exceeding 28 m3 s−1 (1000 cfs, cubic feet per second) in the Etowah River and 4 m3 s−1 (141 cfs) in the Little River tributaries of Lake Allatoona (USGS gage number 2391860, USGS gage number 2392780). Stormflow conditions in the Chattahoochee River at the mouth of Lake Lanier were defined as discharge measurements beyond 21 m3 s−1 (740 cfs, USGS gage number 02331600).

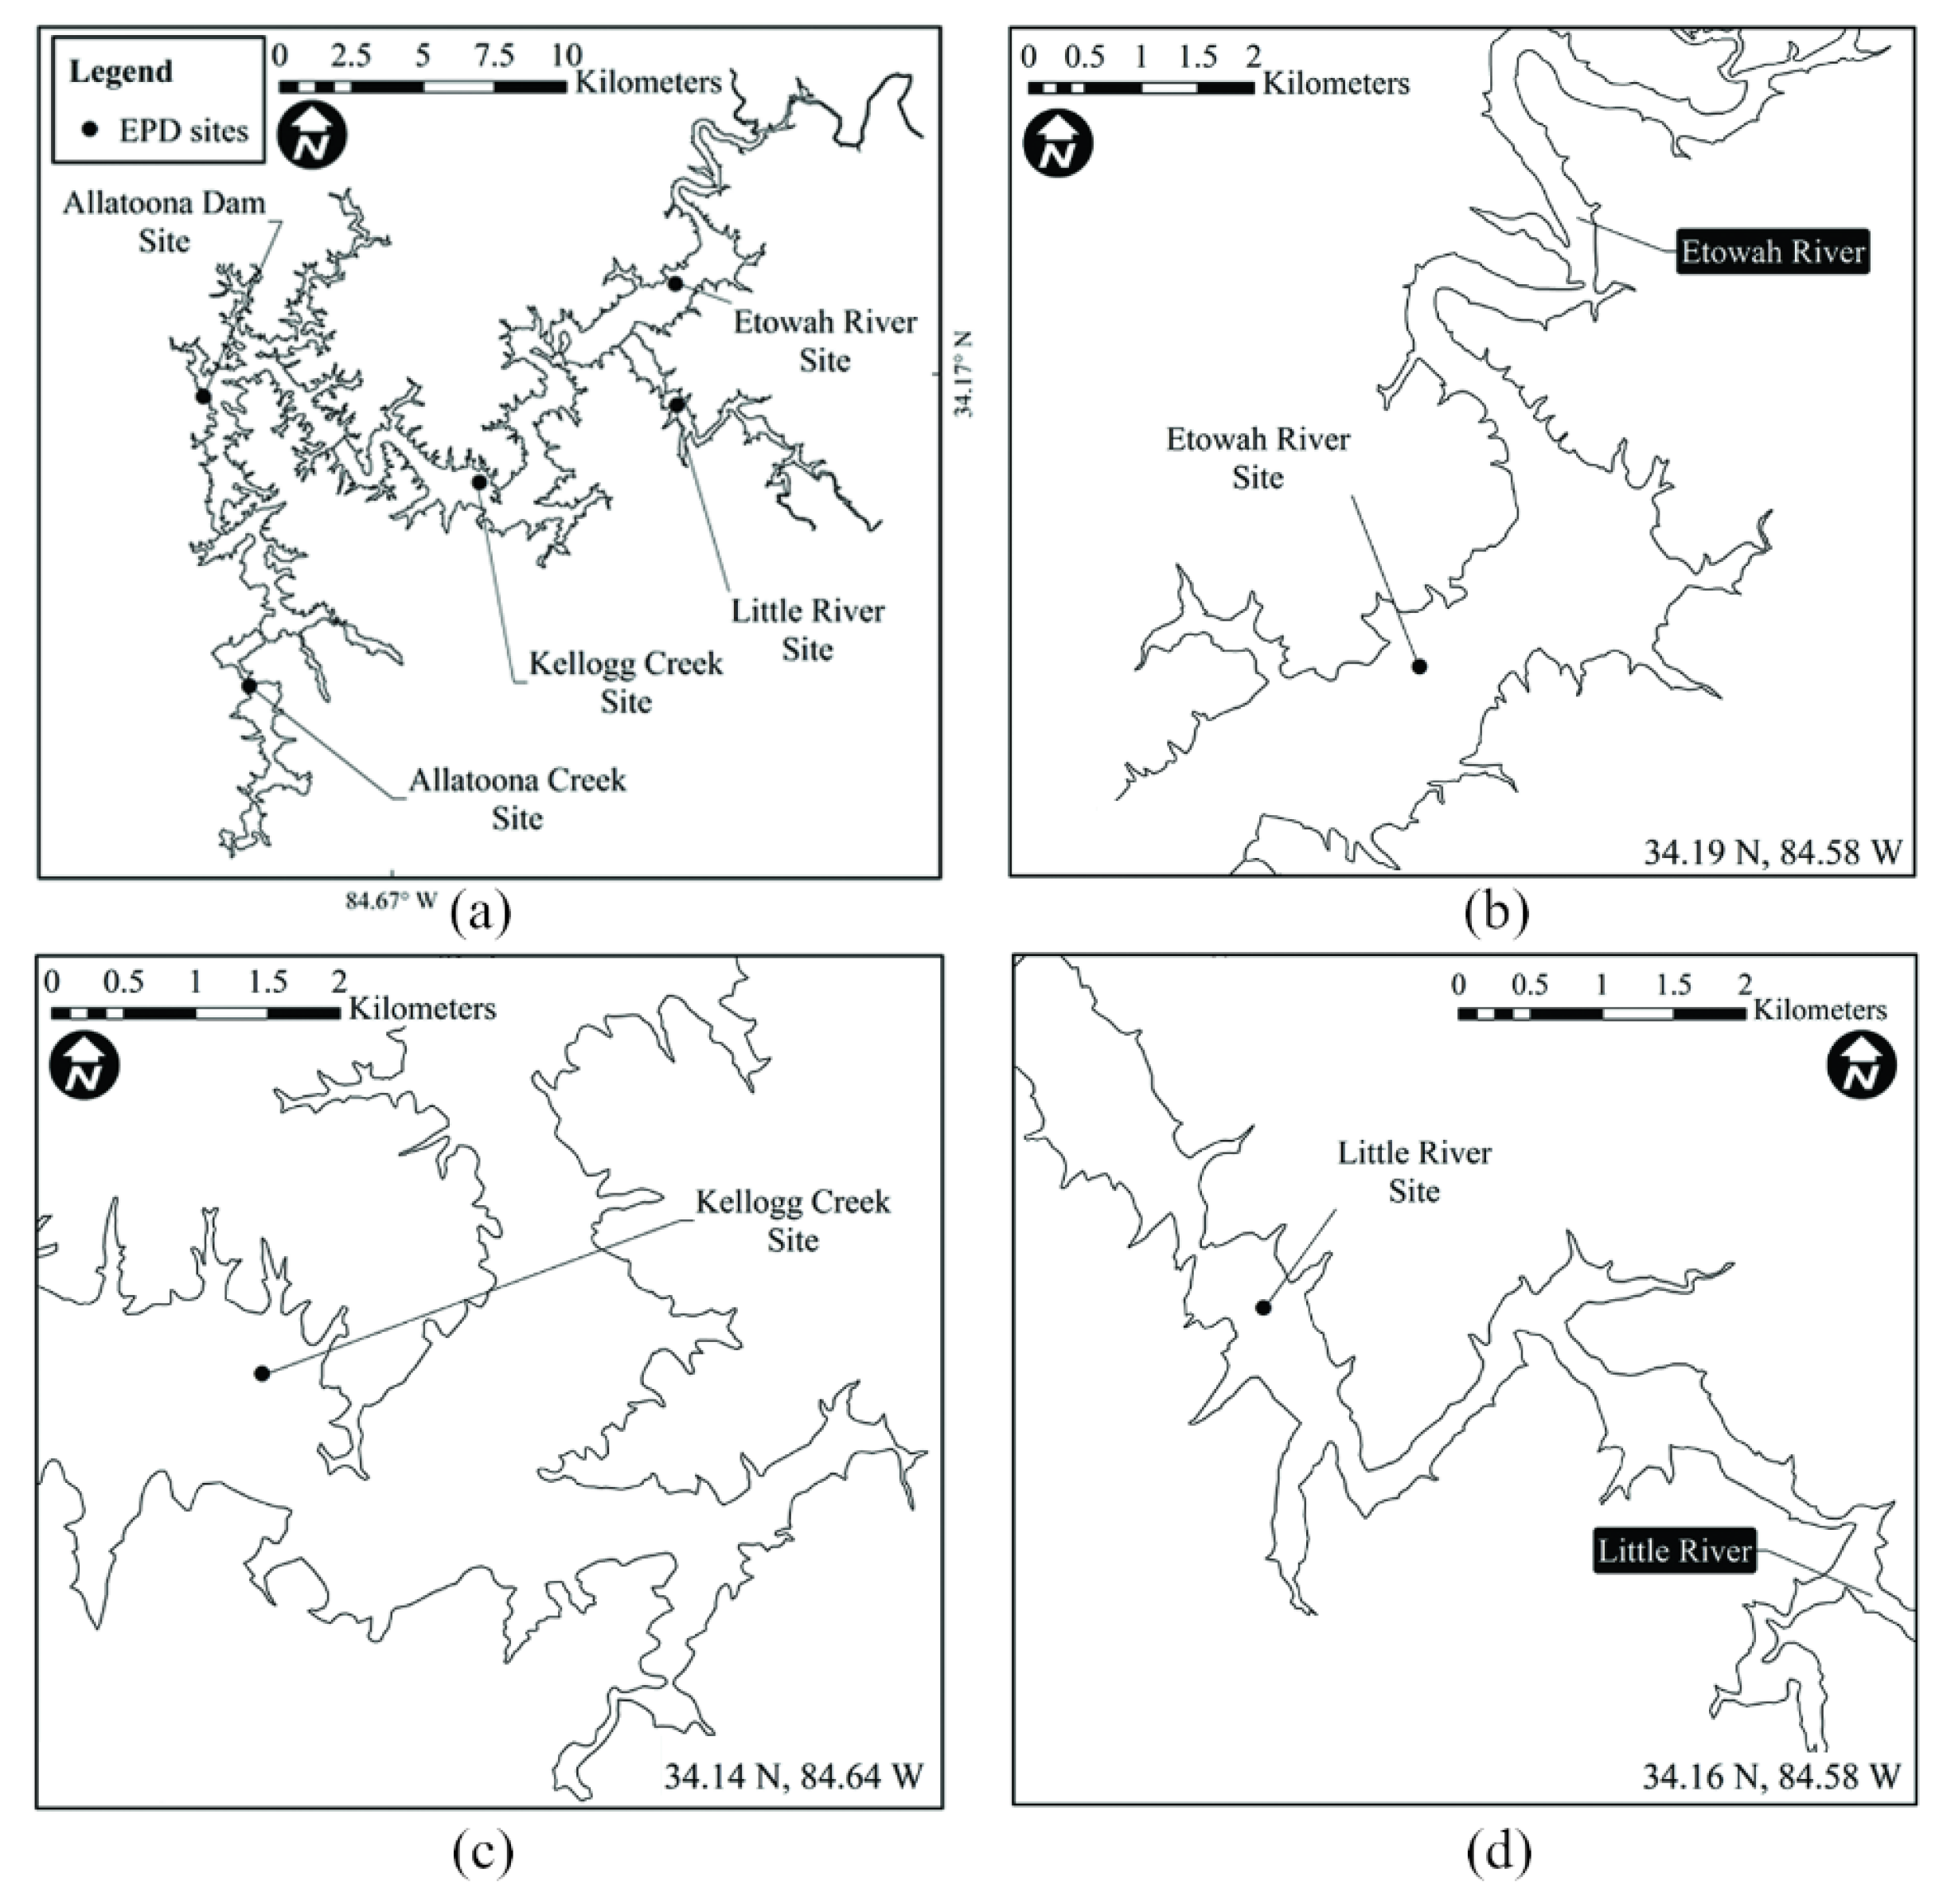
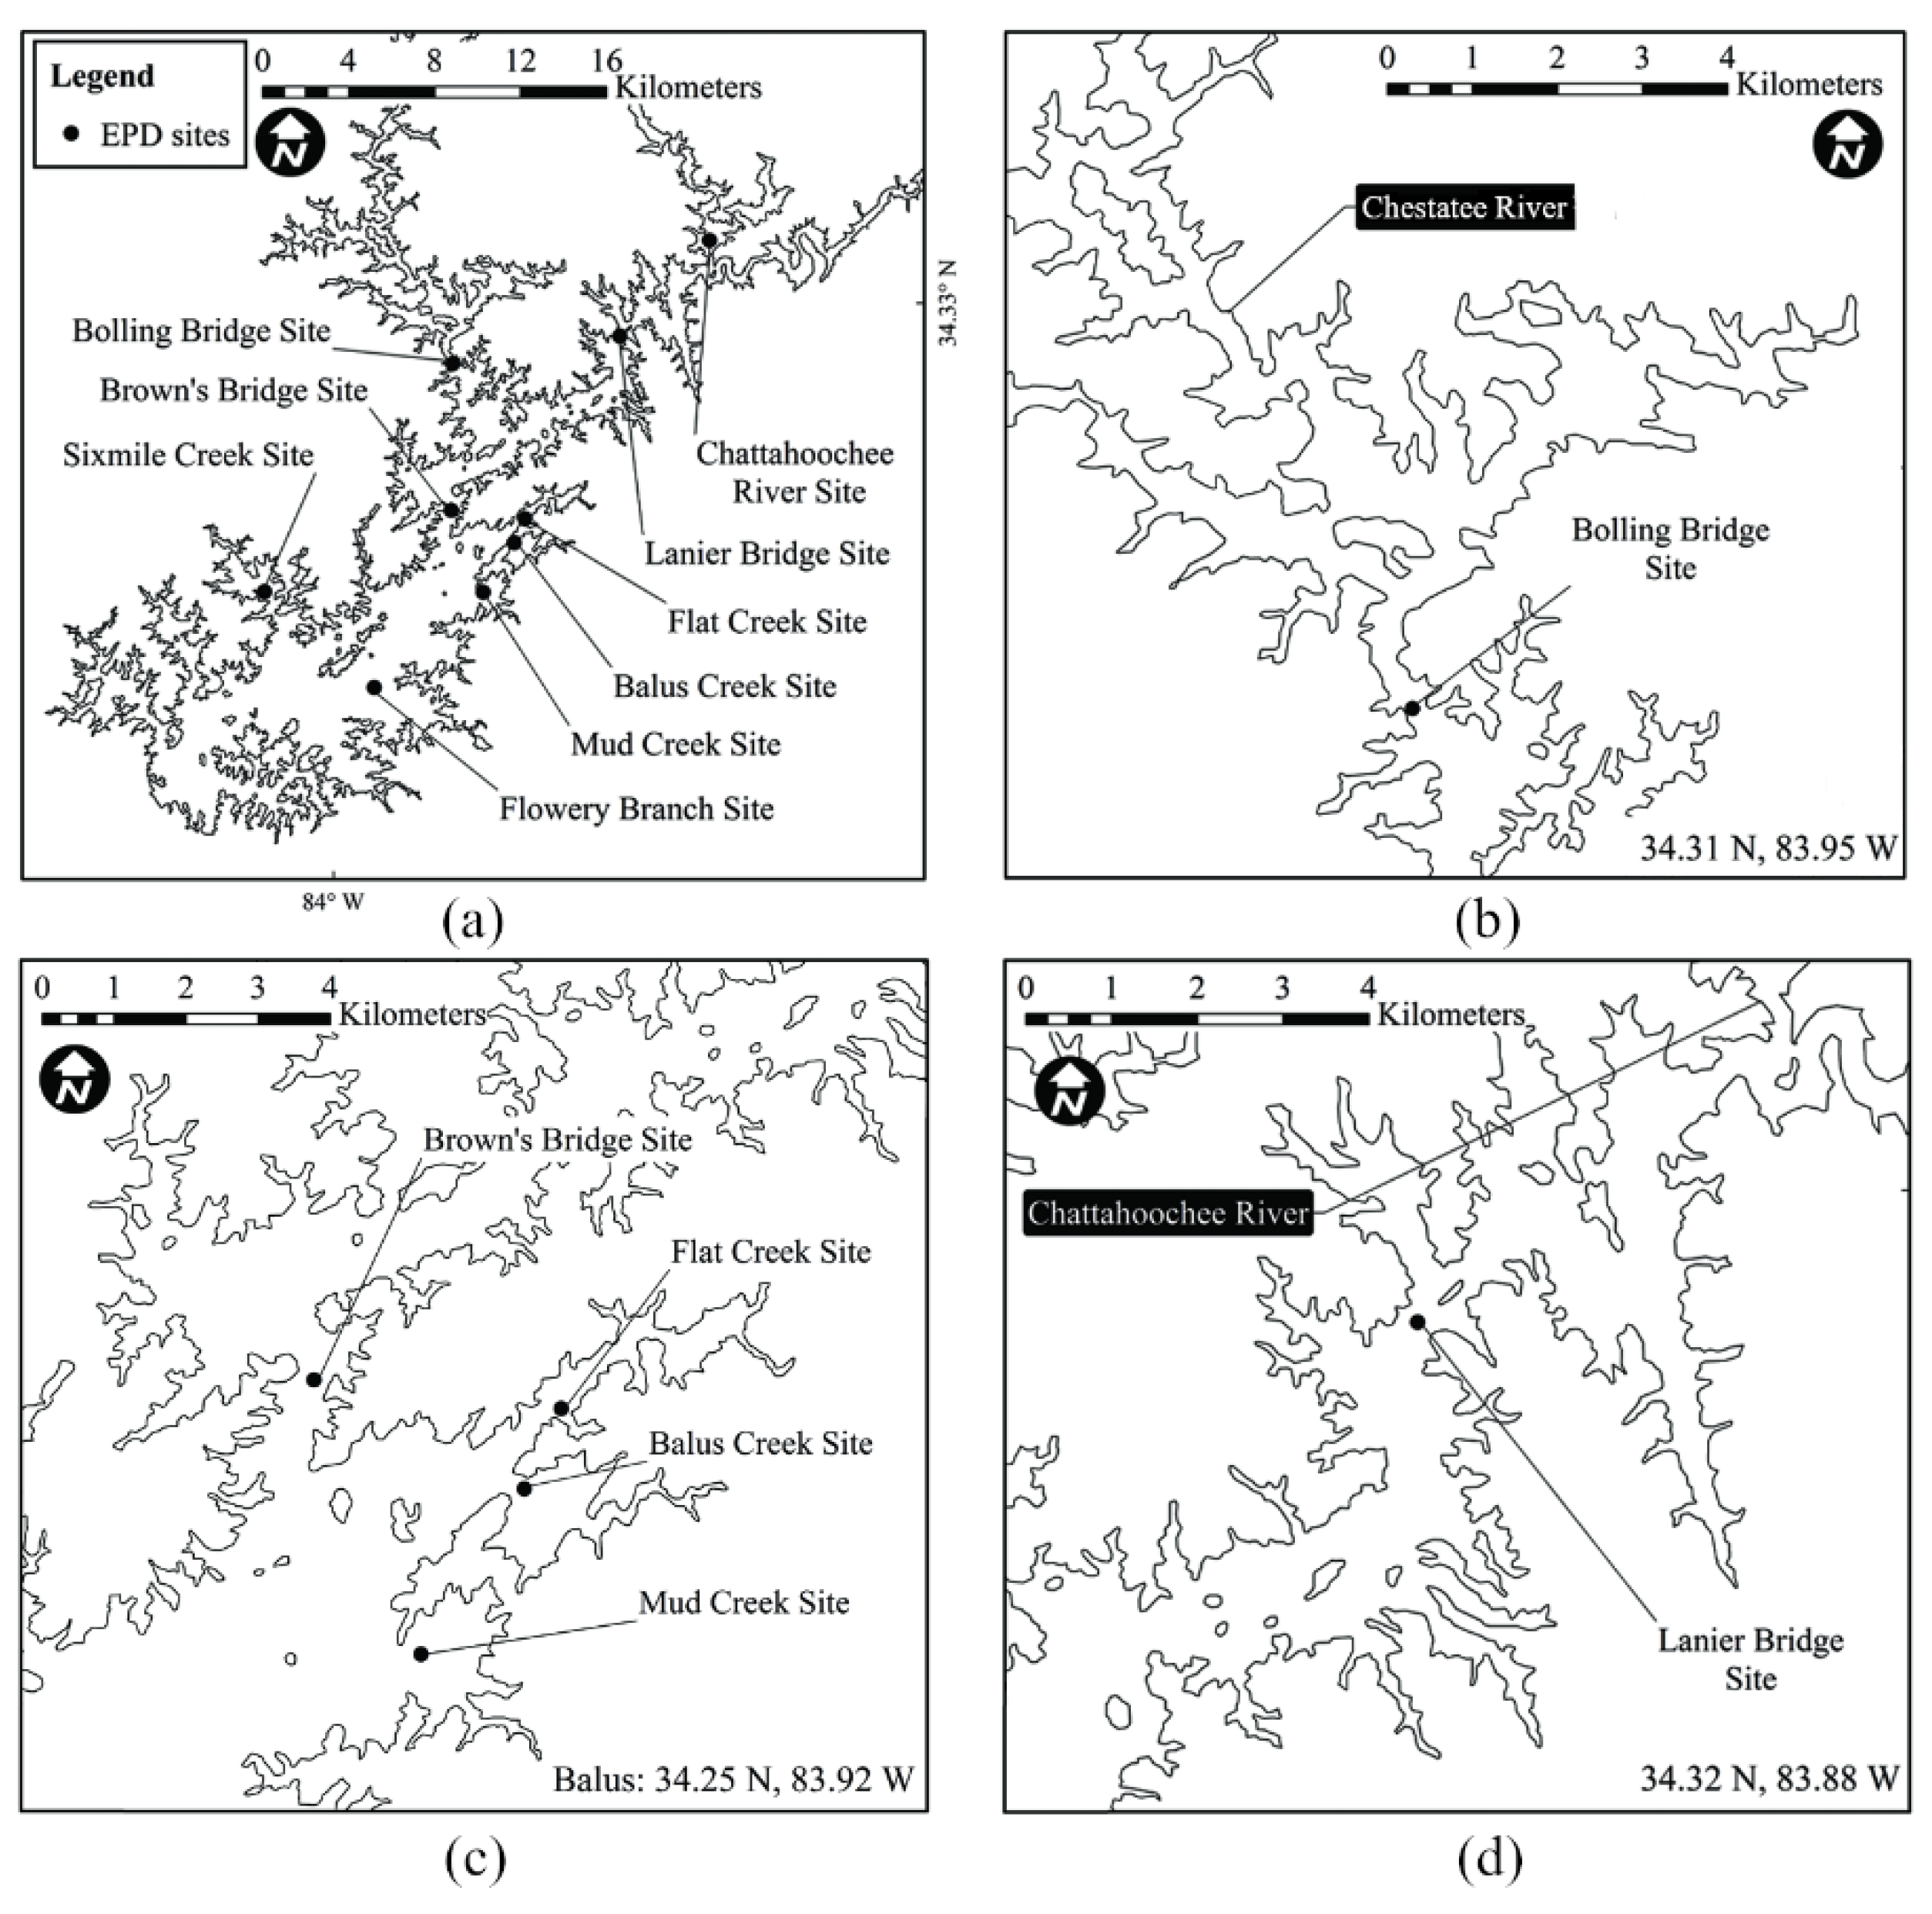
2.3. Temperature and Water Quality
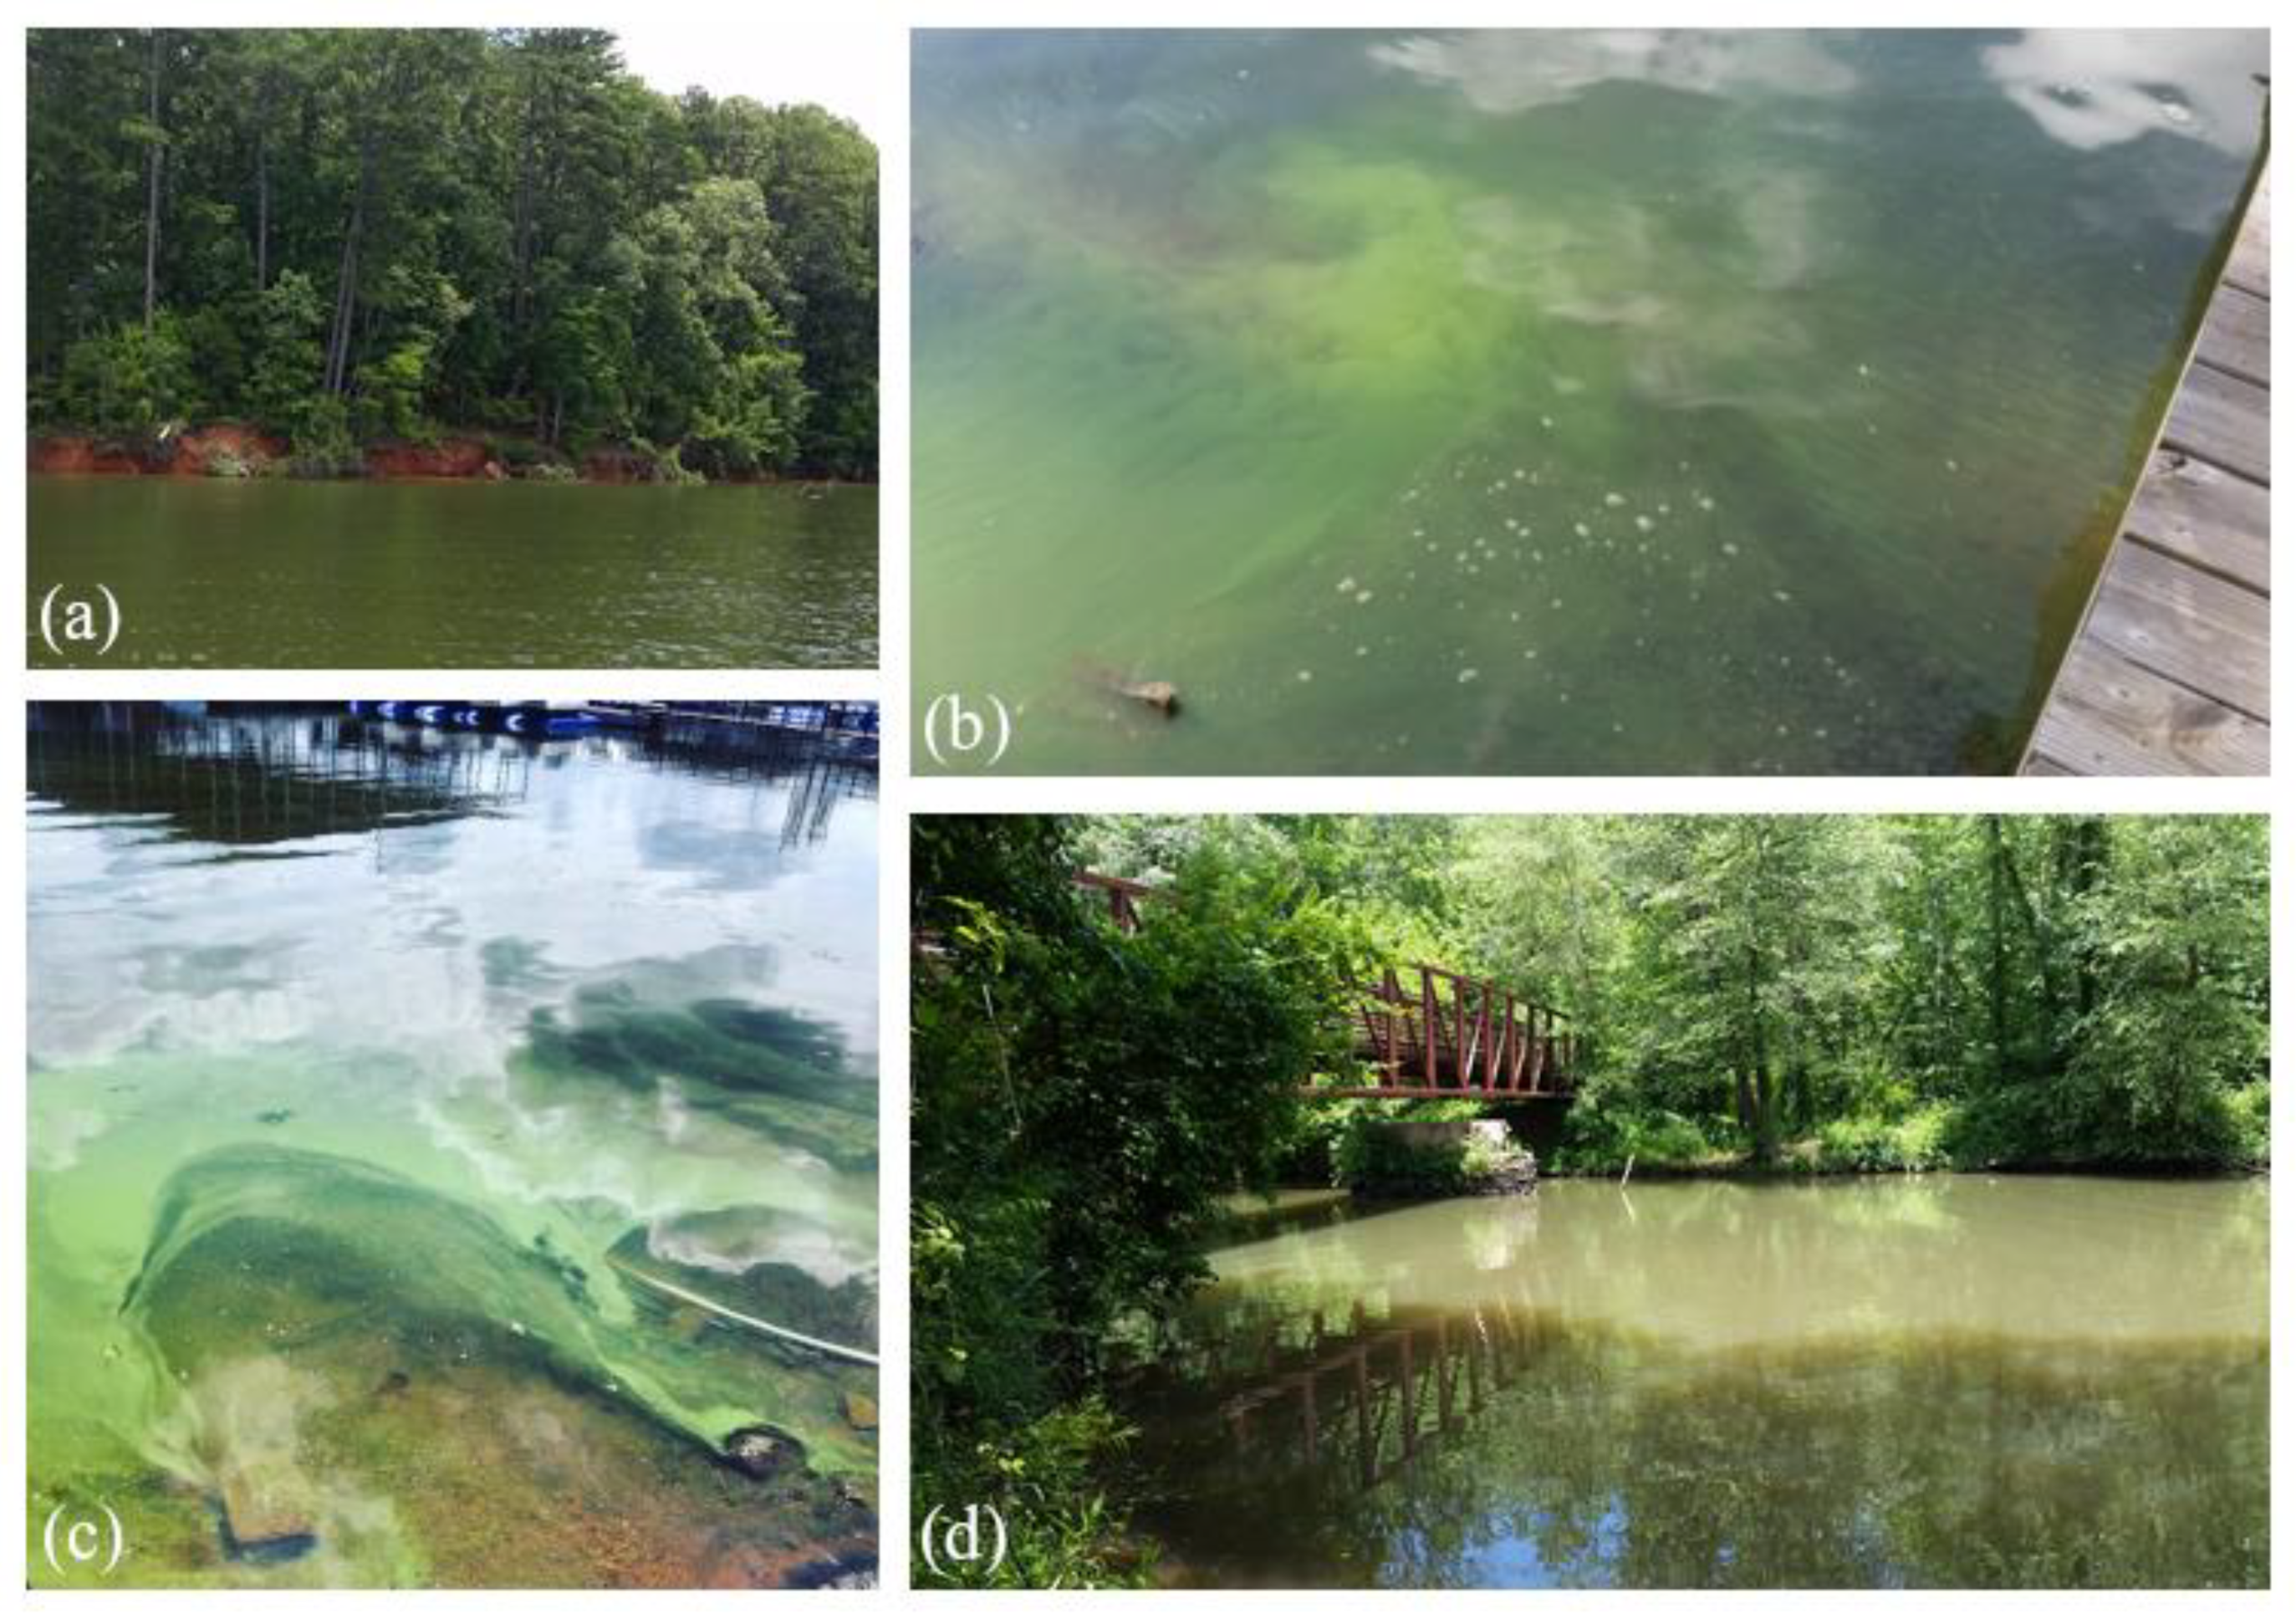
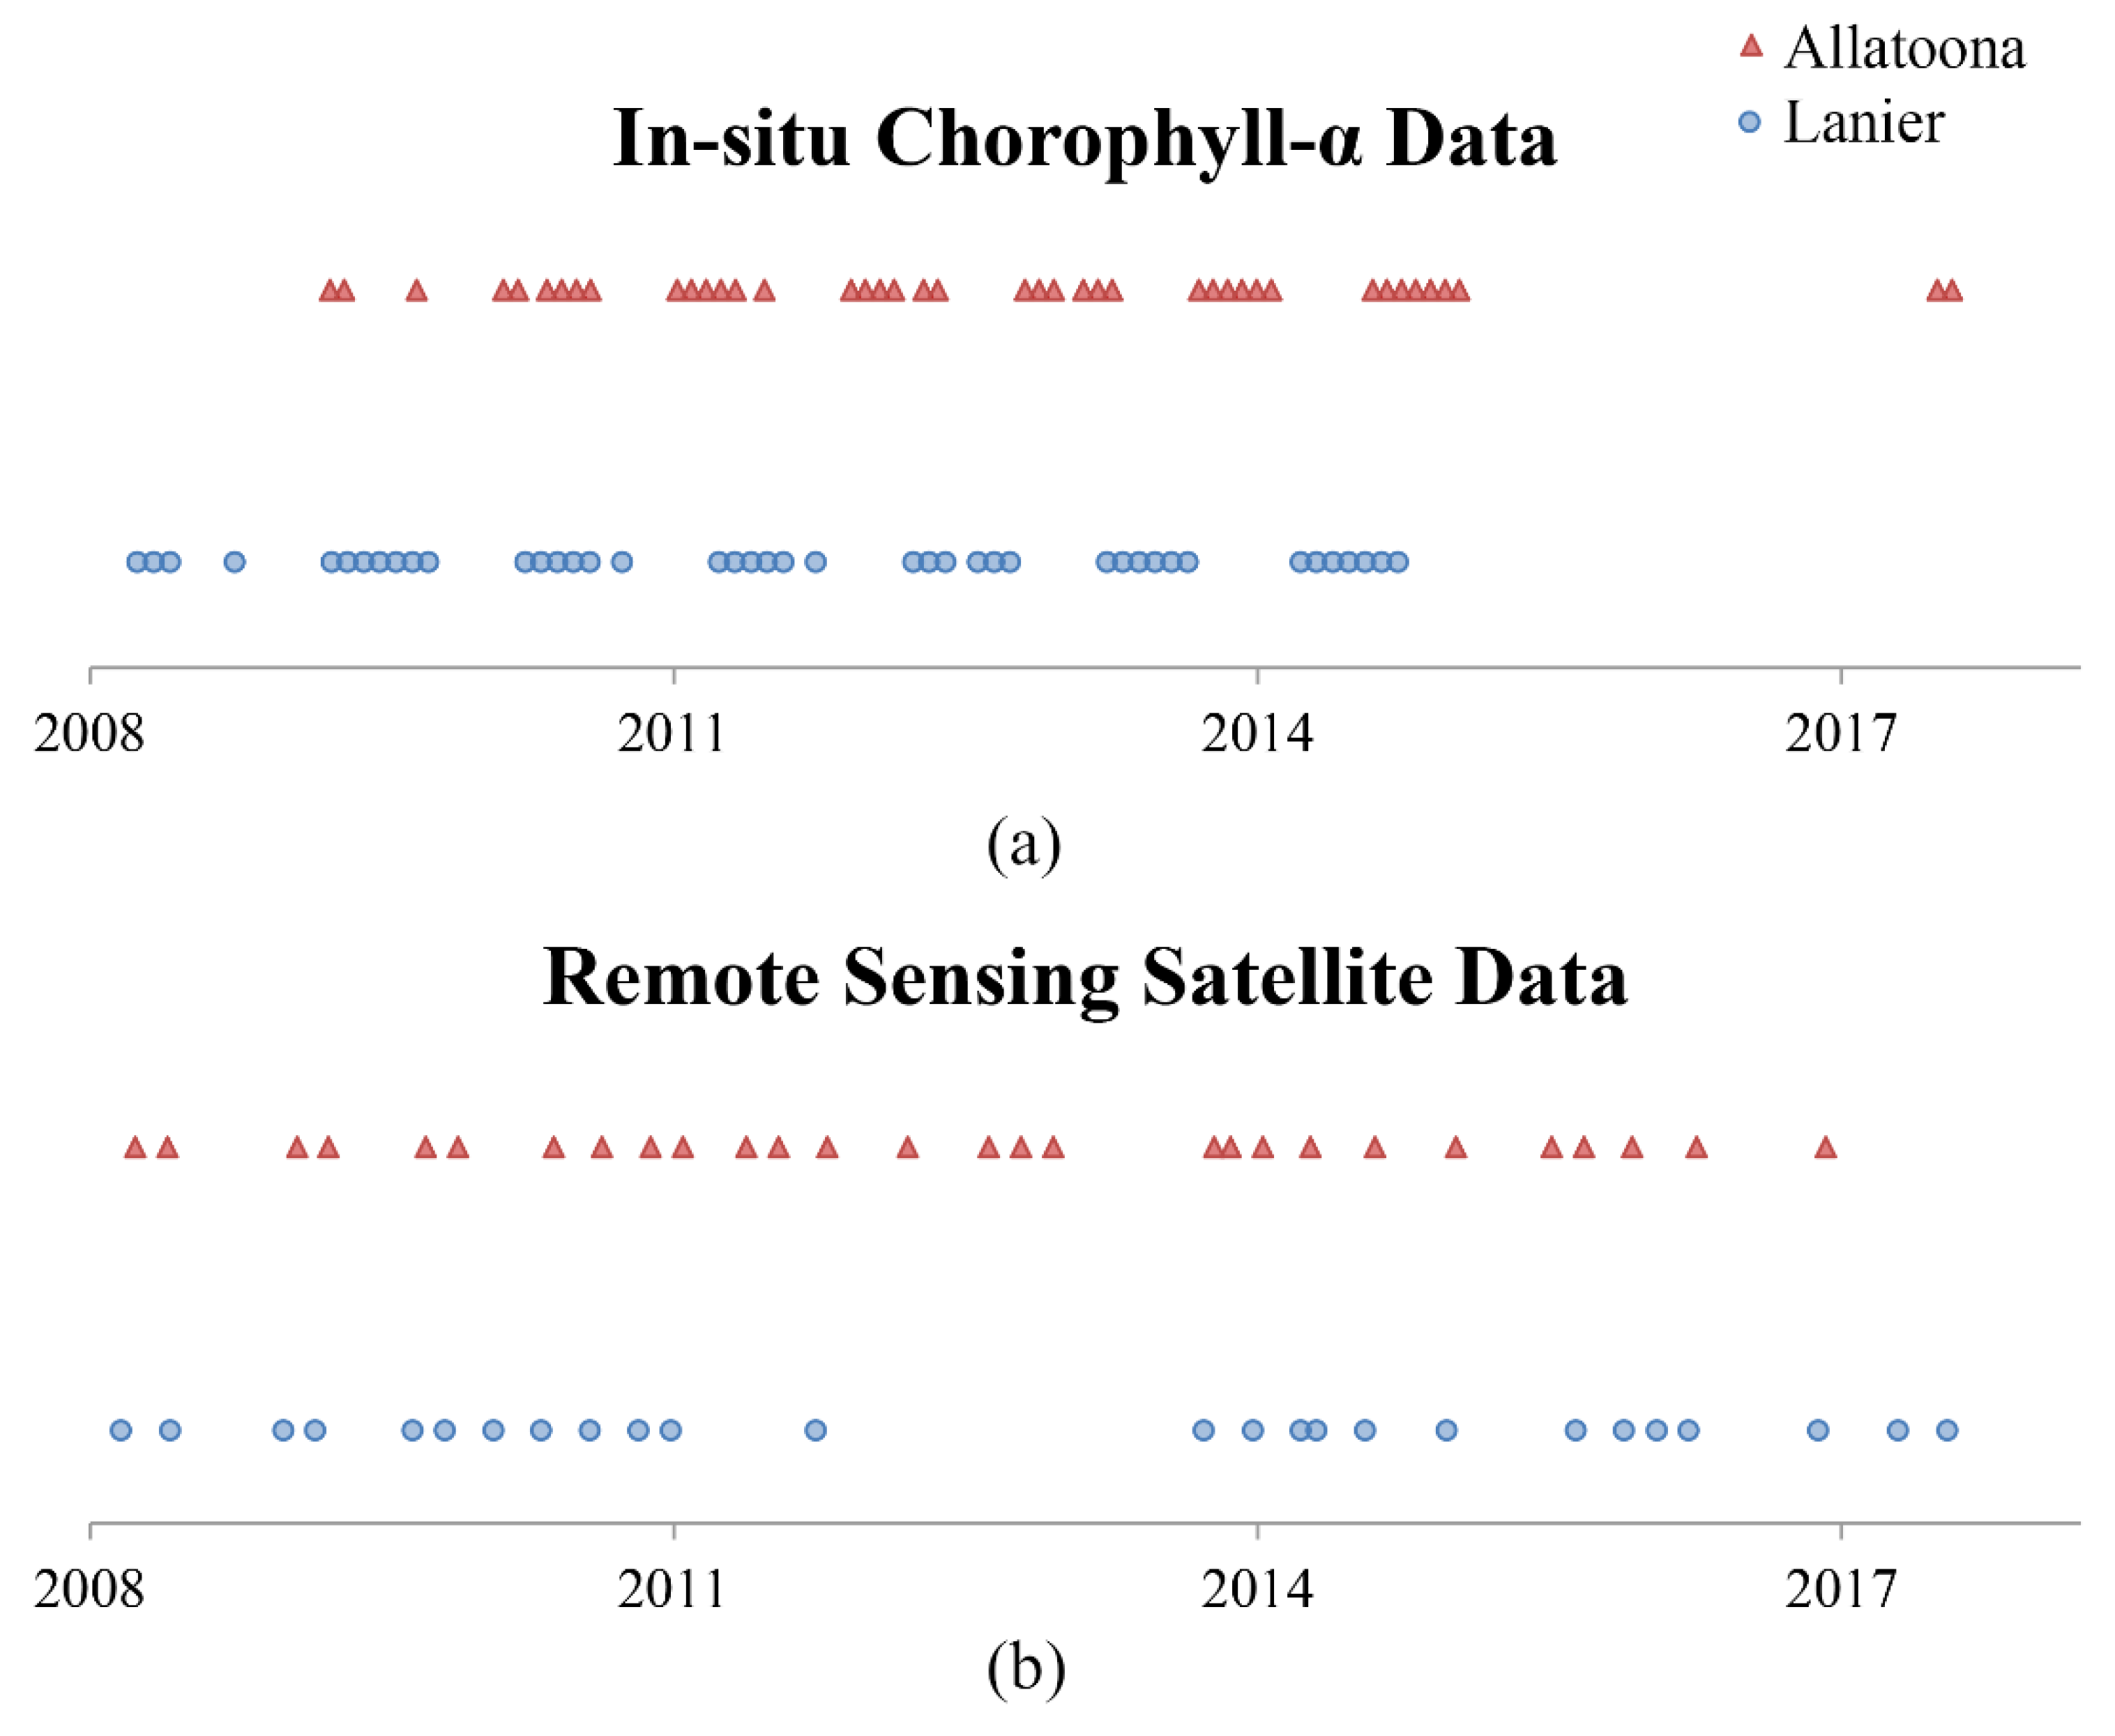
Air temperature data were obtained for the two reservoirs from the USGS, and water quality parameters including turbidity, total phosphorus, total nitrogen, and Kjeldahl nitrogen were gathered from the Georgia EPD. Due to irregular sampling intervals and low sample sizes for the nutrient concentrations, total phosphorus and total nitrogen data were not incorporated into the final linear models. Average depths in the reservoirs at each data site were obtained from NOAA Raster Navigational Charts.

2.4. Algal Blooms

Algal blooms may be identified by lab analysis, or by in situ fluorometric measurement of the absorption by their key pigment, phycocyanin [56,57]. In longitudinal studies, the pigment chlorophyll-a is commonly used as a proxy for algal bloom biomass, both for in situ and remote sensing applications. In situ chlorophyll-a data for both Allatoona and Lanier were obtained from a Georgia EPD dataset in which measurements were collected monthly from 2008 to 2014, April through October, at designated sites within major reservoir embayments.
Landsat 5, 7, and 8 satellite data over the same time period were processed to collected remotely sensed chlorophyll-a and phycocyanin values covering the entirety of each reservoir, throughout the year [58]. Cloud-free scenes were collected from 2008 to 2017 and corrected to minimize variations caused by weather, season, and instrument. Scenes were standardized using atmospheric corrections by the Dark Object Subtract method, radiometric corrections, and gain and offset calibrations [35,59]. Using the resulting surface reflectance products, two pigment detection algorithms were applied. Cyanobacterial concentrations were modeled using an empirical approach developed in Lake Erie for modeling phycocyanin [35]. Phytoplankton biomass was modeled using an algorithm for the detection of chlorophyll-a based on the near-infrared to red band ratio [36]. Once each scene was processed, the data were extracted at each embayment using ArcGIS software and used as chlorophyll-a and phycocyanin indices. Modeled phycocyanin data were extracted from the Georgia EPD site locations with the intention to compare historical chlorophyll-a and modeled phycocyanin data. Modeled chlorophyll-a data were extracted both at Georgia EPD site locations and at each reservoir reach, from which maxima, minima, and standard deviations were calculated. The remotely sensed data and in situ measurements did not fall on the same days within the study period of 2008 to 2017, and so data were compared with up to seven days difference between modeled and in situ measurements, and field measurements were taken to try to further clarify the relationship between the satellite and in situ data.
The field measurements took place on Lake Allatoona in July and August of 2017 (Figure 6) [58]. On days of Landsat 8 overpass, coincident water quality and surface reflectance measurements were taken at the Etowah River, Kellogg Creek, and Little River embayment sites used by the Georgia EPD in the 2008 to 2014 survey (Figure 4). Surface water quality data were recorded to provide context (water temperature, pH, dissolved oxygen, electroconductivity, Secchi disk depth, turbidity, and in situ hyperspectral surface reflectance) and grab samples were collected (Figure 6). Water samples were filtered to obtain pigment material, labelled, and stored on ice until analysis by high performance liquid chromatography [60,61]. The concentrations of phycocyanin were below detection limits, and so were not resolved from the field water samples. As the phycocyanin data were not able to be field calibrated and validated, the remotely sensed phycocyanin data were not used in the linear models. The chlorophyll-a data were compared with satellite and field spectra and relationships were obtained between the chlorophyll-a and other parameters at Lake Allatoona.

2.5. Modeling

Quantitative data from historical, remotely sensed and in situ datasets for Lake Lanier and Lake Allatoona were checked for distribution, outliers, and kurtosis. Variance in water quality, residence time, and nutrient supply is often high between arms of a dendritic reservoir, and the mean chlorophyll-a was found to be statistically different depending on the collection site (Welch’s Heteroscedastic F = 14.2, DF = 4 and 91.9, p << 0.05), and so each embayment was treated as a separate sub-lake for analysis. The resulting 14 embayments—five from Allatoona and nine from Lanier—each had in situ and remotely sensed proxies for phytoplankton biomass including historical chlorophyll-a concentrations and the remote-sensing chlorophyll-a index (Section 2.4). The independent variables representing drought, rainstorms, and flow each had several spatiotemporal scales, and so sensitivity analysis was performed to remove redundant inputs. The continuous chlorophyll-a data were modeled as a function of each explanatory variable using ordinary least squares regression (OLSR), and those parameters which explained at least 10% of the variance in any case were preserved. Additional dimensional reduction was performed in R using Random Forest regression [62,63,64]. The best individual parameter predictors for each site were chosen for further modeling using multiple regression.
For each site, the data subset was first checked for quadratic and higher-order relationships, complex interactions between predictor variables, and over-parametrization. A generalized additive model was first used to fit non-parametric linear regression smoothers to each predictor variable and the response variable to visually test whether a significant nonlinear relationship existed. A tree model was fitted to the data to visualize the relationship structure and to check for complex interactions between variables. The model strength for each embayment was compared to those obtained from bivariate modeling. Where model performance was equal, the simpler model was chosen to represent the relationship between the hydrologic parameter and chlorophyll-a.

3. Results

3.1. Dimensional Reduction

Of the hydrological, physical, and chemical parameters analyzed, several showed meaningful relationships with algal biomass during dimensional reduction. Random Forest modeling was first used to explore the relative importance of several independent continuous variables on the levels of chlorophyll-a pigment concentration in the Etowah River and Little River sites on Lake Allatoona. At both sites, the parameters which grew tree models with the lowest mean error were inorganic nitrogen and 12 month SPI, while turbidity and air temperature could be left out with minimal error increase.
The hydrologic drivers of phytoplankton in Lake Allatoona and Lake Lanier, Georgia, U.S. were modeled using ordinary least squares regression of chlorophyll-a (chl-a) and drought, precipitation, and flow data (Table 1). Best-fit regression models in this study may be categorized as either driven by a wetter regime (chl-a concentrations correlate positively with increased precipitation, stormflow, etc., or negatively with increased drought indices) or driven by a drier regime (greater chl-a concentrations correlate with more negative drought indices or with lower flow).

3.2. Linear Modeling of In Situ Data
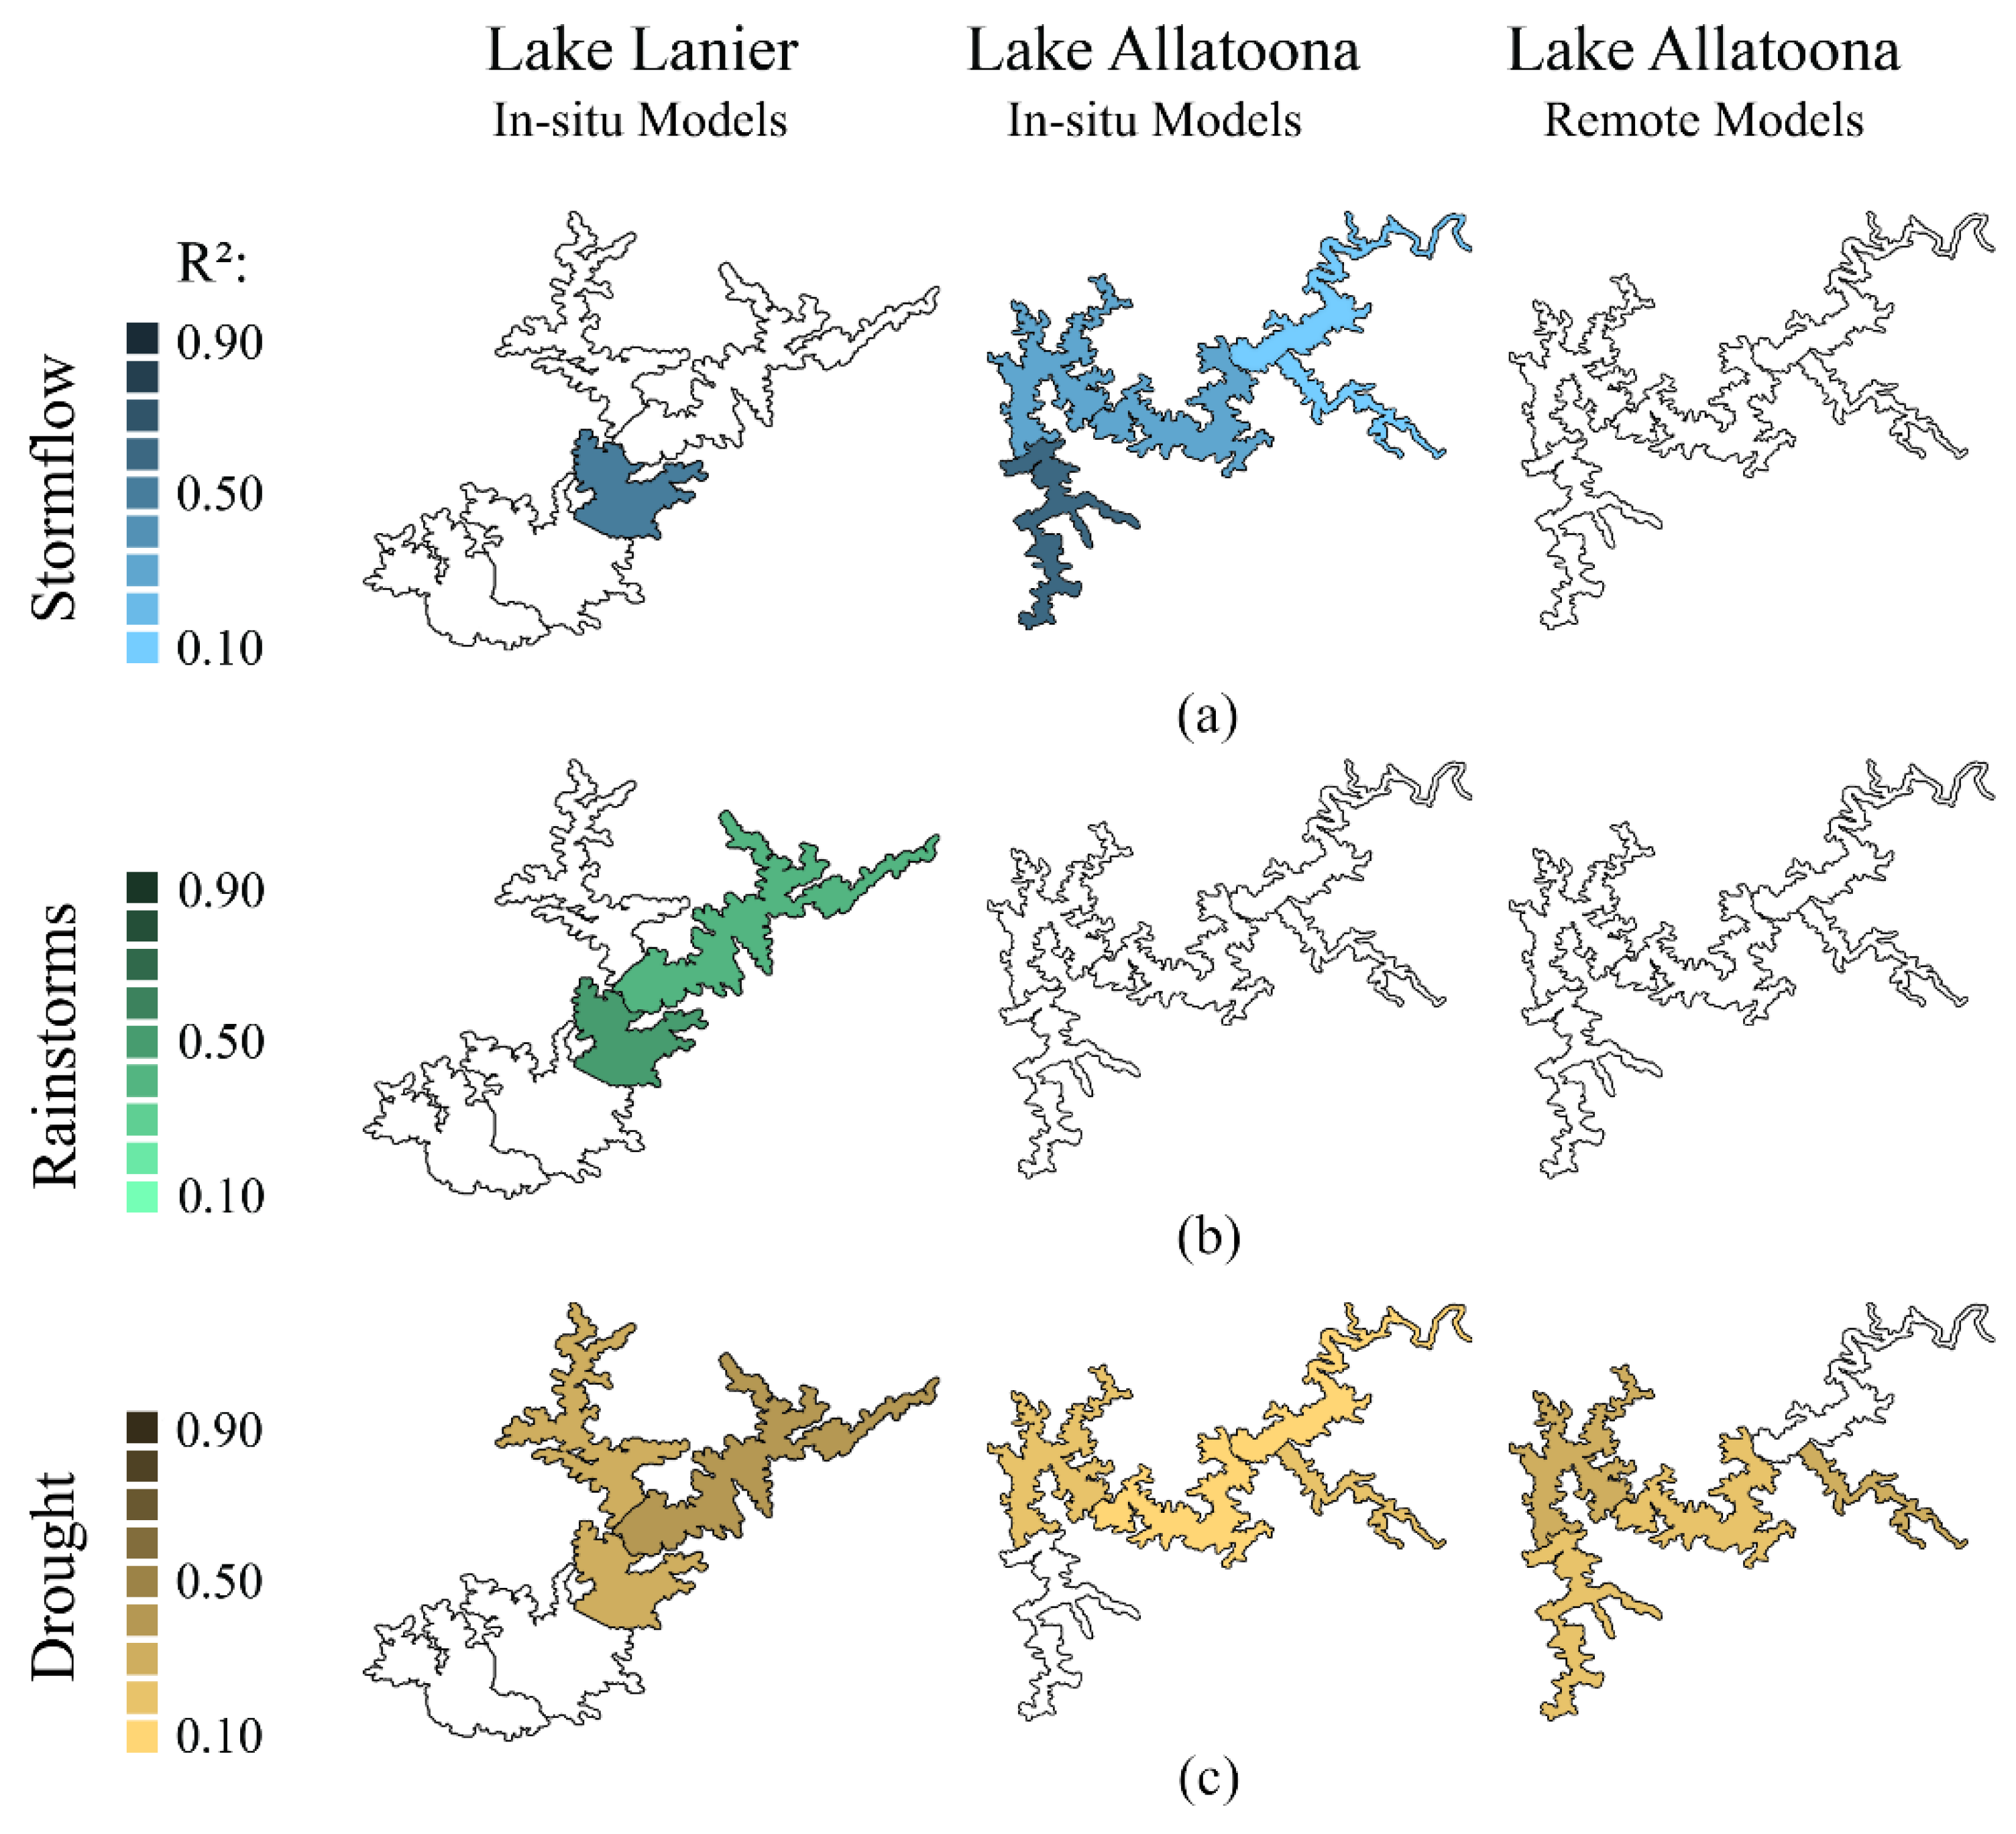
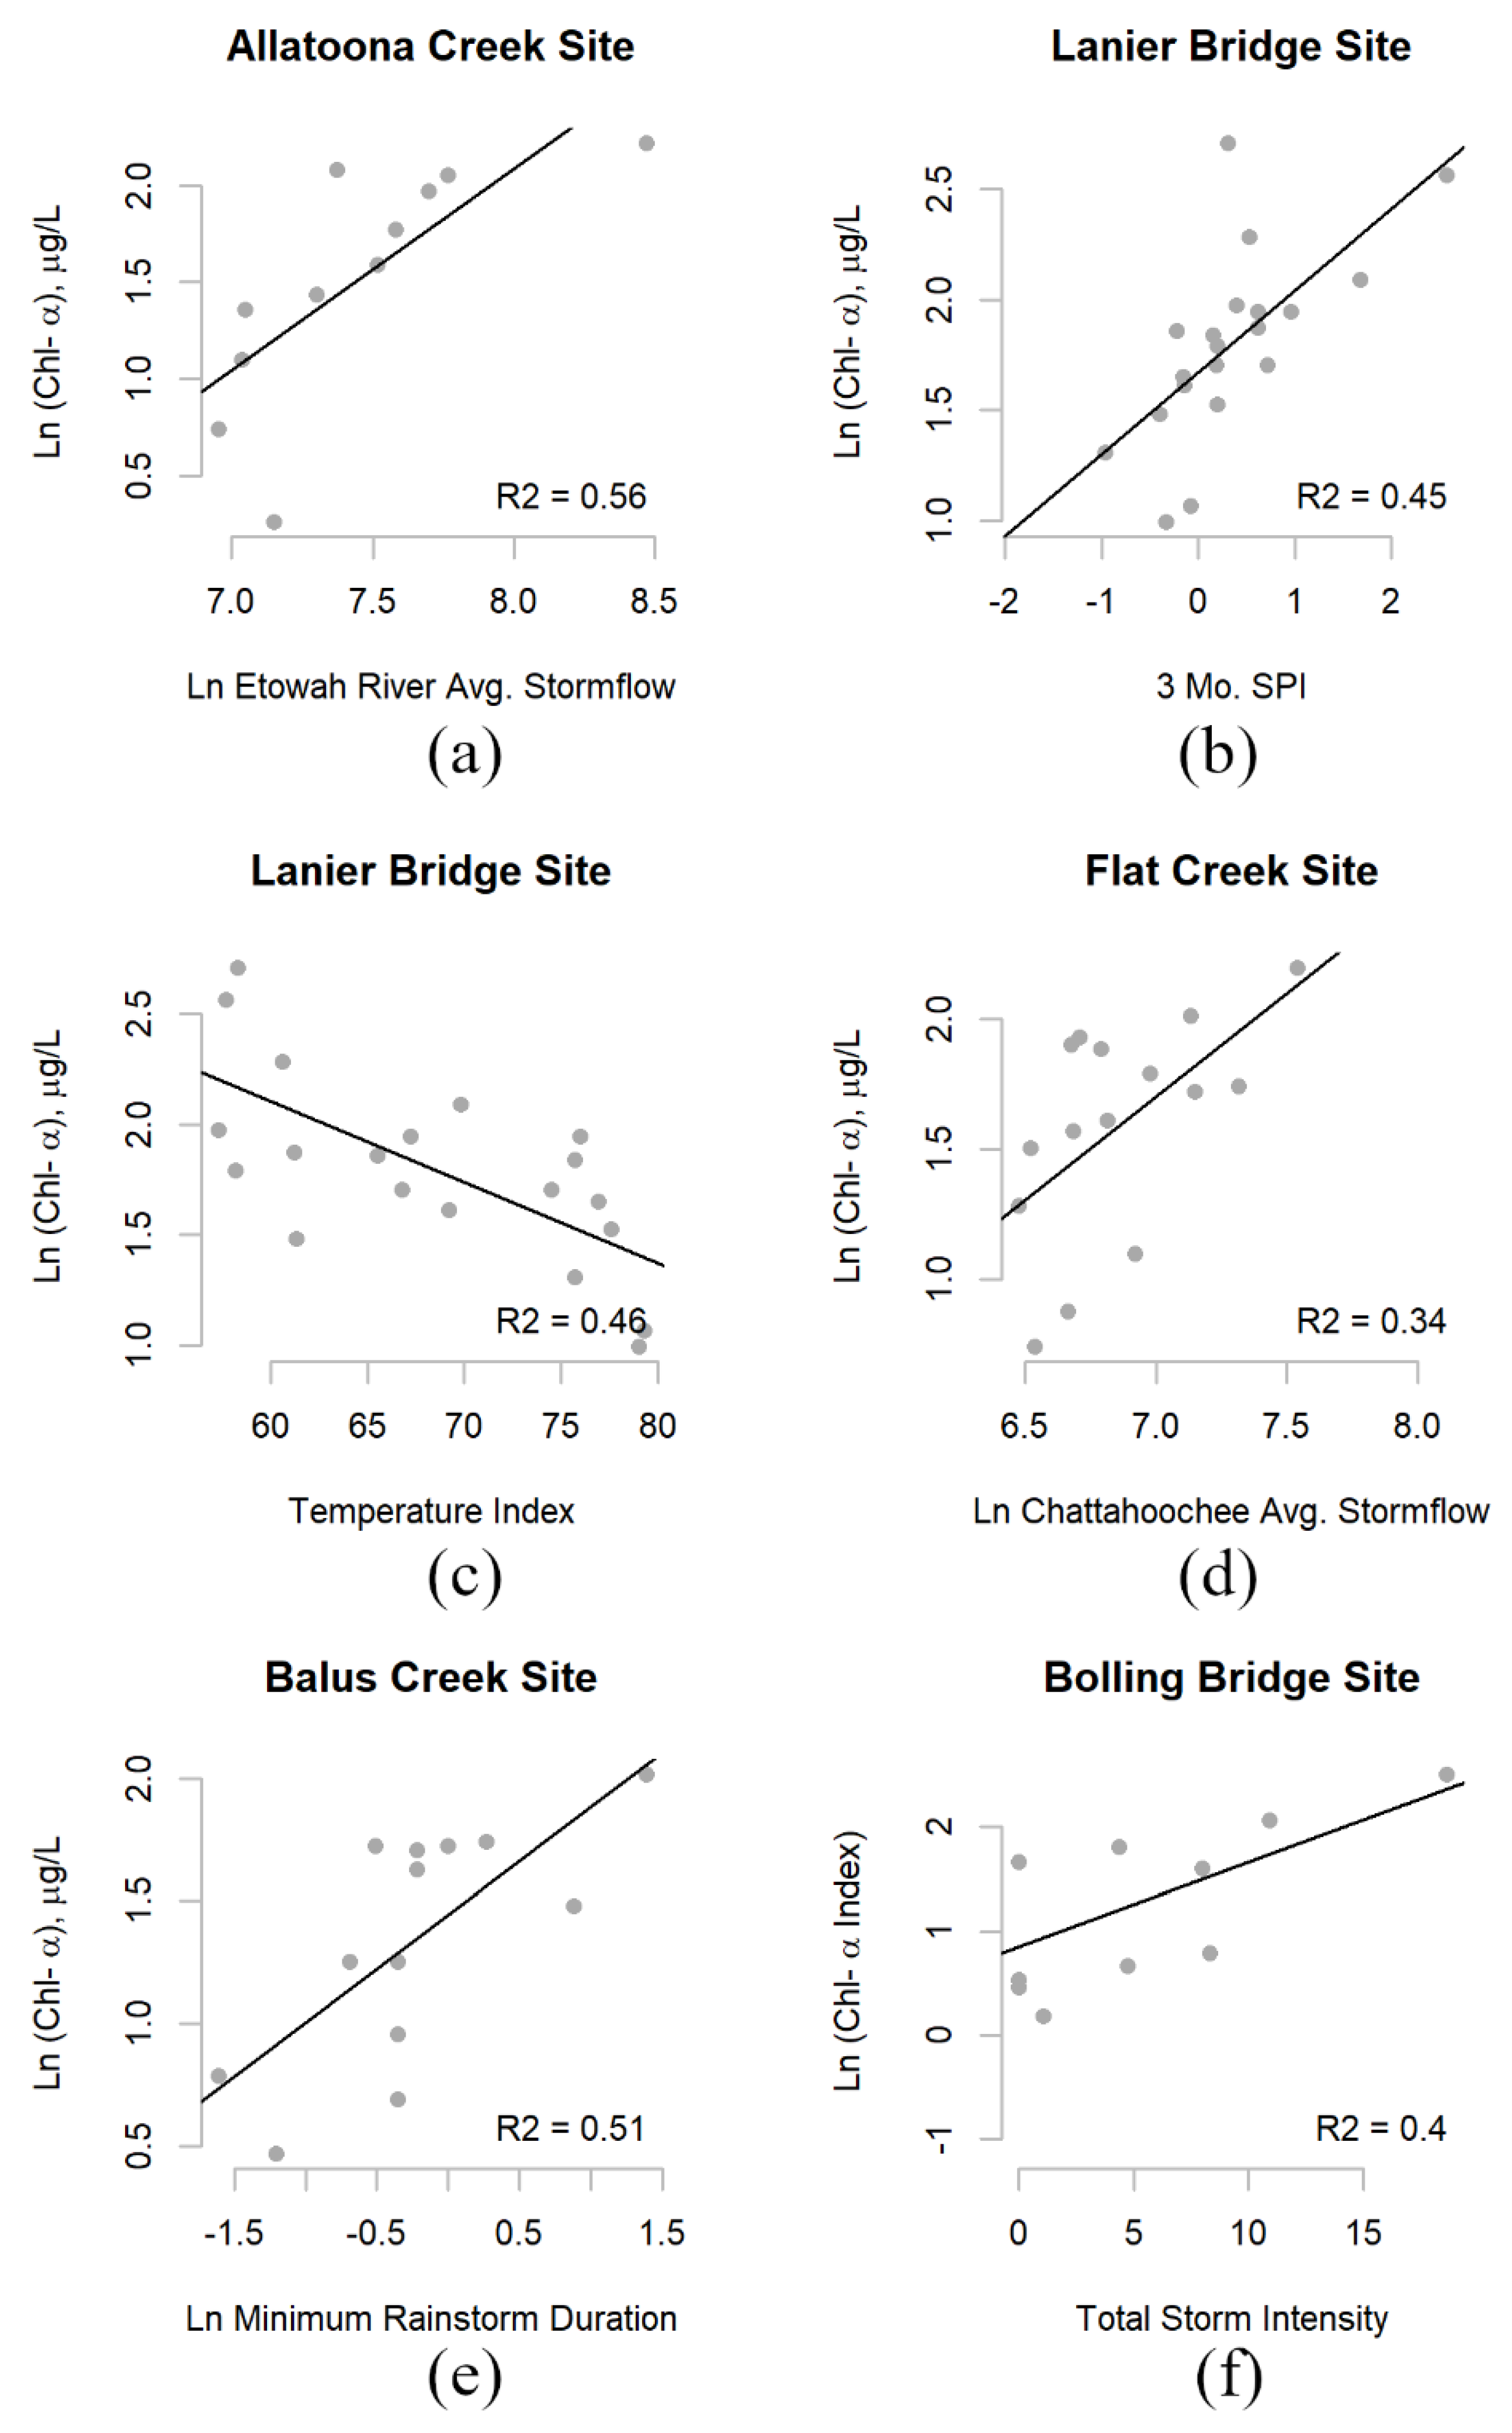
3.2.1. Stormflow

While total discharge into Lake Allatoona and Lake Lanier from their main tributaries did not show strong relationships with algal biomass in most embayments, flow above a baseflow value was used as an explanatory variable in several models in both reservoirs (Weekly Average Stormflow, Monthly Average Stormflow; Table 1 and Figure A2). Phytoplankton biomass showed a positive linear relationship with stormflow at the Allatoona Creek embayment on a 7-day scale (Figure 9). In contrast with Lake Allatoona’s eastern embayments, the Allatoona Creek site is deeper, and the furthest site from the riverine influence of the Etowah River. During stormflow events, phytoplankton biomass did not show a strong relationship with weekly average discharge in the tributary-dominated eastern sites, while the western Allatoona Creek showed a majority of phytoplankton variation may be explained by the Etowah’s stormflow volume (Figure 2 and Table 1). While of these five models, the Allatoona Creek site showed the only relationship with statistical significance at α = 0.05, the statistical significance and model performance of stormflow increase steadily with increasing distance from the Etowah inflow (r2 = 0.06, r2 = 0.12, r2 = 0.27, r2 = 0.25, r2 = 0.56; Table A2).
Lake Lanier’s phytoplankton biomass showed a positive linear relationship with the average monthly Chattahoochee River stormflow discharge in the Flat Creek Embayment, on the eastern side of the lake (r2 = 0.49; Table 1). Several other sites within Lake Lanier showed relationships between higher chlorophyll-a and monthly average stormflow. However, only the Flat Creek relationship is statistically significant.

3.2.2. Rainstorms

The kinetic energy of the peak discharge events originates with recent rainstorm events within the watershed and propagates towards the mouth of the reservoir, bringing nutrients and disrupting the water column stability [10]. We characterized these rainstorms using intensity (inches/day), duration (decimal days), and frequency (return period, years) on 7 and 30 day scales. While the return period did not show statistically significant relationships with in situ chlorophyll-a data in this study period, rainstorm duration and intensity were important drivers of phytoplanktonic growth at both Lanier Bridge and Balus Creek within Lake Lanier (r2 = 0.36, r2 = 0.51; Table A3).

3.2.3. Drought

Drought was defined by a suite of indices such as the regional PDSI and several related indices as well as local SPI. Drought severity (cumulative integral area of the index), duration (months), and drought intensity (cumulative maximum severity) were defined and compared to in situ chlorophyll-a data within each reservoir but did not show significant interaction during our study period. The indices themselves—specifically the SPI and ZNDX—were more closely related to chlorophyll-a at both Allatoona and Lanier. In Lake Allatoona, three of the five embayments showed a slight negative relationship with meteorological drought, with increased chlorophyll-a production during long-term precipitation shortages as modeled by 12 month SPI (r2 = 0.13, r2 = 0.13, r2 = 0.12; Table A3). A positive relationship with short-term meteorological drought was observed in Lake Lanier at both major tributary sites (r2 = 0.31, r2 = 0.45).
While four of the eight best-fit hydrologic models were driven in part by drought indices, only those in Lake Allatoona showed a positive response to increasing dryness (more negative index).

3.2.4. Temperature and Chemistry

Air temperature was poorly linked to phytoplankton biomass in Lake Lanier. Chlorophyll-a exhibits a subtle negative relationship to the ecoregional Temperature Index at Lanier Bridge; however, the effect size of the index is small (r2 = 0.46, Table A3). Chlorophyll-a did not show a linear relationship with the air temperature at Lake Allatoona.
Water quality parameters such as total nitrogen, total phosphorus, and turbidity did not correlate with the concurrent chlorophyll-a concentrations. Note that precedent water quality conditions were not obtained in this study.

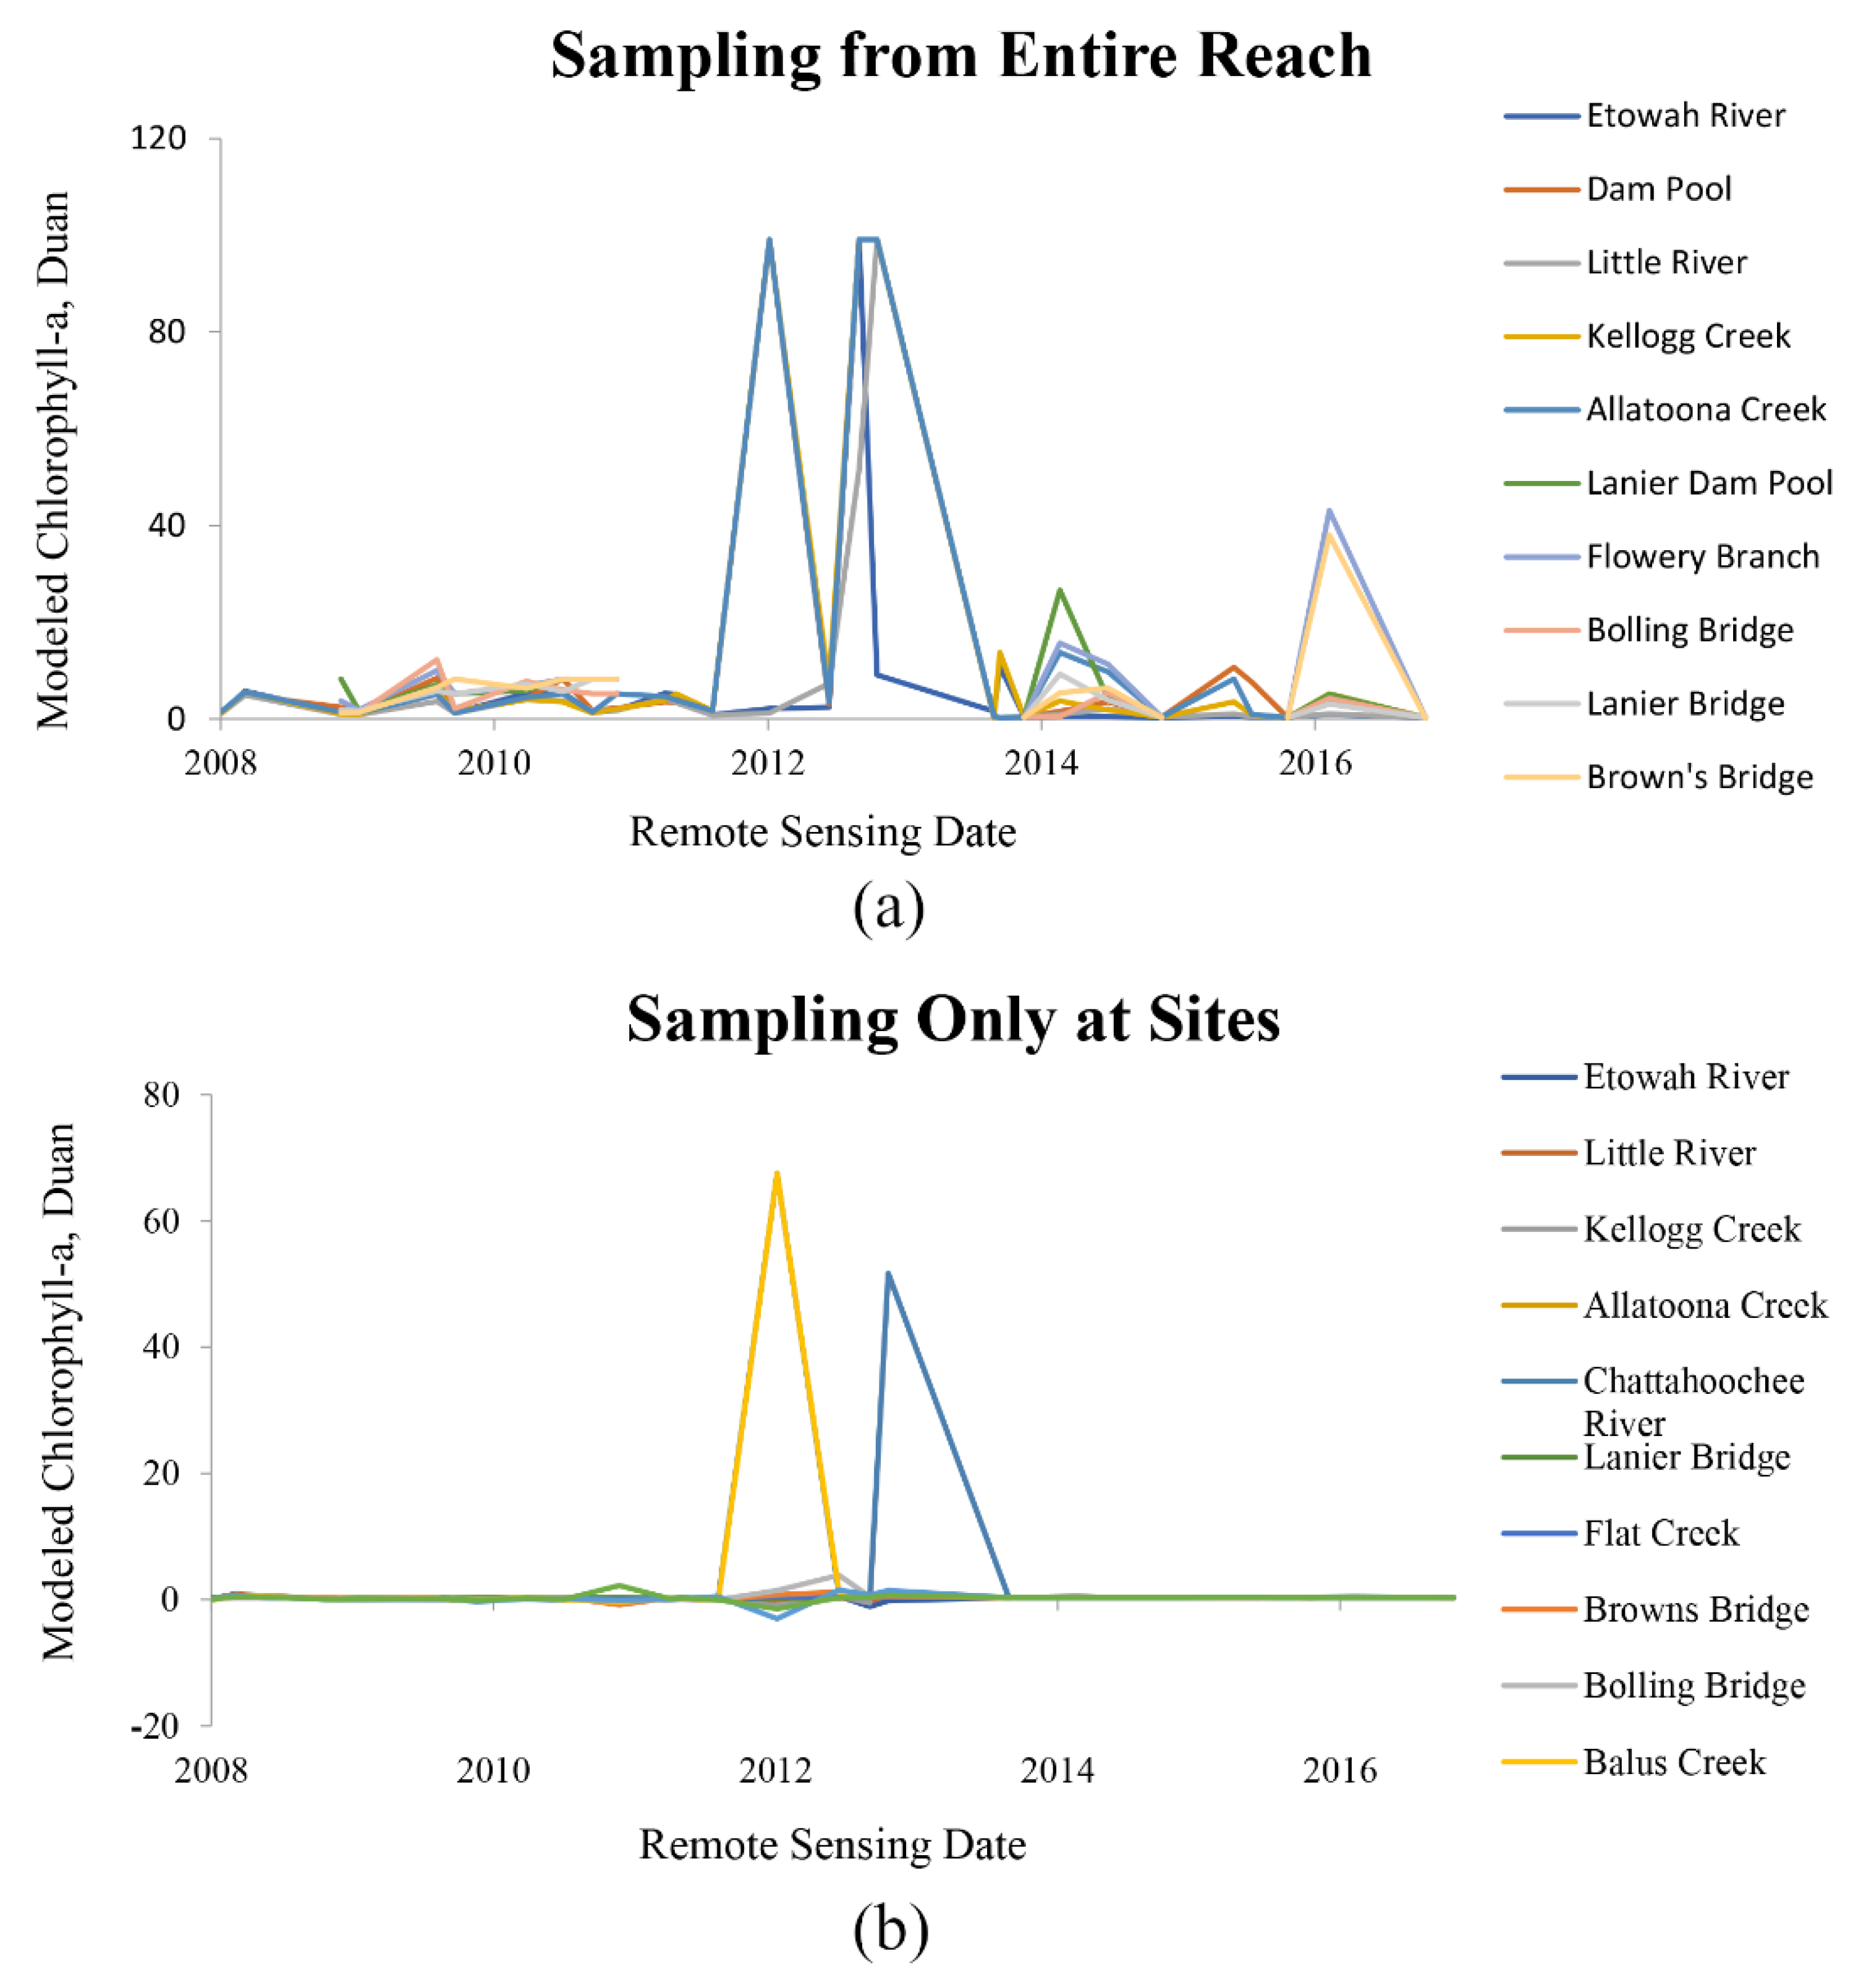
3.3. Linear Modeling of Remotely Sensed Data

Remotely sensed chlorophyll-a were obtained from rasters of the modeled indices by reach or embayment within Allatoona and Lanier (Section 2.4 and Figure A3). The two reservoirs were divided into reaches, and the values from the rasters were extracted and compared to hydrologic datasets. Bivariate models fitted to the data showed significant linear relations in five of the ten reaches, and in most cases agreed with the models using the in situ chlorophyll-a dataset (Table A3 and Table A4). However, some of the results were not reported as their datasets were too small for confidence (n < 10). The most statistically significant models included a positive relationship at Lake Lanier between the chlorophyll-a index and total rainstorm intensity (r2 = 0.40, Table A4).

4. Discussion

4.1. Lake Allatoona Models

The conditions which promote algal bloom growth are nutrients readily available within the water column, long residence times leading to a strong thermocline, and plentiful solar radiation (Figure 1) [1,2,4]. The flux of nutrients within a freshwater system (especially phosphate) is driven by high-kinetic events, and so our hypothesized system should derive nutrients primarily from short, intense rainfall [65]. We also hypothesized that greater biomass would benefit from the water column stability that comes from long, severe drought. However, our results suggest a system driven by peaks in tributary stormflow, long-lasting rainfall, and by wetter regimes rather than long-term drought in many of the reservoir sites (Table 1). An example of these is seen in the Allatoona Creek branch of Lake Allatoona, where an increase in the flow in the Etowah River on days above a baseflow level was associated with higher chlorophyll-a concentrations (Table 1). This positive relationship between stormflow and phytoplankton growth contrasts with the decreased biomass with decreased retention time described in several other reservoirs [31,66,67]. In the case of one study with high temporal resolution, blooms were reported to decrease after rainstorm events, and increase after approximately five days [9]. While our resolution is not daily, our results may also be explained by a rainstorm event which triggers a bloom on a lag of five days; however, we also see a correlation within months with higher stormflow and greater rainstorm duration, often spread between several events, and higher phytoplankton biomass (Table A3). This suggests that there may be systematic mechanisms which counteract disruption of the water column.
The response of blooms to stormflow in Lake Allatoona is spatially explicit, with increasing strength in the relationship with increasing distance from the tributary mouth (Figure 9). The tributaries in the east where the Etowah and the Little River join the reservoir show little response to high peaks of discharge, and while the effect size and significant increase westward, only the far Allatoona Creek, south of the dam, shows a statistically significant relationship to the Etowah inflow volumes (for relative distances, Figure 2). The seemingly uncorrelated inflow water quality relationship at the eastern reaches may be a result of coupled and opposing processes. Increased flow leads to renewed allochthonous and autochthonous loading, but the same turbulent forces increase sediment suspension, blocking inbound sunlight [24]. The disruption of chlorophyll-a production at the riverine reach of the Allatoona is consistent with the rapid peak rainfall to peak discharge time in the Etowah Watershed. More distant from the source, the Allatoona Creek branch may be benefiting from the same rainfall events and increased nutrient runoff without the non-algal turbidity or thermal mixing caused by the Etowah River.
Among the in situ dataset, no well-fitted or significant relationships were found between rainstorm dynamics and Lake Allatoona. This may not be an absolute result but rather a consequence of the event discretization for rainstorm identification which resulted in a small sample size for the period 2008–2014. In the Lake Lanier dataset, the larger number of sampling sites (Figure 2) resulted in a greater number of comparisons with the limited rainstorm dataset and was resolved into statistically significant models (Table A3). As the relationships to rainstorm dynamics in Lake Lanier follow those with stormflow, it is reasonable to assume that the Allatoona rainstorm relationships would also show increased driver importance with increased distance from the tributary (Figure 9).

4.2. Lake Lanier Models

The chlorophyll-a concentrations in several Lanier embayments are driven by rainfall dynamics on a monthly scale (Figure 9, Table 1 and Table A3). However, at Lanier, the phytoplankton’s affinity for increased precipitation is not confined to cove-shaped regions. Chestatee River, the smaller of two tributaries at the head of Lanier, also presents higher chlorophyll-a concentrations during wetter regimes at the Bolling Bridge site. Balus Creek also shows a similar positive relationship with rainstorm duration (Table A3), although there is a very slight negative relationship with at Lanier Bridge between rainstorm intensity and chlorophyll-a. The overall trend of increased chlorophyll-a with increased precipitation suggests the flushing hydraulic force attributed to rainstorm duration is not enough to disrupt the levels of free-floating algae and bacteria in even the seemingly riverine stretch of the reservoir at Bolling Bridge, potentially due to low hydraulic velocity in comparison to the mouth of the Etowah. The depth at Bolling Bridge is also approximately 27 m, contrasted with the average 8 m of water at the Etowah River site. If density differences between the river and reservoir are high enough, whether by suspended load or temperature differential, a current may be formed [68]. The inflow at Lanier might then be too deep a current to disrupt the epilimnion, while still causing a spike in nutrients.
The data are correlated both with increased rainstorm duration but also increased drought indices (wetter regimes), though only related to drought duration, intensity, or severity within remotely sensed datasets (Table A4). The index is likely the more robust parameter as it represents a condition which does not change as quickly as duration or severity (both cumulative values) or change as sporadically as intensity, defined as a measurement of the highest severity a drought event had achieved to the collection date. The indices are good predictors of variation in chlorophyll-a in both reservoirs, but as with stormflow, there are notable differences from tributary mouth to the far reach (Figure 9). In Allatoona, drier conditions are related to higher biomass from the Etowah to the dam pool sites. In contrast, wetter conditions, as modeled by a positive SPI or stormflow, are related to biomass within the remaining sites. This relationship is likely driven by the reduced disruption of the epilimnion under drought conditions. The tributary site on Lanier’s Chattahoochee River, likely because of its depth, is consistent with the more lacustrine Allatoona sites, and higher SPI values were accompanied with high algal biomass. These results suggest that a wetter regime dominated by multi-day precipitation events is a driver of algal bloom success at Lake Lanier. This is especially the case in sites protected from turbidity and mixing disruptions at the source, whether by the vertical depth to the inflow current or by the lateral distance along the reservoir length (Figure 9).

4.3. Remote Sensing Models

We employed remote sensing to expand the data past the Georgia Environmental Protection Division’s in situ campaign. While the chlorophyll-a concentrations measured at the lake were taken during the typical bloom season of April through October, satellite data were obtained for the entire span of the year, from 2008 through 2017. The dataset size was limited by cloud and wind contamination; however, several interesting and statistically significant results were still observed. Chlorophyll-a, a proxy for all phytoplankton, was observed to have a positive relationship with drought at many of the Allatoona Lake embayments, counter to some in situ models (Table A4). The limitations of satellite remote sensing include a higher error accumulation through processing, and this combined with a lower rate of data acquisition through time may mean that though the results are significant, they may not have a high level of certainty due to a small sample size. Alternatively, a seasonality factor may be responsible for the difference in the relationship. The remotely sensed dataset expanded the observation of the phytoplankton to include the winter season, during which most of the Georgia Piedmont region experiences the highest precipitation per month and heavy sediment transport from the watershed uplands to the lake basins [45]. While sporadic rains might encourage summer blooms, winter conditions drop lake temperatures and inhibit algal bloom growth [2].
These data were carefully used but there are several limitations and sources of error to consider. The analysis covered seven years of in situ and nine years of Landsat satellite data. While the satellite data were normalized from scene to scene to reduce residuals from instrument aging, and the Georgia EPD data were collected using systematic procedures, additional heterogeneity might have been introduced through a change in land use and smog levels in the region. However, long-term studies are still valuable despite the complexities.

4.4. Other Model Parameters

No well-fitted or significant models were produced using turbidity or nutrient concentration as independent variables. The relationships between these parameters and chlorophyll-a may be non-linear, on a different time scale, or may depend on a priori conditions. Future models would be more likely to resolve linear relationships between chlorophyll-a and pH, water temperature, and dissolved oxygen as a function of depth.

4.5. Model Limitations, Implications, and Future

The purpose of this study was to investigate the relationship between precipitation and drought dynamics and algal bloom events through linear regression models using datasets which are available for all gaged reservoirs. A statistical hydrologic model could be more practically useful to international stakeholders than a model with every system variable represented, as long-term water quality datasets may present data analysis challenges. These less-frequently available data such as total P, total N, water temperature, wind speed and direction, light conditions, and residence time have presented challenges for statistical analysis such as irregular sampling intervals or missing values, and could be represented by the error term (variation unexplained) in a least squares regression statistical model. Our models using precipitation and drought as the explanatory variables resulted in up to 56% variation explained for in situ, historical datasets.
The limitations of the study and our resulting models may stem from the remaining variation, driven by the factors for which data is not easily obtained. These factors include the initial total nitrogen, total phosphorus, and water temperature, as well as the concurrent conditions at the time of the bloom such as nutrients, temperature, or wind velocity. The detection of harmful algal blooms was also limited by the low concentrations of phycocyanin present during our fieldwork in 2017, which was intended for calibration and validation of an empirical relationship between phycocyanin concentration and Landsat reflectance data. Instead of remotely sensed modeled phycocyanin data, we used continuous chlorophyll-a data as a proxy for phytoplankton biomass, without a distinction made between cyanobacteria, green algae or other phytoplankton. These limitations are typical of many reservoirs in the Southeastern U.S. Piedmont region, where hypereutrophic conditions are the exception rather than the mean. The difficulties in designing a study with limited data and subtler water quality gradients will drive the development of new and combined methods for the study of mesotrophic to eutrophic waters, such as continuous monitoring stations paired with remote sending datasets. Considering both the limitations of the model, and the processes which may fit the observed results, we may come to a few careful inferences for these reservoir systems.
The implications of the model can be hypothesized by several scenarios, in which the differences in the modeled relationships are the result of some combination of the differences in precipitation and the reservoirs’ geomorphometry, nutrient and sediment loads, or other factors. In the first case, the heterogeneity of the depth and breadth at the different sites may have resulted in the differences between modeled sites due to mixing mechanics in the water column. We anticipated that in a general case, dry periods and low flow would promote bloom growth in the shallower, tributary zones while increased precipitation intensity would promote algal bloom growth given sufficient distance from the main inlets. When comparing Lake Allatoona to Lake Lanier, we expected to see similar results. However, every Lake Lanier site showed a positive relationship with increased precipitation events and wetter regimes, while at Lake Allatoona, relationships between phytoplankton biomass and hydrology varied with distance from the main inlet and outlet. This is consistent with a disrupted water column at shallower, more riverine sites, while at deeper, more lacustrine sites, the incoming currents may slip under the epilimnion and leave the growth zone relatively undisturbed. While the apparent exception to this hypothesis is the deep but drought driven Allatoona dam pool site, the Allatoona Dam releases occur at the upper layer of the pool, potentially resulting in more disruption in the photic zone after times of high rainfall. These results suggest that geomorphometry, especially depth, may drive the relative importance of hydrologic drivers of phytoplankton growth in reservoirs.
Another scenario in which our results would be consistent is a system driven by nutrient loading paired with precipitation dynamics. The heterogeneity across the reaches at Allatoona and Lanier may be explained by spatial distributions of incoming nitrogen and phosphate-laden sediments, based on the variety in land use within the basins. This scenario could be explored with the addition of high-resolution nutrient time series data, both in the sediment load and the existing sediments at each site.
Other factors which are unaccounted for in our dataset include initial water temperature, dissolved oxygen, and wind velocities. Whether precipitation is interacting more with nutrients, geomorphometry, or other factors, further research would benefit from the inclusion of at least one annual cycle of data on nutrient input and residence time into these reservoirs.

5. Conclusions

We hypothesized that the precipitation and drought dynamics important to the phytoplankton biomass within reservoirs would be high rainstorm intensity, low rainstorm duration, and high drought severity characterized by a negative PDSI and SPI. Instead, the results suggest that wetter climatic conditions (a more positive drought index), higher volumes of stormflow, and longer-lasting rainfall events are better predictors of higher chlorophyll-a at many of the sites.
Interestingly, in Lake Allatoona’s shallower reaches, meteorological drought is a better predictor of phytoplankton biomass, while the phytoplankton in the deeper sites of Lake Lanier show more growth with increased rainfall. The difference in response is not surprising, as the two reservoirs have different physical and hydrological features. The control of depth over the hydrologic drivers of algal blooms may be a result of the vertical separation of inflow from the photic zone, which will be less disrupted at a site with a deeper water column.
Data challenges prevented the analysis of the relationships between algal blooms and nutrients, water column depth, and wind velocity through time in this study. Understanding the influence of these variables on the algal biomass will reduce the overall error in the linear models, but frequently sampled, long-term data would be ideal to accomplish this in a future study.
Finally, due to the positive correlation between stormflow and chlorophyll-a concentrations at several reaches of the reservoirs, our results have implications for the effectiveness of preventative flushing.

Author Contributions

Conceptualization, A.S.K. and A.M.M.; writing—original draft preparation, A.S.K.; writing—review and editing, A.S.K. and A.M.M.; supervision, A.M.M.; funding acquisition, A.S.K. and A.M.M. All authors have read and agreed to the published version of the manuscript.

Funding

This research was funded by Geological Society of America, 2017 Student Research Grant and University of Georgia Geology Department, 2017 Watt’s Wheeler Research Grant.

Acknowledgments

The authors wish to acknowledge Deepak Mishra, Richard Becker, Elizabeth Kramer, Abhishek Kumar, Sam Weber, and Susan Wilde, and Dayton Wilde; Koray Yilmaz, Stephanie Fulton, Doog Becker, the Little River Marina, and the Water Resources and Remote Sensing lab for field support; John Dowd and Todd Rasmussen; and Tammi Richardson and Eric Lachenmyer for HPLC laboratory analysis; and to the anonymous reviewers of this article, who contributed thoughtful comments which resulted in an improved manuscript.

Conflicts of Interest

The authors declare no conflict of interest. The funders had no role in the design of the study; in the collection, analyses, or interpretation of data; in the writing of the manuscript, or in the decision to publish the results.

Appendix A

Figure A1. In situ and satellite remote sensing temporal coverage of phytoplankton bloom proxy data, from 2008 to 2017. (a) The majority of in situ data were gathered during similar dates; (b) Remote sensing data at Lake Lanier were more affected by cloud cover, resulting in fewer data points.
Water 12 00404 g0a1
Figure A2. Bivariate plots showing the spread and slope of several of the high-performance chl-a models. (a) Chlorophyll-a as a function of Etowah River average stormflow; (b) Chlorophyll-a as a function of the three-month Standard Precipitation Index at Lake Lanier; (c) Chlorophyll-a as a function of the NOAA Temperature Index at Lake Lanier; (d) Chlorophyll-a as a function of Chattahoochee River average stormflow; (e) Chlorophyll-a as a function of the monthly minimum rainstorm duration at Lake Lanier; (f) Chlorophyll-a as a function of total storm intensity at Lake Lanier.
Water 12 00404 g0a2
Figure A3. Both (a) reach-based and (b) point-based sampling of the modelled chlorophyll-a data show similar results using the Duan algorithm in Lakes Allatoona and Lanier.
Water 12 00404 g0a3
Table A1. Physical and Hydrological Characteristics of Lake Allatoona and Lake Sidney-Lanier.
CharacteristicUnitLake AllatoonaLake Sidney-Lanier
Reservoir Size 1km213156
Summer Conservation Elevation 1m, NGVD29256326
Summer Conservation Storage 1km30.51.3
Drainage Area 2km229002678
Average Retention Time 3month4.210.2
Range of Epilimnion Thickness 1m4–94–9
Data Source: 1 USACE, 2 Georgia EPD, 3 Calculated from USACE outflow data from 2007–2016.
Table A1. The physical and hydrological characteristics of Lakes Allatoona and Sidney-Lanier and their watersheds show that Allatoona drains a larger acreage per reservoir area than Lanier, resulting in a shorter retention time.
Table A2. Lake Allatoona Chlorophyll-a As a Function of Weekly Average Stormflow.
SiteModelR2 Adj. R2FDFp-Value
Etowah Riverln (Chl-a) = 0.55 ln (Weekly Average Stormflow) − 1.100.06-0.61, 90.452
Little Riverln (Chl-a) = 0.45 ln (Weekly Average Stormflow) − 0.430.12-1.271, 90.288
Kellogg Creekln (Chl-a) = 0.90 ln (Weekly Average Stormflow) − 2.130.27-3.01, 90.101
Allatoona Damln (Chl-a) = 0.88 ln (Weekly Average Stormflow) − 2.240.25-3.01, 90.117
Allatoona Creekln (Chl-a) = 1.04 ln (Weekly Average Stormflow) − 2.720.56-11.31, 90.008
F: F-statistic; DF: degrees of freedom.
Table A2. The relationship between chlorophyll-a and Weekly Average Stormflow shows an increasing effect size, variance explained, and statistical significance with increasing distance from the Etowah River Inflow (Compare with Figure 2).
Table A3. Regression Models by Lake and Site at Lake Allatoona and Lake Sidney-Lanier.
SiteModelR2 Adj. R2FDFp-Value
All Regression Models by Site: Lake Allatooona
Etowah Riverln (Chl-a) = −0.34 ln (Little River Weekly Min. Flow) + 3.360.15-6.51, 360.015
ln (Chl-a) = −0.39 ln (Monthly Min. Flow) + 4.360.14-5.61, 340.024
ln (Chl-a) = −0.20 12 Mo. SPI + 1.810.13-5.61, 360.023
Kellogg Creekln (Chl-a) = −0.16 12 Mo. SPI + 2.260.13-5.31, 360.027
Allatoona Damln (Chl-a) = −0.16 12 Mo. SPI + 1.120.12-4.01, 380.032
Allatoona Creekln (Chl-a) = 1.04 ln (Weekly Avg. Stormflow) – 6.250.56-11.31, 90.008
All Regression Models by Site: Lake Lanier
Bolling Bridgeln (Chl-a) = 0.37 3 Mo. SPI − 0.440.31-8.01, 180.011
ln (Chl-a) = 0.26 NOAA 1 Mo. SPI + 0.190.27-6.51, 180.020
ln (Chl-a) = 0.11 ZNDX + 1.510.27-6.61, 180.019
ln (Chl-a) = 0.25 NOAA 3 Mo. SPI + 0.220.20-4.61, 180.047
Lanier Bridgeln (Chl-a) = −0.04 Temperature Index + 4.300.46-15.51, 180.001
ln (Chl-a) = 0.37 3 Mo. SPI − 0.190.45-14.51, 180.001
ln (Chl-a) = −0.10 Mo. Avg. Rainstorm Intensity + 2.320.36-6.81, 120.023
ln (Chl-a) = 0.24 NOAA 3 Mo. SPI + 0.550.26-6.41, 180.021
ln (Chl-a) = 0.18 NOAA 2 Mo. SPI + 0.860.23-5.31, 180.034
Flat Creekln (Chl-a) = 1.61 ln Monthly Avg. Stormflow − 9.530.49-12.41, 130.023
Balus Creekln (Chl-a) = 0.44 ln (Mo. Min. Rainstorm Duration) + 1.440.51-11.41, 110.006
ln (Chl-a) = 0.23 NOAA 1 Mo. SPI + 0.120.27-5.51, 150.033
F: F-statistic; DF: degrees of freedom.
Table A3. Multiple regression models by site show a variety of significant linear relationships with in situ chl-a, ranging between 12% and 56% variance explained.
Table A4. Regression Models by Lake and Site with Data Modeled by Remote Sensing.
SiteModelR2 Adj. R2FDFp-Value
All Regression Models by Site: Lake Allatoona
Allatoona Damln (modeled chl-a) = 0.59 Drought Intensity + 0.230.27-8.91, 240.007
ln (modeled chl-a) = −0.51 12 Mo. SPI + 3.250.19-5.71, 240.026
Little Riverln (modeled chl-a) = 0.40 ln (Drought Severity + 1) − 0.160.26-8.51, 240.003
ln (modeled chl-a) = 0.50 ln (Drought Duration + 1) − 0.160.24-7.81, 240.007
Kellogg Creekln (modeled chl-a) = −0.50 12 Mo. SPI + 3.180.19-5.61, 240.026
Allatoona Creekln (modeled chl-a) = 0.03 Drought Severity + 0.570.21-6.31, 240.019
ln (modeled chl-a) = 0.51 Drought Intensity + 0.400.21-6.21, 240.020
ln (modeled chl-a) = −0.49 12 Mo. SPI + 3.230.18-5.21, 240.032
All Regression Models by Site: Lake Lanier
Bolling Bridgeln (modeled chl-a) = 0.081 Monthly Total Rainstorm Intensity + 0.850.40-6.01, 90.036
F: F-statistic; DF: degrees of freedom.
Table A4. Multiple regression models of remotely sensed chl-a data by site show a variety of significant linear relationships, ranging between 18% and 40% variance explained. Chl-a values were modeled using empirical and semi-empirical models [35,36].

References

  1. Heiskary, S.A. Developing Eutrophication Standards for Lakes and Reservoirs: A Report Prepared by the Lake Standards Subcommittee; North American Lake Management Society: Madison, WI, USA, 1992. [Google Scholar]
  2. Paerl, H.W.; Huisman, J. Blooms like it hot. Science 2008, 320, 57. [Google Scholar] [CrossRef] [PubMed] [Green Version]
  3. Magrann, T.; Dunbar, S.G.; Boskovic, D.S.; Hayes, W.K. Impacts of Microcystis on algal biodiversity and use of new technology to remove Microcystis and dissolved nutrients. Lakes Reserv. Res. Manag. 2012, 17, 231–239. [Google Scholar] [CrossRef]
  4. Schindler, D.W. Evolution of phosphorus limitation in lakes. Science 1977, 195, 260–262. [Google Scholar] [CrossRef] [PubMed] [Green Version]
  5. Meis, S.; Thackeray, S.J.; Jones, I.D. Effects of recent climate change on phytoplankton phenology in a temperate lake. Freshw. Boil. 2009, 54, 1888–1898. [Google Scholar] [CrossRef]
  6. Paerl, H.W.; Gardner, W.S.; Havens, K.E.; Joyner, A.R.; McCarthy, M.J.; Newell, S.E.; Qin, B.; Scott, J.T. Mitigating cyanobacterial harmful algal blooms in aquatic ecosystems impacted by climate change and anthropogenic nutrients. Harmful Algae 2016, 54, 213–222. [Google Scholar] [CrossRef] [Green Version]
  7. Reichwaldt, E.S.; Ghadouani, A. Effects of rainfall patterns on toxic cyanobacterial blooms in a changing climate: Between simplistic scenarios and complex dynamics. Water Res. 2012, 46, 1372–1393. [Google Scholar] [CrossRef]
  8. Havens, K.E.; Ji, G.; Beaver, J.R.; Fulton, R.S.; Teacher, C.E. Dynamics of cyanobacteria blooms are linked to the hydrology of shallow Florida lakes and provide insight into possible impacts of climate change. Hydrobiologia 2019, 829, 43–59. [Google Scholar] [CrossRef]
  9. Ahn, C.-Y.; Chung, A.-S.; Oh, H.-M. Rainfall, phycocyanin, and N:P ratios related to cyanobacterial blooms in a Korean large reservoir. Hydrobiologia 2002, 474, 117–124. [Google Scholar] [CrossRef]
  10. Bloesch, J. Mechanisms, measurement and importance of sediment resuspension in lakes. Mar. Freshw. Res. 1995, 46, 295–304. [Google Scholar] [CrossRef]
  11. Robson, B.J.; Hamilton, D.P. Summer flow event induces a cyanobacterial bloom in a seasonal Western Australian estuary. Mar. Freshw. Res. 2003, 54, 139. [Google Scholar] [CrossRef]
  12. Schindler, D.W.; Hecky, R.E.; Findlay, D.L.; Stainton, M.P.; Parker, B.R.; Paterson, M.J.; Beaty, K.G.; Lyng, M.; Kasian, S.E.M. Eutrophication of lakes cannot be controlled by reducing nitrogen input: Results of a 37-year whole-ecosystem experiment. Proc. Natl. Acad. Sci. USA 2008, 105, 11254–11258. [Google Scholar] [CrossRef] [PubMed] [Green Version]
  13. Elliott, J.A.; Jones, I.D.; Page, T. The importance of nutrient source in determining the influence of retention time on phytoplankton: An explorative modelling study of a naturally well-flushed lake. Hydrobiologia 2009, 627, 129–142. [Google Scholar] [CrossRef] [Green Version]
  14. Bowling, L.C.; Merrick, C.; Swann, J.; Green, D.; Smith, G.; Neilan, B.A. Effects of hydrology and river management on the distribution, abundance and persistence of cyanobacterial blooms in the Murray River, Australia. Harmful Algae 2013, 30, 27–36. [Google Scholar] [CrossRef]
  15. Beaver, J.R.; Jensen, D.E.; Casamatta, D.A.; Tausz, C.E.; Scotese, K.C.; Buccier, K.M.; Teacher, C.E.; Rosati, T.C.; Minerovic, A.D.; Renicker, T.R. Response of phytoplankton and zooplankton communities in six reservoirs of the middle Missouri River (USA) to drought conditions and a major flood event. Hydrobiologia 2013, 705, 173–189. [Google Scholar] [CrossRef]
  16. Hutchinson, G.E. A Treatise on Limnology, Vol. I: Geography, Physics and Chemistry; John Wiley & Sons, Inc.: London, UK, 1957; ISBN 978-0471425687. [Google Scholar]
  17. Li, W.; Qin, B.; Zhu, G. Forecasting short-term cyanobacterial blooms in Lake Taihu, China, using a coupled hydrodynamic-algal biomass model. Ecohydrology 2014, 7, 794–802. [Google Scholar] [CrossRef]
  18. Dirnberger, J.M. The Role of Heat and Drought During Occasional Blooms of Picoplankton and Nanoplankton in a Large Drinking Water Reservoir (Allatoona Lake, Georgia). In Proceedings of the 2011 Georgia Water Resources Conference, Athens, GA, USA, 11–13 April 2011; Carroll, G.D., Ed.; Georgia Institute of Technology: Atlanta, GA, USA, 2011. [Google Scholar]
  19. Ní Longphuirt, S.; O’Boyle, S.; Wilkes, R.; Dabrowski, T.; Stengel, D. Influence of Hydrological Regime in Determining the Response of Macroalgal Blooms to Nutrient Loading in Two Irish Estuaries. Estuaries Coasts 2016, 39, 478–494. [Google Scholar] [CrossRef]
  20. Srifa, A.; Phlips, E.J.; Cichra, M.F.; Hendrickson, J.C. Phytoplankton dynamics in a subtropical lake dominated by cyanobacteria: Cyanobacteria ‘Like it Hot’ and sometimes dry. Aquat. Ecol. 2016, 50, 163–174. [Google Scholar] [CrossRef]
  21. Srifa, A.; Phlips, E.J.; Cichra, M.F.; Hendrickson, J.C. Effects of non-algal turbidity on cyanobacterial biomass in seven turbid Kansas reservoirs. Lake Reserv. Manag. 2011, 27, 6–14. [Google Scholar]
  22. Camacho, A.; Murueta, N.; Blasco, E.; Santamans, A.C.; Picazo, A. Hydrology-driven macrophyte dynamics determines the ecological functioning of a model Mediterranean temporary lake. Hydrobiologia 2016, 774, 93–107. [Google Scholar] [CrossRef]
  23. Royer, T.V.; David, M.B.; Gentry, L.E. Timing of Riverine Export of Nitrate and Phosphorus from Agricultural Watersheds in Illinois: Implications for Reducing Nutrient Loading to the Mississippi River. Environ. Sci. Technol. 2006, 40, 4126–4131. [Google Scholar] [CrossRef]
  24. Ceballos, E.L.; Rasmussen, T.C. Internal Loading in Southeastern Piedmont Impoundments. In Proceedings of the 2007 Georgia Water Resources Conference, Athens, GA, USA, 27–29 March 2007; Georgia Institute of Technology: Atlanta, GA, USA, 2007. [Google Scholar]
  25. Glibert, P.M.; Kelly, V.; Alexander, J.; Codispoti, L.A.; Boicourt, W.C.; Trice, T.M.; Michael, B. In situ nutrient monitoring: A tool for capturing nutrient variability and the antecedent conditions that support algal blooms. Harmful Algae 2008, 8, 175–181. [Google Scholar] [CrossRef]
  26. Holbach, A.; Wang, L.; Chen, H.; Hu, W.; Schleicher, N.; Zheng, B.; Norra, S. Water mass interaction in the confluence zone of the Daning River and the Yangtze River - a driving force for algal growth in the Three Gorges Reservoir. Environ. Sci. Pollut. Res. 2013, 20, 7027–7037. [Google Scholar] [CrossRef] [PubMed]
  27. McCullough, G.K.; Page, S.J.; Hesslein, R.H.; Stainton, M.P.; Kling, H.J.; Salki, A.G.; Barber, D.G. Hydrological forcing of a recent trophic surge in Lake Winnipeg. J. Great Lakes Res. 2012, 38, 95–105. [Google Scholar] [CrossRef]
  28. Paerl, H.W.; Otten, T.G. Harmful Cyanobacterial Blooms: Causes, Consequences, and Controls. Microb. Ecol. 2013, 65, 995–1010. [Google Scholar] [CrossRef] [PubMed]
  29. Paerl, H.W.; Hall, N.S.; Calandrino, E.S. Controlling harmful cyanobacterial blooms in a world experiencing anthropogenic and climatic-induced change. Sci. Total. Environ. 2011, 409, 1739–1745. [Google Scholar] [CrossRef] [PubMed]
  30. Lundgren, V.M.; Roelke, D.L.; Grover, J.P.; Brooks, B.; Prosser, K.N.; Scott, W.C.; Laws, C.A.; Umphres, G.D. Interplay between ambient surface water mixing and manipulated hydraulic flushing: Implications for harmful algal bloom mitigation. Ecol. Eng. 2013, 60, 289–298. [Google Scholar] [CrossRef]
  31. Zhang, Y.; Shi, K.; Liu, J.; Deng, J.; Qin, B.; Zhu, G.; Zhou, Y. Meteorological and hydrological conditions driving the formation and disappearance of black blooms, an ecological disaster phenomena of eutrophication and algal blooms. Sci. Total. Environ. 2016, 569, 1517–1529. [Google Scholar] [CrossRef]
  32. Campana, P.; Knox, J.; Grundstein, A.; Dowd, J. The 2007–2009 Drought in Athens, Georgia, United States: A Climatological Analysis and an Assessment of Future Water Availability1. JAWRA J. Am. Water Resour. Assoc. 2012, 48, 379–390. [Google Scholar] [CrossRef]
  33. U.S. Army Corps of Engineers. Appendix A, Allatoona Dam and Lake. In Alabama-Coosa-Tallapoosa (ACT) River Basin Water Control Manual; U.S. Army Corps of Engineers: Mobile, AL, USA, 1952; revised 1962 and 2015; p. xv. Available online: https://www.sam.usace.army.mil/Portals/46/docs/planning_environmental/act/docs/New/Appendix%20A%20-%20Allatoona%20WCM%206%20May%2015.pdf?ver=2017-04-17-120210-283 (accessed on 1 February 2020).
  34. Dirnberger, J.M.; Weinberger, J. Influences of Lake Level Changes on Reservoir Water Clarity in Allatoona Lake, Georgia. Lake Reserv. Manag. 2005, 21, 24–29. [Google Scholar] [CrossRef] [Green Version]
  35. Vincent, R.K.; Qin, X.; McKay, R.L.; Miner, J.; Czajkowski, K.; Savino, J.; Bridgeman, T. Phycocyanin detection from LANDSAT TM data for mapping cyanobacterial blooms in Lake Erie. Remote. Sens. Environ. 2004, 89, 381–392. [Google Scholar] [CrossRef]
  36. Duan, H.; Zhang, Y.; Zhang, B.; Song, K.; Wang, Z. Assessment of Chlorophyll-a Concentration and Trophic State for Lake Chagan Using Landsat TM and Field Spectral Data. Environ. Monit. Assess. 2007, 129, 295–308. [Google Scholar] [CrossRef] [PubMed]
  37. Zeng, X.; Rasmussen, T.C. Short-term and long-term sediment and phosphorus inputs to Lake Lanier. In Proceedings of the 2001 Georgia Water Resources Conference, Athens, GA, USA, 26–27 April 2001; Hatcher, K.J., Ed.; Georgia Institute of Technology: Atlanta, GA, USA, 2001. [Google Scholar]
  38. Radcliffe, D.E.; Lin, Z.; Risse, L.M.; Romeis, J.J.; Jackson, C.R. Modeling Phosphorus in the Lake Allatoona Watershed Using SWAT: I. Developing Phosphorus Parameter Values. J. Environ. Qual. 2009, 38, 111–120. [Google Scholar] [CrossRef] [PubMed]
  39. Environmental Protection Agency, U.S. EPA National Aquatic Resources Survey (NARS); Environmental Protection Agency: Washington, DC, USA, 2009.
  40. Environmental Protection Agency, U.S. EPA National Aquatic Resources Survey (NARS); Environmental Protection Agency: Washington, DC, USA, 2014.
  41. GAEPD AMU Soft Algae Taxa Data, Chattahoochee River Basin. Available online: https://gomaspublic.gaepd.org/ (accessed on 12 December 2019).
  42. U.S. Army Corps of Engineers. Appendix B, Buford Dam and Lake Sidney Lanier. In Apalachicola–Chattahoochee–Flint (ACF) River Basin Water Control Manual; U.S. Army Corps of Engineers: Mobile, AL, USA, 1959; revised 1991 and 2017; p. xiv.
  43. Griffith, G.E.; Omernik, J.M.; Comstock, J.A.; Lawrence, S.; Martin, G.; Goddard, A.; Hulcher, V.J.; Foster, T. Ecoregions of Alabama and Georgia (Color Poster with Map, Descriptive Text, Summary Tables, and Photographs); (map scale 1:1,700,000); U.S. Geological Survey: Reston, VA, USA, 2001.
  44. Kunkel, K.E.; Stevens, L.E.; Stevens, S.E.; Sun, L. Regional Climate Trends and Scenarios for the U.S. National Climate Assessment, Part 2 (NOAA Technical Report NESDIS 142-2); NOAA: Washington, DC, USA, 2013; p. 94.
  45. NCDC. The Climate of Georgia. Available online: https://www.ncdc.noaa.gov/climatenormals/clim60/states/Clim_GA_01.pdf (accessed on 30 January 2020).
  46. Georgia Environmental Protection Division. Total Maximum Daily Load Evaluation for Lake Allatoona in the Coosa River Basin for Chlorophyll a; Georgia Environmental Protection Division: Atlanta, GA, USA, 2013; p. 127.
  47. Georgia Environmental Protection Division. Final Total Maximum Daily Load Evaluation for Lake Lanier in the Chattahoochee River Basin for Chlorophyll a; Georgia Environmental Protection Division: Atlanta, GA, USA, 2017; p. 130.
  48. Alley, W.M. The Palmer drought severity index: Limitations and assumptions. J. Clim. Appl. Meteorol. 1984, 23, 1100–1109. [Google Scholar] [CrossRef] [Green Version]
  49. Guttman, N.B. Accepting the standardized precipitation index: A calculation algorithm. JAWRA J. Am. Water Res. Assoc. 1999, 35, 311–322. [Google Scholar] [CrossRef]
  50. NDMC National Drought Mitigation Center. Available online: http://drought.unl.edu (accessed on 1 June 2017).
  51. Edwards, D.C.; McKee, T.B. Characteristics of 20th Century Drought in the United States at Multiple Time Scales; Colorado State University: Fort Collins, CO, USA, 1997. [Google Scholar]
  52. McKee, T.B.; Doesken, N.J.; Kleist, J. The relationship of drought frequency and duration to time scales. In Proceedings of the 8th Conference on Applied Climatology, Anaheim, CA, USA, 17–23 January 1993; Volume 17, pp. 179–183. [Google Scholar]
  53. Svoboda, M.; Hayes, M.; Wood, D. Standardized Precipitation Index User Guide; World Meteorological Organization: Geneva, Switzerland, 2012. [Google Scholar]
  54. Spinoni, J.; Naumann, G.; Carrao, H.; Barbosa, P.; Vogt, J. World drought frequency, duration, and severity for 1951–2010. Int. J. Clim. 2014, 34, 2792–2804. [Google Scholar] [CrossRef] [Green Version]
  55. Restrepo-Posada, P.J.; Eagleson, P.S. Identification of independent rainstorms. J. Hydrol. 1982, 55, 303–319. [Google Scholar] [CrossRef]
  56. Mishra, S.; Mishra, D.R.; Schluchter, W.M. A Novel Algorithm for Predicting Phycocyanin Concentrations in Cyanobacteria: A Proximal Hyperspectral Remote Sensing Approach. Remote. Sens. 2009, 1, 758–775. [Google Scholar] [CrossRef] [Green Version]
  57. Mishra, S.; Mishra, D.R. Normalized difference chlorophyll index: A novel model for remote estimation of chlorophyll-a concentration in turbid productive waters. Remote. Sens. Environ. 2012, 117, 394–406. [Google Scholar] [CrossRef]
  58. Knapp, A.; Milewski, A. Water Quality Data-Lake Allatoona, Georgia, U.S., 2017. Mendeley Data 2019, v2. Available online: http://dx.doi.org/10.17632/cr65yxbmvx.2 (accessed on 5 December 2019).
  59. Ortiz, J.D.; Avouris, D.; Schiller, S.; Luvall, J.C.; Lekki, J.D.; Tokars, R.P.; Anderson, R.C.; Shuchman, R.; Sayers, M.; Becker, R. Intercomparison of Approaches to the Empirical Line Method for Vicarious Hyperspectral Reflectance Calibration. Front. Mar. Sci. 2017, 4, 1–21. [Google Scholar] [CrossRef] [Green Version]
  60. Pinckney, J.; Millie, D.; Howe, K.; Paerl, H.; Hurley, J.; Robinson, C.J.; Goómez-Gutieérrez, J. Flow scintillation counting of 14 C-labeled microalgal photosynthetic pigments. J. Plankton Res. 1996, 18, 1867–1880. [Google Scholar] [CrossRef] [Green Version]
  61. Cotti-Rausch, B.E.; Lomas, M.W.; Lachenmyer, E.M.; Goldman, E.A.; Bell, D.W.; Goldberg, S.R.; Richardson, T.L. Mesoscale and sub-mesoscale variability in phytoplankton community composition in the Sargasso Sea. Deep. Sea Res. Part I Oceanogr. Res. Pap. 2016, 110, 106–122. [Google Scholar] [CrossRef] [Green Version]
  62. Liaw, A.; Wiener, M. Classification and Regression by randomForest. R News 2002, 3, 18–22. Available online: http://cogns.northwestern.edu/cbmg/LiawAndWiener2002.pdf (accessed on 22 December 2019).
  63. Breiman, L. Random Forests. Mach. Learn. 2001, 45, 5–32. [Google Scholar] [CrossRef] [Green Version]
  64. Team, R.C. R: A Language and Environment for Statistical Computing; R Foundation for Statistical Computing: Vienna, Austria, 2018. [Google Scholar]
  65. Delpla, I.; Baurès, E.; Jung, A.-V.; Thomas, O. Impacts of rainfall events on runoff water quality in an agricultural environment in temperate areas. Sci. Total. Environ. 2011, 409, 1683–1688. [Google Scholar] [CrossRef]
  66. Jones, I.D.; Elliott, J.A. Modelling the effects of changing retention time on abundance and composition of phytoplankton species in a small lake. Freshw. Boil. 2007, 52, 988–997. [Google Scholar] [CrossRef]
  67. An, K.-G.; Jones, J.R. Factors regulating bluegreen dominance in a reservoir directly influenced by the Asian monsoon. Hydrobiologia 2000, 432, 37–48. [Google Scholar] [CrossRef]
  68. Middleton, G.V. Sediment deposition from turbidity currents. Annu. Rev. Earth Planet. Sci. 1993, 21, 89–114. [Google Scholar] [CrossRef]
Figure 1. Local conditions shown to be important for bloom onset in many lakes or reservoirs include a well-developed thermocline, long retention times, and plentiful orthophosphate.
Water 12 00404 g001
Figure 2. Study location showing data sources and sites in the Etowah and Chattahoochee River Watersheds. Five sites within the Allatoona reservoir and nine sites in the Lanier reservoir were analyzed for spatiotemporal relationships between hydrologic drivers and chlorophyll-a, a proxy for algal blooms.
Water 12 00404 g002
Figure 3. The overall strategy for the study progresses from dataset compilation and processing to comparison of all model parameters with algal blooms across a variety of spatial and temporal scales. Rainstorm I/F/D and Drought S/F/D refer to intensity, frequency, duration, and severity, frequency, duration, respectively.
Water 12 00404 g003
Figure 4. A field survey of water quality was conducted at Georgia Environmental Protection Division (Georgia EPD) sampling points at the major embayments of eastern Lake Allatoona. (a) All sites at Lake Allatoona; (b) The site near the Etowah tributary; (c) The Kellogg Creek site near central Allatoona; (d) The site near the Little River tributary.
Water 12 00404 g004
Figure 5. The sampling sites at Lake Lanier are at the two main tributaries, the Chestatee River and the Chattahoochee River, as well as the several embayments formed by smaller inflows. (a) All sites at Lake Lanier; (b) The sites near the Chestatee tributary; (c) The four sites on eastern Lake Lanier; (d) The sites near the Chattahoochee tributary.
Water 12 00404 g005
Figure 6. Lake Allatoona water quality during the 2017 warm season. (a) Open water near the Etowah River site; (b) Algal bloom with long, fibrous texture near the Little River sampling point; (c) Algal bloom in shallow waters in the Little River embayment; (d) Little River tributary upriver of Lake Allatoona. Photograph (c) by James Tullius, 2017, used with permission.
Water 12 00404 g006
Figure 7. The Standard Precipitation Index (SPI) for the two reservoirs show several droughts within the last decade, notably from 2007 to 2009. (a) 12-month SPI at Lake Allatoona; (b) 12-month SPI at Lake Lanier.
Water 12 00404 g007
Figure 8. Hydrologic and meteorologic trends for Lake Allatoona and Lake Lanier during the study period. (a) The three-month Standard Precipitation Index (SPI); (b) Drought severity calculated from the 12-month SPI; (c) Drought duration in months since the beginning of a drought period; (d) Precipitation values, showing a few extremely large rainstorms. The two reservoirs share a climate region, but Lake Allatoona has experienced more prolonged and extreme drought in the last decade.
Water 12 00404 g008
Figure 9. The variance-explained of each statistically significant linear model is shown by site. Note that r2 is shown here without the direction of the slope. (a) Models showing relationships between flow in the tributaries and chlorophyll-a had the highest r2 value in the Allatoona Creek reach at Lake Allatoona; (b) No significant relationships were found between chlorophyll-a and rainstorms in Lake Allatoona; (c) Drought indices, showed significant, often negative correlation with chlorophyll-a in most of the reaches in both reservoirs.
Water 12 00404 g009
Table 1. Best-Fit Hydrodynamic Regression Models by Site at Lake Allatoona and Lake Lanier.
SiteDriverModelR2/Adj. R2F/DFp-Value
Etowah RiverDln (Chl-a) = −0.34 Little River Weekly Min. Flow + 3.360.156.5/1, 36*
Kellogg CreekDln (Chl-a) = −0.16 12 Mo. SPI + 2.260.135.3/1, 36*
Allatoona DamDln (Chl-a) = −0.16 12 Mo. SPI + 1.120.124.0/1, 38*
Allatoona CreekWln (Chl-a) = 1.04 ln (Weekly Avg. Stormflow) − 6.250.5611.3/1, 9*
Bolling BridgeWln (Chl-a) = 0.37 3 Mo. SPI − 0.440.318.0/1, 18**
Lanier BridgeWln (Chl-a) = 0.37 3 Mo. SPI − 0.190.4514.5/1, 18**
Flat CreekWln (Chl-a) = 1.61 ln Monthly Avg. Stormflow − 9.530.4912.4/1, 13**
Balus CreekWln (Chl-a) = 0.44 ln (Monthly Min. Rainstorm Duration) + 1.440.5111.4/1, 11**
Statistical significance: * p < 0.05; ** p <0.01; F: F-statistic; DF: degrees of freedom; Bloom Drivers: D: Drier Regime; W: Wetter Regime.

