Technical Note: A Device to Directly Measure Transpiration from Vegetation Grown in Containers
Abstract
1. Introduction
2. Materials and Methods
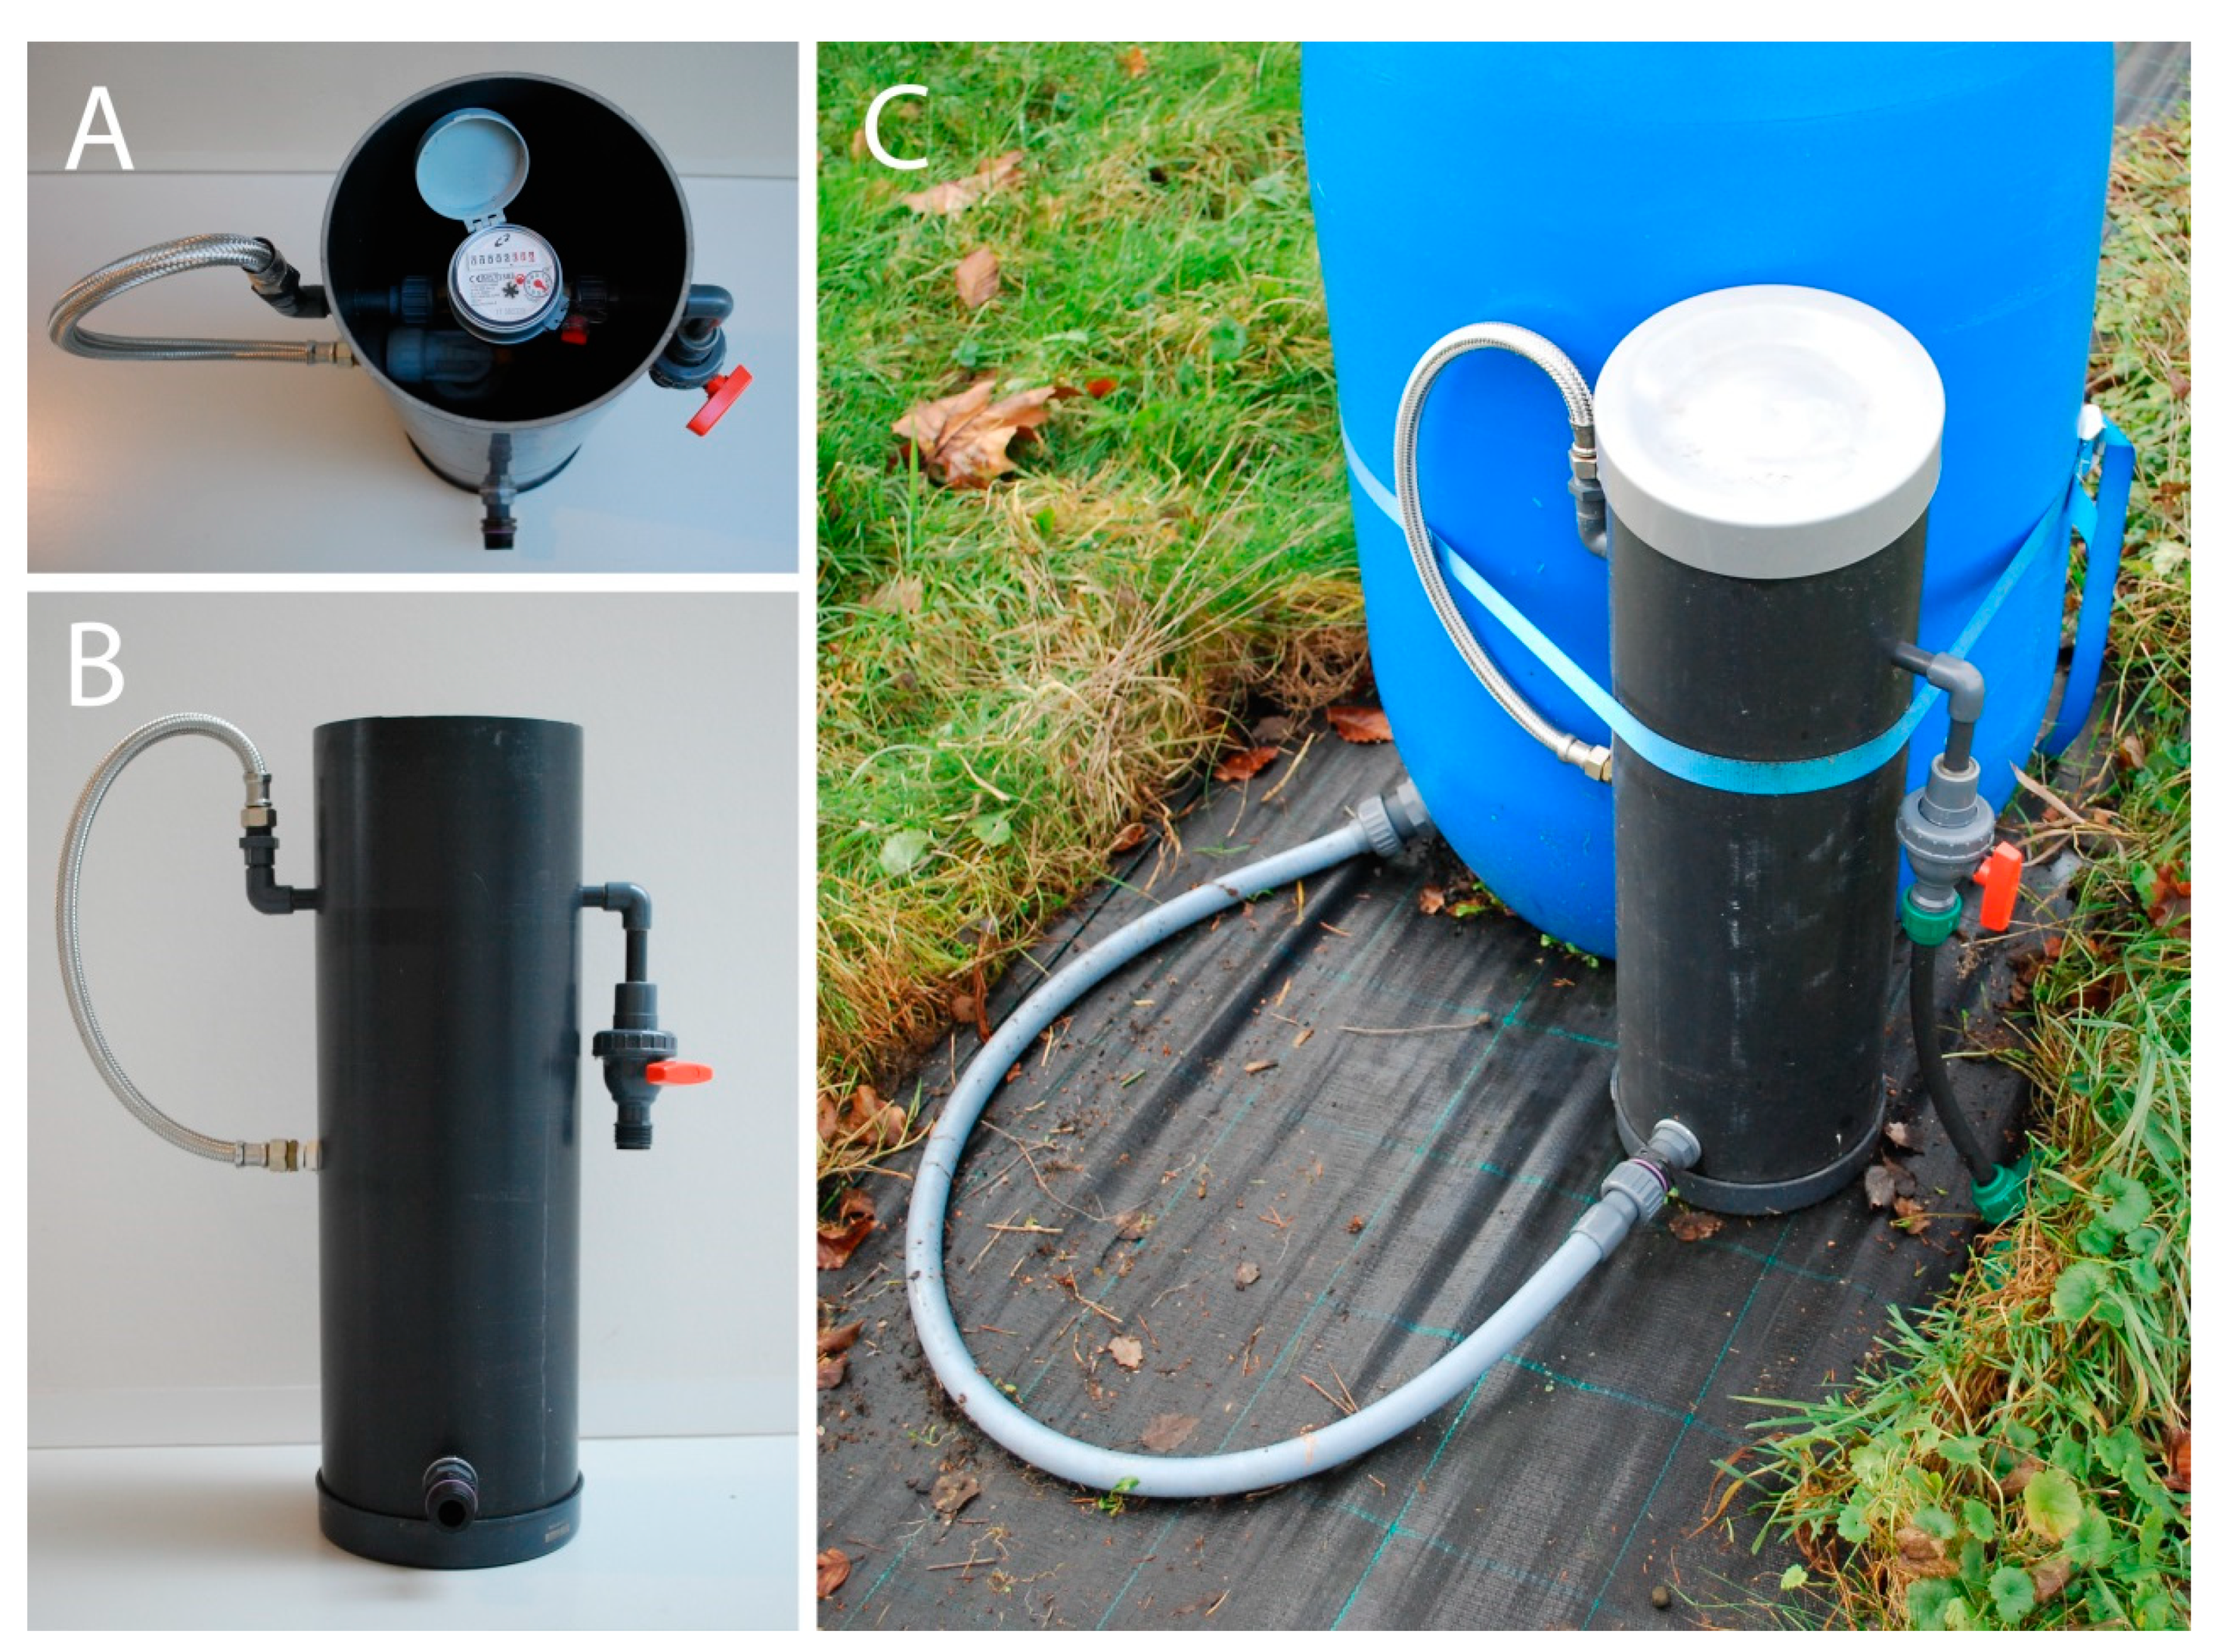
2.1. General Setup and Functioning of the Device
2.2. Design and Materials of the Device
2.3. Plant Container Preparation
2.3.1. Soil Fertilization
2.4. Testing of the Water Supply Device
2.4.1. Accuracy of the Water Meter Related to Different Refill Volumes and Abstraction Times
2.4.2. Field Installation to Measure Whole-plant Transpiration
3. Results
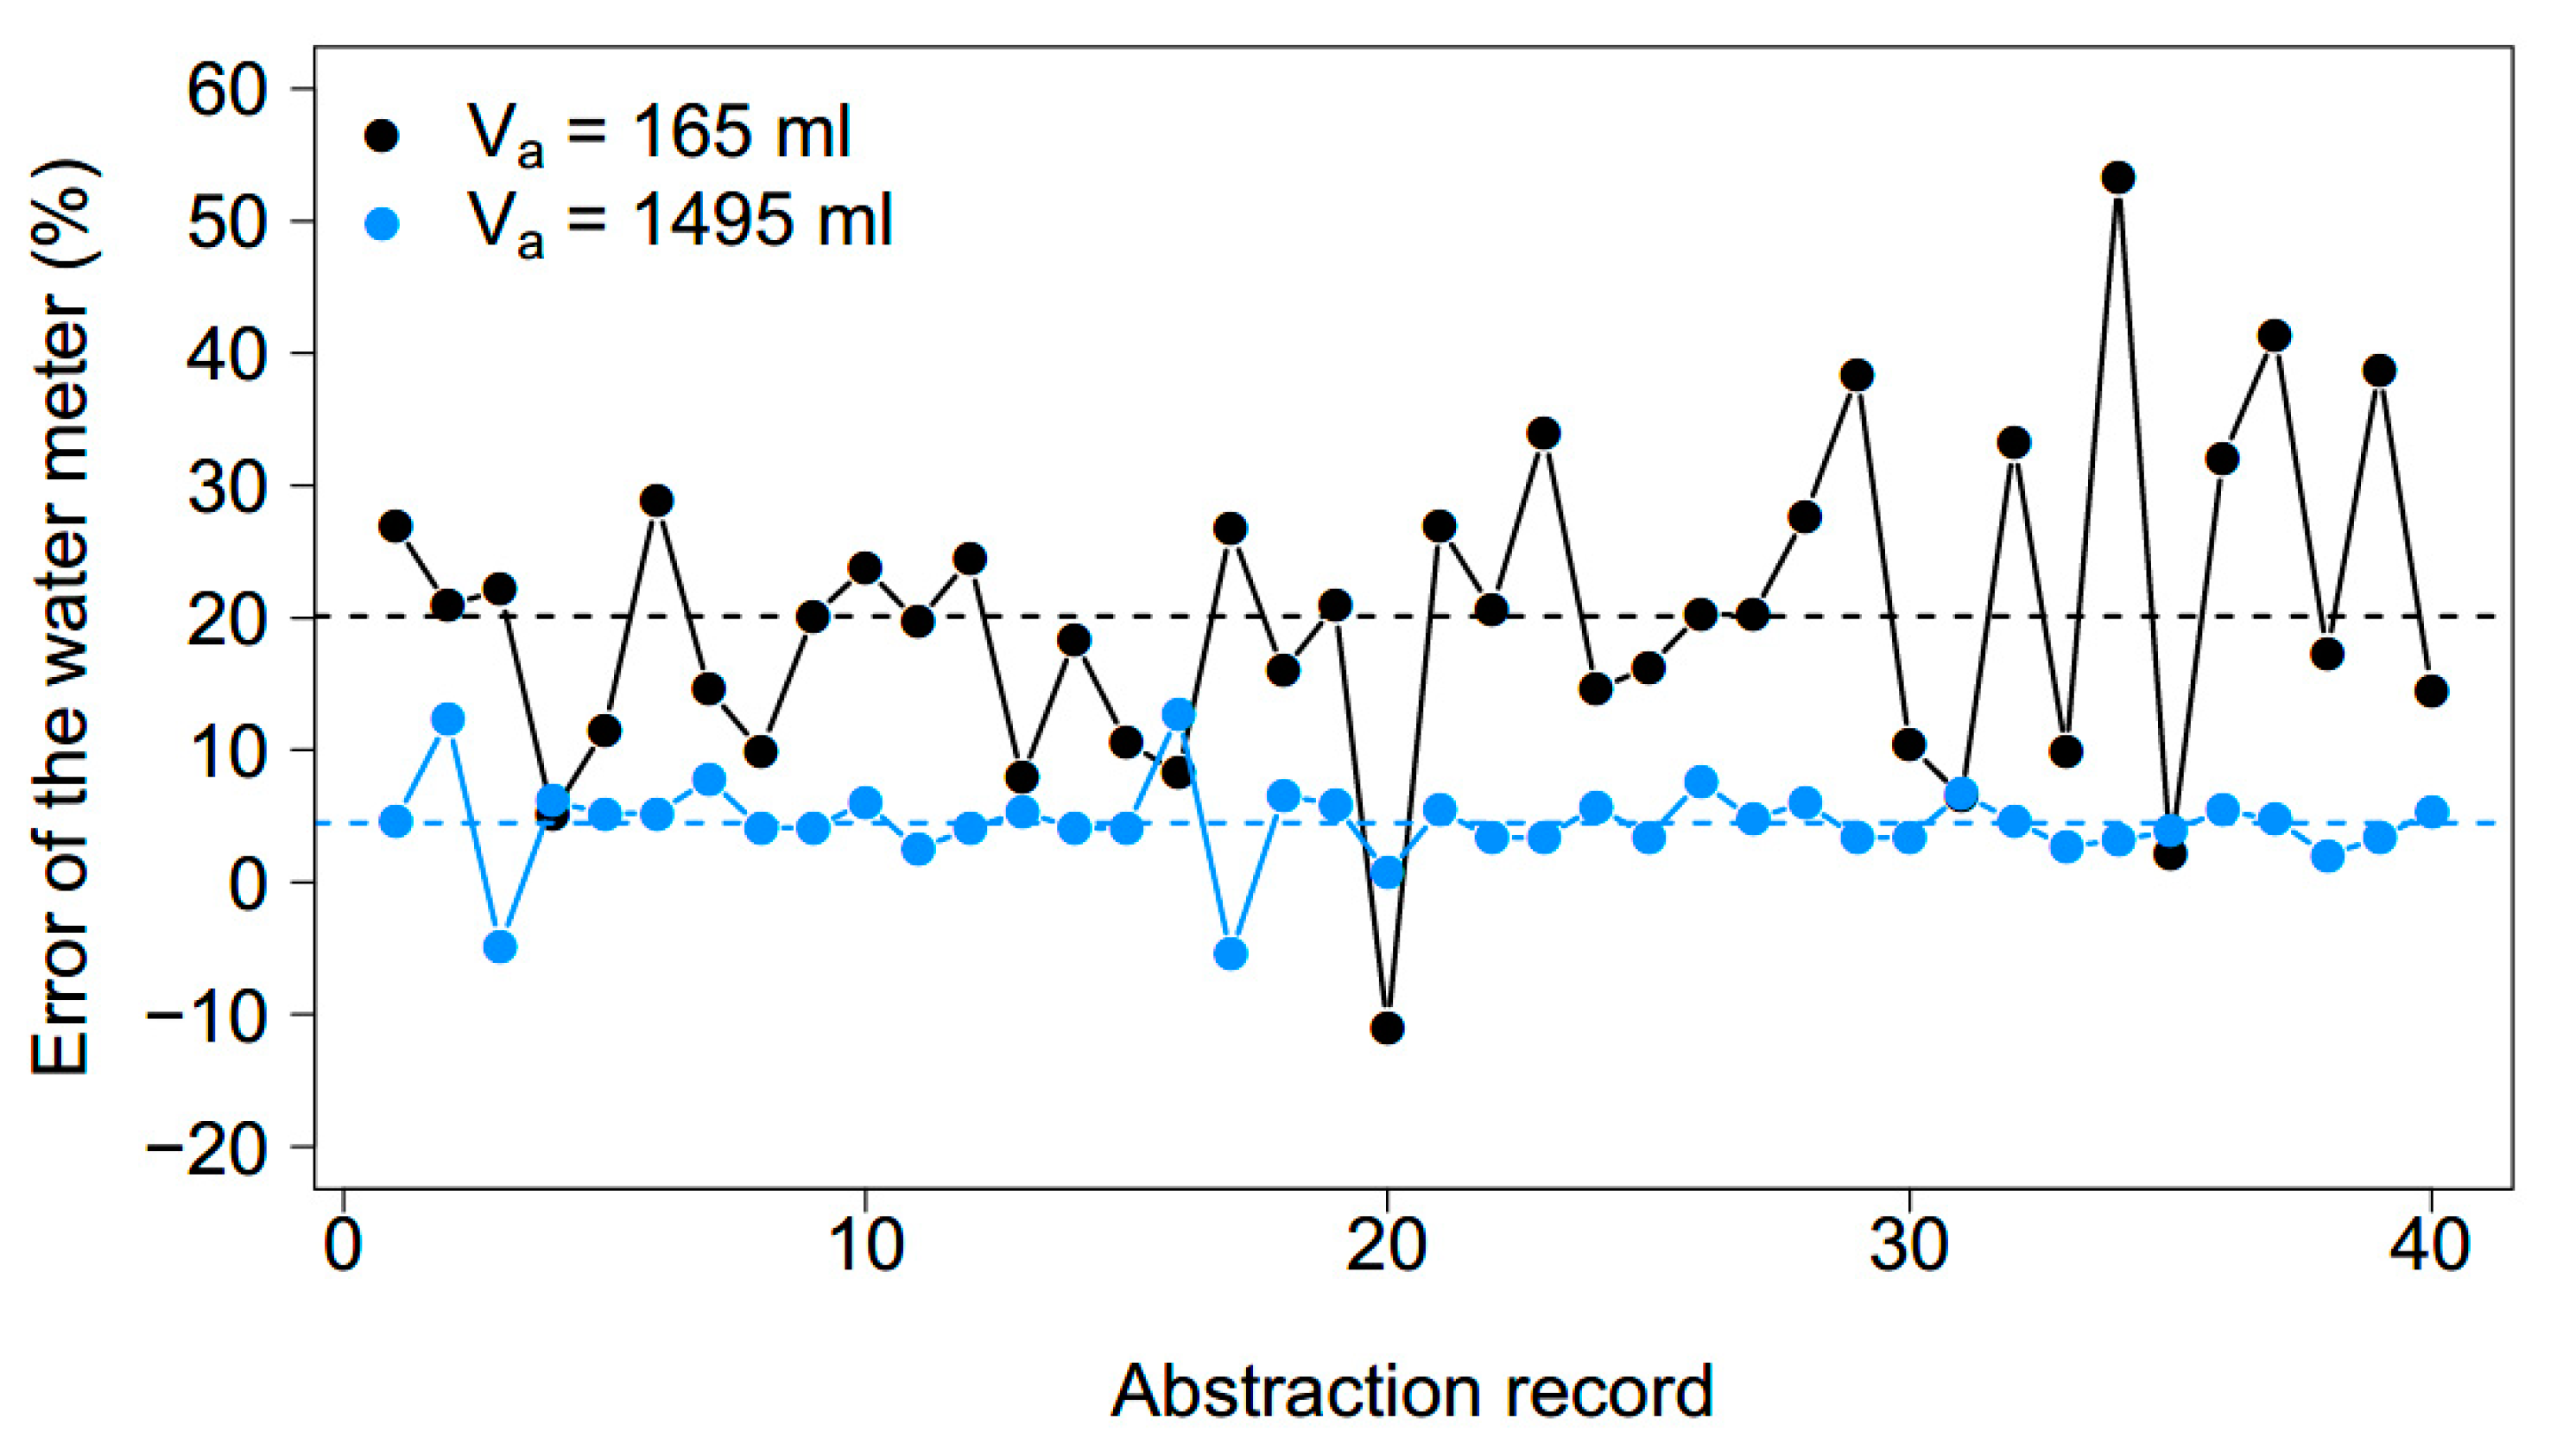
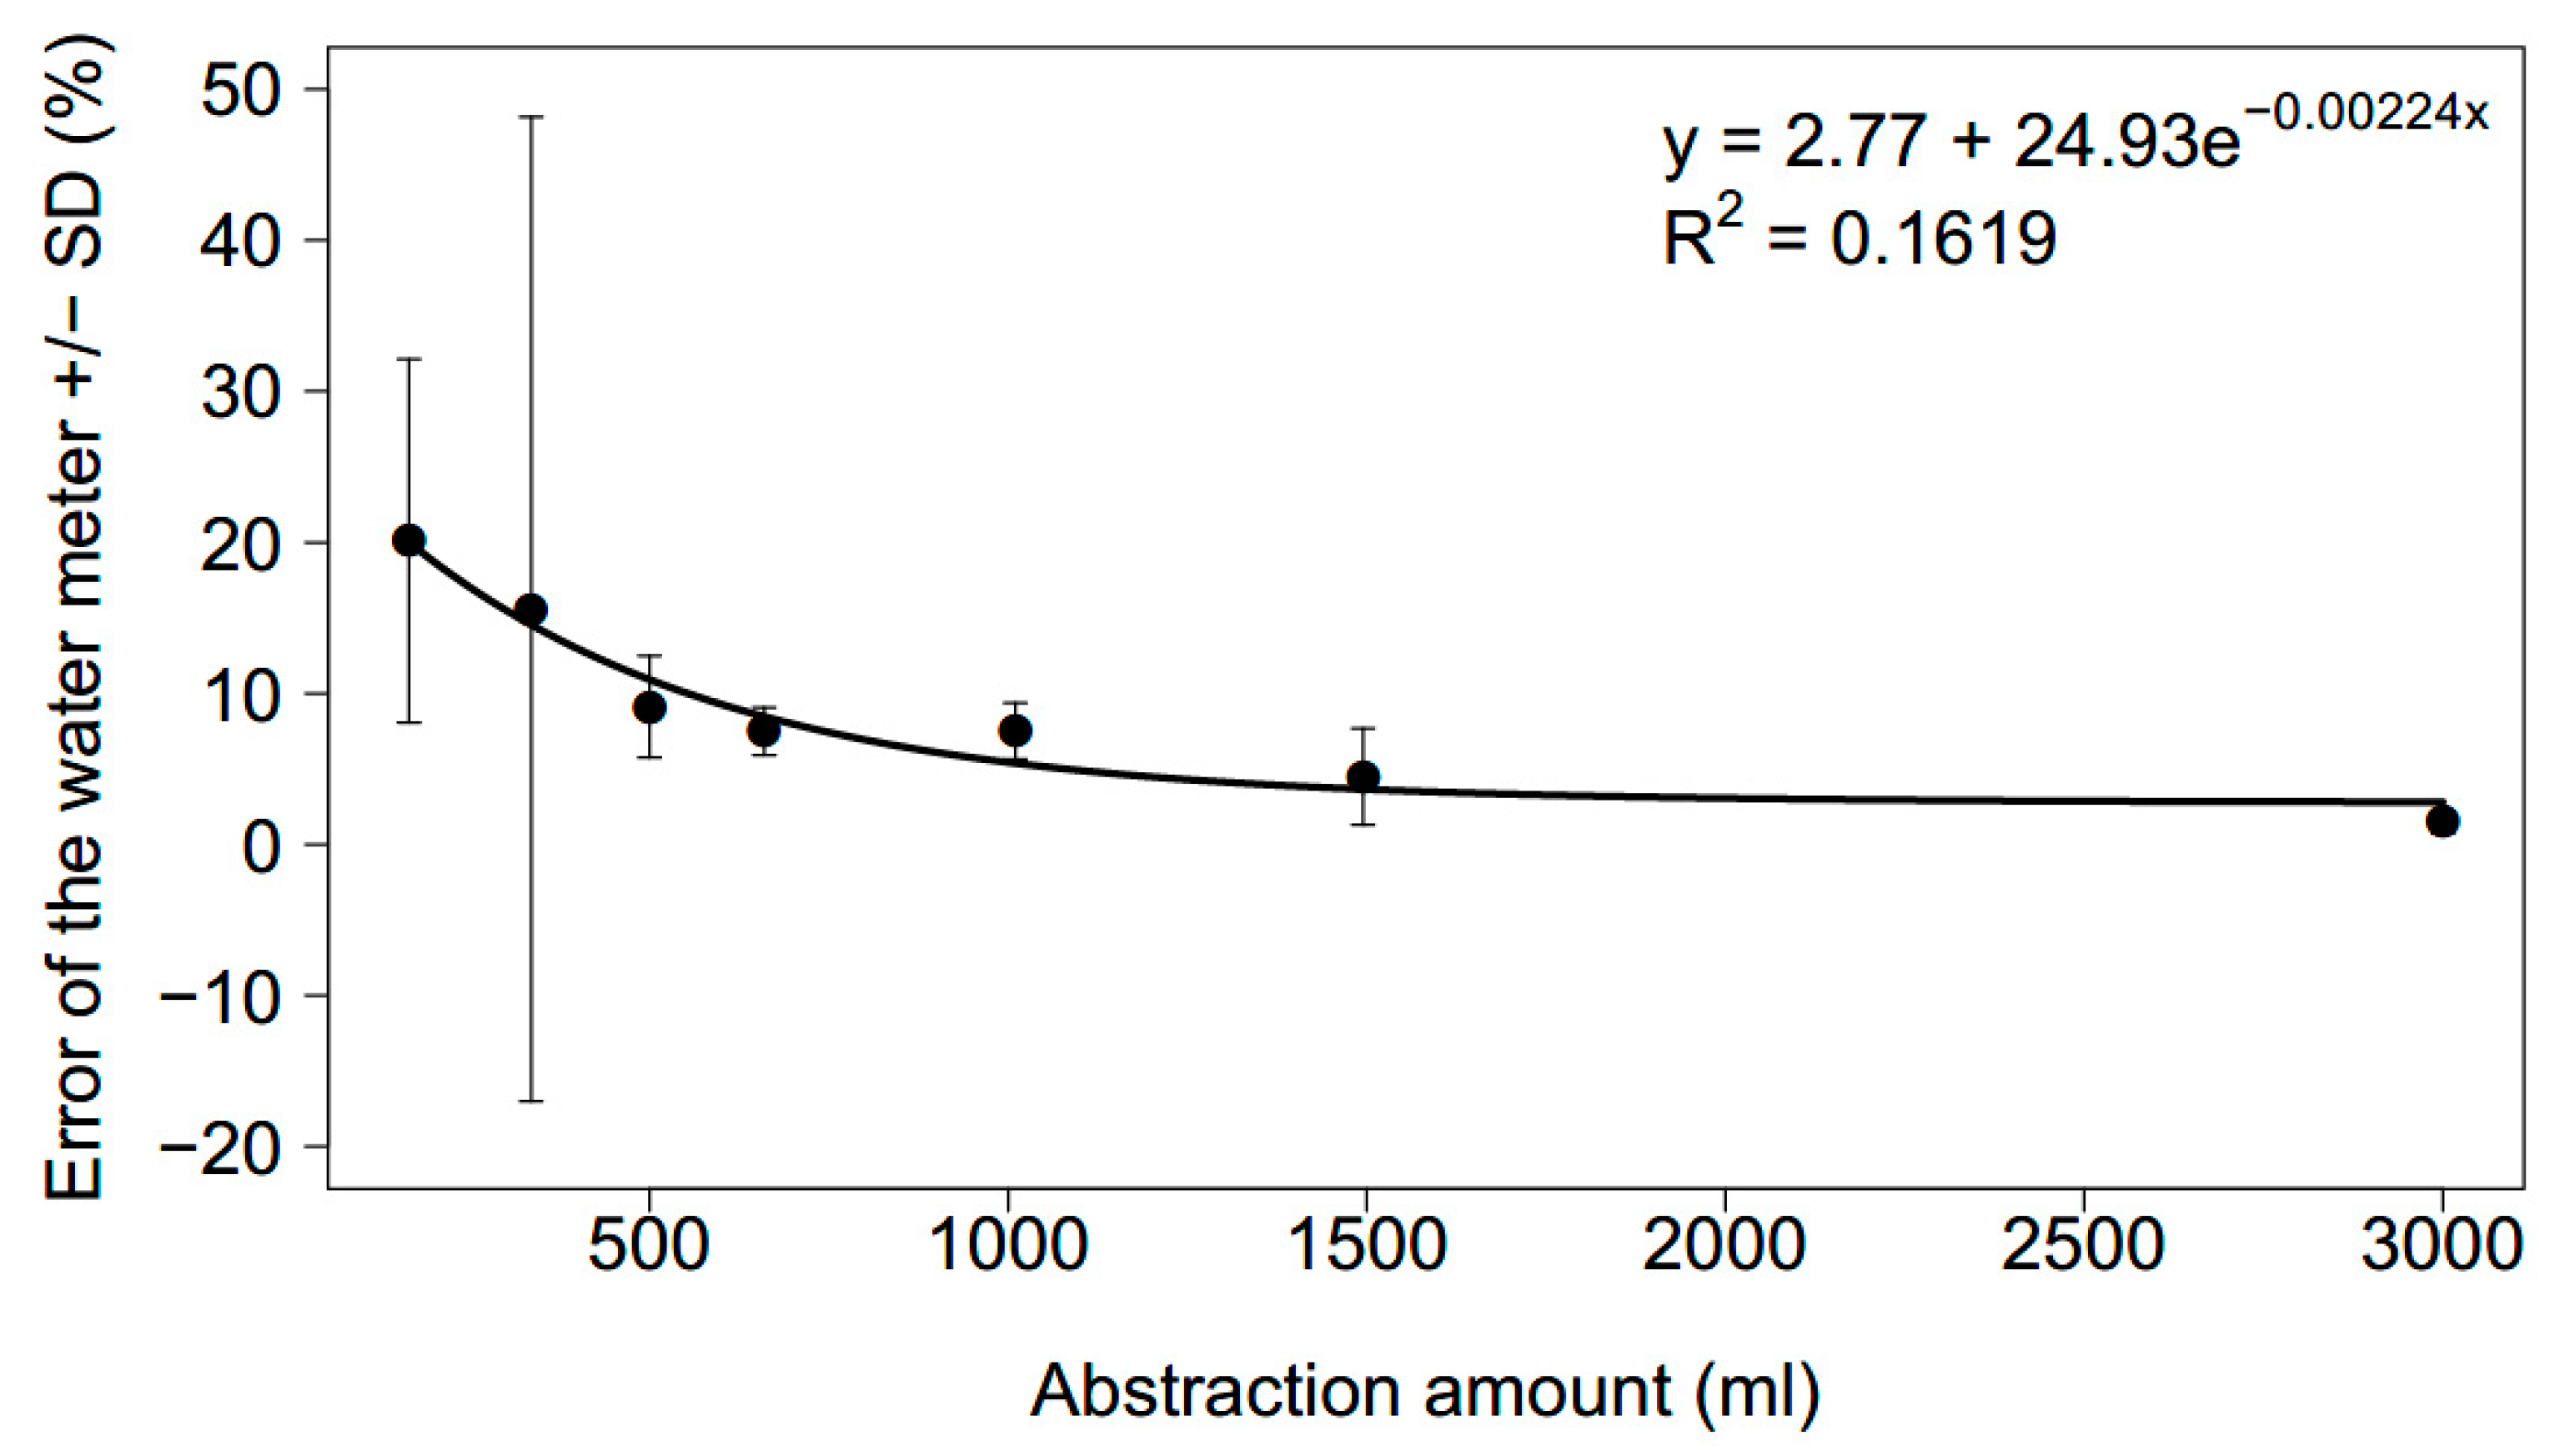
3.1. Accuracy of the Water Meter Related to Different Refill Volumes and over Time
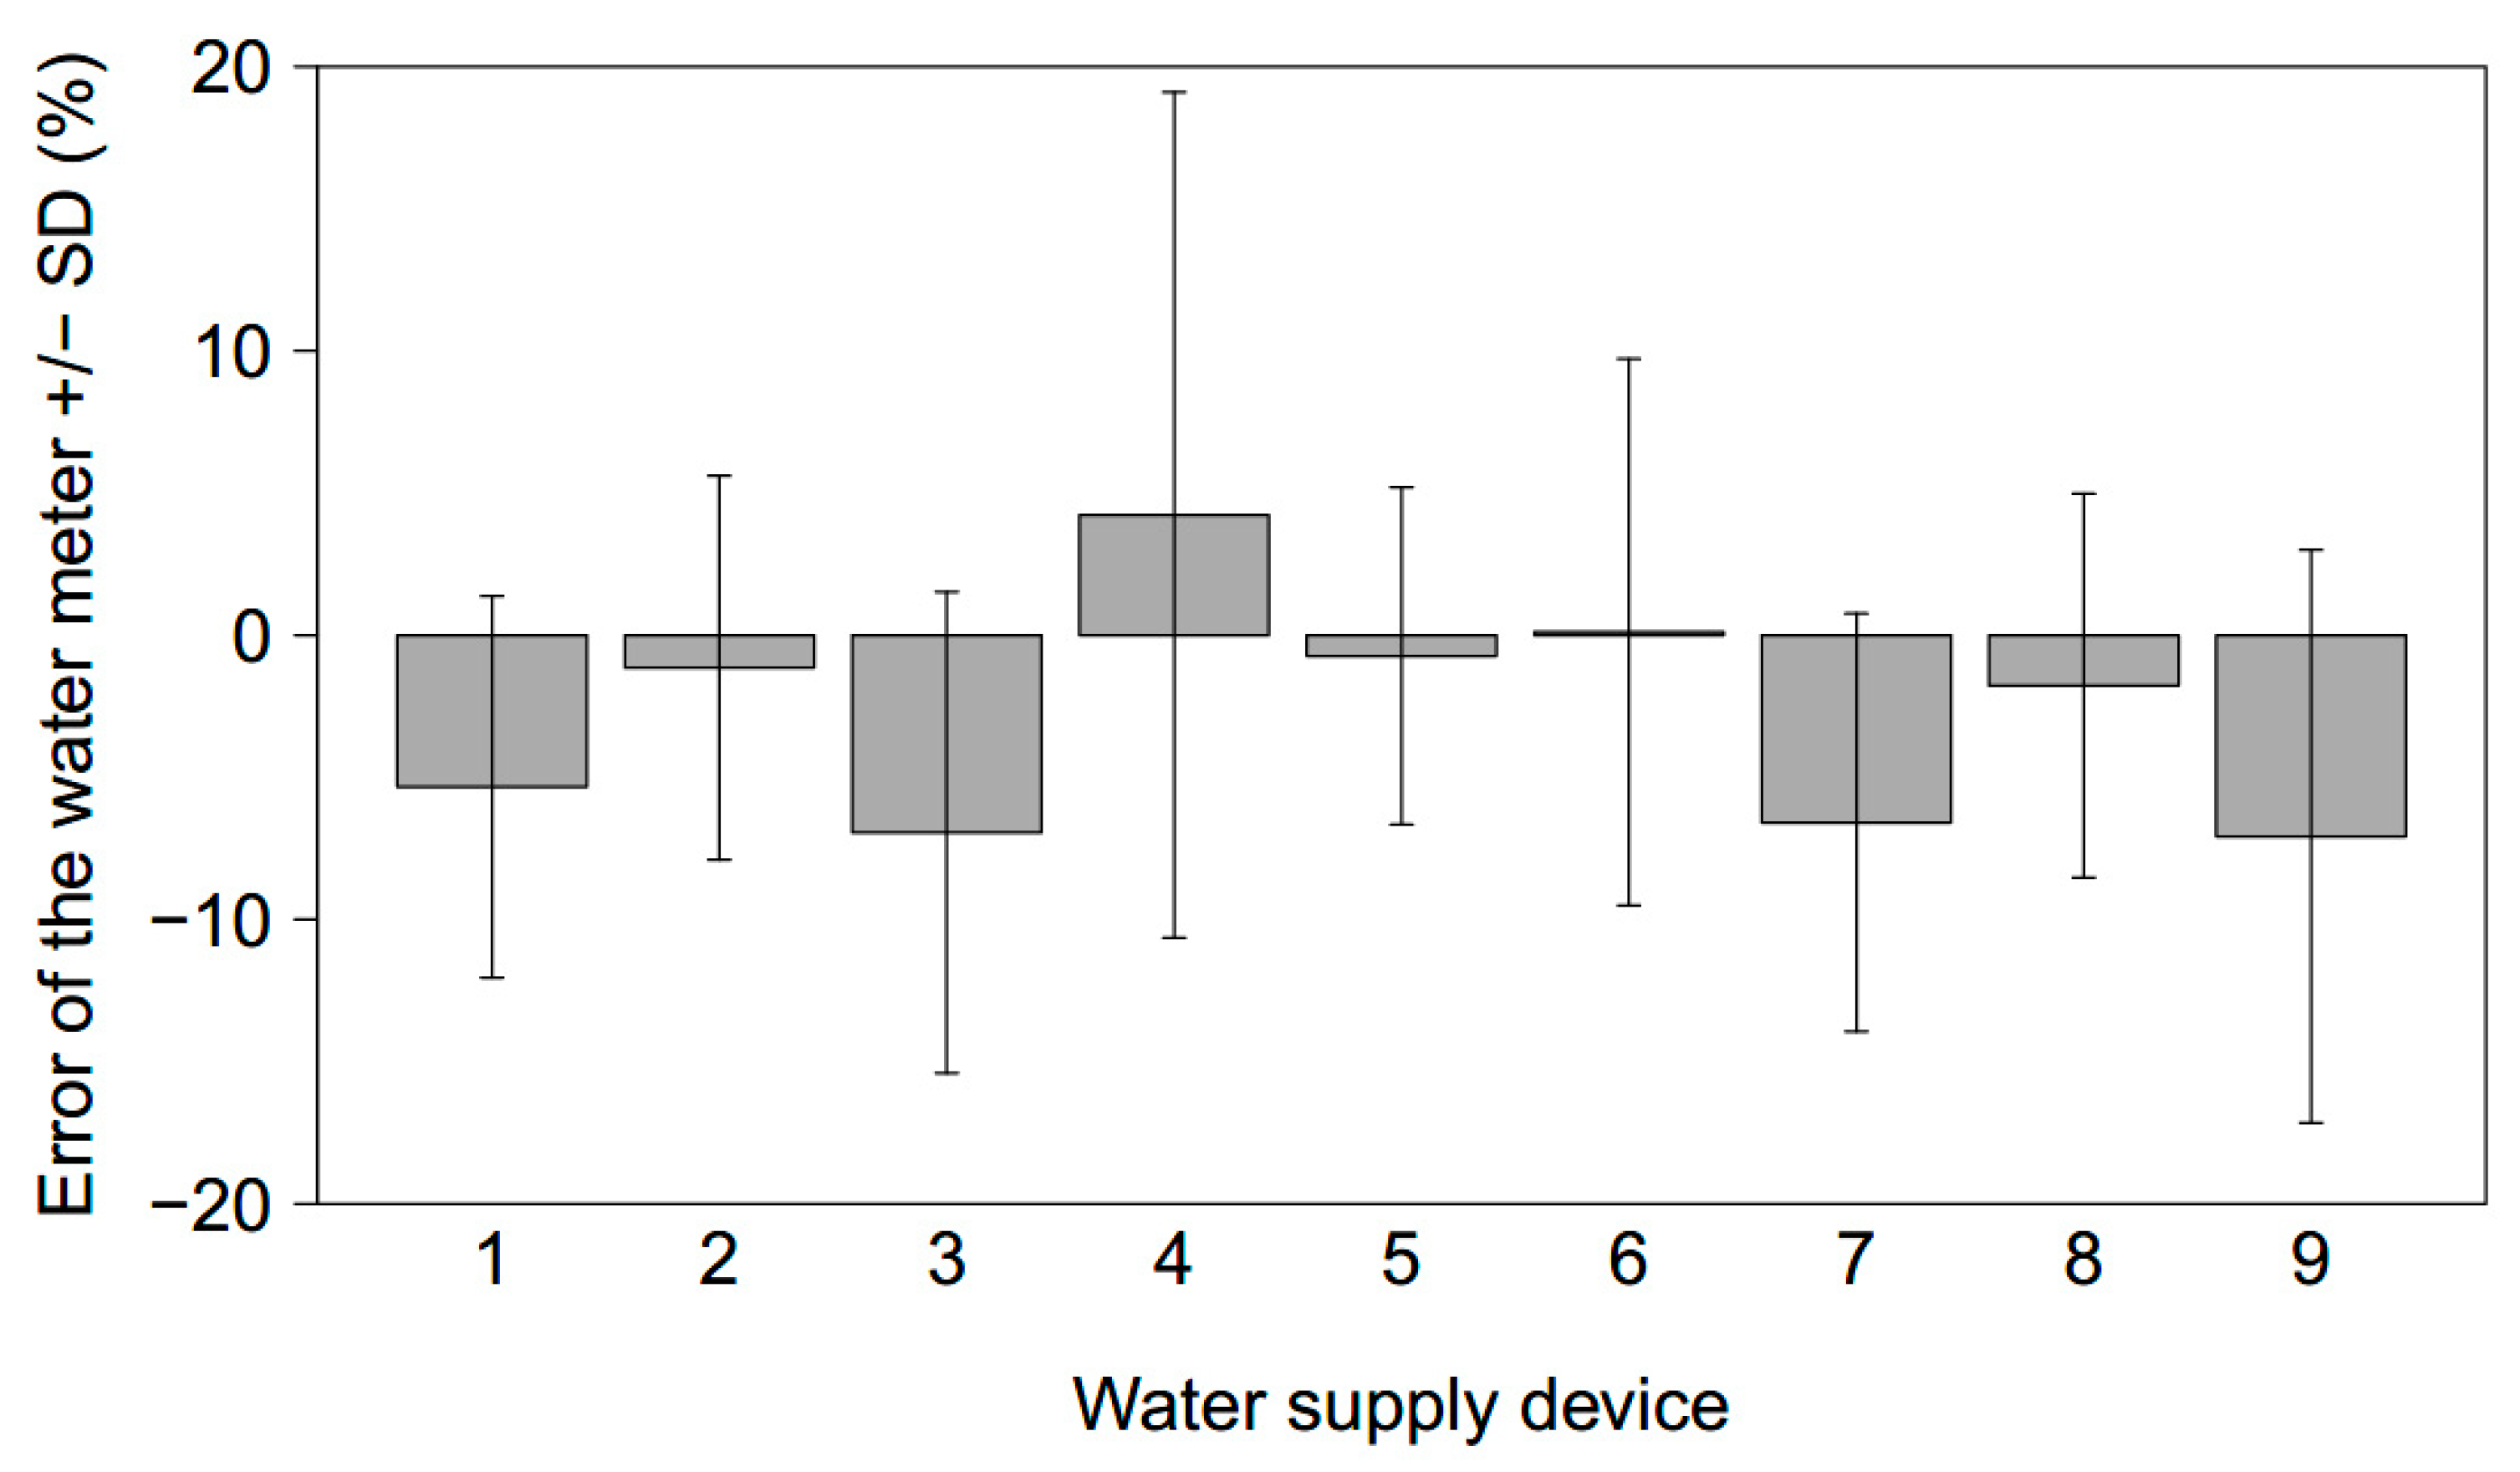
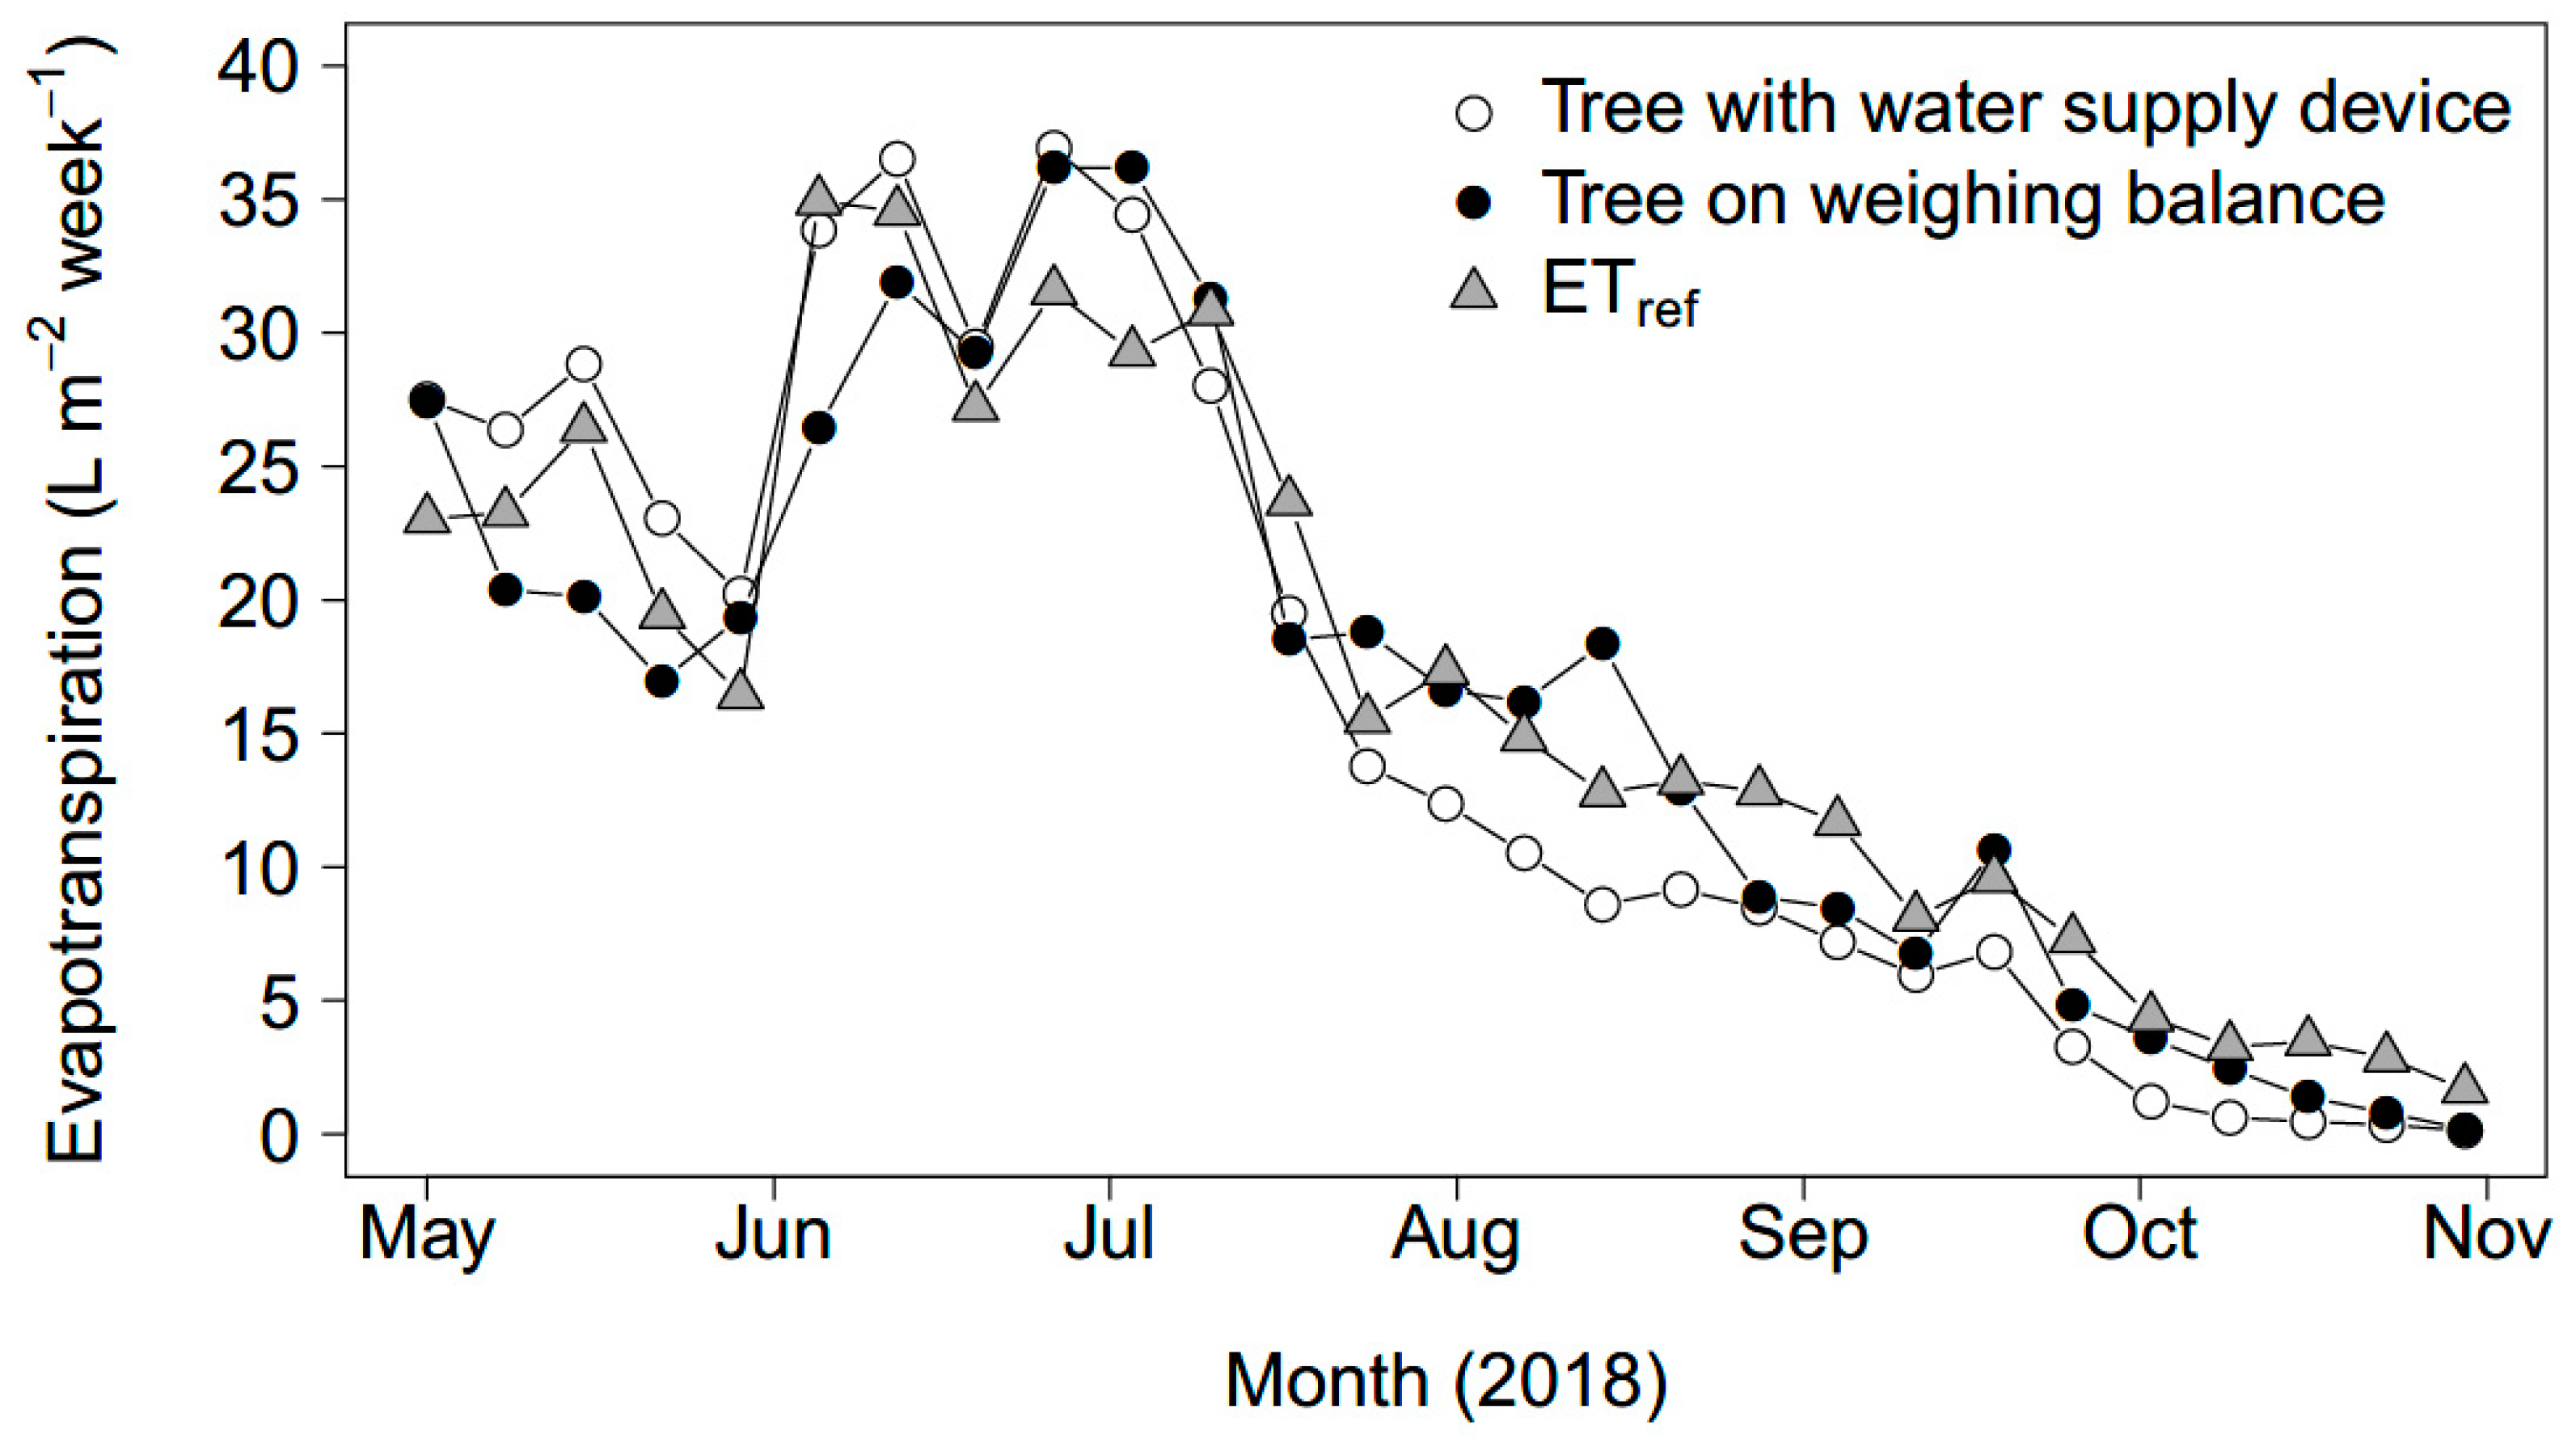
3.2. Field Tests: Tree Water Use Measured by Two Methods
4. Discussion
4.1. Accuracy of the Transpiration Measurements for Different Refill Volumes
4.2. Field Tests: Tree Water Use Measured by Two Methods
4.3. Potential Applications
- Made from easily accessible, durable and relatively inexpensive materials (approx. 80 € material per device);
- The device does not require any electronics, thereby enabling an easy installation and set up;
- Installation both in- and outdoors, as long as rain is excluded from the plant container and temperatures are above 0 °C;
- Measurements of transpiration also in large and/or heavy containers where weighing becomes cumbersome or expensive;
- Fast and easy data acquisition; and
- The device can be modified to enable fully automated data acquisition by installing electronic devices such as level sensors or water meters which can be read remotely.
5. Conclusions
Author Contributions
Funding
Acknowledgments
Conflicts of Interest
References
- Katul, G.G.; Oren, R.; Manzoni, S.; Higgins, C.; Parlange, M.B. Evapotranspiration: A process driving mass transport and energy exchange in the soil-plant-atmosphere-climate system. Rev. Geophys. 2012, 50, 1–25. [Google Scholar] [CrossRef]
- Kirschbaum, M.U.F. Direct and Indirect Climate Change Effects on Photosynthesis and Transpiration. Plant Boil. 2004, 6, 242–253. [Google Scholar] [CrossRef] [PubMed]
- Bartholomeus, R.P.; Stagge, J.H.; Tallaksen, L.M.; Witte, J.P.M. Sensitivity of potential evaporation estimates to 100 years of climate variability. Hydrol. Earth Syst. Sci. 2015, 19, 997–1014. [Google Scholar] [CrossRef]
- Van Dam, J.C.; Groenendijk, P.; Hendriks, R.F.; Kroes, J.G. Advances of Modeling Water Flow in Variably Saturated Soils with SWAP. Vadose Zone J. 2008, 7, 640–653. [Google Scholar] [CrossRef]
- De Wit, C. Transpiration and Crop Yields. Versl. Landbouwk. Onderz. 1958, 64.6, 1–88. [Google Scholar]
- Kool, D.; Agam, N.; Lazarovitch, N.; Heitman, J.; Sauer, T.; Ben-Gal, A. A review of approaches for evapotranspiration partitioning. Agric. For. Meteorol. 2014, 184, 56–70. [Google Scholar] [CrossRef]
- Allen, R.G.; Pereira, L.S.; Howell, T.A.; Jensen, M.E. Evapotranspiration information reporting: I. Factors governing measurement accuracy. Agric. Water Manag. 2011, 98, 899–920. [Google Scholar] [CrossRef]
- Voortman, B.R.; Bartholomeus, R.P.; van der Zee, S.E.A.T.M.; Bierkens, M.F.P.; Witte, J.P.M. Quantifying energy and water fluxes in dry dune ecosystems of The Netherlands. Hydrol. Earth Syst. Sci. 2015, 19, 3787–3805. [Google Scholar] [CrossRef]
- Jaleel, C.A.; Gopi, R.; Sankar, B.; Gomathinayagam, M.; Panneerselvam, R. Differential responses in water use efficiency in two varieties of Catharanthus roseus under drought stress. Comptes Rendus Boil. 2008, 331, 42–47. [Google Scholar] [CrossRef] [PubMed]
- Picon, C.; Guehl, J.; Aussenac, G. Growth dynamics, transpiration and water-use efficiency in Quercus robur plants submitted to elevated CO 2 and drought. Annales des Sciences Forestières 1996, 53, 431–446. [Google Scholar] [CrossRef]
- Vandegehuchte, M.W.; Steppe, K. Sap-flux density measurement methods: working principles and applicability. Funct. Plant Biol. 2013, 40, 213–223. [Google Scholar] [CrossRef]
- Ferrara, G.; Flore, J. Comparison Between Different Methods for Measuring Transpiration in Potted Apple Trees. Boil. Plant. 2003, 46, 41–47. [Google Scholar] [CrossRef]
- Sinclair, T.R.; Holbrook, N.M.; Zwieniecki, M.A. Daily transpiration rates of woody species on drying soil. Tree Physiol. 2005, 25, 1469–1472. [Google Scholar] [CrossRef] [PubMed]
- Vadez, V.; Krishnamurthy, L.; Hash, C.T.; Upadhyaya, H.D.; Borrell, A.K. Yield, transpiration efficiency, and water-use variations and their interrelationships in the sorghum reference collection. Crop. Pasture Sci. 2011, 62, 645–655. [Google Scholar] [CrossRef]
- Lübbe, T.; Schuldt, B.; Leuschner, C. Species identity and neighbor size surpass the impact of tree species diversity on productivity in experimental broad-leaved tree sapling assemblages under dry and moist conditions. Front. Plant Sci. 2015, 6, 1958. [Google Scholar] [CrossRef] [PubMed]
- McCulloh, K.A.; Winter, K.; Meinzer, F.C.; Garcia, M.; Aranda, J.; Lachenbruch, B. A comparison of daily water use estimates derived from constant-heat sap-flow probe values and gravimetric measurements in pot-grown saplings. Tree Physiol. 2007, 27, 1355–1360. [Google Scholar] [CrossRef] [PubMed]
- ASCE-EWRI. The ASCE Standardized Reference Evapotranspiration Equation; Environmental and Water Resources Institute of the American Society of Civil Engineers: Reston, VA, USA, 2005. [Google Scholar]
- R Core Team. R: A language and environment for statistical computing. R Foundation for Statistical Computing; R Core Team: Vienna, Austria, 2019. [Google Scholar]
- Python Software Foundation. Python Language Reference, version 3.7. n.d.; Python Software Foundation: Wilmington, DE, USA.
- WaterTech, Technical data sheet of the Alpha Sj-SDC water meter. Available online: https://wtmeters.com/docProdotti/P-0000039.pdf (accessed on 3 November 2019).
- Hovany, L. Error in water meter measuring due to shorter flow and consumption shorter than the time the meter was calibrated. In Water Supply System Analysis; Ostfeld, A., Ed.; InTech: Rijeka, Croatia, 2012; pp. 131–150. [Google Scholar]


| Item | Size/Type | Supplier | |
|---|---|---|---|
| Water Supply Device | |||
| PVC waste pipe | Recypipe® Diameter: 200 mm Thickness: 4 mm Length: 600 mm | Wildkamp B.V., Soest, The Netherlands | |
| PVC cap | 200 mm | Power Plastics B.V., Rijnsburg, The Netherlands | |
| Toilet float valve | EURO-Universal- filling valve | Wildkamp B.V., Soest, The Netherlands | |
| Water meter | Type Alfa-SDC DN15 Accuracy class 2 1/2” | Wildkamp B.V., Soest, The Netherlands | |
| Hose connecting meter and float | Neoperl® Connecting hose | Technische Unie B.V., Nieuwegein, The Netherlands | |
| (Manual) ball valve, PVC-U | 16 mm | Power Plastics B.V., Rijnsburg, The Netherlands | |
| Plant container | |||
| Flexible PVC hose | Aquastar® 25 mm | Power Plastics B.V., Rijnsburg, The Netherlands | |
| Filter nozzle | type C2 36 × 0.3 G 3/4” | Merrem & la Porte B.V., Zaltbommel, The Netherlands | |
| Rain cape | Custom made to fit container and tree | Zeil-Doek B.V., Montfoort, The Netherlands | |
| Component | Proportion (vol%) |
|---|---|
| Peat, ground | 40 |
| Peat, block, size: 1–2 cm | 30 |
| Coconut coir dust | 20 |
| Bark | 10 |
| Tree | DBH (cm) | Height (m) | Approximate Maximum Transpiring Leaf Area (m²) |
|---|---|---|---|
| Water supply device | 6.8 | 6.17 | 4.88 |
| Weighing balance | 6.8 | 6.30 | 4.41 |
© 2020 by the authors. Licensee MDPI, Basel, Switzerland. This article is an open access article distributed under the terms and conditions of the Creative Commons Attribution (CC BY) license (http://creativecommons.org/licenses/by/4.0/).
Share and Cite
Pflug, S.; Voortman, B.R.; Witte, J.-P.M. Technical Note: A Device to Directly Measure Transpiration from Vegetation Grown in Containers. Water 2020, 12, 355. https://doi.org/10.3390/w12020355
Pflug S, Voortman BR, Witte J-PM. Technical Note: A Device to Directly Measure Transpiration from Vegetation Grown in Containers. Water. 2020; 12(2):355. https://doi.org/10.3390/w12020355
Chicago/Turabian StylePflug, Stefanie, Bernard R. Voortman, and Jan-Philip M. Witte. 2020. "Technical Note: A Device to Directly Measure Transpiration from Vegetation Grown in Containers" Water 12, no. 2: 355. https://doi.org/10.3390/w12020355
APA StylePflug, S., Voortman, B. R., & Witte, J.-P. M. (2020). Technical Note: A Device to Directly Measure Transpiration from Vegetation Grown in Containers. Water, 12(2), 355. https://doi.org/10.3390/w12020355


