Article

Technical Note: A Device to Directly Measure Transpiration from Vegetation Grown in Containers

1
KWR Water Research Institute, 3433 PE Nieuwegein, The Netherlands
2
Systems Ecology, Department of Ecological Science, Faculty of Earth and Life Sciences, Vrije Universiteit Amsterdam, 1081 HV Amsterdam, The Netherlands
3
Moisture Matters, 3533 ED Utrecht, The Netherlands
4
Flip Witte Ecohydrologie, 6862 DC Oosterbeek, The Netherlands
*
Author to whom correspondence should be addressed.
Water 2020, 12(2), 355; https://doi.org/10.3390/w12020355
Submission received: 29 November 2019 / Revised: 13 January 2020 / Accepted: 25 January 2020 / Published: 28 January 2020

Abstract

:
Information about evaporation and transpiration fluxes is vital for water budgets, modeling of water flows and climate, as well as for assessing the hydrological impact of land management practices. Under natural conditions, these fluxes are difficult to measure accurately, which results in large measurement inaccuracies. These inaccuracies can be reduced in controlled experiments. We present a device that is especially useful for transpiration studies conducted in large and/or heavy containers where weighing becomes too cumbersome or expensive. With our device we set a water table and control soil moisture of potted small trees by periodically replenishing soil water consumed by the tree, thereby measuring the inflow volume, which represent whole-tree transpiration. The device is made of inexpensive, easily available and durable materials and can be used for in- and outdoor experiments. Data acquisition is fast and easy. The mean measurement error of the device is 4.5% (±3.2% SD) for refill (i.e., transpiration) volumes of 1.5 L or larger. For a transpiring surface of 3 m², this amount is equal to an accuracy of 0.02 mm. Validation on field data showed that transpiration measured by the device is comparable to transpiration measured by gravimetric changes.

1. Introduction

Transpiration (T) involves the transport of soil water through plants and its subsequent loss by evaporation through their stomata. T together with evaporation (E) from soil (Es) and wet vegetation canopy (interception Ei) forms evapotranspiration (ET). ET is the driving component of earth surface-plant-atmosphere water fluxes [1]. E and T can occur simultaneously and are both controlled by solar radiation, temperature, wind velocity, and vapor pressure gradient. These factors determine the amount of energy available for vaporization and the removal of water vapor from the evaporating surface. In addition, T and E can be both limited by a lack of available soil moisture and are influenced by plant characteristics and plant density.
It is important to distinguish between E and T fluxes because they respond differently to, e.g., air temperature [2], interception [3], and soil moisture [4], and since T is directly related to plant production [5]. Information about E and T fluxes is vital, e.g., to assess groundwater recharge and storage under changing climate, land use, and vegetation management practices. Both terms serve as input to models on, e.g., groundwater flow, weather forecasts, and climate change projections.
E and T are difficult to measure accurately [6,7,8]. A comparison of 31 studies in which E, T, and ET were measured individually, revealed that the sum of E and T comprised 34%–162% of the measured ET [6]. This large span indicates measurement inaccuracies with the used methods for all three terms. These inaccuracies are due to the accuracy of the method and measurement devices as such and to human-induced errors (installation, maintenance, operation) [7]. Moreover, interactions between vegetation and its abiotic and biotic environment are very complex, with great variations spatially and temporally. These complexities are reflected in ET measurements, yielding in a mismatch in the theoretical and measured sum of ET. In natural, undisturbed systems, it is virtually impossible to measure all factors that could affect E and T, e.g., a plant’s access to soil water and nutrients and stress factors, such as toxic heavy metals. This also implies that measurements at one location may not be representative for a larger area, which poses serious limits to the application potential of the collected field data.
The complexity of measuring T can be reduced by experimentally controlling one or more factors which affect E and T. Typically, this is done by means of container experiments which can be conducted outdoors (with rain exclusion), in climate chambers, or in greenhouses. Depending on the research interest, for example soil moisture or CO2 concentration is controlled (e.g., [9,10]). Different sap-flow measurement methods are available for measuring T [11]. When the soil surface is covered to minimize E, whole-plant T can be measured directly by gravimetry. This can be done by placing the plant containers onto weighing devices (e.g., [12,13]) by using a hanging scale [14,15], or with a pallet truck scale [16]. The containers are manually watered to compensate for T losses. Due to practical constraints, the container size is usually limited and, with that, the size of the plant or vegetation under study. Logically, only a few studies measured woody plants taller than 50 cm [13,16]. Therefore, a cost effective system is needed which facilitates the measurement of T in a less time- and labor-consuming manner, thereby also enabling the measurement of larger woody plants.
To this end we designed a measurement device which measures whole-plant T directly and which can be applied for a wider range of container (and, therefore, plant) sizes. Measurements of T can be automated in this system.
This technical note presents the working principle and the design of the measurement device. We will describe how its accuracy was tested both in the laboratory and in the field under optimal water conditions and how T measured by the device compares to gravimetric measurements of T in an outdoor experiment.

2. Materials and Methods

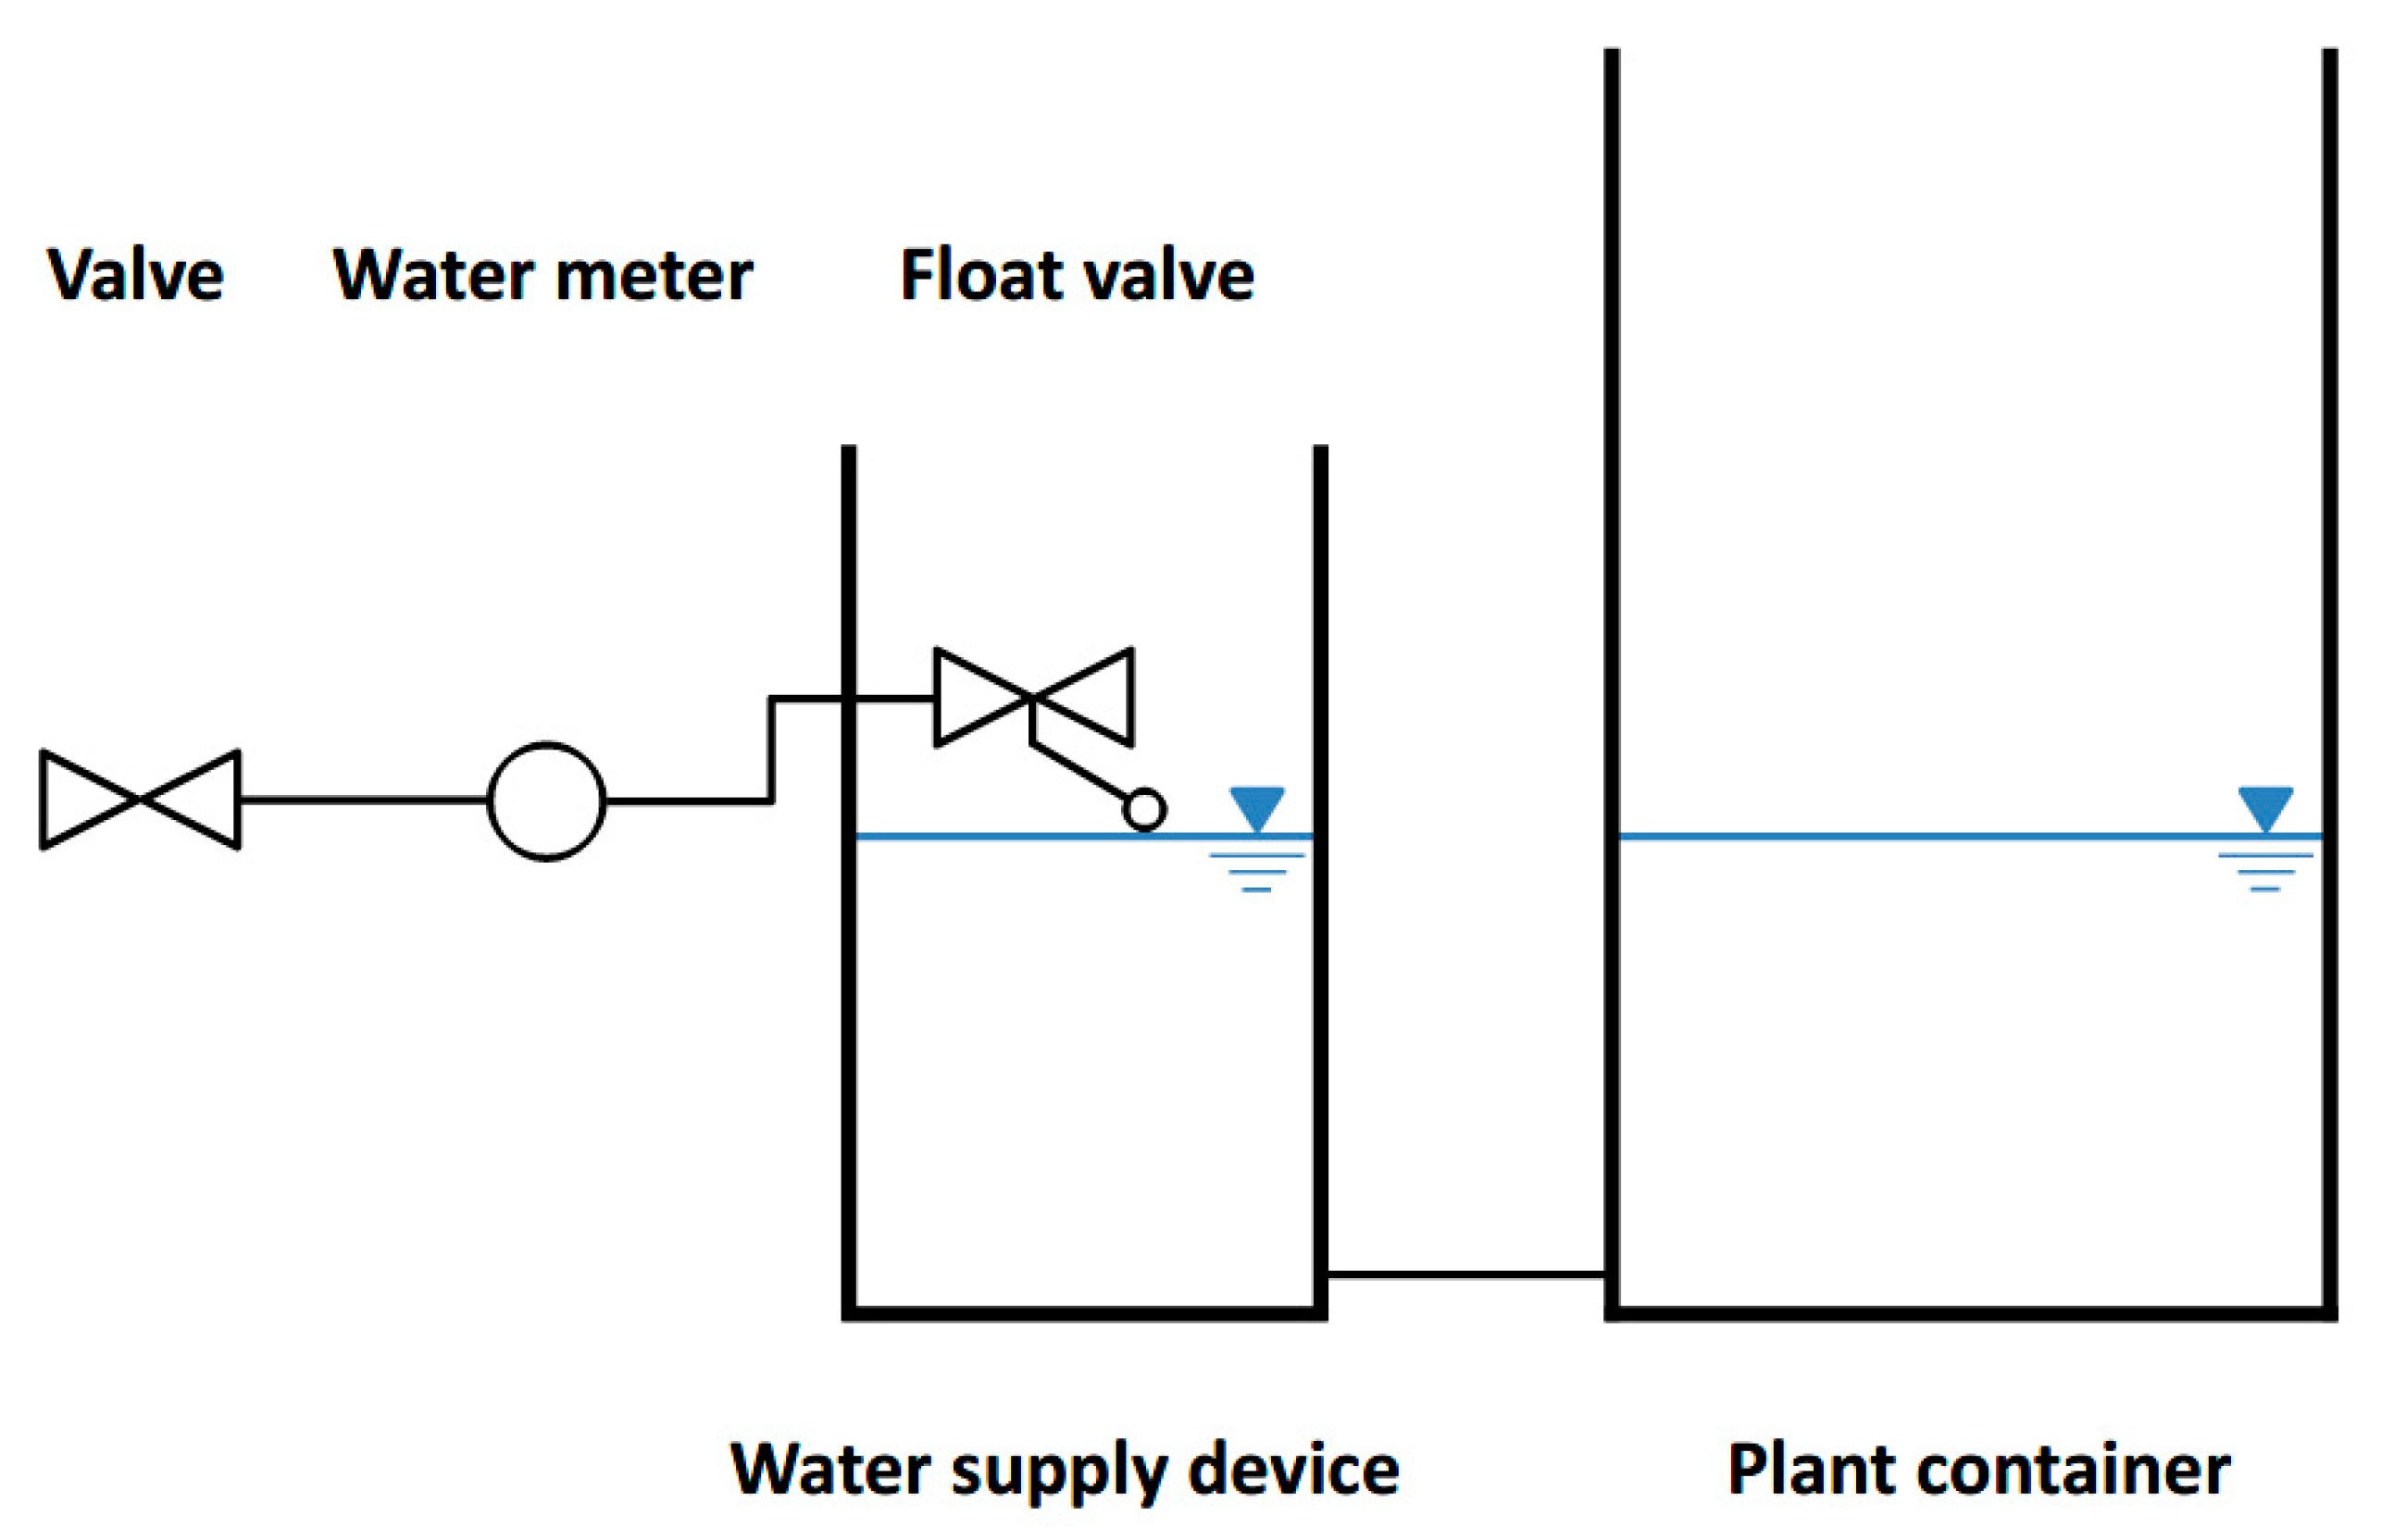
2.1. General Setup and Functioning of the Device

The device for measuring whole-plant transpiration is composed of a low-cost automated water supply device connected to the bottom of a soil container with vegetation. When soil water is consumed by vegetation, upward capillary flow causes a drawdown of the water level at the bottom of the container, as well as in the water supply device. This triggers the supply device to refill the consumed volume to restore the initial water level in both soil container and water supply device. These volumes are measured and represent the total container transpiration. Since T is measured by the refill of the consumed water, the device cannot be used to measure T under drought conditions.

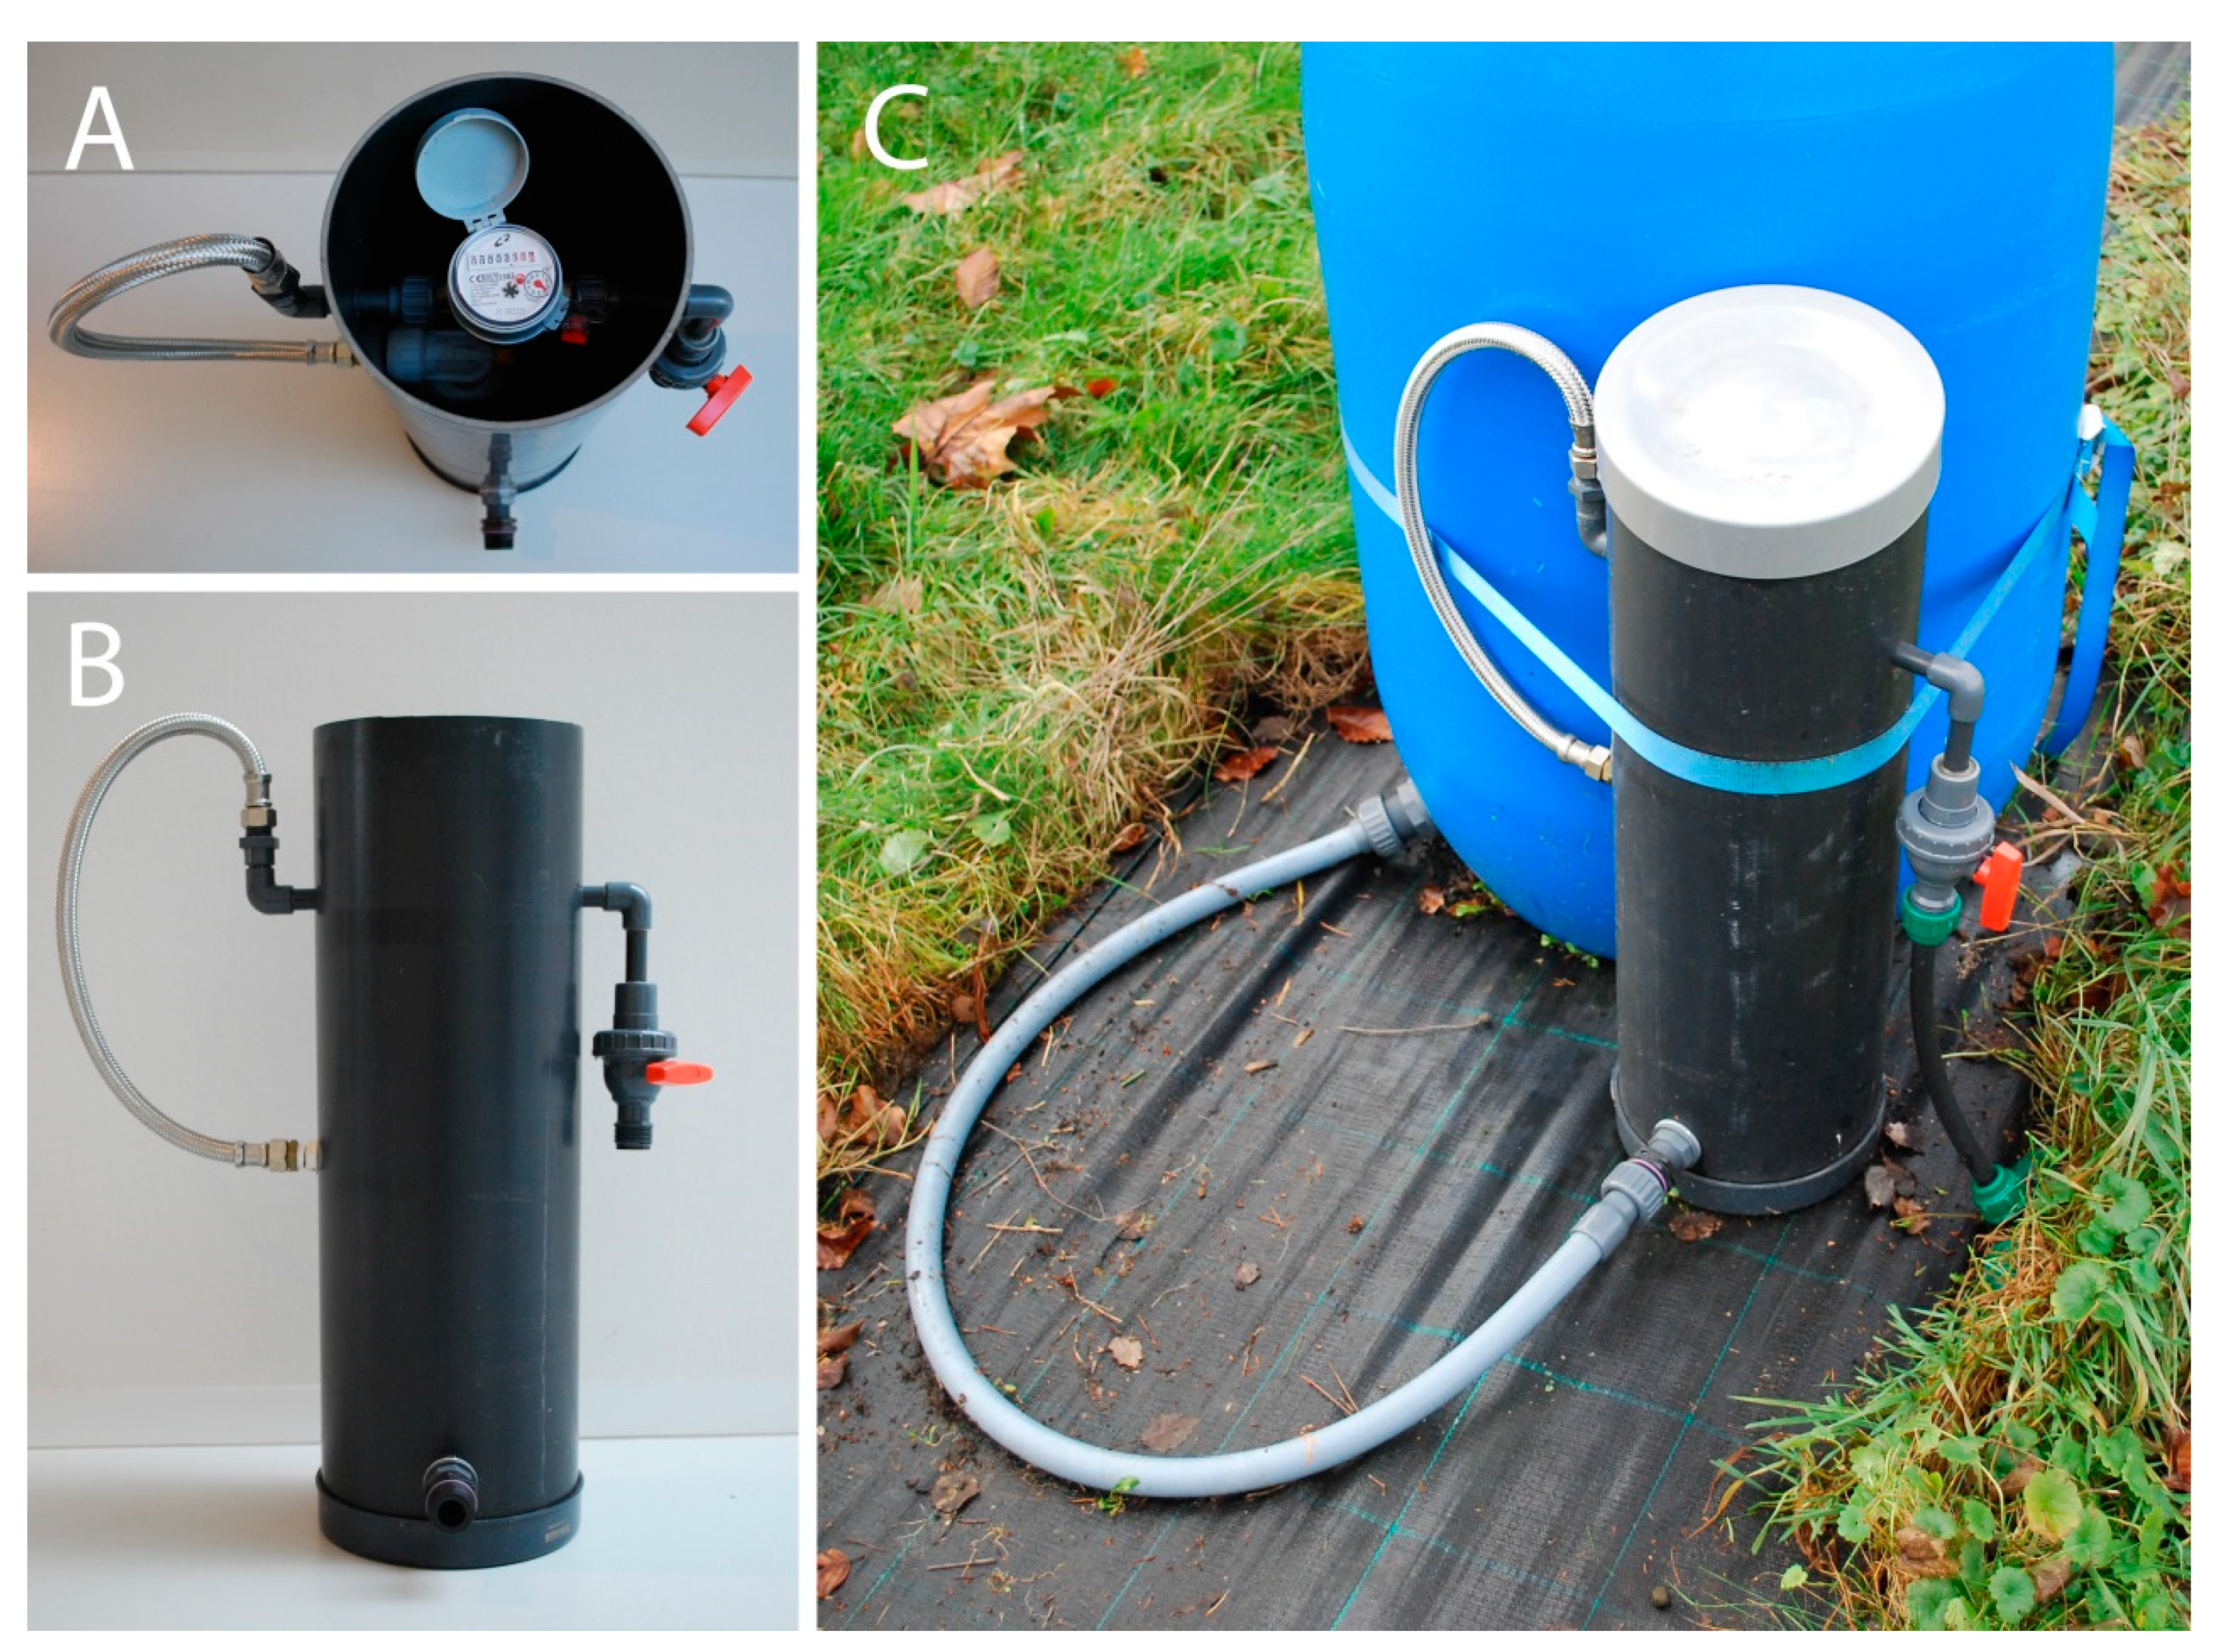
2.2. Design and Materials of the Device

The water supply device consists of a watertight container with a float valve whose position determines the water level both in the water supply device and plant container (Figure 1). The device is permanently connected to a water tap. Water inflow occurs automatically when the water level in the water supply device has dropped enough to activate the opening of the float valve. Water enters the device until the level specified by the float is reached. A water meter installed before the float records the cumulative refill volume.
For the supply device we used a PVC pipe as a housing, closed at the bottom with a PVC cap (Figure 2; Table 1). Both water supply device and plant container should be placed level to ensure proper functioning of the float. A lid covering the top of the water supply device prevents evaporation losses and also shields from rain. The lid is loosely connected to allow air to enter the supply device. A valve at the inlet of the device (before the water meter) enables turning the device on and off, when required.
For the float valve we used a low-cost toilet fill valve. Tests have shown that this float valve opens only partly and for a longer time period than desired when the outflow occurs at a slow pace. In order to obtain reliable data, the valve before the water meter was, therefore, only opened when the water level had dropped sufficiently (at least by 5.4 cm which equaled a refill of 1500 mL, see Section 3.1). To prevent drainage of the water meter when the float valve partly opens while the valve before the water meter is closed, the hose connecting the float valve with the water meter contains an upward bend (Figure 1 and Figure 2B). This way, the water meter remains filled with water.

2.3. Plant Container Preparation

We prepared containers to hold trees of 2–5 m height. As container a barrel made from polyethylene holding a volume of 220 L was used (976 mm high and 590 mm wide at its widest point). The plant container was filled at the bottom with 26 L of basalt gravel (gravel size 2–5 mm) to ensure sufficient flow (Figure 3A). Inside the gravel layer the water supply hose was fitted with a nozzle to minimize the risk of clogging by soil and gravel particles. On top of the gravel layer, 110 L of a dry custom potting soil mixture was added (Lentse Potgrond, Katwijk, The Netherlands; Table 2). Soil compaction and water addition occurred in three additions which filled the container halfway. More soil was added according to the depth of the root system, thereby aiming to create a soil surface level at approximately 10 cm below the rim of the container once planting was completed. A piece of perforated drainage pipe with a diameter of 50 mm placed directly under the roots in an U-shape (thus, one or both ends sticking out of the soil surface, depending on the width of the root system) facilitated air supply to the roots (Figure 3B). Soil evaporation was limited by a 3 cm thick layer of the same basalt gravel as in the bottom of the container, added in 2018 after fertilization (see Section 2.3.1). Soil evaporation measured in containers without a tree indeed proved to be negligible (2.3% of the standardized reference evapotranspiration ETref [17] (see Section 2.4.2), measured over 53 days from May to July 2018). Rain was excluded from the container by means of a cone-shaped rain cape made from watertight sailcloth, installed around the tree stem and rim of the container (Figure 3C). The rain cape contained two covered areas with ventilation holes (opposite each other). To further aid air circulation, around 10 holes of 20 mm diameter were drilled below the rim of the container.
The containers were positioned in a way that there was at least 1 m space between the edges of the canopy of the neighboring trees. After adding an abundant amount of water (40–60 L on a moist soil), the containers were allowed to drain for several hours before connecting the water supply devices.

2.3.1. Soil Fertilization

At the moment of planting in March 2017, the soil had been enriched with two NPK-fertilizers (PG-mix 15-10-20 + trace elements, dosage 8 kg/m³ (Yara Vlaardingen B.V., Vlaardingen, The Netherlands) and Osmocote® Exact Standard 12-14M, 15-9-11 + 2 MgO + trace elements, dosage 3.5 kg/m³, Everris Internatial B.V., Waardenburg, The Netherlands) and micronutrients (Osmocote® Micromax, dosage 1.2 kg/m³). In May 2018, a slow release fertilizer was applied on top of the soil surface (Osmocote® topdress 4-5M, 22-5-6 + 2 MgO + trace elements, dosage 100 g per plant container). Additionally, soluble fertilizer was added once a month from July to November 2018 directly to the water supply device as a concentrate (NPK 12-12-36 + 1 MgO + 2.5 SO3 + trace elements, dosage 10 g per plant container, Yara Vlaardingen B.V.).

2.4. Testing of the Water Supply Device

2.4.1. Accuracy of the Water Meter Related to Different Refill Volumes and Abstraction Times

Water inflow occurs automatically when the water level in the water supply device has dropped enough to activate the opening of the float valve. However, if the float valve opens only partly and the outflow occurs at a slow pace, the refill into the device can be too slow for the water meter to be measured. Therefore, the measurement accuracy of the water meter depends on the volumetric flow rate, i.e., the amount of water abstracted from the water supply device which is refilled at a moment in time. To test the relationship between refill volume and measurement accuracy, one device was tested in the laboratory. First, it was disconnected from the plant container. Next, a volume of water Va was abstracted from the water supply device with a pump into a bucket. Then the valve before the water meter was opened, i.e., the water supply device was activated. The inflow by the float valve stopped automatically after the water in the supply device reached its initial level. Finally, the abstracted volume Va was compared to the volume recorded by the water meter, Vr. The valve was closed again and the abstraction restarted. This was repeated 40 times in a row for each abstraction volume. The investigated abstraction volumes Va were: 165, 335, 500, 660, 1010, 1495, and 3000 mL (rounded to the nearest 5 mL). Abstraction volumes of 165–660 mL were determined by weighing at a resolution of 0.01 g; the abstraction volumes of 1010 to 3000 mL by weighing at a resolution of 10 g. The percentage error was calculated as follows:
error (%) = 100 × (Vr – Va)/Va
In which Vr is the volume recorded by the water meter and Va is the volume abstracted from the water supply device.
The relationship between abstraction volume and error of the water meter was determined with the self-starting function Ssasymp in R [18].
An additional test was conducted under field conditions. There, nine supply devices were connected to one pipe so that all devices could be refilled simultaneously. An abstraction volume of 1435 ml was manually removed from all devices, then all devices were refilled at the same time. This was repeated 10 times in a row and the percentage error was calculated with Equation (1).

2.4.2. Field Installation to Measure Whole-plant Transpiration

We evaluated whether tree transpiration measured by the device yields comparable results as when measured with a weighing balance. Here we focus on measurement results of two comparable trees of Sorbus aucuparia L. The trees were purchased from Huverba B.V. (Opheusden, The Netherlands). The two trees were positioned next to each other as part of a large field experiment to study plant traits in relationship to transpiration and interception in Nieuwegein, The Netherlands (52° 01′ N, 5° 06′ E, 1 m.a.s.l), in 2017. One tree was placed on a weighing balance (bench scale, series WPT-K, division = 10 g, maximum load = 250 kg, Henk Maas Weegschalen B.V., Veen, The Netherlands), installed in 2017, whereas the other one was connected to a water supply device, installed in 2018. The water supply device was placed directly on the ground next to the plant container (Figure 2C). The water level was set to 19 cm above the bottom of the container. The refill moments of the water supply device were controlled by an electronic valve to ensure that the flow rate through the water meter was sufficient for accurate measurements (see Section 3.1). The number of opening moments of the electronic valve was continuously adjusted to match the water use of the tree, thereby aiming at a refill of at least 1500 mL with each opening. The first refill of the day was at 10:00 CEST at the earliest, the last one at 21:00 CEST at the latest. The valve was opened a maximum of 13 times per day during the summer. The water meter was read once a day before the first refill.
For the tree on the weighing balance, weights were measured and stored every minute. The water level was also set to 19 cm. Soil water consumed by this tree was replenished manually every day. This was done by adding water through a pipe extending to the bottom of the container, i.e., irrigating the system from the bottom in a comparable way as the container connected to the water supply device. Based on the water level which was visible through a transparent tube attached to the soil container, the container was refilled until the water level in the bottom of the container was back at its original level.
For the tree connected to the water supply device and the one placed on the weighing balance it is very likely that water was not a limiting factor for plant transpiration, i.e., that potential transpiration was measured for both systems. This is due to the favorable characteristic of the potting soil, which was composed to create optimal water and oxygen conditions for tree nurseries.
To be able to correctly interpret the results, solar radiation, relative humidity, air temperature, air pressure, wind direction and wind speed was measured on-site by a WS501 smart weather sensor (G. Lufft Mess- und Regeltechnik GmbH, Fellbach, Germany) Parameters were measured every 60 s and aggregated to 5 min values. Those parameters were used to calculate ETref. The ETref used is representative of a dense, actively growing surface of clipped grass and based on the Penman–Monteith standardized reference evapotranspiration equation following the ASCE-EWRI method [17]. These calculations were done in Python [19].
To be able to compare measurements of the two different trees and to obtain transpiration numbers in mm, we derived a rough estimate of the maximum transpiring leaf area for each tree. This was done by dividing the measured weekly transpiration (L/week) by ETref (L/m²/week) for each week of the period during which it was assumed that the total leaf area was the largest (10 June to 2 September 2018, 13 weeks). The mean of the 13 weeks was taken as an approximation for the maximum transpiring leaf area (Table 3), i.e., we assumed that the potential tree transpiration is equal to ETref. Then the weekly observations of transpiration of the entire measurement period (27 May until 25 November 2018) was divided by the transpiring leaf area.

3. Results

3.1. Accuracy of the Water Meter Related to Different Refill Volumes and over Time

In the laboratory test, the percentage error of the water meter was positive for most refill events for both a higher (V = 1495 mL) and a lower abstraction volume (V = 165 mL) (Figure 4). The error of each individual refill event differed per refill event and per abstraction volume. Over time, the deviation of the error of the water meter around its mean was smaller for a high abstraction volume. The mean percentage error over 40 measurements was lower for the higher abstraction volume (4.49%) than the lower abstraction volume (20.1%).
The mean percentage error of the water meter exponentially decreased with an increasing abstraction volume (Figure 5). For low abstraction volumes, the water meter overestimated the refilled volumes on average by up to 20%. The mean error dropped below 5% for a refill volume of approximately 1500 mL and larger (mean = 4.49 ± 3.2% (SD) for 1495 mL); 1500 mL equaled a drop in the water level of 5.4 cm.
Under field conditions and for an abstraction volume of 1435 mL, both positive and negative mean errors of the water meters were measured when all nine devices were refilled simultaneously (Figure 6). Mean errors ranged from −7.1% to 4.2%; the mean of all devices was −2.8%. Of the tested devices, two displayed positive errors and seven displayed negative errors. The negative errors are in contrast to the errors measured when only one device was refilled at a time (Figure 5).

3.2. Field Tests: Tree Water Use Measured by Two Methods

Figure 7 shows the weekly ET for the two trees of Sorbus aucuparia corrected for their approximate maximum transpiring leaf areas (Table 3), as well as the calculated ETref over time. All three ET measurements followed a similar pattern close to each other. A peak is reached in July and ET decreased in a similar fashion towards the end of the summer and autumn. The tree with the water supply device had a larger water consumption than the tree on the balance until the end of July, after which the difference became opposite for most weeks. Over the entire measurement period, 8% more consumption was measured for the tree connected to the device than for the tree on the balance: 2117 L and 1961 L, respectively. Scaled to the maximum transpiring leaf area, these volumes amounted to a total ET of 434 mm and 445 mm, respectively. The cumulative ETref for the measurement period was 460 mm.

4. Discussion

4.1. Accuracy of the Transpiration Measurements for Different Refill Volumes

The laboratory test showed a positive relative error of the water meter, which decreased exponentially with an increasing amount of water abstracted from the water supply device. The relative error of the water meter varies to different extents per abstraction moment and volume, with smaller variation for a higher abstraction volume. That means that individual refill moments are not suitable to determine the actual water consumption, especially when refill volumes are low. Rather, measurements done after several refill moments will be more reliable. Our data indicate that 5–10 abstractions are sufficient to obtain a mean close to the mean of a larger number of abstraction records. Ultimately, the dimensions of both container and water supply device, as well as the water use by the vegetation determine the time resolution of the measurements.
Since larger refill volumes yield lower relative errors, we decided to use refill volumes of at least 1500 mL, which comprise an average measurement error of 4.49%. Expressed in mm, this amount equals an accuracy of 0.02 mm for a transpiring surface of 3 m².
During the setup of the field experiment, the accuracy of the transpiration measurements was tested again since the field setup differed in one main aspect from the laboratory tests: several devices were refilled at once instead of just one. The test under field conditions, where nine connected devices were refilled simultaneously for an abstraction volume of 1435 mL yielded mean measurement errors ranging from −7.1% to 4.2%. These observations differed substantially from the laboratory test, as both over- and underestimations were measured. We can exclude that this is caused by an inherent difference in accuracy between the water meters, since the device tested in the laboratory (Figure 4 and Figure 5) and device no. 9 in Figure 6 was the same device. Rather, the reason for the different errors measured under field conditions is related to the rate at which the devices are filled. One device at a time is refilled at a rate of about 384 L/h. This value falls between the transitional and permanent flow rate of the meter used where an error of ±2% is expected [20]. The more devices are refilled at the same time, the lower the flow rate per device. Flow rates lower than the minimum flow rate of 31 L/h increase measurement errors. Furthermore, when the valve opens, the devices at the end of the row are at first slowly refilled (with no detection by the water meter) until all previous devices in line are fully filled, resulting in an underestimation of the measured refill volumes. The duration and, therefore, volume of this undetected slow refill depends on the volumes that are refilled in the previous devices in line. Under field conditions, this will differ per refill moment. Additionally, the valve was open for a maximum of five minutes at a time, possibly resulting in an additional error due to inflows shorter than what the meters were designed for [21]. Moreover, fluctuations in the water pressure in the feeding system depending on, e.g., water abstractions from other users influence the behavior of the water meter. Longer and larger flows, therefore, decrease the relative measurement error. To obtain consistent correctable errors we, therefore, recommend to refill the devices individually.
Errors measured with our device are low compared to other methods for transpiration measurements which are not based on weighing [7]. Additional errors possibly introduced by the user are limited: reading the water meter is simple and the device requires little maintenance for proper functioning. However, adjusting the number and timing of the refill moments requires careful observations of the systems under study.

4.2. Field Tests: Tree Water Use Measured by Two Methods

Whole-tree transpiration of two individuals of the same species (Sorbus aucuparia) and of a similar size was measured with two methods. In general, both trees showed the same pattern of water use over the course of the measurement period from May until November 2018. However, an 8% higher total (over the entire measurement period) transpiration was measured for the tree connected to the water supply device than the one on the weighing balance. The higher total transpiration can be explained by a larger total leaf area of that tree: its approximate maximum transpiring leaf area was 10.7% larger than that of the tree on the weighing balance. The shift in the transpiration peak and decline of the device-tree compared to the balance-tree could have been caused by earlier bud break and leaf development, as well as earlier initiation of leaf senescence by the tree connected to the device.
Comparing the water use data obtained from the water supply device and the weighing balance shows that both follow the pattern of the reference ET. This indicates that water used by the tree was largely determined by meteorological conditions and that soil water was not limiting. This means that the water supply device adequately replenished the consumed soil water.

4.3. Potential Applications

The water supply device can in principle be used for experiments where the position of water table needs to be controlled and where plant water consumption needs to be measured in an easy and reliable way. The system is most suitable for moist to wet soil conditions and measurements are most accurate for periods that contain multiple refill moments.
Here we used the water supply device for single trees. In principle it can be employed for single or multiple plants of all vegetation types. This makes the device suitable for, e.g., diversity experiments, such as measuring the water use of different species combinations [15], as well as agricultural studies, e.g., measuring effects of the water table on crop growth and yield.
Next to measuring transpiration under non-limiting water conditions, the device can also be used to let the container periodically fall dry by manipulating the refills with the valve to measure for example plant physiological responses to water shortages.
When setting up the device, a balance has to be found between the relative position of the water table and the (expected) rooting depth of the vegetation under study to avoid a too high or a too low soil water content in the rooting zone. To determine whether a soil is suitable and which distance between the water table and the soil surface should be chosen, we recommend insight into the water retention curve and the hydraulic conductivity of the soil and the expected transpiration fluxes. If necessary, the water table can also be adjusted when the device is already connected to the container by placing it higher than the plant container.
The advantages of the device are:
  • Made from easily accessible, durable and relatively inexpensive materials (approx. 80 € material per device);
  • The device does not require any electronics, thereby enabling an easy installation and set up;
  • Installation both in- and outdoors, as long as rain is excluded from the plant container and temperatures are above 0 °C;
  • Measurements of transpiration also in large and/or heavy containers where weighing becomes cumbersome or expensive;
  • Fast and easy data acquisition; and
  • The device can be modified to enable fully automated data acquisition by installing electronic devices such as level sensors or water meters which can be read remotely.

5. Conclusions

We present a new device for measuring whole-tree transpiration in containers for moist to wet soil moisture levels. Our field and laboratory tests have shown that the device adequately replenishes soil moisture in potted vegetation and that it measures transpiration reliably. For a device refilled individually, mean measurement errors are less than 5% for minimum refills of 1500 mL. These errors are low compared to errors of other measurement methods for transpiration. Reliable data in combination with a low-cost set-up and low maintenance, makes this device suitable especially for long-term measurements of transpiration in containers which are too large or heavy to be measured gravimetrically.

Author Contributions

Conceptualization: J.-P.M.W.; methodology: S.P., B.R.V. and J.-P.M.W.; validation: S.P., B.R.V., and J.-P.M.W.; formal analysis: S.P. and B.R.V.; investigation: S.P.; writing—original draft preparation: S.P.; writing—review and editing: S.P., B.R.V., and J.-P.M.W.; visualization: S.P.; supervision: B.R.V. and J.-P.M.W. All authors have read and agreed to the published version of the manuscript.

Funding

This research was funded by the European Union’s Horizon 2020 research and innovation program under grant agreement no. 641739.

Acknowledgments

We thank Harry van Wegen and Sidney Meijering for their invaluable contribution to the design and development of the water supply device. We also thank three anonymous reviewers for their constructive comments.

Conflicts of Interest

The authors declare no conflict of interest.

References

  1. Katul, G.G.; Oren, R.; Manzoni, S.; Higgins, C.; Parlange, M.B. Evapotranspiration: A process driving mass transport and energy exchange in the soil-plant-atmosphere-climate system. Rev. Geophys. 2012, 50, 1–25. [Google Scholar] [CrossRef] [Green Version]
  2. Kirschbaum, M.U.F. Direct and Indirect Climate Change Effects on Photosynthesis and Transpiration. Plant Boil. 2004, 6, 242–253. [Google Scholar] [CrossRef] [PubMed] [Green Version]
  3. Bartholomeus, R.P.; Stagge, J.H.; Tallaksen, L.M.; Witte, J.P.M. Sensitivity of potential evaporation estimates to 100 years of climate variability. Hydrol. Earth Syst. Sci. 2015, 19, 997–1014. [Google Scholar] [CrossRef] [Green Version]
  4. Van Dam, J.C.; Groenendijk, P.; Hendriks, R.F.; Kroes, J.G. Advances of Modeling Water Flow in Variably Saturated Soils with SWAP. Vadose Zone J. 2008, 7, 640–653. [Google Scholar] [CrossRef]
  5. De Wit, C. Transpiration and Crop Yields. Versl. Landbouwk. Onderz. 1958, 64.6, 1–88. [Google Scholar]
  6. Kool, D.; Agam, N.; Lazarovitch, N.; Heitman, J.; Sauer, T.; Ben-Gal, A. A review of approaches for evapotranspiration partitioning. Agric. For. Meteorol. 2014, 184, 56–70. [Google Scholar] [CrossRef]
  7. Allen, R.G.; Pereira, L.S.; Howell, T.A.; Jensen, M.E. Evapotranspiration information reporting: I. Factors governing measurement accuracy. Agric. Water Manag. 2011, 98, 899–920. [Google Scholar] [CrossRef] [Green Version]
  8. Voortman, B.R.; Bartholomeus, R.P.; van der Zee, S.E.A.T.M.; Bierkens, M.F.P.; Witte, J.P.M. Quantifying energy and water fluxes in dry dune ecosystems of The Netherlands. Hydrol. Earth Syst. Sci. 2015, 19, 3787–3805. [Google Scholar] [CrossRef] [Green Version]
  9. Jaleel, C.A.; Gopi, R.; Sankar, B.; Gomathinayagam, M.; Panneerselvam, R. Differential responses in water use efficiency in two varieties of Catharanthus roseus under drought stress. Comptes Rendus Boil. 2008, 331, 42–47. [Google Scholar] [CrossRef] [PubMed]
  10. Picon, C.; Guehl, J.; Aussenac, G. Growth dynamics, transpiration and water-use efficiency in Quercus robur plants submitted to elevated CO 2 and drought. Annales des Sciences Forestières 1996, 53, 431–446. [Google Scholar] [CrossRef] [Green Version]
  11. Vandegehuchte, M.W.; Steppe, K. Sap-flux density measurement methods: working principles and applicability. Funct. Plant Biol. 2013, 40, 213–223. [Google Scholar] [CrossRef]
  12. Ferrara, G.; Flore, J. Comparison Between Different Methods for Measuring Transpiration in Potted Apple Trees. Boil. Plant. 2003, 46, 41–47. [Google Scholar] [CrossRef]
  13. Sinclair, T.R.; Holbrook, N.M.; Zwieniecki, M.A. Daily transpiration rates of woody species on drying soil. Tree Physiol. 2005, 25, 1469–1472. [Google Scholar] [CrossRef] [PubMed] [Green Version]
  14. Vadez, V.; Krishnamurthy, L.; Hash, C.T.; Upadhyaya, H.D.; Borrell, A.K. Yield, transpiration efficiency, and water-use variations and their interrelationships in the sorghum reference collection. Crop. Pasture Sci. 2011, 62, 645–655. [Google Scholar] [CrossRef] [Green Version]
  15. Lübbe, T.; Schuldt, B.; Leuschner, C. Species identity and neighbor size surpass the impact of tree species diversity on productivity in experimental broad-leaved tree sapling assemblages under dry and moist conditions. Front. Plant Sci. 2015, 6, 1958. [Google Scholar] [CrossRef] [PubMed] [Green Version]
  16. McCulloh, K.A.; Winter, K.; Meinzer, F.C.; Garcia, M.; Aranda, J.; Lachenbruch, B. A comparison of daily water use estimates derived from constant-heat sap-flow probe values and gravimetric measurements in pot-grown saplings. Tree Physiol. 2007, 27, 1355–1360. [Google Scholar] [CrossRef] [PubMed] [Green Version]
  17. ASCE-EWRI. The ASCE Standardized Reference Evapotranspiration Equation; Environmental and Water Resources Institute of the American Society of Civil Engineers: Reston, VA, USA, 2005. [Google Scholar]
  18. R Core Team. R: A language and environment for statistical computing. R Foundation for Statistical Computing; R Core Team: Vienna, Austria, 2019. [Google Scholar]
  19. Python Software Foundation. Python Language Reference, version 3.7. n.d.; Python Software Foundation: Wilmington, DE, USA.
  20. WaterTech, Technical data sheet of the Alpha Sj-SDC water meter. Available online: https://wtmeters.com/docProdotti/P-0000039.pdf (accessed on 3 November 2019).
  21. Hovany, L. Error in water meter measuring due to shorter flow and consumption shorter than the time the meter was calibrated. In Water Supply System Analysis; Ostfeld, A., Ed.; InTech: Rijeka, Croatia, 2012; pp. 131–150. [Google Scholar]
Figure 1. Schematic overview of the water supply device. Plant container and water supply device are connected by a hose pipe.
Water 12 00355 g001
Figure 2. Water supply device. (A) View from above on the water meter (float valve positioned underneath). (B) View from the front. (C) Field installation.
Water 12 00355 g002
Figure 3. Plant container preparation. (A) Nozzle and gravel in the lower part of the container. After the picture was taken, more gravel was added until the nozzle was covered. (B) Gravel covering the soil surface. The ends of the drainage pipe as well as the ventilation holes near the rim of the container are visible. (C) Rain cape.
Water 12 00355 g003
Figure 4. Behavior of the error of the water meter for 165 mL (black circles) and 1495 mL (blue circles) abstraction volumes over the course of 40 abstractions. The dashed line indicates the mean error of the 40 measurements (20.1% for 165 mL, 4.49% for 1495 mL).
Water 12 00355 g004
Figure 5. Relationship between the mean error of the water meter per refill event (with standard deviation) and the abstracted volume from the water supply device. N = 40 for each abstraction volume.
Water 12 00355 g005
Figure 6. Mean error of each water meter with standard deviation for 9 connected devices which were refilled simultaneously. N = 10 for each device.
Water 12 00355 g006
Figure 7. Weekly transpiration of the tree connected to the water supply device (open circles) and the tree on a weighing balance (closed circles). The standardized reference evapotranspiration ETref is plotted for comparison (triangles).
Water 12 00355 g007
Table 1. Materials used for constructing the water supply device and preparing the plant container.
ItemSize/TypeSupplier
Water Supply Device
PVC waste pipeRecypipe® Diameter: 200 mm Thickness: 4 mm
Length: 600 mm
Wildkamp B.V., Soest, The Netherlands
PVC cap200 mmPower Plastics B.V., Rijnsburg, The Netherlands
Toilet float valveEURO-Universal-
filling valve
Wildkamp B.V., Soest, The Netherlands
Water meterType Alfa-SDC DN15
Accuracy class 2 1/2”
Wildkamp B.V., Soest, The Netherlands
Hose connecting meter and floatNeoperl® Connecting hoseTechnische Unie B.V., Nieuwegein, The Netherlands
(Manual) ball valve, PVC-U16 mmPower Plastics B.V., Rijnsburg, The Netherlands
Plant container
Flexible PVC hoseAquastar® 25 mmPower Plastics B.V., Rijnsburg, The Netherlands
Filter nozzletype C2 36 × 0.3
G 3/4”
Merrem & la Porte B.V.,
Zaltbommel, The Netherlands
Rain capeCustom made to fit container and treeZeil-Doek B.V., Montfoort, The Netherlands
Table 2. Composition of the dry soil mixture.
ComponentProportion (vol%)
Peat, ground40
Peat, block, size: 1–2 cm30
Coconut coir dust20
Bark10
Table 3. Size characteristics of two individuals of Sorbus aucuparia. DBH = stem diameter at breast height. See Section 2.4.2 for the calculation of the leaf area.
TreeDBH (cm)Height (m)Approximate Maximum Transpiring Leaf Area (m²)
Water supply device6.86.174.88
Weighing balance6.86.304.41

