Article

Natural vs. Anthropic Influence on the Multidecadal Shoreline Changes of Mediterranean Urban Beaches: Lessons from the Gulf of Cagliari (Sardinia)

1
Coastal and Marine Geomorphology Group (CMGG), Dipartimento di Scienze Chimiche e Geologiche, Università degli Studi di Cagliari, Cittadella Universitaria, 09042 Monserrato, Italy
2
College of Life and Environmental Sciences, University of Exeter, Exeter EX4 4RJ, UK
3
Dipartimento di Scienze della Terra, Università di Pisa, Via S. Maria, 53, 56126 Pisa, Italy
*
Author to whom correspondence should be addressed.
Water 2020, 12(12), 3578; https://doi.org/10.3390/w12123578
Submission received: 24 November 2020 / Revised: 15 December 2020 / Accepted: 16 December 2020 / Published: 20 December 2020

Abstract

:
Urban Mediterranean beaches are often characterized by a fragile and unstable equilibrium that can be easily altered by ongoing climate change and by the increase in human pressure. This may pose serious threats to the survival of beach systems that cannot accommodate these modifications. In this paper, the spatio-temporal shift of the shoreline was investigated along two urban beaches in the Gulf of Cagliari (Poetto and Giorgino; southern Sardinia, western Mediterranean Sea) across a time frame of 62 years (1954–2016). The Digital Shoreline Analysis System (DSAS) ArcGIS™ extension was used to extract different statistical parameters which allowed us to quantify the erosion and accretion rates. These data were further examined in relation to a number of anthropic and natural forcings in order to disentangle the factors controlling shoreline evolution. Eight sectors with interchanging net erosive and accretion trends were identified along the Poetto and Giorgino beaches. In six decades, some sectors of the two study sites appeared to have undergone great shoreline modification as a result of the intense anthropogenic activities impacting these coastal areas. The westernmost portions of both beaches were found to be the most vulnerable to erosion processes; such conditions were likely controlled by the interplaying of local hydrodynamics and by the intense coastal development which affected these sectors. The highest retreat rates (mean end point rate (EPR) = −0.51/year) were recorded in the western limit of Giorgino beach. Along the western limit of Poetto beach, EPR erosion rates (mean EPR = −2.92/year) considerably increased in the years after the artificial beach nourishment carried out in 2002, suggesting that the majority of the nourished material was lost offshore or partly redistributed along the beach. Coastal structures, urban development, river catchment modification, industrial and port activities, beach cleaning and touristic and recreational activities have been identified as the ongoing causes of coastal alteration. If these factors remain constant, under projected climate change scenarios, these beaches are at risk of further increased flooding and erosion. In this context, the application of DSAS appeared as an essential tool, supporting a monitoring system able to provide understanding and, potentially, predictions of the short- to long-term evolution of these beach systems.

1. Introduction

Urban beaches are dynamic environments characterized by the complex interactions of bio-physical, human and socio-economic forces [1,2]. These coastal areas provide key economic functions and ecological services. They also represent protection from storms and flooding and act as barriers to physical forcing [3]. These vulnerable ecosystems need to be adequately managed and protected and it is therefore essential to understand erosion hazards and causes [4,5]. Such principles of management and protection are also embedded in the United Nations Sustainable Development Goals (SDGs) 2030 [6]. In particular, for coastal–marine ecosystems, SDG14 aims at the conservation and sustainable use of the oceans, seas and marine resources; SDG15 calls for the conservation, restoration and sustainable use of terrestrial ecosystems and their services, including coastal dune systems, and also promotes the integration of ecosystem and biodiversity values into national and local planning; SDG13 promotes urgent action to combat climate change and its impacts, by strengthening resilience and adaptive capacity to climate-related disasters (erosion, flooding, storm surges and sea level rise).
Nowadays, most sandy beaches worldwide show a tendency of progressive shoreline retreats or advances for years or even decades [7]. Rivers, coastal currents and waves move sediments inside, outside and within the nearshore zones, causing loss or gain of material from or to the system [8]. Changes resulting in a negative sediment budget can be caused by natural factors, however, in the majority of cases, these are triggered or affected by anthropogenic stressors, such as: (1) the construction of dams on rivers and changes in land use; (2) the building of man-made coastal structures interfering with sediment transport; (3) harbor siltation and maintenance dredging; and 4) recreational use of littoral zones and beach cleaning operations [9,10,11]. Morphological evolution tends to accelerate under extreme events, such as severe storms that drive intense erosion and lead to irreversible changes [12]. The magnitude of these changes depends on a variety of local hydrodynamic factors (e.g., number and intensity of storms, wave and tidal conditions) and on other controlling factors, such as the beach morphology type [13,14], the mean sediment size and the geological setting [11,15,16]. In natural pristine beaches, the impact of storms is less severe than in highly urbanized beaches because they are less impacted by human-induced degradation and, therefore, present a greater recovery ability and resilience [17,18,19]. In urban beaches, morphological alterations and modifications are exacerbated by anthropogenic activities that intensify and accelerate the deterioration of the coastal environment [20]. In addition, relative sea level rise due to climate changes further aggravates these impacts, contributing to more frequent flooding and increased coastal erosion [21,22].
In the nearshore zone, a wide range of ecological roles are played by seagrasses [23,24]. In the Mediterranean, the endemic Posidonia oceanica meadows play a fundamental role in beach stability through the supplying of biogenic sediments [25,26,27], in protecting the coastline from erosion by acting as a buffer to wave energy and in increasing sediment retention and reducing sediment resuspension [28,29,30,31]. The presence of seagrass necromass (leaves and rhizomes mixed with sand, also called banquette or beach-cast litter) contributes to the protection of the shore from the erosion exerted by swell and waves during winter storms [32,33,34] and can also influence wave run-up by shifting these processes offshore and modifying the swash energy [35,36]. The removal of these deposits through mechanical cleaning can have a negative impact on shore stability, as it causes a considerable loss of sediments from the beach, ultimately resulting in changes in beach morphology, flattening of the beach profile and obliteration of sedimentary features (e.g., sediment berms, cusps, embayments, beach-face steps) [18,37,38]. Thereby, the removal of beach-cast litter deposits, extensively practiced as part of beach management [34,39] in Mediterranean coastal areas, might make these systems more vulnerable to erosional processes [40].
As a consequence of beach erosion, the risk of rising water levels and related flooding hazard arises [41] along with the negative socio-economic implications derived from the threats posed to coastal infrastructures and residential areas. Because of the future climate change scenarios, and the expected rise in rates of urbanization, costal erosion is also expected to increase [42]. Quantitative knowledge of long-term shoreline changes can provide important information on trends and rates of coastal evolution and give the coastal planner an essential tool for designing adequate future coastal management and adaptation strategies. Shoreline position and geometry are generally extracted from remote sensing and aerial images, while rates of shoreline changes are calculated and described through different statistical methods [43]. With such premises, this study aims at providing an improved understanding of the past and present patterns of shoreline changes to support best management practices in a context of future of climate change scenarios. The specific objectives were to: (i) quantify net movement and rates of retreat and accretion along the beach systems of the Gulf of Cagliari that occurred during the last 62 years, (ii) assess the main anthropogenic and natural factors driving retreat/accretion patterns, (iii) evaluate the role played by P. oceanica meadows in coastal sediment dynamics.

2. Study Area

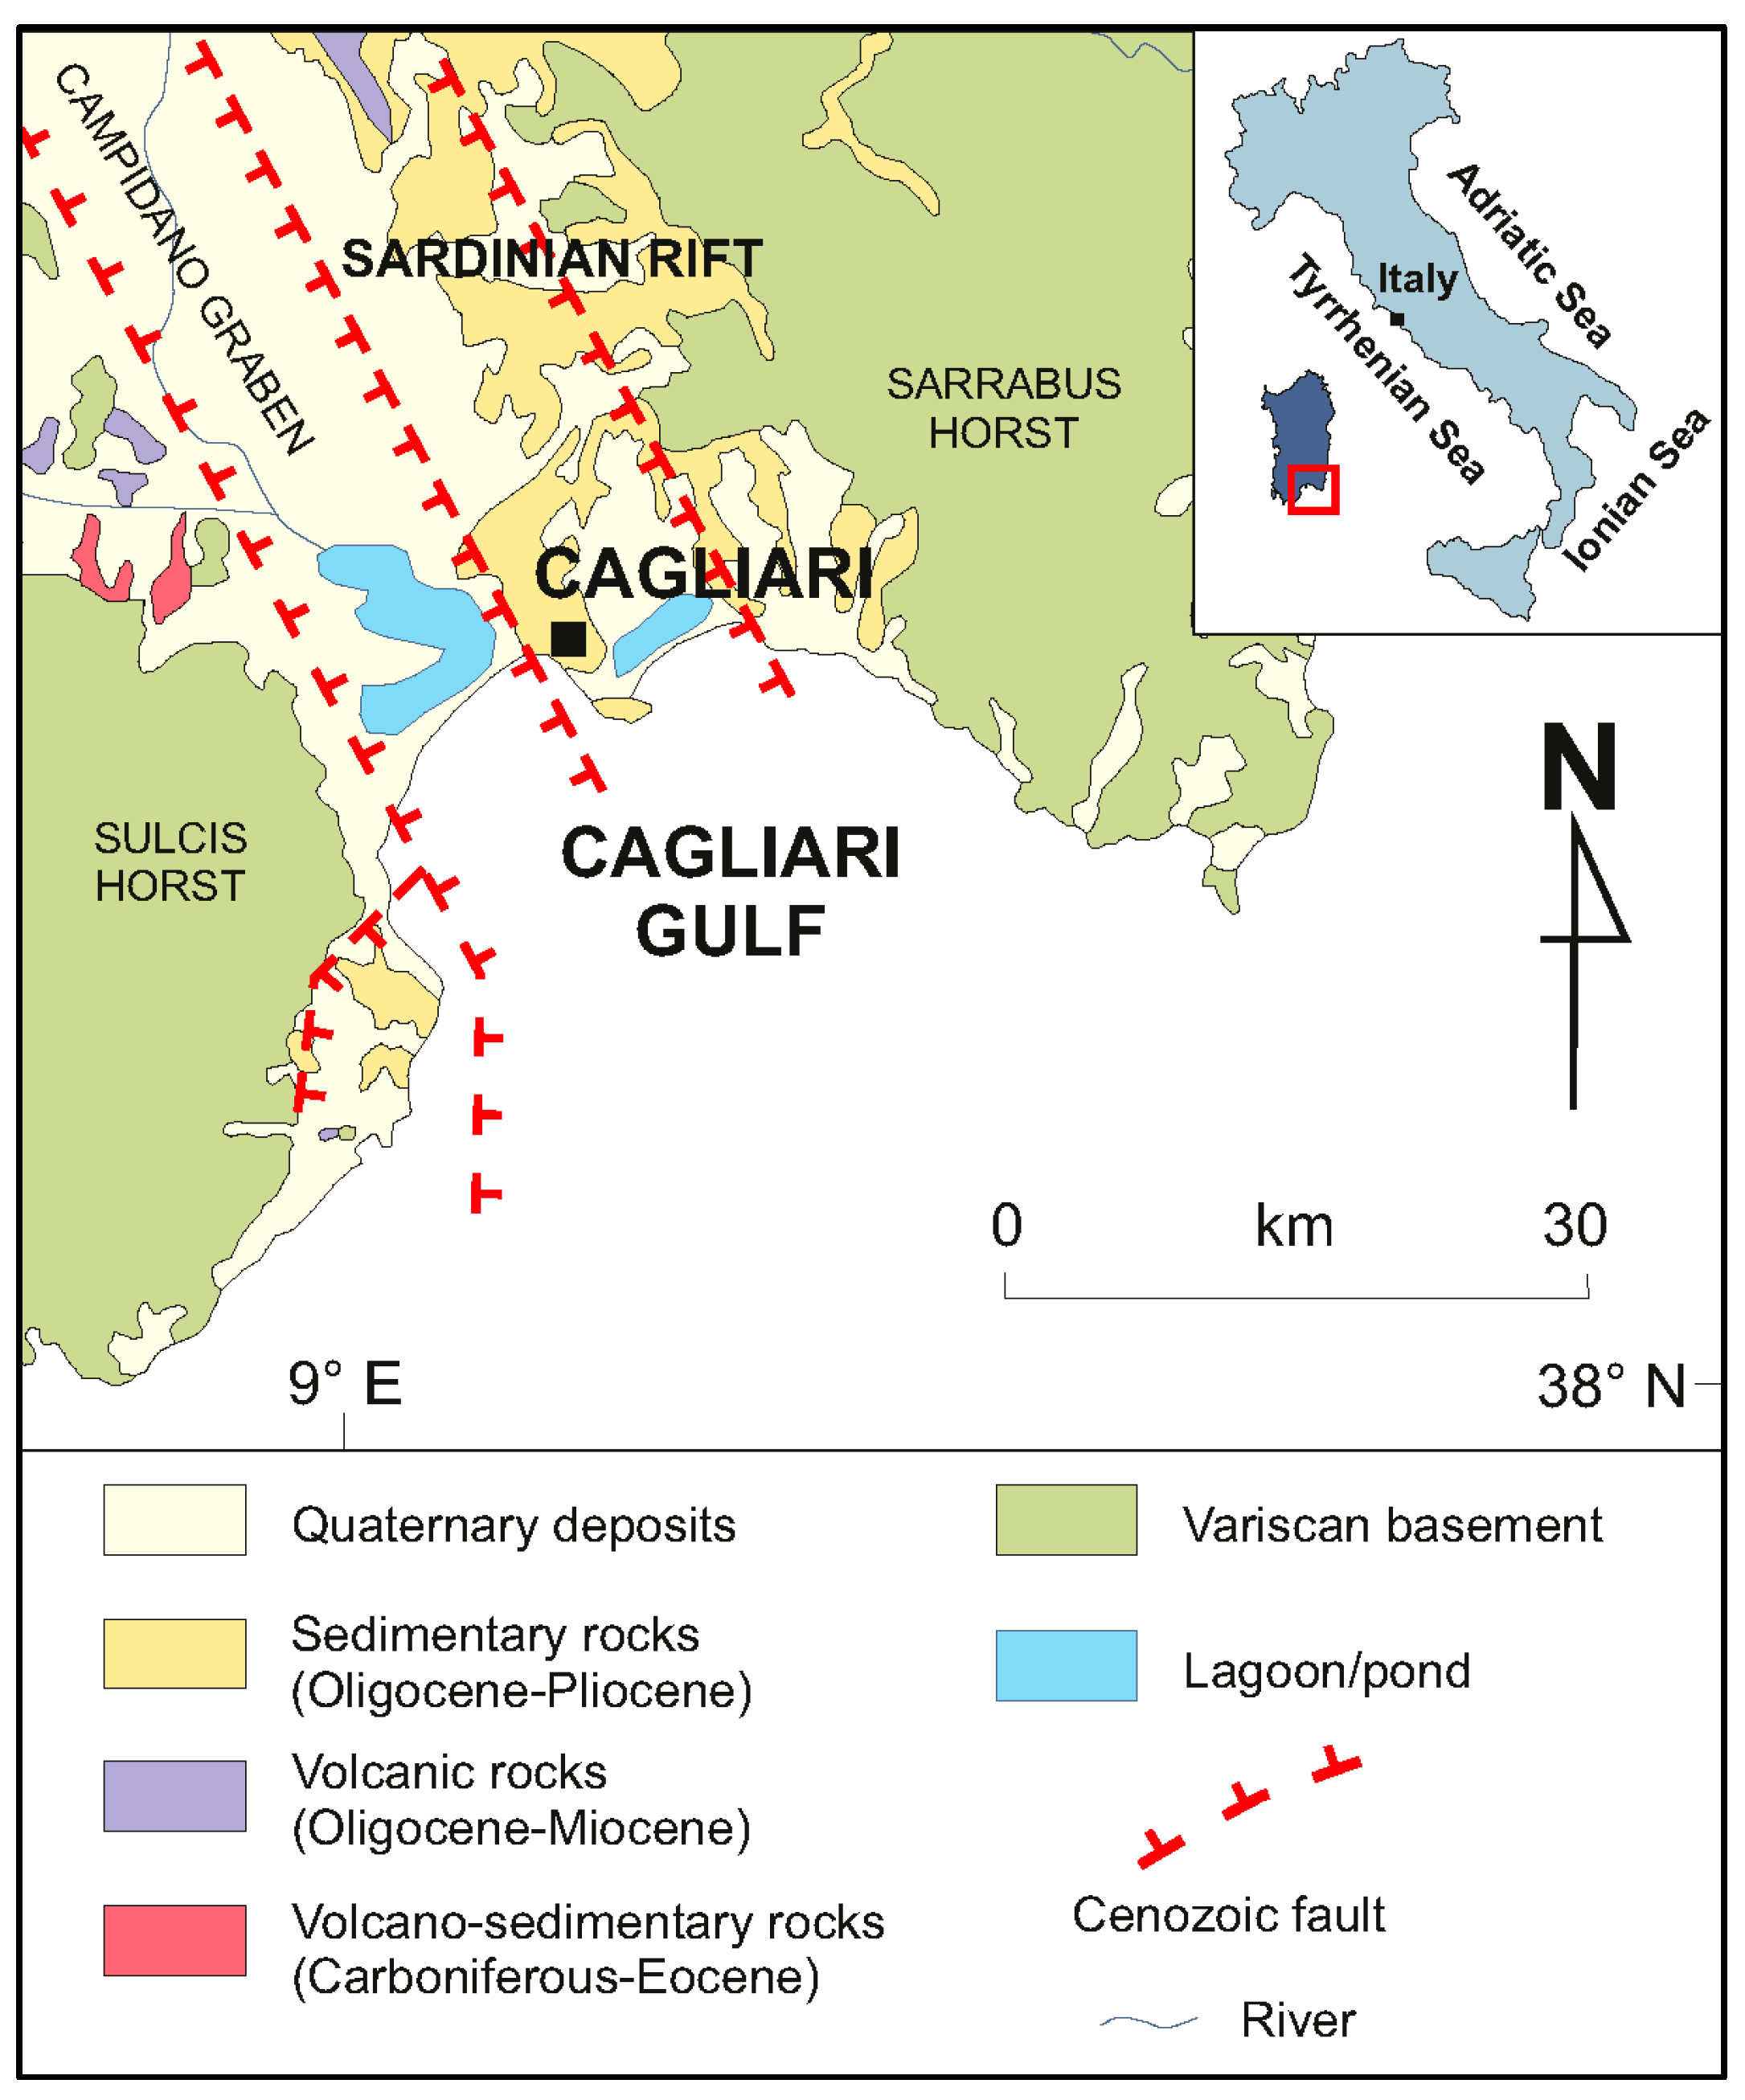
2.1. Geological Settings

The Poetto and Giorgino beaches are two microtidal, wave-dominated beach systems situated in the Gulf of Cagliari (southern Sardinia, western Mediterranean; Figure 1), which lies at the southern edges of the Sardinian Oligo-Miocene Rift System and includes the Campidano Graben and the two horsts of Sulcis and Sarrabus [44,45] (Figure 1). The continental shelf in the Cagliari basin is fed by fluvial terrigenous material derived from the alteration of the Palaeozoic metamorphic basement and from Tertiary sedimentary and volcanic rocks. The deeper portions of the continental shelf show a bioclastic component (30–70%; 2000 ÷ 500 µm) which appears higher along the mid-shelf Posidonia bank and its foreslope [46]. Over the continental shelf, relict submerged shorelines and coastal depositional systems, such as sandstone–conglomerate beach rocks, were left behind during the passage of the Versilian transgression [9,47]. Additionally, the inner sector of the Cagliari basin is characterized by the presence of two incisions (on the east and west of Cape S. Elia), which were recognized as possible paleo-valleys formed during the Würmian low stand [48,49].
The beach systems of Giorgino and Poetto formed approximately seven to five thousand years ago, when post glacial sea level rise significantly decelerated [34], allowing the formations of the barrier system that evolved into the current sandy coastline with its lagoon systems behind [50]. The two Pleistocene–Holocene beaches are presently separated by Cape S. Elia (Figure 2), a calcareous promontory of Miocene age [38]. The western coastal plain hosts the Santa Gilla lagoonal system, while the eastern plain is occupied by the Molentargius Pond system. Presently, the main siliciclastic sediment inputs come from the Santa Gilla lagoon, which prevalently feeds the western part of the Gulf, whereas the eastern parts are mainly supplied by the erosion of the carbonatic and siliciclastic rocks of the Cape S. Elia promontory and by the authigenic bioclastic sediment produced by the Posidonia oceanica meadows [38].
According to previous studies [3,9,51], the surface sediments of the Poetto beach are mainly composed of poorly sorted medium to coarse sand. The backshore and the beachface are prevalently made up of mixed siliciclastic–bioclastic sand (75%) with 20.5% bioclasts. The backshore and shoreface in the western side of the beach are characterized by a relatively higher fraction of bioclastic material derived from the introduction of borrowed sediment. The Giorgino beach is predominantly made of moderately to poorly sorted fine siliciclastic sand (93.6%) with 10.2% bioclasts. Detailed cartographic information about the spatial distribution of sediments in the Poetto and Giorgino beach systems is presented in De Muro et al. [3,9].
Before the development of the city of Cagliari, which started in the beginning of twentieth century, the Poetto and Giorgino beaches were connected through wetlands which allowed a continuous aeolian, cross- and along-shore sediment transport. This connection was interrupted around the 1930s, after land reclamation driven by urban development wiped out the entire wetland area located behind the promontory of Cape S. Elia [52]. Furthermore, longshore transports were also altered by the construction of the port of Cagliari in the 1950s [9,38]. Finally, the building of roads and residences on the foredune of the Poetto and Giorgino beaches interrupted the cross-shore transport of sediments between wetlands and nearshore zones.

2.2. Anthropic Pressures and Impacts

The Poetto beach develops in front of the metropolitan city of Cagliari. The relatively natural state of its 8 km length of sandy shore, when compared to the neighboring urban beach of Giorgino, makes it one of the most frequented beaches of the entire island of Sardinia [3]. The Poetto beach has been long affected by anthropogenic pressures such as urbanization, coastal structures, intensive recreational and touristic activities. In particular, during the last century, the alongshore building of a yacht marina (Figure 3) and of other recreational infrastructure (such as a piers and several kiosks) caused significant modification of longshore and aeolian transports [9,38]. Furthermore, the roads and extra parking spaces constructed in recent years, in order to accommodate the vast numbers of tourists visiting the beach each year, caused the complete erosion and fragmentation of the beach foredune habitats [3,38,53,54].
To counteract erosion, prevent flooding and promote tourism, an artificial beach nourishment (about 300,000 m3 of sand) was carried out in 2002 [55]. Besides having had little efficiency in mitigating erosion, as the majority of the replenished material was rapidly eroded during the years following beach nourishment, the coarser and bioclastic sediments used for replenishment considerably modified the textural, compositional and morphological features of the backshore and shoreface [3,56].
Current practices of seasonal beach cleaning operations, performed with heavy mechanical means, presently cause further negative impacts on the backshore by compacting the sediment and depriving the beach of its natural protection (represented by seagrass berms) against wave energy and wave run-up; furthermore, extensive boating activities have caused damage to the meadows of P. oceanica [3,54] over the shelf areas.
Giorgino is a 11 km long embayed beach found on the western side of the Gulf of Cagliari. It is a complex system characterized by the inland presence of large wetlands and some minor fluvial systems (Figure 3). Giorgino is a heavily urbanized beach, and residential developments and the presence of ports and industrial activities have greatly altered the coastal morphology and dynamics. The growth of the residential urban area of Frutti D’Oro, in the south-western part of the bay, is thought to have caused modification of the local fluvial catchments (Rio San Gerolamo and Rio Santa Lucia; Figure 3) with a consequential reduction of terrigenous sediment inputs to the beach [9]. Moreover, the Giorgino coastline hosts the Port of Cagliari, built in the 1930s, and the Canal Harbor (Porto Canale; Figure 3) established in the 1970s to offer berths for cargos and ships; port construction and associated activities have greatly modified the shoreline geometry and longshore sediment transports [3,38,57]. Additionally, the largest oil refinery in Europe and other minor industries are found at the western limits of the Giorgino coastline.
Other man-made features at this site include a dry dock (Pontile Syndial, ex Rumianca), several groynes (Figure 3) constructed in 2014 to counteract beach erosion and a road (SS195) which runs parallel to almost the entire length of the shoreline and which limits the landward development of the beach. In addition, the seabed in front of the Giorgino beach was dredged in the 1930s to mine the sediments that were used for the reclamation of the wetland area located behind the promontory of Cape S. Elia, in the south-east of the city of Cagliari [52]. In general, the building of coastal infrastructures, the wharf, dredging and navigation activities (loading, unloading and anchorage), roads and discharges of municipal untreated sewage and industrial wastes are considered to be the main causes of pollution, turbidity, coastal erosion, modification of drift currents and fragmentation of seagrass meadows in the coastal area of Giorgino [9]. With regard to seagrass communities, the mixed P. oceanica, Caulerpa prolifera and Cymodocea nodosa meadows indeed appear discontinuous, with numerous erosive intermates at depths between −4 and −20 m [9].

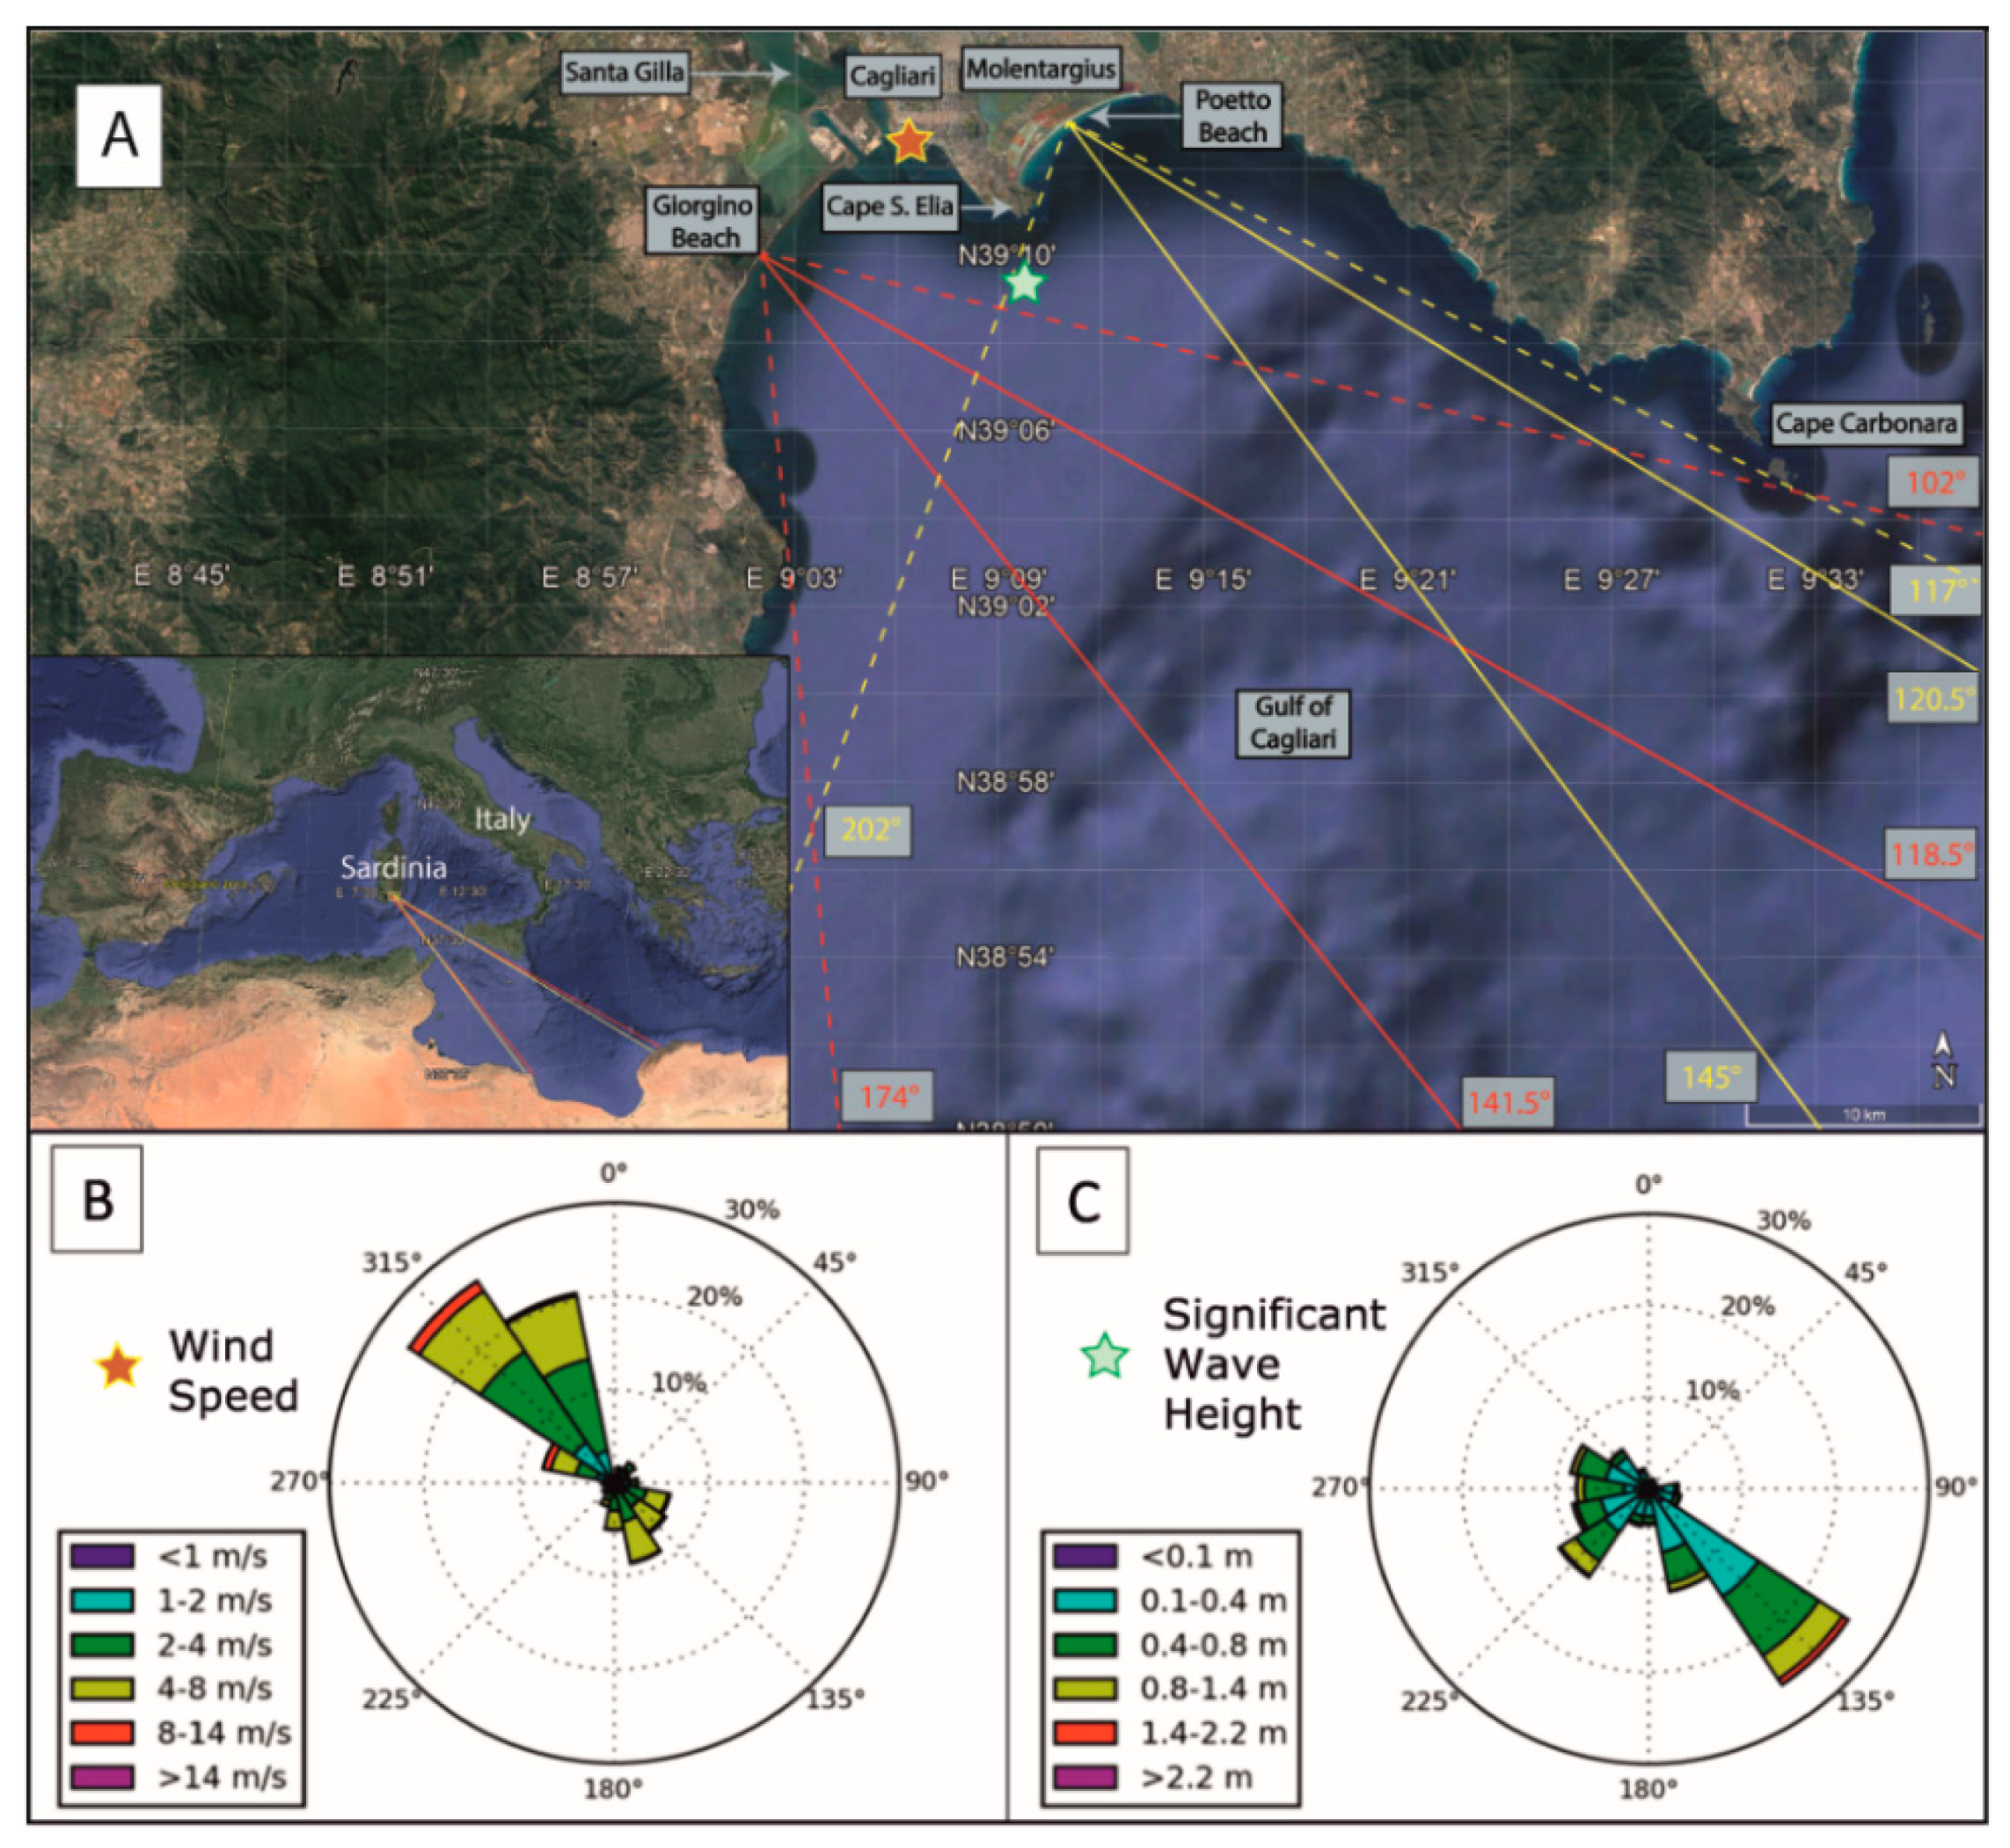
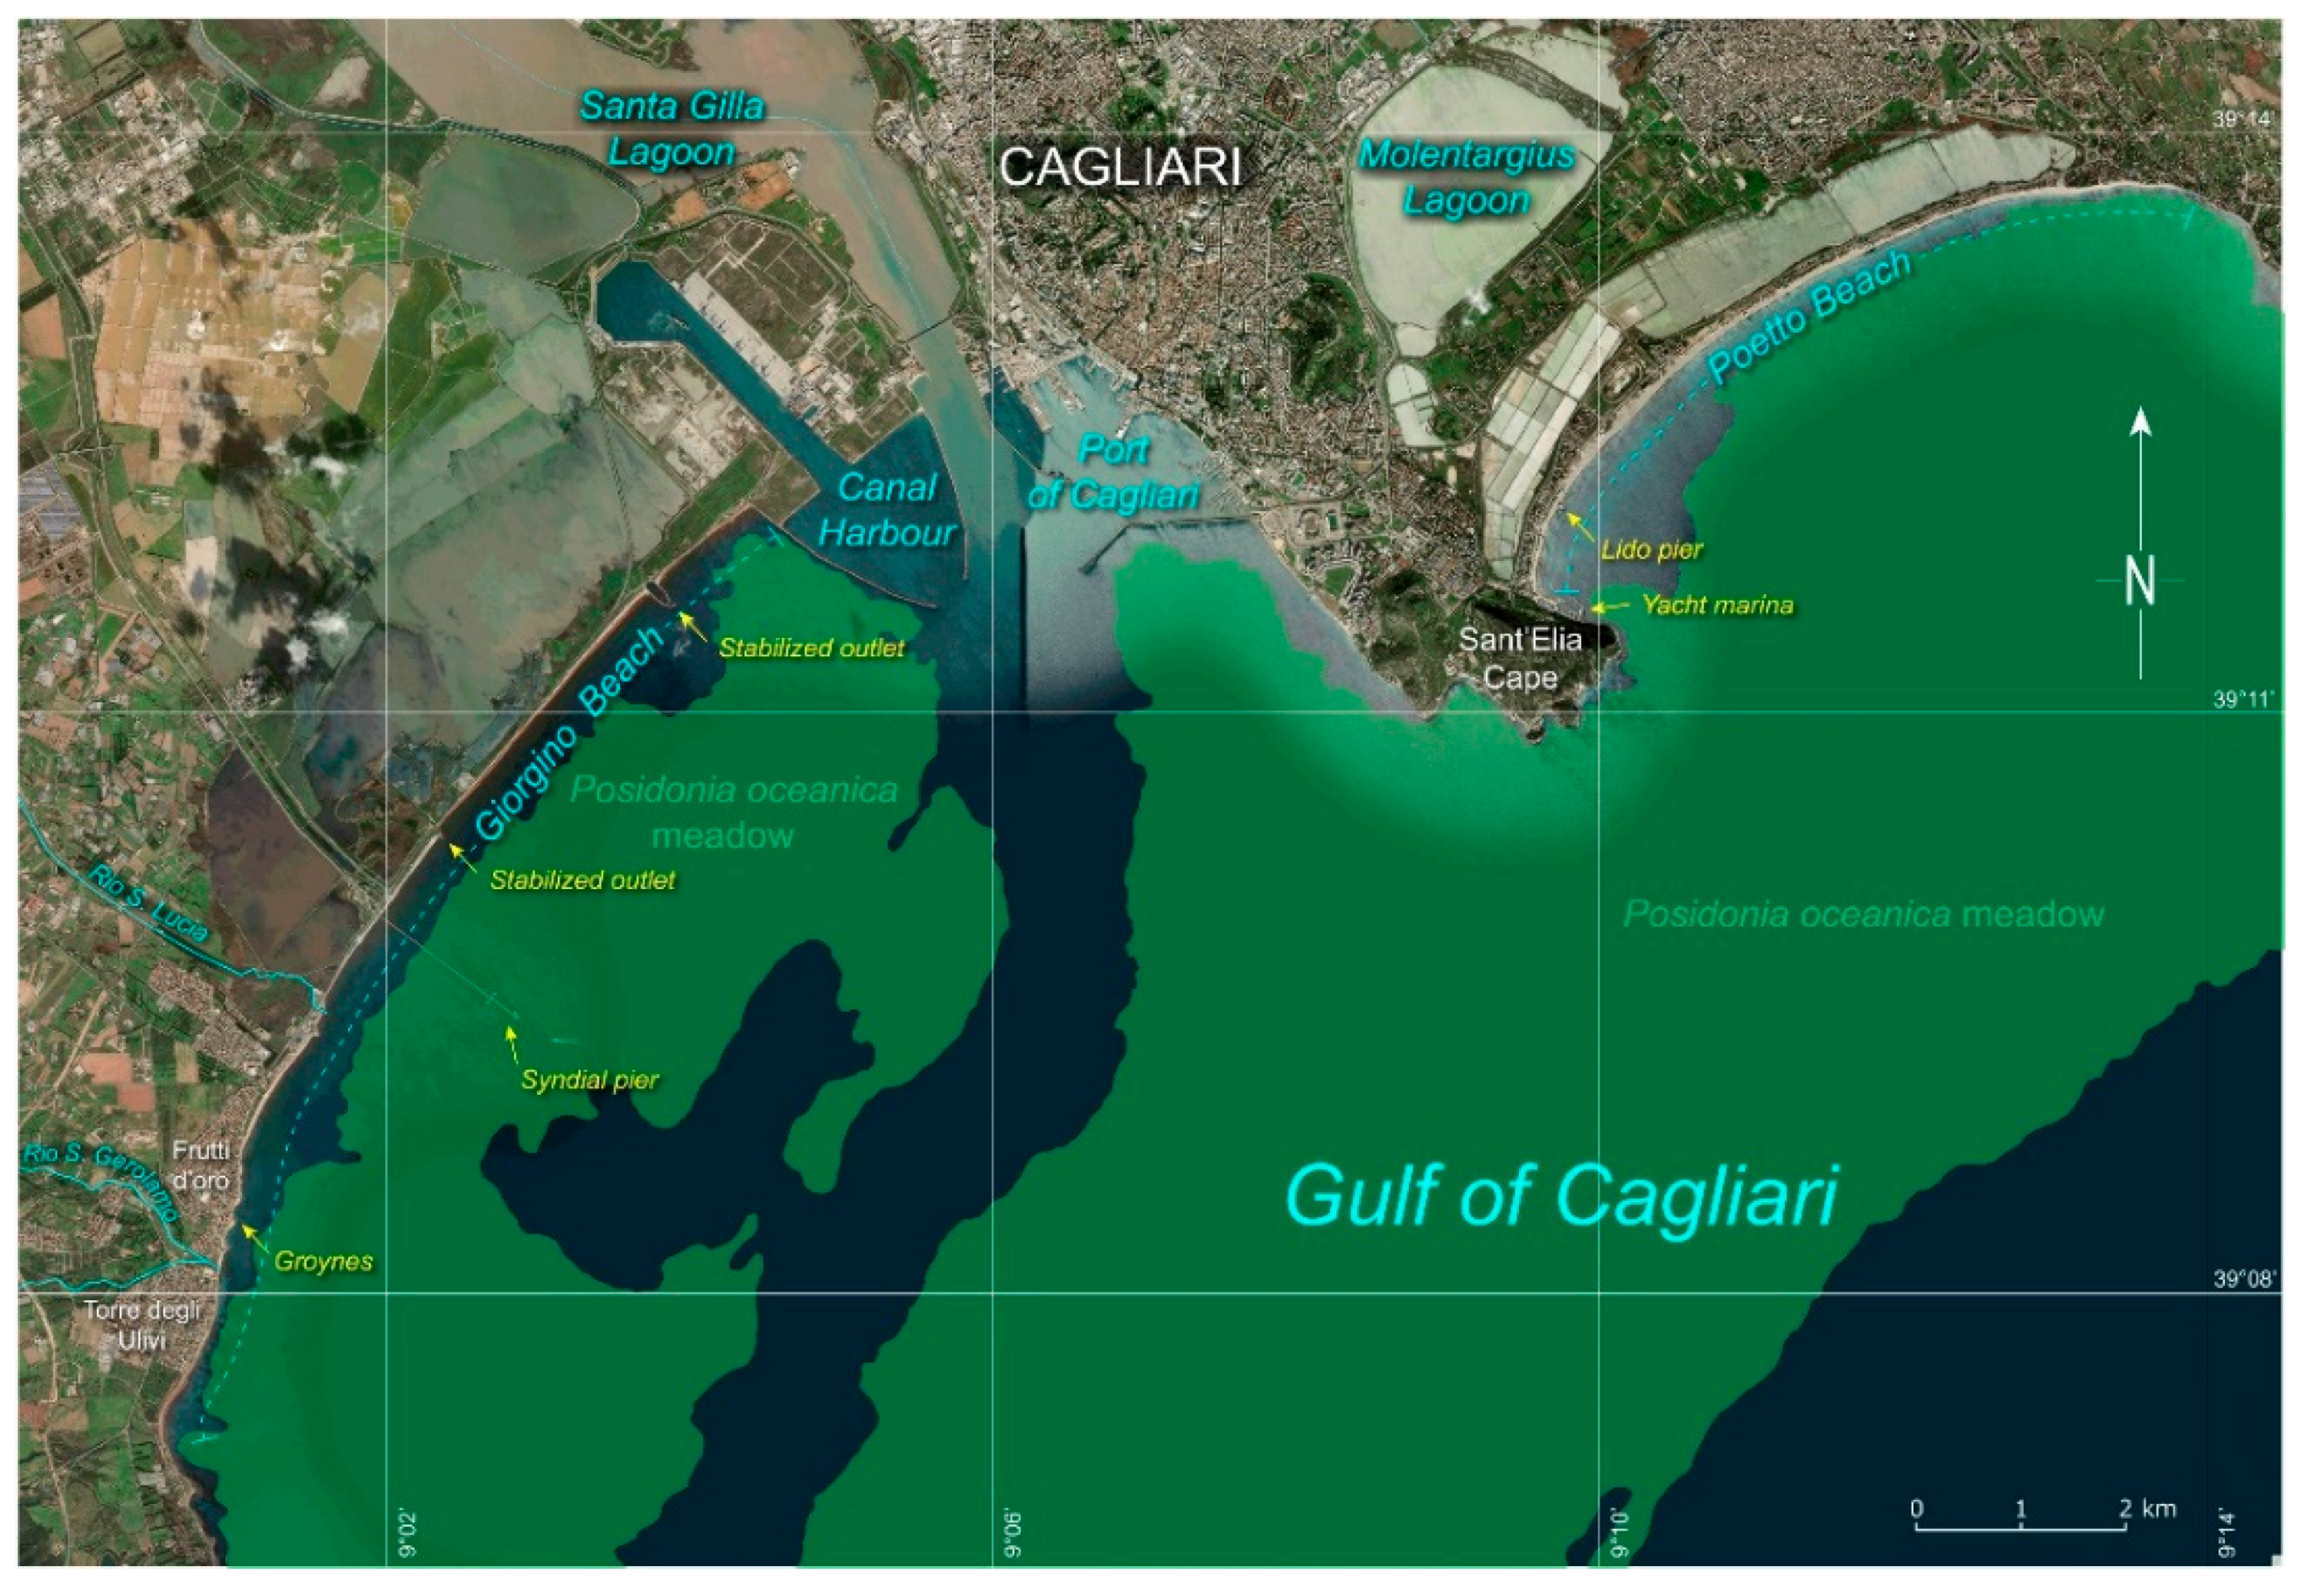
2.3. Geographical Settings, Wave Climate and Hydrodynamics

The dominant geographical fetch at Poetto beach is between 120° and 145°, while the possible directions for approaching storms range from 117° to 202°. The main geographical fetch at Giorgino beach is between 118.5° and 141.5°, with directions of approaching storms ranging from 102° to 174° (Figure 2) [3,9].
Geomorphological maps of the Poetto and Giorgino beaches [3,9] reported and described in detail the morphological profiles of the backshore and shoreface of these two coastal areas. The bathymetric profiles of the Poetto beach reveal a complex system of submerged sand bars with alternating troughs located about 250–300 m from the shoreline. Further offshore, the sea-bottom slopes down to −10 m (~1 km distance from the shoreline) [3]. At Giorgino beach, the shoreface gently slopes down to the −8 m isobath in the central sector and to the −4 m isobath in the easternmost and westernmost sides, and shows a system of submerged bars 50-250 m from the shoreline [9].
The average tidal range is less than 20 cm, but this can reach a maximum of about 40 cm at spring tides [54]. The study area is naturally protected by Cape Carbonara to the east and by Cape Spartivento to the west [9,35,54], consequently, the winds that give rise to the main wave events come from southern directions: SE (40% of the occurrence), SW (20%) and SSE (10%) [9]. This results in a prevailing west to east net longshore transport; this is interrupted alongshore by the presence of promontories and rocky outcrops, and offshore by the presence of Posidonia meadows.
Numerical simulations conducted with Delft3D software [3,9] evaluated the distribution of coastal currents induced by major winter storms both at the Poetto and Giorgino beaches (Figure 4). These analyses showed that during the SE events, opposite longshore currents develop along the Poetto beach. The convergence of these currents produces a main rip current that flows offshore for about 400 m and is located about 1 km eastward from the western limit of the beach [3]. At Giorgino, a northwards longshore current flows along the entire coastline, while a rip current develops in the NE sector of the beach, close to the pier of the canal harbor. These analyses have also shown that SW winds produce several active cells along the Poetto shoreface that generate longshore currents running from SW to NE and rip currents flowing offshore from the central and eastern sectors [3]. At the same time, along the Giorgino beach, SW winds produce a weak NE-oriented longshore current that feeds a weak rip current flowing along the embankments of the lagoon mouth located in the eastern part of the beach [9].
Moreover, images captured by a video camera monitoring system showed that the whole study area is subject to important wave run-up and flooding phenomena [58]. In fact, under severe storms, waves are likely to overwash the beach berm and flood the entire emerged beach up to the dune system. A recent technical report [58], produced as part of the NEPTUNE 2 project, presented this evidence; through the analysis of data from the video camera system combined with numerical wave modeling, it was assessed that winter storms, with an incident significant wave height above 2 m, are likely to cause severe beach flooding at the Poetto beach.

3. Materials and Methods

In this study, the statistical measurements of historical shoreline changes were carried out using the ArcGIS™ extension Digital Shoreline Analysis System (DSAS) [59], which was proved to be an easy-to-use and reliable tool for quantifying shoreline rates of erosion/accretion by several studies [10,60,61,62,63]. Spatio-temporal displacements of the shoreline position were evaluated and quantified along the two urban beaches of Poetto and Giorgino across a time frame of over 60 years.
The two beaches have been extensively studied through the Beach Environment, management And Coastal Hazard (BEACH), Natural Erosion Prevision Through Use of Numerical Environment (NEPTUNE) and NEPTUNE 2 projects [3,9,38,54,64], carried out since 2013 by the Coastal and Marine Geomorphology Group (CMGG) of the University of Cagliari which, during recent years, has been actively engaged in the implementation of the Agenda 2030 goals for sustainable development.

3.1. Dataset

Orthorectified photographs were analyzed in order to investigate the shoreline evolution along the Gulf of Cagliari between 1954 and 2016 (Table 1). Images were obtained in GeoTIFF format from the national open access website Sardegna Geoportale (www.sardegnageoportale.it) and used to manually digitalize the historical shoreline positions. In order to obtain reliable shoreline position estimates, all orthophotos were corrected for positional errors and discrepancies using the most recent photo mosaic as a reference. The georeferencing was performed in ArcMap using a polynomial transformation and triangulated irregular network (TIN) interpolation technique.
The two studied beach systems were sampled separately and divided into four sub-sectors each in order to ease interpretation and discussion of the results (Figure 5, Figure 6 and Figure 7). The length of each sub-sector was determined by looking at the general trends of shoreline change rates following DSAS computations. For the Giorgino beach system, statistical rates were calculated considering the total dataset time-frame (1954−2016); whereas, for the Poetto beach, in order to differentiate between long-term shoreline changes occurring prior to and after the artificial sand nourishment carried out in 2002 in the western sectors of the beach, images were grouped into two time-series datasets: the first set included the aerial photographs acquired between 1954 and 1998 and the second dataset comprised the images acquired post beach nourishment, between 2003 and 2016.
The position of the shoreline was determined at the instantaneous water line [65,66]; this shoreline indicator was chosen because the quality and temporal heterogeneity of some of the earliest photo mosaics would not allow the recognition of other types of shoreline proxies conventionally considered to be more stable [67,68].

3.2. Uncertainty Estimation

Measurements of shoreline positions are subject to positional uncertainties associated with natural influences over the shoreline position (wind, waves and tides) and sampling uncertainties (digitization, image positioning system errors) [59] that need to be accounted for in order to compute statistically reliable results. For each shoreline, the total error (σT) was given by the modified formula (1) presented in Virdis et al. [63]:
σ T   =   σ d 2   + σ p 2 + σ r 2 + σ w r   2 + σ t d 2  
where σd represents the digitalization error and it is given by the standard deviation of the differences between repeated shoreline digitalization measurements; σp is the pixel error or simply the measure of the image pixel size; σr is the orthorectification error obtained by computing the root mean square error (RMSE) between points on the image and the relative ground control points (GCPs) and finally, the tide error σtd and the run-up error σwr, which represent shoreline positioning errors due to tide variations and wave run-up, were respectively calculated using the equations presented in Allan et al. [69] and Hunt [70]. The total errors computed for each aerial image are listed in Table 1.

3.3. DSAS Computations

Rates of erosion/accretion were computed using the DSAS toolbox, an extension within the Environmental System Research Institute (ESRI) ArcGIS© software. DSAS works by calculating shoreline rates of change from measured differences between shoreline positions through time and along transects aligned orthogonally to a user-created baseline [59]. Baselines were created by buffering an area around all shoreline positions and then converting the resulting polygon into a polyline. Two baselines were created for the Poetto beach considering the pre-nourishment and post-nourishment datasets.
The assessment of historical shoreline changes is done by examining different statistical parameters such as the end point rate (EPR), the linear regression rate (LRR), the shoreline change envelope (SCE) and the net shoreline movement (NSM). The first two parameters represent the speed of accretion and erosion in meters per year. The EPR is obtained by dividing the distance (m) between two shorelines by the time spanning between the earliest and the latest shoreline [59,71], the LRR is determined by fitting a least squares regression line to all shoreline points and, therefore, represents a modeled forecast of the shoreline rates of change. The SCE and NSM are expressed in meters, as they are a measure of a distance and not a rate; the first parameter represents the greatest distance among all the shorelines that intersect a given transect and it returns only positive values; the latter parameter is the net distance between the latest and oldest measured shoreline positions and can show positive (accretion) or negative values (erosion) [59].

4. Results

In order to differentiate shoreline evolution under natural sediment supply conditions from artificially nourished settings, aerial photos acquired from 1954 to 1998 and from 2003 to 2016, over the Poetto beach, were analyzed separately; whereas, for Giorgino beach, analyses were carried out considering the whole temporal dataset. Four sectors were distinguished in each of the two beach systems; these were numbered from P1 to P4 in an easterly direction along the Poetto beach (Figure 5 and Figure 6) and from G1 to G4 in a north-easterly direction along the Giorgino beach (Figure 7). Results were averaged for all transects within each sector and are reported in Table 2.

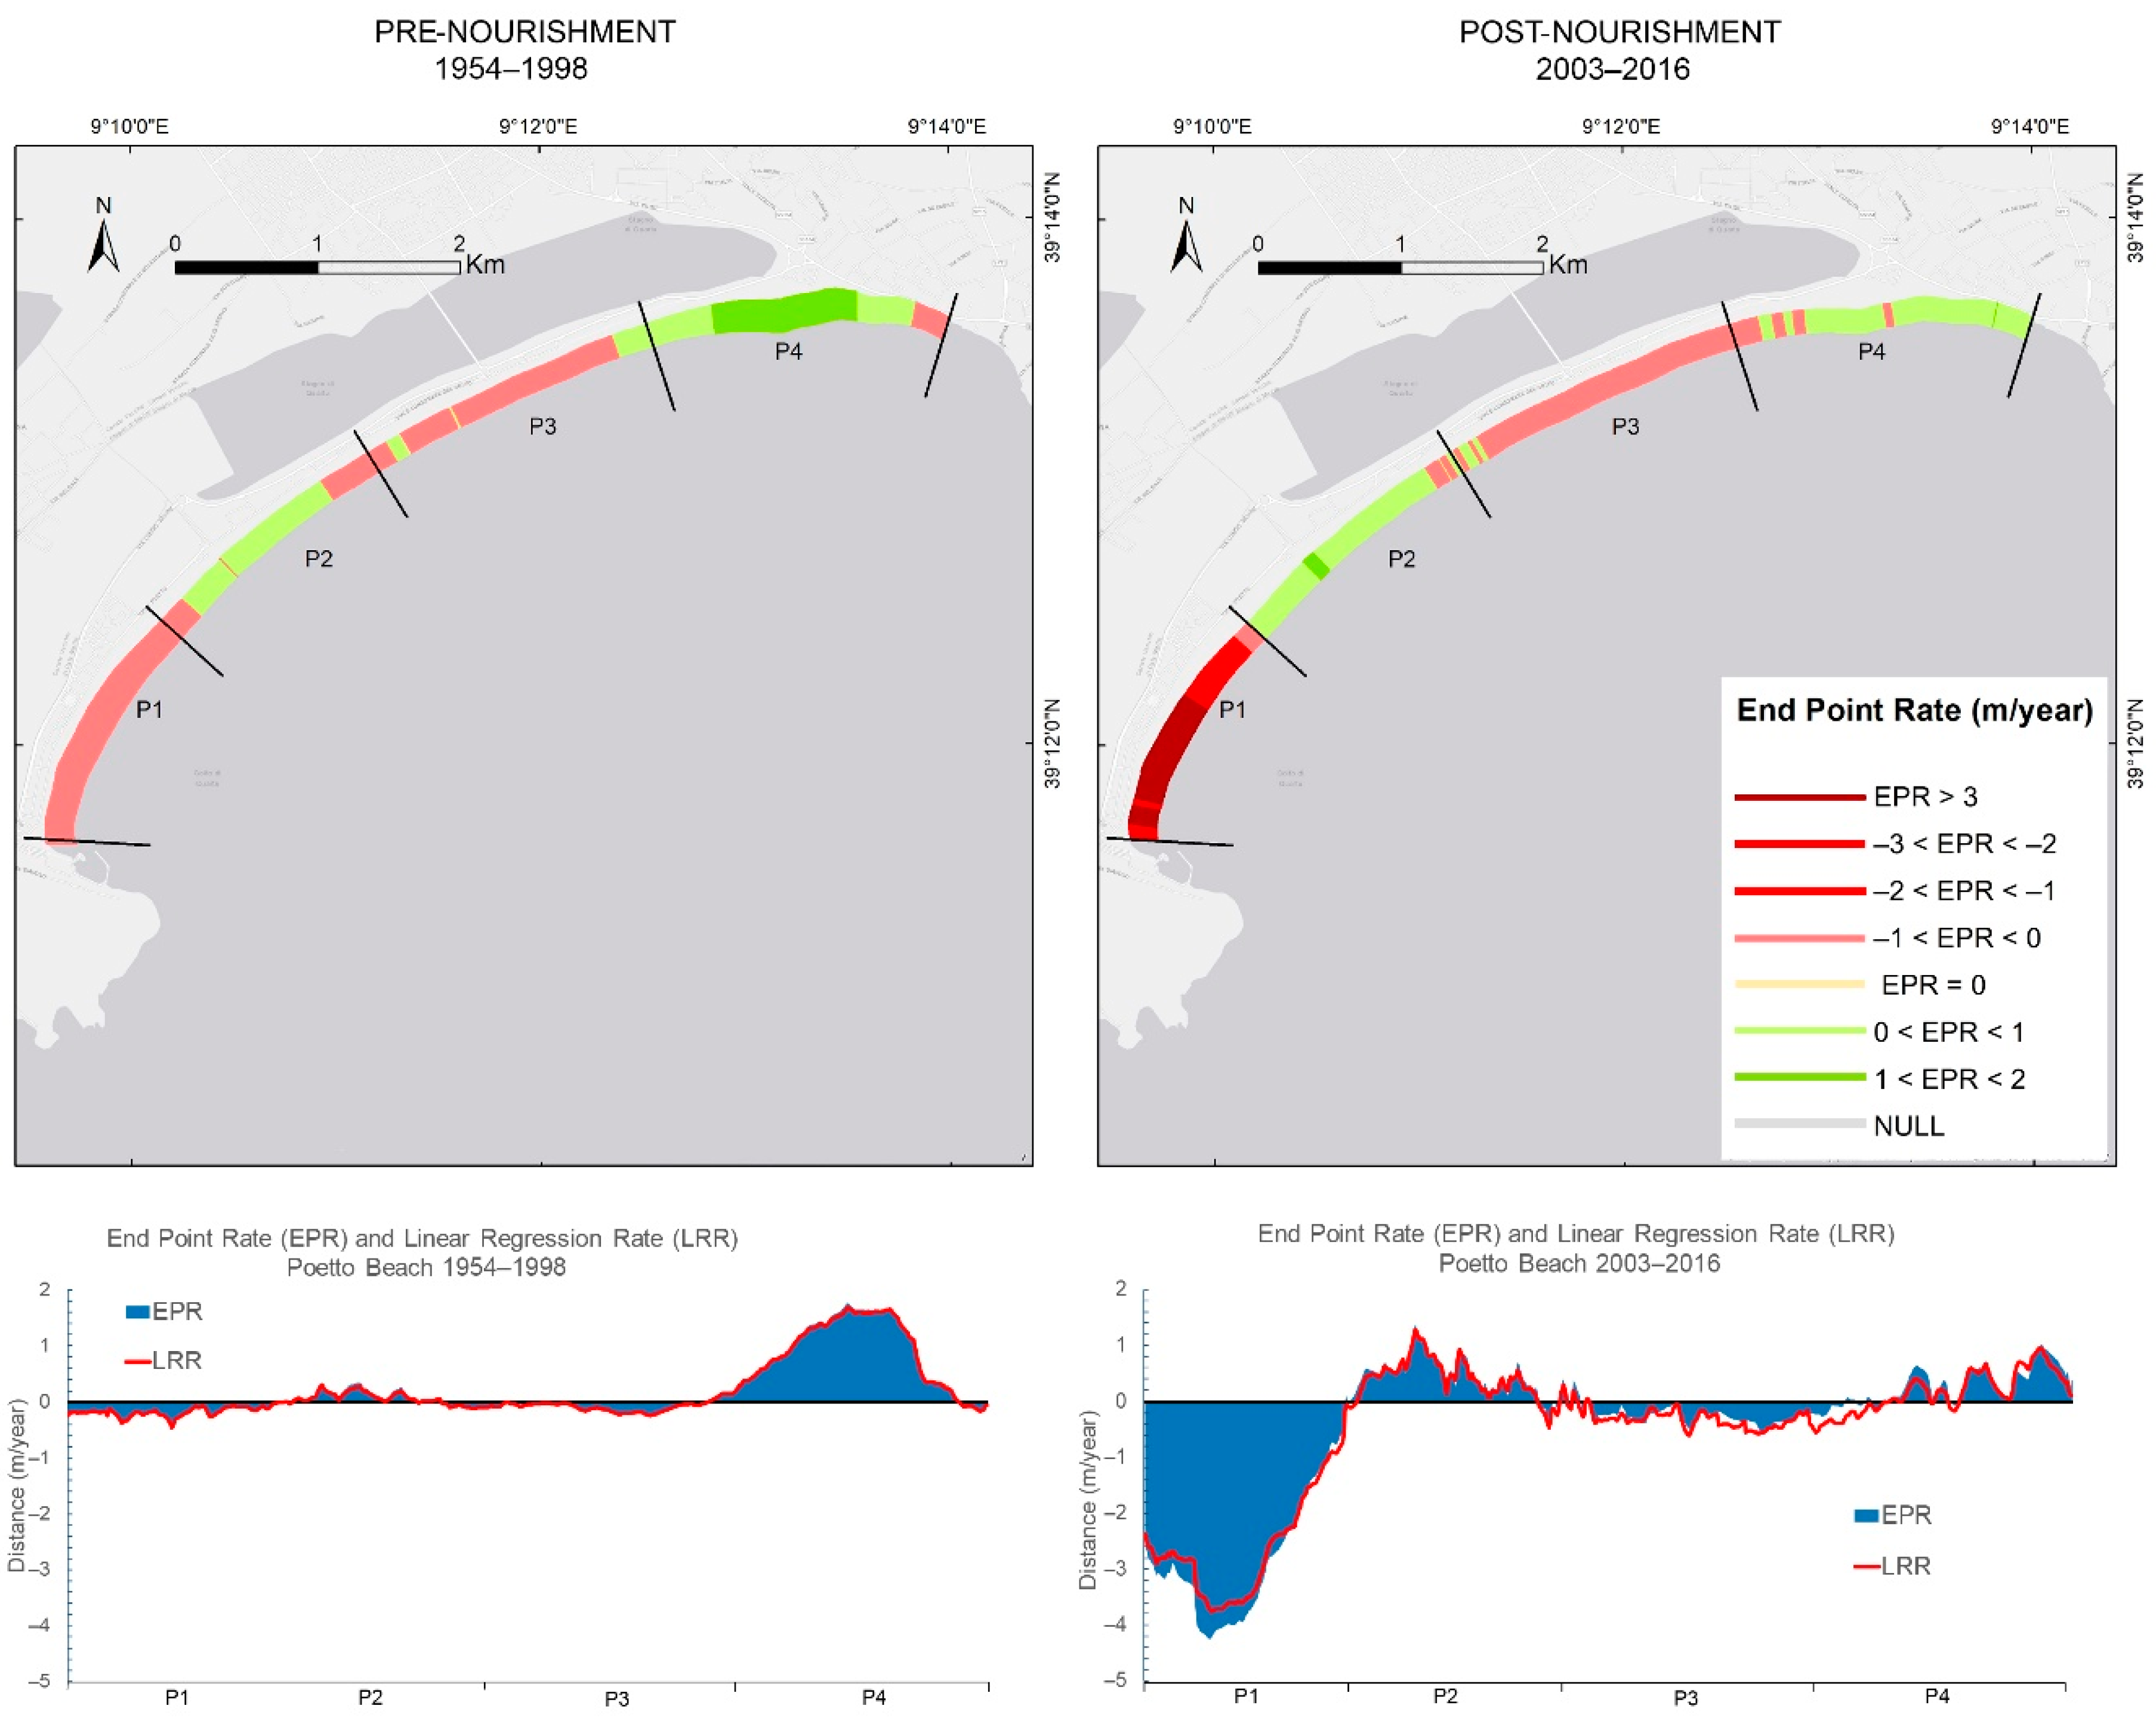
4.1. Shoreline Analysis of the Poetto Beach before Beach Nourishment (1954–1998)

The largest shoreline variability is observed in the easternmost side of the Poetto beach, in sector P4 (max SCE = 77.60, mean SCE = 41.77; Table 2, Figure 5) where a significant accretion of the beach was observed. Depositional processes dominate in this sector, as demonstrated by an average seaward accretion of 39.52 m from 1954 (NSM, Figure 5; Table 2) and a mean progradation rate of 0.90 m/y (EPR). In contrast, a general erosive trend is observed along all the other sectors. The largest shoreline retreat is registered in sector P1, in the westernmost side of the beach, where maximum and mean NSM values were of −20.25 m and −7.63, respectively (Figure 5 and Figure 8). Large shoreline variability is also observed in sector P2 (mean SCE = 10.56 m, mean NSM = 3.21 m, mean EPR = 0.07 m/y), whereas sector P3 can be considered the most stable area of the beach (Figure 5 and Figure 6; Table 2).

4.2. Shoreline Analysis of the Poetto Beach after Beach Nourishment (2003–2016)

Values for NSM, EPR and LRR revealed that the Poetto beach experienced a noticeable net shoreline retreat during the 13 years following beach nourishment (Figure 5 and Figure 6). The different magnitudes of shoreline change observed in the years pre- and post-nourishment should reflect the different temporal scales examined. However, despite recording large differences in values, the erosion–deposition dynamics showed similar patterns to those observed before beach nourishment, with the western side of the Poetto beach undergoing erosion and the eastern side showing accretion. During the years 2003–2016, the largest shoreline variability is recorded in the westernmost side of the Poetto beach, sector P1, where a mean SCE of −38.15 and a max SCE of −55.39 are recorded (Table 2; Figure 5). The largest erosion rates are also recorded in this last sector, with a mean and maximum EPR of −2.92 m/y and −4.26 m/y, respectively (Table 2; Figure 6). Mean accretion rates of 0.28 m/y (EPR) and 0.18 m/y (LRR) are observed in Sector P4. The SCE and NSM demonstrated considerable reduced accretion values when compared to those observed during the years 1954–1998, with mean SCE of 7.74 m and mean NSM of 3.68 m (Table 2). The erosion–deposition patterns observed after beach nourishment in the central sectors of the Poetto beach, sectors P2 and P3, show similar deposition and erosion rates to those observed during the 44 years prior to beach nourishment. Sector P2 experienced a small increase in the beach area, with an average accretion seaward of over 5 m (mean SCE = 10.47 m and mean NSM = 5.21 m; Table 2). On average, along this sector, the shoreline advanced with a measured rate of 0.40 m/y (EPR) and modeled rate of 0.35 m/y (LRR). A mean shoreline retreat (NSM = −3.03 m) was also observed in sector P3, with an average EPR of −0.23 m/y and an average LRR of −0.31 m/y (Table 2).

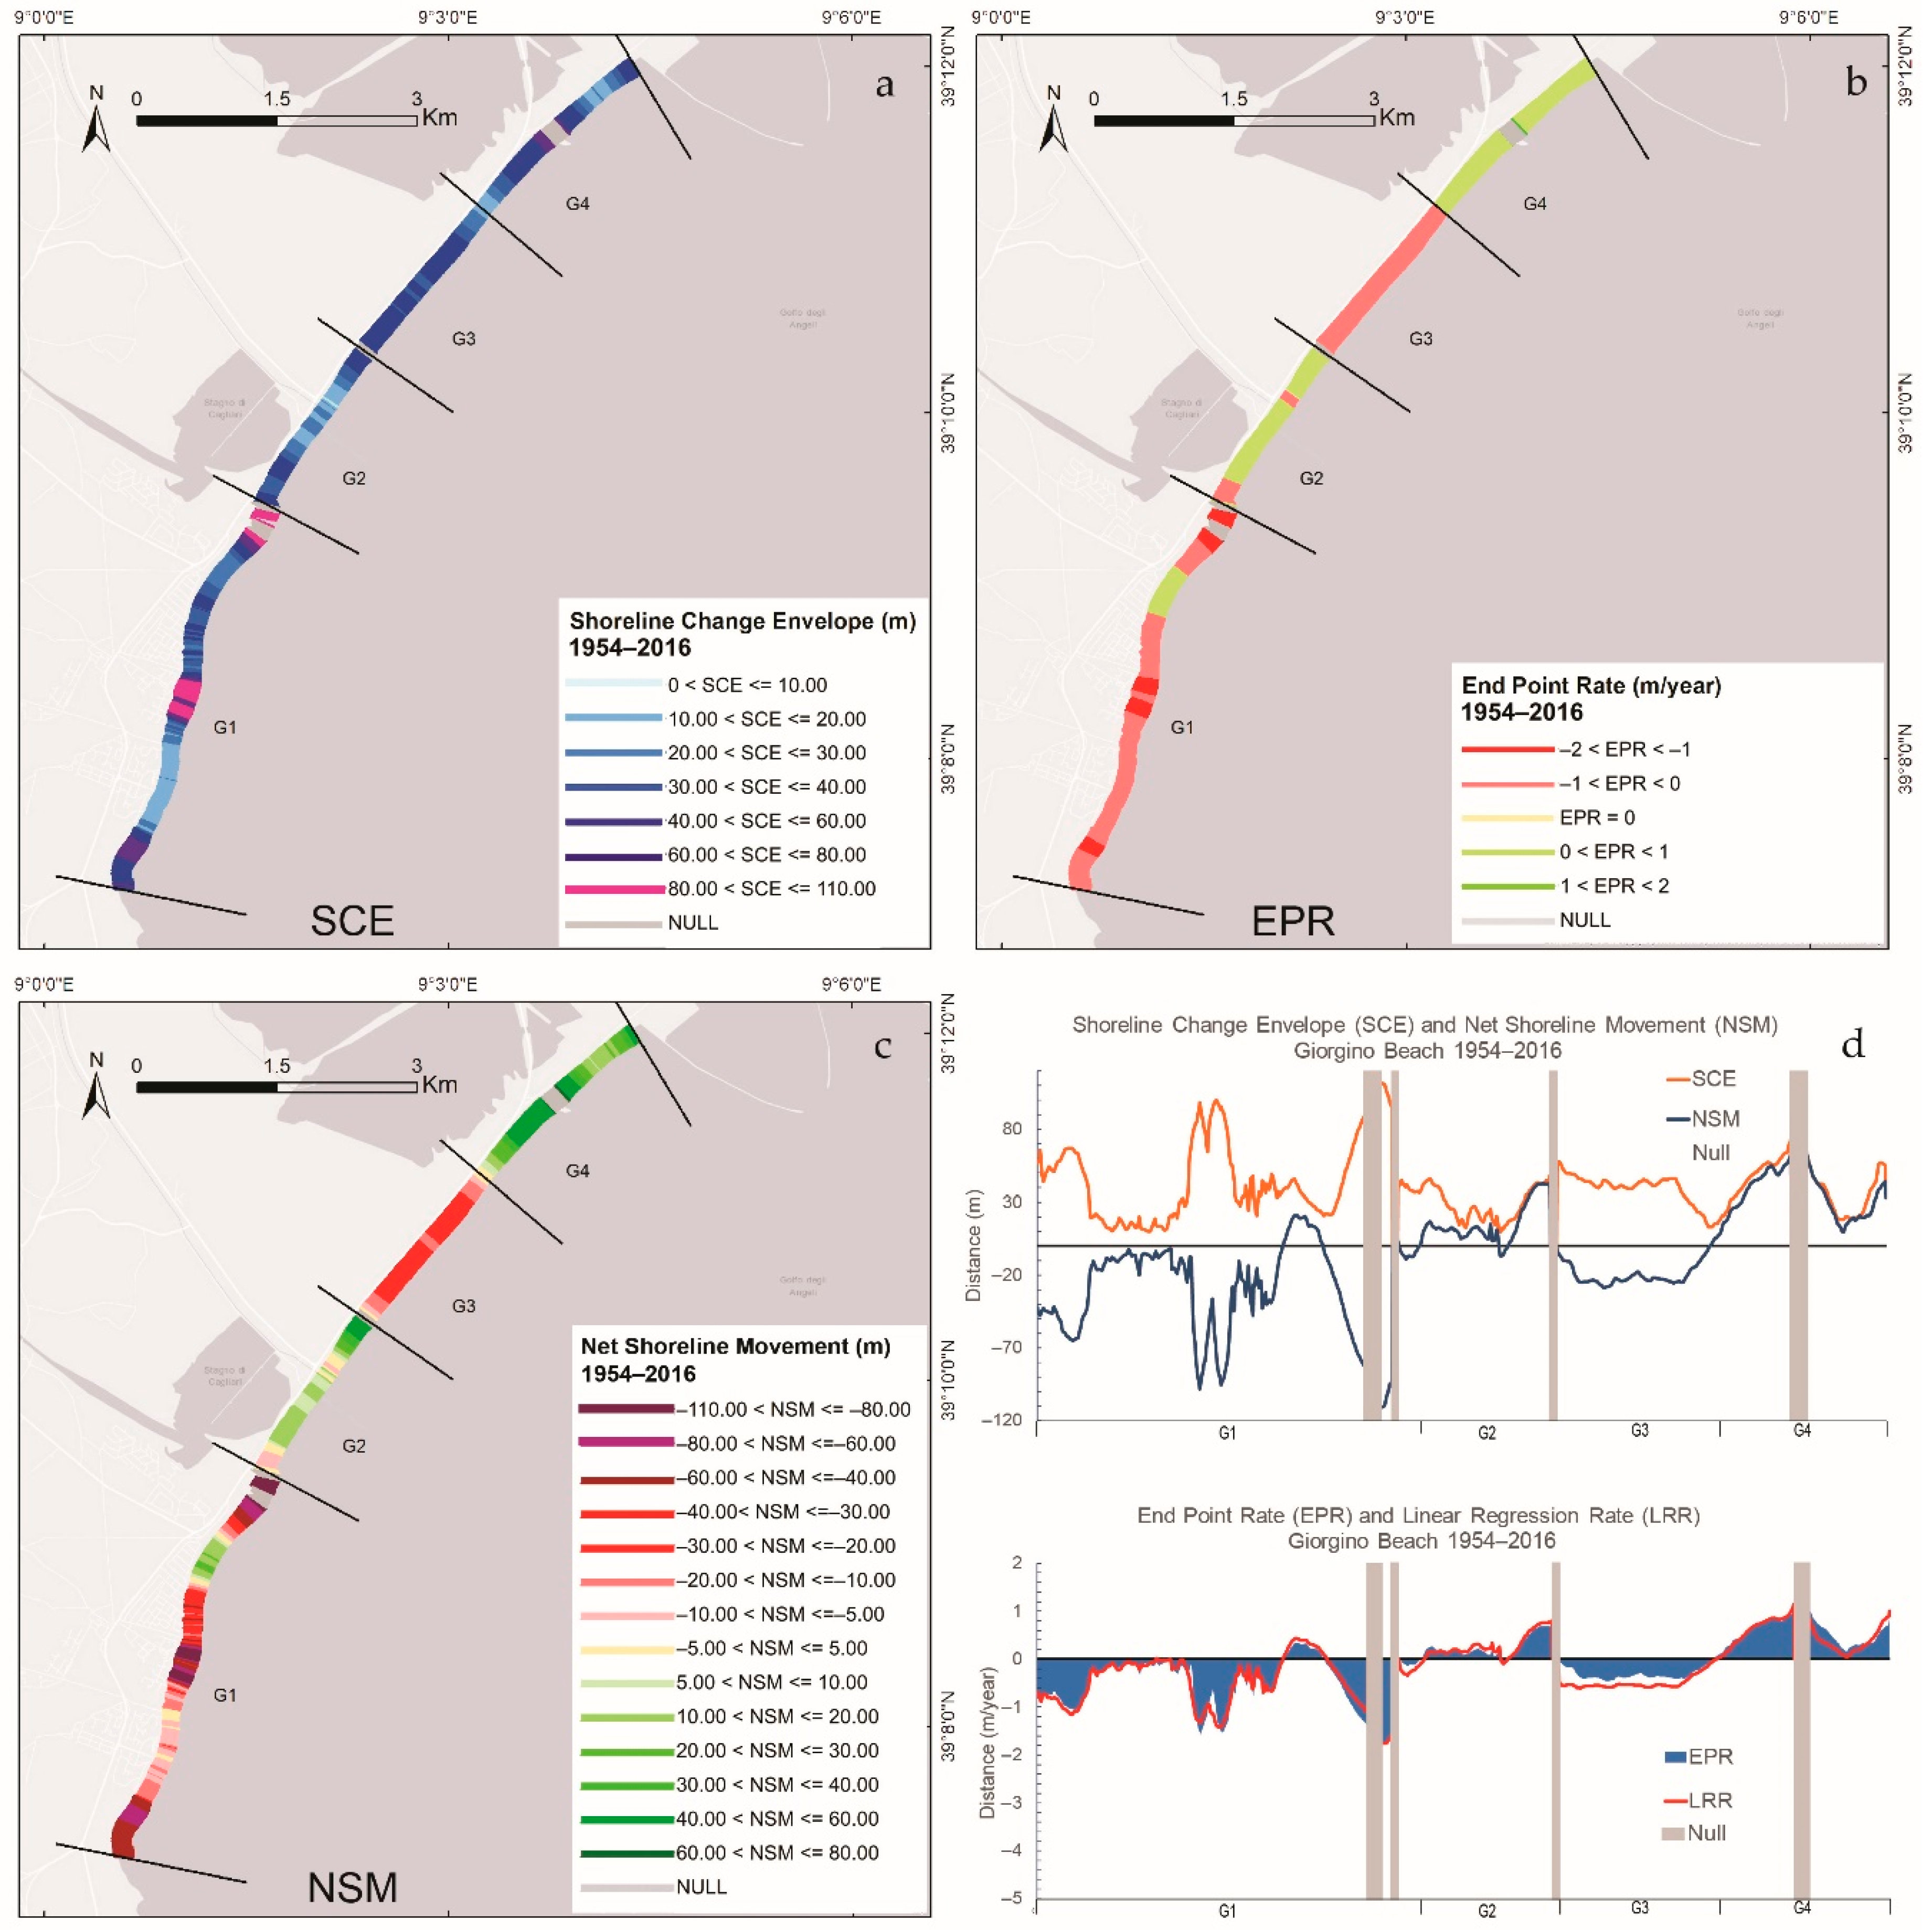
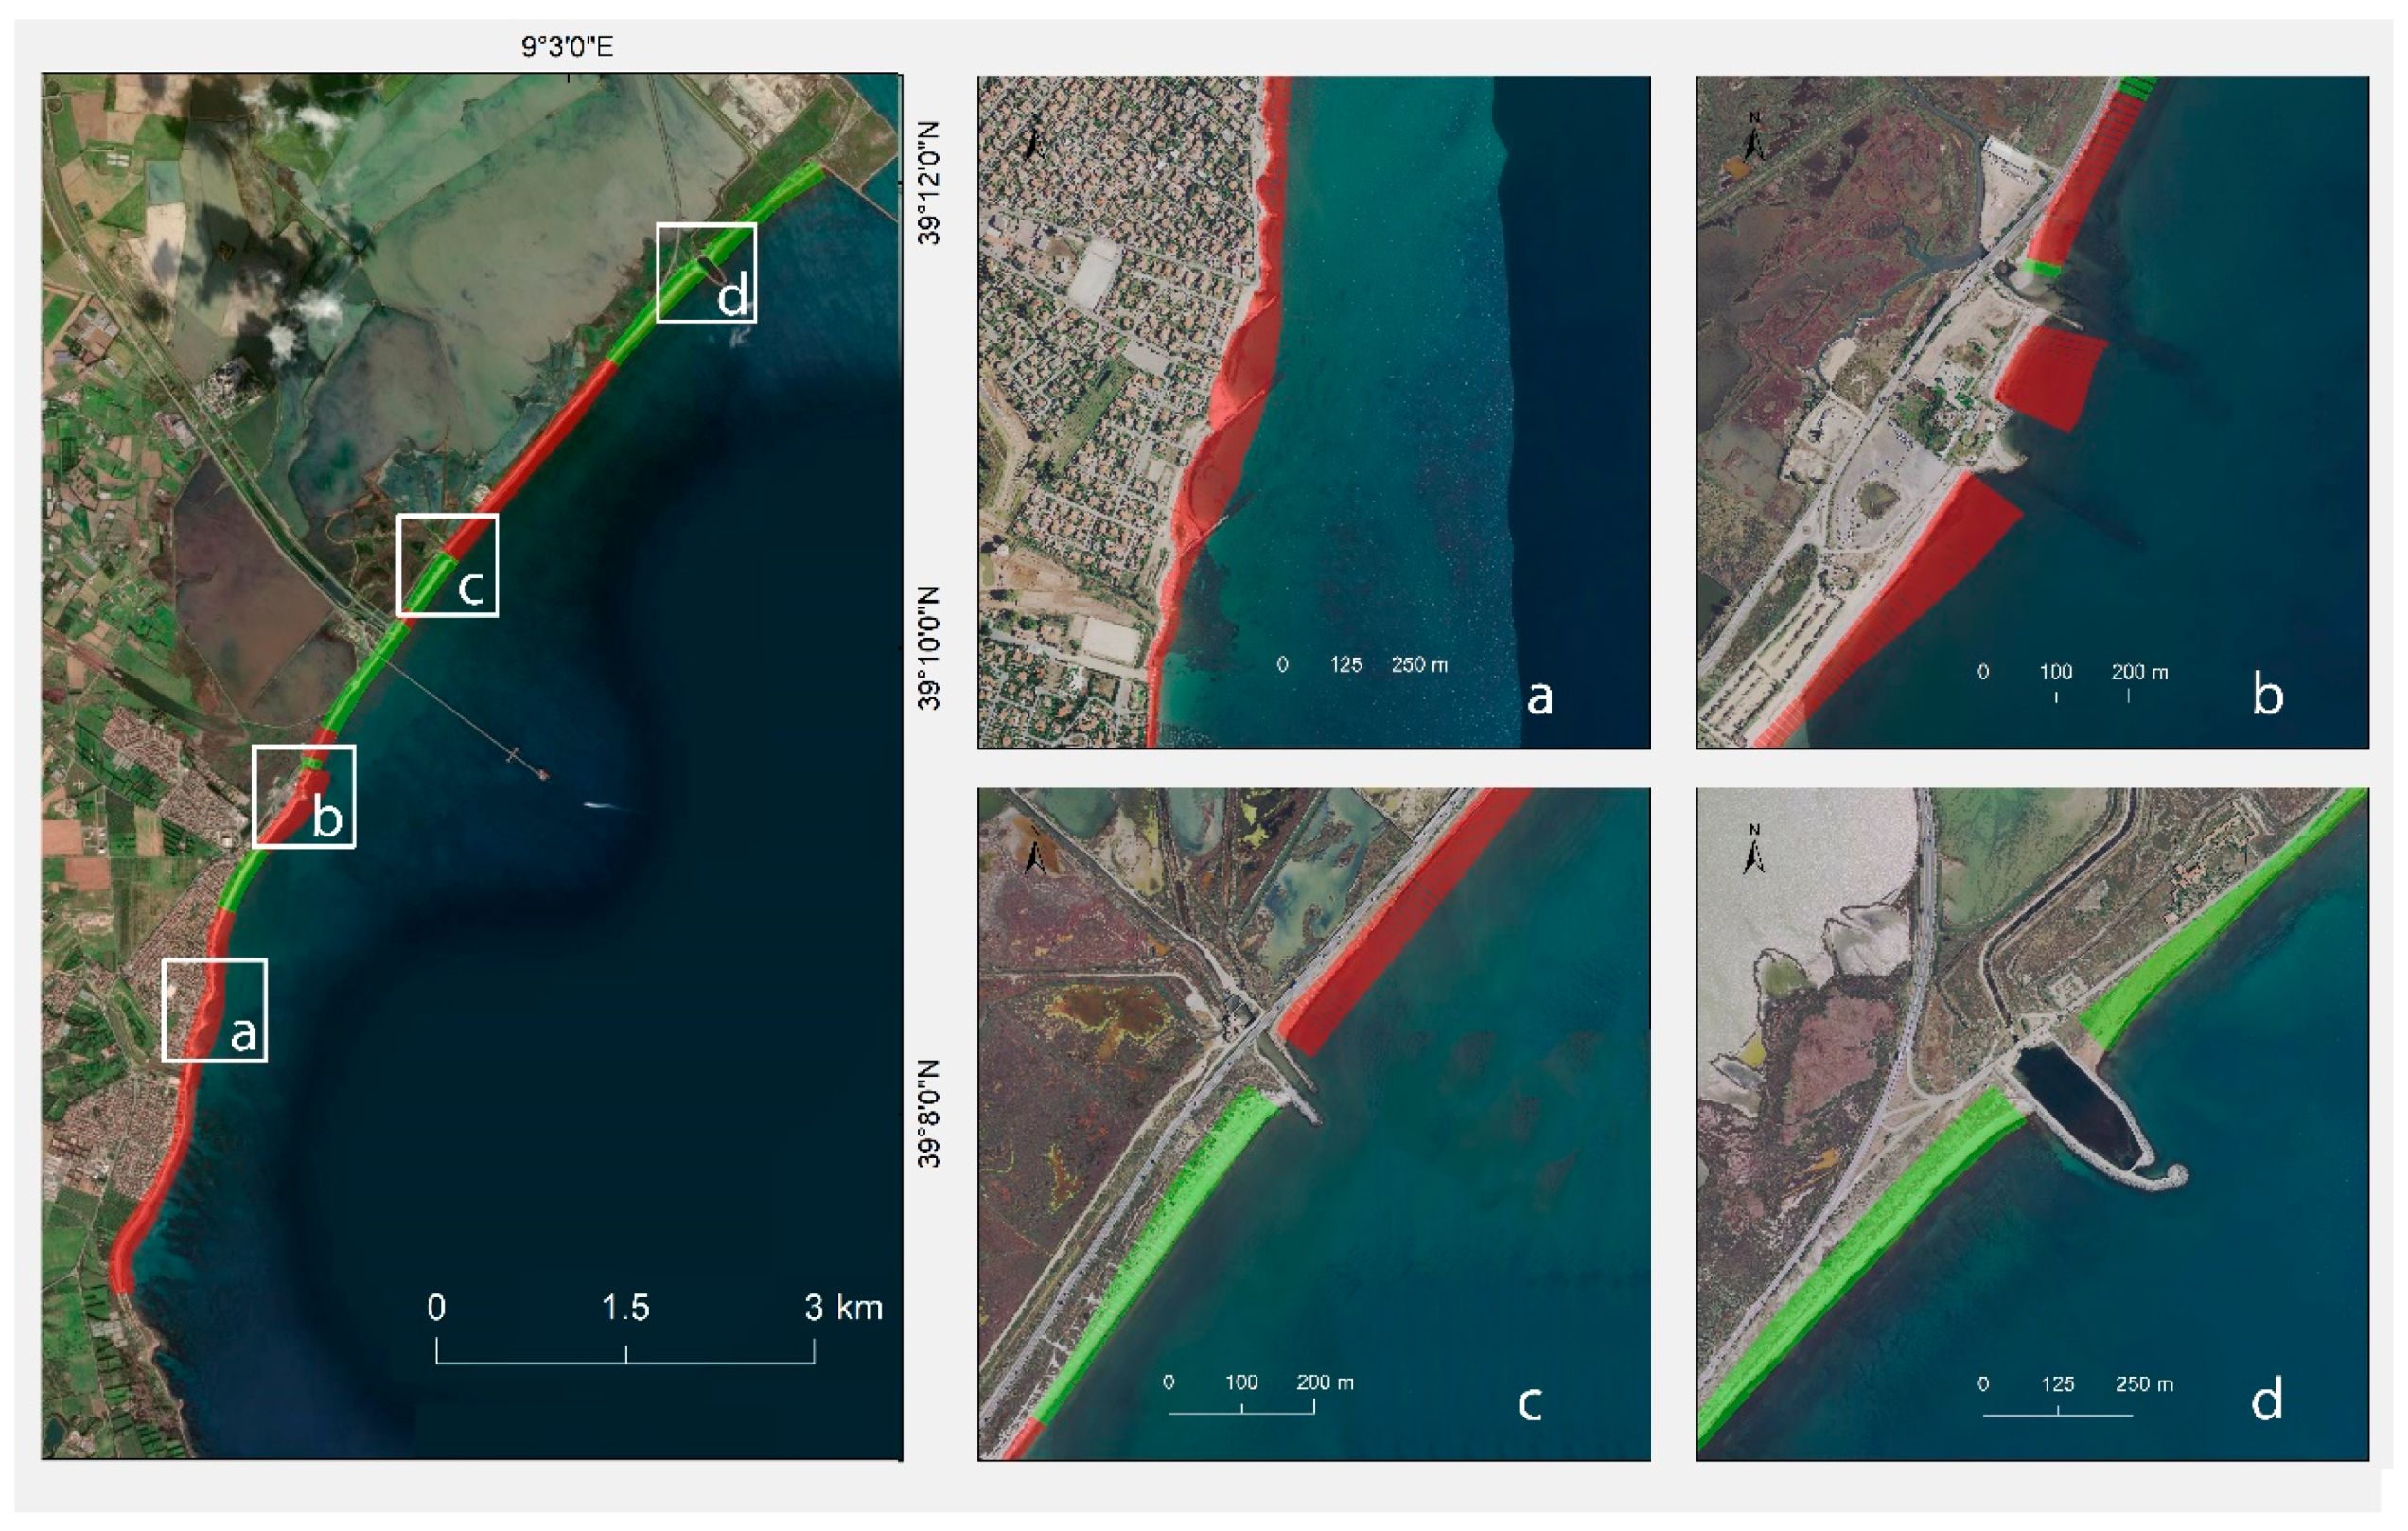
4.3. Shoreline Analysis of the Giorgino Beach (1954–2016)

Overall, the Giorgino beach experienced a larger shoreline variability SCE than that observed along the Poetto beach. Erosional and accretional trends appear to have occurred in “block-like” trends. In particular, areas with shoreline variability as high as 80–110 m (SCE) were recorded within sector G1; the transects displaying the highest negative values were located in the proximity of the small urban area of Frutti D’Oro, in a coastal sector occupied by protection groynes (Figure 7 and Figure 9a). In this sector, the NSM showed an average retreat of −31.46 m, and mean rates of change of −0.51 m/y (EPR) and −0.47 m/y (LRR). In Sector G2, the most significant landward displacement of the coastline is observed only in two narrow areas located near a stabilized lagoon mouth (Figure 7 and Figure 9b). Apart from these narrow segments of retreat, sector G2 showed an overall accretion trend with an average seaward displacement of 12.26 m (NSM) and an average accretion rate of 0.20 m/y (EPR; Table 2). Along sector G3, all transects exhibited negative values for all parameters. The average rate of shoreline retreat in this sector is −0.32 m/y for EPR and −0.50 m/y for LRR, while the average net landward movement of the shoreline was of −20.03 m (NSM; Figure 7). Sector G4 appeared to be characterized by an increase in deposition (mean NSM = 32.66 m). In this sector, accretion trends were reflected through average progradation rates of 0.53 and 0.47 m/y for EPR and LRR, respectively (Figure 7; Table 2). Finally, accretion was recorded at the west side of the breakwater structures fencing an artificial channel in sector G2 (Idrovora del Ponte Vecchio; Figure 9c) and at both sides of the concrete breakwater built around the old mouth of Santa Gilla lagoon (Figure 9d).

5. Discussion

The impacts of ongoing global warming on the sea storm regime is still a debated question, notably in the Mediterranean area [72]. Recent studies have reported that climate change is responsible for the global increase in mean and extreme sea state conditions observed in recent decades [73]. In the Mediterranean, De Leo et al. [74] confirmed similar patterns, with positive trends for the annual 98th percentile of significant wave height (Hs) and annual mean Hs. Moreover, data from tide gauges and observations from space by radar altimeters [75,76] have shown that the mean sea level in the Mediterranean Sea has risen at a rate of 2.5 mm/year over the period 1993–2019. In addition to climate change, local sea level rise can be accelerated by land subsidence. When compared to natural forcing [77], anthropogenic interventions can trigger relatively rapid changes in shoreline that can further accelerate climate-driven erosion. However, since eliminating completely human activity from urbanized beaches is presently a very complex task, there is an increasing need to properly study and manage beaches in order to ensure that human interactions are carried out in a sustainable manner, coastlines are protected and natural ecosystems are not lost [9].
Long-term analysis of changes in shoreline position and morphology using the DSAS ArcGIS extension has proved to be a successful method for assessing the effects of natural and anthropogenic forcings on large-scale morphodynamic processes and coastal behavior [60,78]. In this study, the statistically computed parameters of EPR, LRR, NSM and SCE were used to analyze the rates of shoreline change from 1954 to 2016 along the beach systems of the Gulf of Cagliari.
The beaches of the Gulf of Cagliari (Poetto and Giorgino) are coastal systems where waves and littoral currents are the dominant processes acting on the transport and deposition of sediments. From a hydrodynamic perspective, the entire coastal area of the Gulf of Cagliari is characterized by longshore currents that move sediment from the west to the east [9]. Beside reflecting dynamics due to natural transport processes, the accretion and the erosion dynamics appear to have been greatly affected by the intense anthropogenic activities that have impacted these areas during the last 60 years. These human interventions were relatively moderate until 1945. Thereafter, urbanization and industrialization increased considerably, resulting in several coastal modifications [38].
An increasing number of residential users, the progressive development of the urban area of Cagliari and the construction of marinas, roads, artificial reefs and coastal defenses are the main types of human pressures which have modified the natural state of the Poetto beach during recent decades. These impacts are further aggravated by the ongoing seasonal mechanical beach grooming that is carried out to promote tourism (removal of Posidonia oceanica banquettes) [3]; such a practice is depriving the beach of its natural buffer from wave energy and wave run-up, therefore increasing the risk of erosion [3,79]. For all of these reasons, a nourishment project was carried out in 2002 to reintroduce 300,000 m3 of sand. However, the nourishment significantly modified the textural sediment composition of the shore, which was originally composed of medium-fine siliciclastic sand, by adding great amounts of bioclastic/biogenic sediments; such changes in sediment composition and sizes (from D50 = 1.89 ϕ [80] to D50 = 0.78 ϕ [3,51]) ultimately caused the modification of the beach morphology (e.g., slope) and morphodynamics (from dissipative to reflective) immediately after nourishment [3,54]. Comparative data and distribution maps for both pre- and post-nourishment sediment characteristics have been provided and are reported in Lai [56]. For further details on the grain-size data, the reader is referred to Lai [56].
Because of the natural west to east longshore drift in the Gulf of Cagliari, the building of the yacht marina, which started in the 1950s, may have led to the starvation of sediments along the shoreline areas located to the east of this structure. Together with the loss of dune habitats caused by the road construction, the building of the yacht marina is another likely reason for the shoreline retreat observed in Sector P1, as values for NSM, EPR and LRR (−7.63 m, −0.17 m/y and −0.19 m/y, respectively) confirmed.
The beach nourishment intervention in 2002 was carried out to counteract this landward retreat. Shoreline changes before and after beach nourishment were analyzed separately. From the analysis conducted on the 2003–2016 dataset, as NSM and EPR rates demonstrate, it is evident that all the replenished material was almost totally lost from the system (Figure 5 and Figure 6). If shoreline erosion rates and net retreat, during the 44 year prior to beach nourishment, were in the order of ten of centimeters per year and 10 m, respectively, after beach nourishment, within a temporal span of only 14 years, values for NSM and EPR became disproportionately increased. Mean retreat and erosion rates were recorded as high as −38.02 m and −2.92 m/y, while the maximum landward shoreline displacement was of −55.39 m. The nourished sand appeared therefore to have eroded much faster than the natural sediment (Figure 8). As demonstrated by other research [81,82], the reason for this increased erosion may be partly attributed to the differences in textural properties of the artificial and native materials. In Figure 8, the shoreline position 3 years before beach nourishment, in a small segment of sector P1, is compared with the shoreline positions recorded 1 year and 14 years after beach nourishment, in order to provide a clearer graphical explanation of the evidence described.
In contrast, Sector P2 showed that post-nourishment accretion rates (EPR ranging from 0.07 to 0.40 m/y) are relatively similar to those observed before nourishment, with the EPR ranging from stability to a half meter of accretion per year and NSM ranging from a few meters to 15 m of seaward displacement. Nevertheless, the length of the coastal segment affected by accretion, within sector P2, appears to be increased in the years after beach nourishment. This is an important piece of evidence that suggests that, a decade after the artificial sand nourishment, the beach returned to its stability. By looking at post-nourishment NSM and EPR, it seems that the nourished material eroded from sector P1 is not deposited in the eastern adjacent sector P2, where accretion rates remain relatively stable and are similar to those observed prior to beach nourishment. Additionally, sector P3 shows post-nourishment erosion rates (max EPR = 0.50 m/year) in the order of those computed for the pre-nourishment years. However, the stretches of coast showing the highest recorded shoreline progression and retreat, in sectors P2 and P3, appear to have, respectively, increased and decreased in length. As already reported in several studies [3,38,83], this may be due to the fact that some of the coarse bioclastic replenished material may have remained in the system and possibly supplied the proximal segments of the coast. Sector P4 shows net accretion trends during both pre- and post-nourishment years. This is probably due to the natural embayed shape of the Poetto beach, as the arch of the bay in the eastern parts promotes the deposition of sediments and “protects” them from major swells and currents. However, post-nourishment NSM and EPR in sector P4 became much lower than those recorded during the pre-nourishment years when the coast progressed up to 80 m in length and EPRs recorded were, in some segments, as high as 2 m/year. Given the much shorter temporal scale of the post-nourishment analysis, this result was expected. Nevertheless, rates of increase appear halved, showing a maximum of 1 m/year of accretion. This result suggests, again, that erosion–deposition dynamics within the Poetto beach system reached an equilibrium in only few years after sand nourishment; the majority of the artificially fine bioclastic material was probably transported toward deeper areas or lost through wind deflation outside the beach–dune system. Only the coarse-grained material partly remained, positively influencing the long-term sediment dynamics in those coastal segments close to the nourished beach area. The potential loss of artificially replenished fine bioclastic material offshore is likely to have been limited by the presence of the P. oceanica meadow [3]. This seagrass can directly intercept suspended sediment particles with their leaves [84] and consequently increase sediment trapping and deposition on the shoreface [27,32,37,57,85,86]. In fact, it is well known that seagrass meadows play a crucial role in the physical equilibrium of the Mediterranean coasts by protecting the coastline from erosion [26,34,87,88,89,90]. Today, the P. oceanica meadow is possibly the last remaining authigenic bioclastic sediment source at Poetto beach [38].
Two other studies conducted along the coast of Alicante (Spain) reported analogous dynamics to those observed along the Poetto beach after the nourishment intervention. The first study, carried out by Pagán et al. in 2018 [91], presents the historical evolution of six beaches along the coast of Alicante in the period between 1956 and 2017. In all of the study sites, it was documented that the beach nourishment used to regenerate the beaches in the 1990s caused significant textural and morphological modification that partly contributed to the increase in erosion rates recorded. Environmental damage to the nearby P. oceanica meadows was also caused by an increase in sediment volumes. In most cases, the filled material was lost and all the beach systems returned to the initial state. The second study carried out by Pagán et al. in 2016 [92] analyzed the historic evolution of the Marineta Cassiana beach for a period of 65 years (1950–2015). Again, it was demonstrated that the change in sediment grain size, caused by the artificial nourishment, led to an imbalance of the beach profile and to the backward movement of the P. oceanica meadow, resulting in increased annual erosion from −1.5 to up to −2.5%.
In order to assess the effects of the changes in the textural properties and volumes of the Poetto beach on erosion dynamics and P. oceanica ecosystems, further long-term monitoring should be carried out. However, it could be sensibly deduced that, as reported in the above studies, the restoration measures adopted in the Poetto beach could have similarly caused an imbalance of factors that may influence the future evolution of the beach.
For what concerns the Giorgino beach system, numerous human interventions were also carried out here since the 1940s. The development of several industrial activities, the construction of the Syndial (ex-Rumianca) wharf pier, the building of the industrial port of Cagliari and its related activities and the expansion of a large urban agglomerate that led to the modification of the fluvial catchment areas are recognized as the main modifications that caused the interruption of the longshore and cross-shore transports of sediment [9]. In addition, dragging, ship anchoring, pollution, solid wastes related to industrial activity and urbanization have affected the shoreface environment, causing deterioration of the water quality levels that consequently led to the degradation and retreat of the P. oceanica meadows. A wide area of degraded and discontinuous meadow in front of Giorgino beach, at depths between −4 and −20 m, was described [9]. The poor ecological status of the seagrass meadow in this area has been revealed by the presence of Caulerpa prolifera (an invasive species over P. oceanica ecosystems) and by benthic foraminiferal assemblages; in particular, the foraminiferal assemblages of the shoreface of Giorgino are similar to most of those collected in highly impacted coastal areas of Sardinia, such as Portoscuso [93], La Maddalena [94] and Porto Torres [95]. The fragmentation and retreat of the upper limit of the meadow implicates a reduced capacity of sediment retention by seagrasses in the inner shelf of Giorgino beach. Consequently, this material can be lost offshore and exit the beach sedimentary budgets. This may be one of the contributing causes for the considerable shoreline retreat of Giorgino beach, ranging from 30 m to 110 m of landward regression, observed in sector G1 (south-western side; Figure 9), in the vicinity of the urban agglomerate of Frutti d’Oro (Figure 3). More specifically, the highest shoreline retreat values (NSM ~ 80–110 m) were recorded in the proximity of the river mouth of Rio San Gerolamo; further eastward, lower values in the range of 20–60 m of NSM were also recorded next to the mouth of a stabilized lagoon mouth, and alongshore, a coastal segment hosting a series of groynes built in 2014 to protect the urban area from erosion (Figure 9a) [9]. Another important cause for the shoreline retreat occurring in this coastal sector may be the modification of the fluvial catchment system due to the heavy urbanization of the area, which led to a strong reduction of terrigenous sediments input to the beach. Similar patterns were described in Platamona-Maritza Beach (Northwest Sardinia, Italy) by Virdis et al. [63]; here, multi-temporal analysis revealed that the shoreline retreat observed in the southern sector of the Gulf of Asinara was temporally correlated to changes in water discharge from the main rivers (Riu Mannu di Porto Torres). The reduction in river discharge was indeed attributed to the extreme urbanization recorded since the 1960s which led to land use change, the construction of dams for agriculture and urban developments. The importance of sediment supply by rivers is demonstrated by various studies and reviews. Some of the most important anthropogenic forcing in shoreline retreat, considered to be the cause of the reduction of fluvial sediment supplies to coastal areas, are: the construction of dams, abstraction for irrigation, overexploitation of coastal acquirers and artificial alteration of the river course [96,97,98].
As mentioned before, groynes were built in sector G1 to limit erosion and protect coastal structures from flooding. There is insufficient temporal evidence to appreciate the effect of containment structures over the 64-year analysis, however, given the high EPRs of 2 m per year recorded in this coastal segment, the groynes probably provided little protection from erosion and may have, as scientific evidence suggests, even aggravated the process of erosion along the eastern adjacent parts of the coast [99]. Similar trends were presented in Nassar et al. [61] for the north Sinai coast (Egypt), where shoreline analysis revealed increased erosion on the downdrift side of protection structures due to interruption of longshore sediment transports. Groynes are, indeed, the most commonly used coastal defense structure used to stabilize the shoreline on coasts with prevailing longshore sand transport [99,100] and to combat beach erosion [101]. While these structures lead to the progradation of the updrift beach [102], the downdrift beach is eroded, causing detrimental effects and potential threat to tourist activity. Despite updrift trapping of sediment, the intensification of the sequential erosion of the downdrift shoreline cannot be avoided [99]. Furthermore, the rigid structures have a tendency of reflecting, rather than dissipating, wave energy [9], causing further negative impact on the littoral zone.
On the contrary, accretional trends in section G2 and G4 were observed (Figure 7). Within these two coastal sectors, different man-made structures are found, such as the breakwaters built along an old mouth of the Santa Gilla lagoon (Figure 9d) and the breakwater fencing the outlet of an artificial channel (Idrovora del Ponte Vecchio; Figure 9c). In this case, the breakwaters have positively acted as a barrier to the natural west to east longshore drift, trapping the sediments coming from the lagoonal areas and ultimately contributing to accretion on the updrift side of the structure. Overall, along the entire sandy coastline of Giorgino, longer segments of shoreline retreat are found adjacent to shorter progressing segments, reflecting an alternating west to east release and accumulation of sand.
Our 62-year analysis revealed that along the entire sandy coastline of the city of Cagliari, anthropic processes significantly modified natural erosion, transport and deposition dynamics. This implies that, if these factors remain constant, under projected climate change scenarios, these beaches are at risk of further increased flooding and erosion. Following the recent COVID-19 pandemic emergency, drastic measures were adopted to restrict human interactions. Imposed periods of quarantine shut off all economic, industrial and urban activities to a level that led to visibly positive outcomes for the environment and its ecosystems [103]. Beaches in Europe were closed to public access, giving scientists the unprecedented opportunity to observe ecosystem resilience at work. The preliminary results of the seasonal monitoring carried out by the Coastal and Marine Geomorphology Group of the University of Cagliari [58] along the Poetto beach seems to indicate that the total shut-off of beach cleaning operations and of public admittance to the beach resulted in a significant increase in seagrass biomass (Posidonia oceanica) and of other organic beach-cast deposits of allochthonous input (e.g., Arundo donax, giant reed). As a consequence, a higher ability of the beach to absorb storm surges was observed in the form of less frequent flooding events. Furthermore, preventing access to the beach left sediment and dune vegetation undisturbed, allowing noticeable higher sedimentation rates and accretion.

6. Conclusions

In this study, a multidecadal analysis of shoreline changes was performed using the DSAS tool on historical ortho-rectified photo mosaics acquired between the years 1954 and 2016. Such analysis was performed for the first time along the two beach systems of Poetto and Giorgino in order to quantify net shoreline position variability in relation to natural and anthropogenic forcings. Despite some limitations [59], the DSAS allowed us to identify the most vulnerable zones of the study areas. Eight sectors with interchanging net erosive or accretional trends were identified along both beaches. The most vulnerable coastal sector, which in the last six decades experienced the highest erosion rates, appeared to be sector G1, in the westernmost part of the study area. The higher levels of human interventions occurring in this coastal zone (including stabilization of river mouth, coastal engineering structures, backbeach and dune occupation and consequent strong reduction of terrigenous sediment supply) were considered the main causes for the landward retreat evidenced by our long-term analysis. A comparable landward displacement of the shoreline was observed in sector P1, along the Poetto beach, for both pre- and post-nourishment analyses. Erosion rates in sector P1 appeared to be significantly increased after artificial sand nourishment, suggesting that, during the 14 years following beach nourishment, the system rapidly reached its equilibrium state and most of the replenished material was naturally rearranged along the beach by the local hydrodynamics. In general, several causes of anthropic origins, some of which date back to almost a century ago, were recognized as the causes of the shoreline retreat observed during the last six decades along the Poetto and Giorgino beaches. In particular, low resilience levels were the result of coastal structures which interrupted the longshore and cross-shore continuity of the two beach systems.
The whole study area is subject to important wave run-up and flooding phenomena, meaning that anthropic developments can greatly exacerbate long-term ongoing natural dynamics and make the entire sandy coastline of the Gulf of Cagliari more vulnerable to the effects of extreme events. Understanding system dynamics and impacts is particularly important in insular Mediterranean microtidal wave-dominated beaches, where fluvial sedimentary inputs are considerably reduced when compared to large continental systems (e.g., Rhône delta) characterized by the availability of large amounts of siliciclastic sediments. In Mediterranean beaches, insularity induces a more fragile and unstable equilibrium that climate change and increasing human pressure can potentially aggravate, posing serious threats to the survival of the urban beach systems that cannot accommodate these modifications. In this context, the analysis of past shoreline dynamics carried out in this study constitutes an important step towards better environmental planning. The DSAS proved to be an easy tool that can potentially facilitate the assessment of coastal vulnerability in relation to natural and anthropic causes. Furthermore, the results represent a fundamental basis that can be used to predict the short- to long-term future evolution of these beach systems.
Sustainable management aimed at system restoration becomes extremely difficult when facing historical large-scale land modification and should therefore reinforce those regulations aimed at system maintenance, prioritizing the protection of all those natural buffers in a beach system, such as dune and P. oceanica habitats. We believe that, beside adequate management strategies, enhancing the natural recovery ability of coastal systems is possibly the most powerful “passive” tool for coastal managers. Lockdown measures worldwide taught us that nature has an incredible ability to restore itself after disturbance; therefore, we believe that allowing ecosystems to restore naturally and then be given the space to persist should be made one of the fundamental tools in coastal management plans.

Author Contributions

M.B., C.B., M.V. and S.D.M. were responsible for the conceptualization, investigation and analysis; M.B., C.B. and A.R. wrote the original draft; M.B., D.T., H.M. and M.P. were responsible for the experimental methodology; A.I. and S.D.M. acquired funding and supervised the investigation; all authors reviewed and approved the manuscript; H.M. presented part of this work in her BSc final dissertation in Geography at the University of Exeter (UK); S.D.M. is the scientific director of BEACH, TENDER NEPTUNE and NEPTUNE 2 projects. All authors have read and agreed to the published version of the manuscript.

Funding

This work was supported by Regione Autonoma Sardegna under L.R. 7/2007, “Promozione della ricerca scientifica e dell’innovazione tecnologica in Sardegna” for BEACH, TENDER NEPTUNE and NEPTUNE 2 projects directed by Sandro De Muro. Daniele Trogu acknowledges the support by the University of Cagliari (“Borse di studio di Ateneo”-Dottorati di Ricerca XXXIV ciclo, voce CO.AN.A.06.01.01.01.01.02). M.V. is funded through the Levi Montacini programme of the Italian Ministry of Research (MIUR).

Acknowledgments

This study is part of the TENDER NEPTUNE, NEPTUNE 2 and BEACH projects directed by Sandro De Muro. The authors warmly thank Battellieri Cagliari and Sardegna Progetta. Daniele Trogu acknowledges the support of the University of Cagliari (“Borse di studio di Ateneo”-Dottorati di Ricerca XXXIV ciclo, voce CO.AN.A.06.01.01.01.01.02). The authors would like to thank the “Coastal and Marine Geomorphology Group” of the University of Cagliari, the staff of “Osservatorio Coste E Ambiente Naturale Sottomarino (OCEANS)”, the “Deposito PolNato Marina Militare (Navy PolNato Depot Marina Militare)” of Cape S. Elia–Cagliari and Comando supporto logistico di Cagliari (MARICAGLIARI). Sincere thanks go to the Comune di Cagliari (Alessandro Guarracino) for having allowed the seasonal monitoring survey during the pandemic lockdown. The authors warmly thank the three anonymous reviewers for their criticism and helpful suggestions, which greatly improved the manuscript.

Conflicts of Interest

The authors declare no conflict of interest.

References

  1. Blumberg, A.; Bruno, M. The Urban Ocean: The Interaction of Cities with Water; Cambridge University Press: Cambridge, UK, 2018. [Google Scholar] [CrossRef] [Green Version]
  2. Crossland, C.J.; Baird, D.; Ducrotoy, J.-P.; Lindeboom, H.; Buddemeier, R.W.; Dennison, W.C.; Maxwell, B.A.; Smith, S.V.; Swaney, D.P. The Coastal Zone—A Domain of Global Interactions. In Coastal Fluxes in the Anthropocene: The Land-Ocean Interactions in the Coastal Zone Project of the International Geosphere-Biosphere Programme; Crossland, C.J., Kremer, H.H., Lindeboom, H.J., Marshall Crossland, J.I., Le Tissier, M.D.A., Eds.; Springer: Berlin/Heidelberg, Germany, 2005; pp. 1–37. [Google Scholar] [CrossRef] [Green Version]
  3. De Muro, S.; Ibba, A.; Simeone, S.; Buosi, C.; Brambilla, W. An integrated sea-land approach for mapping geomorphological and sedimentological features in an urban microtidal wave-dominated beach: A case study from S Sardinia, western Mediterranean. J. Maps 2017, 13, 822–835. [Google Scholar] [CrossRef] [Green Version]
  4. Díaz-Cuevas, P.; Prieto-Campos, A.; Ojeda-Zújar, J. Developing a beach erosion sensitivity indicator using relational spatial databases and Analytic Hierarchy Process. Ocean Coast. Manag. 2020, 189, 105146. [Google Scholar] [CrossRef]
  5. Cuevas Jimenez, A.; Euán, J.; Villatoro, M.; Silva, R. Classification of Beach Erosion Vulnerability on the Yucatan Coast. Coast. Manag. 2016, 333–349. [Google Scholar] [CrossRef]
  6. UN General Assembly. Transforming Our World: The 2030 Agenda for Sustainable Development; Division for Sustainable Development Goals: New York, NY, USA, 2015. [Google Scholar]
  7. Jaramillo, C.; Jara, M.S.; González, M.; Medina, R. A shoreline evolution model considering the temporal variability of the beach profile sediment volume (sediment gain/loss). Coast. Eng. 2020, 156, 103612. [Google Scholar] [CrossRef]
  8. Mentaschi, L.; Vousdoukas, M.I.; Pekel, J.-F.; Voukouvalas, E.; Feyen, L. Global long-term observations of coastal erosion and accretion. Sci. Rep. 2018, 8. [Google Scholar] [CrossRef] [Green Version]
  9. De Muro, S.; Porta, M.; Pusceddu, N.; Frongia, P.; Passarella, M.; Ruju, A.; Buosi, C.; Ibba, A. Geomorphological processes of a Mediterranean urbanized beach (Sardinia, Gulf of Cagliari). J. Maps 2018, 14, 114–122. [Google Scholar] [CrossRef]
  10. Manca, E.; Pascucci, V.; De Luca, M.; Cossu, A.; Andreucci, S. Shoreline evolution related to coastal development of a managed beach in Alghero, Sardinia, Italy. Ocean Coast. Manag. 2013, 85, 65–76. [Google Scholar] [CrossRef]
  11. Loureiro, C.; Ferreira, Ó.; Cooper, J.A.G. Geologically constrained morphological variability and boundary effects on embayed beaches. Mar. Geol. 2012, 329–331, 1–15. [Google Scholar] [CrossRef]
  12. Ciavola, P.; Coco, G. Coastal Storms: Processes and Impacts; Ciavola, P., Coco, G., Eds.; Wiley-Blackwell: Hoboken, NJ, USA, 2017; p. 288. [Google Scholar]
  13. Haerens, P.; Bolle, A.; Trouw, K.; Houthuys, R. Definition of storm thresholds for significant morphological change of the sandy beaches along the Belgian coastline. Geomorphology 2012, 143–144, 104–117. [Google Scholar] [CrossRef]
  14. Qi, H.; Cai, F.; Lei, G.; Cao, H.; Shi, F. The response of three main beach types to tropical storms in South China. Mar. Geol. 2010, 275, 244–254. [Google Scholar] [CrossRef]
  15. Prodger, S.; Russell, P.; Davidson, M.; Miles, J.; Scott, T. Understanding and predicting the temporal variability of sediment grain size characteristics on high-energy beaches. Mar. Geol. 2016, 376, 109–117. [Google Scholar] [CrossRef] [Green Version]
  16. Gallop, S.L.; Kennedy, D.M.; Loureiro, C.; Naylor, L.A.; Muñoz-Pérez, J.J.; Jackson, D.W.T.; Fellowes, T.E. Geologically controlled sandy beaches: Their geomorphology, morphodynamics and classification. Sci. Total Environ. 2020, 731, 139123. [Google Scholar] [CrossRef] [PubMed]
  17. Trogu, D.; Buosi, C.; Ruju, A.; Porta, M.; Ibba, A.; De Muro, S. What Happends to a Mediterranean Microtidal Wave-dominated Beach during Significant Storm Events? The Morphological Response of a Natural Sardinian Beach (Western Mediterranean). J. Coast. Res. 2020, 95, 695–700. [Google Scholar] [CrossRef]
  18. De Muro, S.; De Falco, G. Handbook of Best Practices for the Study, Monitoring and Management of Sardinian Beaches; University Press—Scienze Costiere e Marine: Cagliari, Italy, 2015. [Google Scholar]
  19. Buosi, C.; Ibba, A.; Passarella, M.; Porta, M.; Ruju, A.; Trogu, D.; De Muro, S. Geomorphology, beach classification and seasonal morphodynamic transition of a Mediterranean gravel beach (Sardinia, Gulf of Cagliari). J. Maps 2019, 15, 165–176. [Google Scholar] [CrossRef] [Green Version]
  20. Syvitski, J.; Vörösmarty, C.; Kettner, A.; Green, P. Impact of humans on the flux of terrestrial sediment to the global coastal ocean. Science 2005, 308, 376–380. [Google Scholar] [CrossRef] [PubMed]
  21. Nicholls, R.J.; Cazenave, A. Sea-level rise and its impact on coastal zones. Science 2010, 328, 1517–1520. [Google Scholar] [CrossRef] [PubMed]
  22. Pilkey, O.H.; Cooper, J.A.G. Society and Sea Level Rise. Science 2004, 303, 1781–1782. [Google Scholar] [CrossRef]
  23. Campagne, C.S.; Salles, J.-M.; Boissery, P.; Deter, J. The seagrass Posidonia oceanica: Ecosystem services identification and economic evaluation of goods and benefits. Mar. Pollut. Bull. 2015, 97, 391–400. [Google Scholar] [CrossRef]
  24. Nordlund, L.M.; Jackson, E.L.; Nakaoka, M.; Samper-Villarreal, J.; Beca-Carretero, P.; Creed, J.C. Seagrass ecosystem services—What’s next? Mar. Pollut. Bull. 2018, 134, 145–151. [Google Scholar] [CrossRef]
  25. Tecchiato, S.; Collins, L.; Parnum, I.; Stevens, A. The influence of geomorphology and sedimentary processes on benthic habitat distribution and littoral sediment dynamics: Geraldton, Western Australia. Mar. Geol. 2015, 359, 148–162. [Google Scholar] [CrossRef]
  26. Tecchiato, S.; Buosi, C.; Ibba, A.; Del Deo, C.; Parnum, I.; O’Leary, M.; De Muro, S. Geomorphological and sedimentological surrogates for the understanding of seagrass distribution within a temperate nearshore setting (Esperance Western Australia). Geo-Mar. Lett. 2019, 39, 249–264. [Google Scholar] [CrossRef]
  27. De Falco, G.; Molinaroli, E.; Conforti, A.; Simeone, S.; Tonielli, R. Biogenic sediments from coastal ecosystems to beach–dune systems: Implications for the adaptation of mixed and carbonate beaches to future sea level rise. Biogeosciences 2017, 14, 3191–3205. [Google Scholar] [CrossRef] [Green Version]
  28. De Muro, S.; Batzella, T.; De Falco, G.; Porta, M. Sedimentological map of Bonifacio Strait inner shelf. Rend. Online Soc. Geol. Ital. 2010, 11, 752–753. [Google Scholar]
  29. De Muro, S.; Pusceddu, N.; Kalb, C. Sedimentological Map of the Seafloor between Porto Pozzo Bay and Capo Ferro-Ne Sardinia. Rend. Online Soc. Geol. Ital. 2010, 11, 758–759. [Google Scholar]
  30. Boudouresque, C.; Bernard, G.; Pergent, G.; Shili, A.; Verlaque, M. Regression of Mediterranean seagrasses caused by natural processes and anthropogenic disturbances and stress: A critical review. Bot. Mar. 2009, 52. [Google Scholar] [CrossRef]
  31. De Falco, G.; Budillon, F.; Conforti, A.; De Muro, S.; Di Martino, G.; Innangi, S.; Perilli, A.; Tonielli, R.; Simeone, S. Sandy beaches characterization and management of coastal erosion on western Sardinia island (Mediterranean Sea). J. Coast. Res. 2014, 70, 395–400. [Google Scholar] [CrossRef]
  32. Simeone, S.; De Falco, G.; Cosmo, S.; Olita, A.; De Muro, S. Deposition dynamics of banquettes of Posidonia oceanica in beaches. Rend. Online Soc. Geol. Ital. 2008, 3, 726–727. [Google Scholar]
  33. De Muro, S.; Batzella, T.; Kalb, C.; Pusceddu, N. Sedimentary processes, hydrodynamics and modeling of the beaches of Santa Margherita, Solanas, Cala di Trana and La Sciumara (Sardinia–Italy). Rend. Online Soc. Geol. Ital. 2008, 3, 308–309. [Google Scholar]
  34. Vacchi, M.; De Falco, G.; Simeone, S.; Montefalcone, M.; Morri, C.; Ferrari, M.; Bianchi, C.N. Biogeomorphology of the Mediterranean Posidonia oceanica seagrass meadows. Earth Surf. Process. Landf. 2017, 42, 42–54. [Google Scholar] [CrossRef] [Green Version]
  35. Passarella, M. On the Prediction of Swash Excursion and the Role of Seagrass Beach-Cast Litter: Modelling and Observations; University of Cagliari: Cagliari, Italy, 2019. [Google Scholar]
  36. Passarella, M.; Ruju, A.; De Muro, S.; Coco, G. Horizontal Runup and Seagrass Beach Cast-litters: Modelling and Observations. J. Coast. Res. 2020, 95, 143–147. [Google Scholar] [CrossRef]
  37. Simeone, S.; De Muro, S.; De Falco, G. Seagrass berm deposition on a Mediterranean embayed beach. Estuar. Coast. Shelf Sci. 2013, 135, 171–181. [Google Scholar] [CrossRef]
  38. Porta, M.; Buosi, C.; Trogu, D.; Ibba, A.; De Muro, S. An integrated sea-land approach for analyzing forms, processes, deposits and the evolution of the urban coastal belt of Cagliari. J. Maps 2020. [Google Scholar] [CrossRef] [Green Version]
  39. De Falco, G.; Simeone, S.; Solinas, G.; Batzella, T.; Cancemi, G.; Cancemi, M.; De Muro, S. Shoreline retreat and Posidonia oceanica banquette removal in the beach of Paragan (Southern Corse). Rend. Online Soc. Geol. Ital. 2008, 3, 296–297. [Google Scholar]
  40. De Falco, G.; Simeone, S.; Baroli, M. Management of Beach-Cast Posidonia oceanica Seagrass on the Island of Sardinia (Italy, Western Mediterranean). J. Coast. Res. 2008, 24, 69–75. [Google Scholar] [CrossRef]
  41. Pollard, J.; Spencer, T.; Brooks, S. The interactive relationship between coastal erosion and flood risk. Prog. Phys. Geogr. Earth Environ. 2018, 43, 574–585. [Google Scholar] [CrossRef] [Green Version]
  42. Idier, D.; Paris, F.; Cozannet, G.L.; Boulahya, F.; Dumas, F. Sea-level rise impacts on the tides of the European Shelf. Cont. Shelf Res. 2017, 137, 56–71. [Google Scholar] [CrossRef]
  43. Dolan, R.; Fenster, M.; Holme, S. Temporal Analysis of Shoreline Recession and Accretion. J. Coast. Res. 1991, 7, 723–744. [Google Scholar]
  44. Cherchi, A.; Montadert, L. Oligo-Miocene rift of Sardinia and the early history of the Western Mediterranean Basin. Nature 1982, 298, 736–739. [Google Scholar] [CrossRef]
  45. Cherchi Pomesano, A.; Pecorini, G. Ricerche geologiche e biostratigrafiche sul Campidano meridionale (Sardegna). Mem. Della Soc. Geol. Ital. 1969, 8, 421–451. [Google Scholar]
  46. Lecca, L.; De Muro, S.; Cossellu, M.; Pau, M. I Sedimenti Terrigeno-Carbonatici Olocenici Della Piattaforma Continentale Del Golfo Di Cagliari. IL Quat. 2005, 18, 201–221. [Google Scholar]
  47. Segre, A.G. Linee di riva sommerse e morfologia della piattaforma continentale italiana relativaalia trasgressione marina versiliana. Quaternaria 1969, 2, 141–154. [Google Scholar]
  48. Orrù, P.E.; Antonioli, F.; Lambeck, K.; Verrubbi, V. Holocene sea level change of the Cagliari. Quat. Nova 2004, 8, 193–212. [Google Scholar]
  49. Ulzega, A. Geomorphology and stratigraphy of late Quaternary. Rend. del Semin. Della Fac. di Sci. Dell’università di Cagliari 1995, LXV, 11–14. [Google Scholar]
  50. Deiana, G.; Melis, R.T.; Orrù, P.E.; Panizza, V. Field Trip Guidebook: Coastal and Granitic landforms of southeastern Sardinia. Cagliari-Villasimius. In 5th AIGeo National Conference, 6th Young Geomorphologists’ Day; Melis, R.T., Ed.; University of Cagliari: Cagliari, Italy, 2015. [Google Scholar]
  51. Brambilla, W. Caratterizzazione Morfodinamica Della Spiaggia del Poetto; University of Cagliari: Cagliari, Italy, 2015. [Google Scholar]
  52. De Simone, D. La bonifica della spiaggia di Bonaria presso Cagliari. In Annali dei Lavori Pubblici; Ministero dei Lavori Pubblici: Roma, Italy, 1928; Volume 6, pp. 961–996. [Google Scholar]
  53. Strazzera, E.; Cherchi, E.; Ferrini, S. Assessment of regeneration projects in urban areas of environmental interest: A stated choice approach to estimate use and quasi-option values. Environ. Plan A 2010, 42, 452–468. [Google Scholar] [CrossRef] [Green Version]
  54. Brambilla, W.; van Rooijen, A.; Simeone, S.; Ibba, A.; De Muro, S. Field Observations, Video Monitoring and Numerical Modeling at Poetto Beach, Italy. J. Coast. Res. 2016, 2, 825–829. [Google Scholar] [CrossRef]
  55. Valloni, R.; Barsanti, M. Artificial Beach Nourishment Projects in Italy. Rapp. Comm. Int. Mer Médit 2007, 38, 706. [Google Scholar]
  56. Lai, A. Studio Geomorfologico e Tendenze Evolutive del Litorale di Cagliari—Quartu Sant’Elena; Università degli Studi di Cagliari: Cagliari, Italy, 2008. [Google Scholar]
  57. De Muro, S.; Porta, M.; Passarella, M.; Ibba, A. Geomorphology of four wave-dominated microtidal Mediterranean beach systems with Posidonia oceanica meadow: A case study of the Northern Sardinia coast. J. Maps 2017, 13, 74–85. [Google Scholar] [CrossRef] [Green Version]
  58. De Muro, S.; Ibba, A.; Biondo, M.; Buosi, C.; Porta, M.; Ruju, A.; Trogu, D. Scientific Technical Support Activities Aimed at the Ecogeomorphological Supervision of the Preparatory, Executive and Post-Operam Interventions on the Poetto Beach (Cagliari, Southern Sardinia) during the Removal of Arundo donax Remains Deposited on the Backshore; Università degli Studi di Cagliari: Cagliari, Italy, 2020. [Google Scholar]
  59. Thieler, E.R.; Himmelstoss, E.A.; Zichichi, J.L.; Ergul, A. The Digital Shoreline Analysis System (DSAS) Version 4.0—An ArcGIS Extension for Calculating Shoreline Change; 2008–1278; U.S. Geological Survey: Reston, VA, USA, 2009. [Google Scholar]
  60. Del Río, L.; Gracia, F.; Benavente, J. Shoreline change patterns in sandy coasts. A case study in SW Spain. Geomorphology 2013, 196, 252–266. [Google Scholar] [CrossRef] [Green Version]
  61. Nassar, K.; Mahmod, W.; Fath, H.; Masria, A.; Nadaoka, K.; Negm, A. Shoreline change detection using DSAS technique: Case of North Sinai coast, Egypt. Mar. Georesources Geotechnol. 2018, 37, 81–95. [Google Scholar] [CrossRef]
  62. Qiao, G.; Mi, H.; Wang, W.; Tong, X.; Li, Z.; Li, T.; Liu, S.; Hong, Y. 55-year (1960–2015) spatiotemporal shoreline change analysis using historical DISP and Landsat time series data in Shanghai. Int. J. Appl. Earth Obs. Geoinf. 2018, 68, 238–251. [Google Scholar] [CrossRef]
  63. Virdis, S.G.P.; Oggiano, G.; Disperati, L. A Geomatics Approach to Multitemporal Shoreline Analysis in Western Mediterranean: The Case of Platamona-Maritza Beach (Northwest Sardinia, Italy). J. Coast. Res. 2012, 28, 624–640. [Google Scholar] [CrossRef]
  64. Ruju, A.; Passarella, M.; Trogu, D.; Buosi, C.; Ibba, A.; De Muro, S. An operational wave system within the monitoring program of a Mediterranean beach. J. Mar. Sci. Eng. 2019, 7, 32. [Google Scholar] [CrossRef] [Green Version]
  65. Stafford, D.B.; Langfelder, J. Air photo survey for coastal erosion. Photogrametric Eng. 1971, 6, 556–575. [Google Scholar]
  66. Jiménez, J.; Sánchez-Arcilla, A.; Bou, J.; Ortiz, M.A. Analysing short-term shoreline changes along the Ebro delta (Spain) using aerial photographs. J. Coast. Res. 1997, 13, 1256–1266. [Google Scholar]
  67. Boak, E.; Turner, I. Shoreline Definition and Detection: A Review. J. Coast. Res. 2005, 21, 688–703. [Google Scholar] [CrossRef] [Green Version]
  68. Moore, L.; Ruggiero, P.; List, J.H. Comparing mean high water and high water line shorelines: Should proxy-datum offsets be incorporated into shoreline change analysis? J. Coast. Res. 2006, 22, 894–905. [Google Scholar] [CrossRef]
  69. Allan, J.C.; Komar, P.D.; Priest, G.R. Shoreline Variability on the High-Energy Oregon Coast and its Usefulness in Erosion-Hazard Assessments. J. Coast. Res. 2003, 38, 83–105. [Google Scholar]
  70. Hunt, I.A. Design of Seawalls and Breakwaters. J. Waterw. Harb. Div. 1959, 85, 123–152. [Google Scholar]
  71. Genz, A.; Fletcher, C.; Dunn, R.; Frazer, N.; Rooney, J.; Fletcher, A.; Dunn, C.; Frazer, R. The Predictive Accuracy of Shoreline Change Rate Methods and Alongshore Beach Variation on Maui, Hawaii. J. Coast. Res. 2007, 231, 87–105. [Google Scholar] [CrossRef] [Green Version]
  72. Lionello, P.; Scarascia, L. The relation between climate change in the Mediterranean region and global warming. Reg. Environ. Chang. 2018, 18, 1481–1493. [Google Scholar] [CrossRef]
  73. Young, I.R.; Ribal, A. Multiplatform evaluation of global trends in wind speed and wave height. Science 2019, 364, 548. [Google Scholar] [CrossRef] [PubMed]
  74. De Leo, F.; Besio, G.; Mentaschi, L. Trends and variability of ocean waves under RCP8.5 emission scenario in the Mediterranean Sea. Ocean Dyn. 2020. [Google Scholar] [CrossRef]
  75. Bonaduce, A.; Pinardi, N.; Oddo, P.; Spada, G.; Larnicol, G. Sea-level variability in the Mediterranean Sea from altimetry and tide gauges. Clim. Dyn. 2016, 47, 2851–2866. [Google Scholar] [CrossRef] [Green Version]
  76. Legeais, J.F.; von Schuckmann, K.; Melet, A.; Storto, A.; Meyssignac, B. Sea Level, in Copernicus Marine Service Ocean State Report. J. Oper. Oceanogr. 2018, 11, S1–S142. [Google Scholar]
  77. Flor-Blanco, G.; Flor, G.; Pando, L. Evolution of the Salinas-El Espartal and Xagó beach/dune systems in north-western Spain over recent decades: Evidence for responses to natural processes and anthropogenic interventions. Geo-Mar. Lett. 2013, 33, 143–157. [Google Scholar] [CrossRef]
  78. González-Villanueva, R.; Costas, S.; Pérez-Arlucea, M.; Jerez, S.; Trigo, R.M. Impact of atmospheric circulation patterns on coastal dune dynamics, NW Spain. Geomorphology 2013, 185, 96–109. [Google Scholar] [CrossRef] [Green Version]
  79. Fairweather, P.G.; Henry, R.J. To clean or not to clean? Ecologically sensitive management of wrack deposits on sandy beaches. Ecol. Manag. Restor. 2003, 4, 227–229. [Google Scholar] [CrossRef]
  80. Ferrara, C.; Palmerini, V. Indagine sedimentologica sulla dinamica della linea di costa in facies sabbiosa nel settore centrale del Golfo di Cagliari. Boll. Della Soc. Sarda di Sci. Nat. 1974, XIV, 55–76. [Google Scholar]
  81. Volker, E. The Effect of Sedimentary Texture on Beach Fill Longevity. J. Coast. Res. 1996, 12, 447–461. [Google Scholar]
  82. Pranzini, E.; Anfuso, G.; Muñoz-Perez, J.J. A probabilistic approach to borrow sediment selection in beach nourishment projects. Coast. Eng. 2018, 139, 32–35. [Google Scholar] [CrossRef]
  83. De Muro, S.; Tecchiato, S.; Buosi, C.; Porta, M.; Bachis, M.; Ibba, A. Geomorphology, Sedimentology, Benthic Habitat as Tools For Supporting Coastal Management: Comparison Between Australian And Mediterranean Beach Systems. J. Coast. Res. 2018, 85, 1526–1530. [Google Scholar] [CrossRef]
  84. Duarte, C.M.; Kennedy, H.; Marbà, N.; Hendriks, I. Assessing the capacity of seagrass meadows for carbon burial: Current limitations and future strategies. Ocean Coast. Manag. 2013, 83, 32–38. [Google Scholar] [CrossRef]
  85. Bartole, R.; De Muro, S. Acoustic facies and seabed features of the mixed carbonate-siliciclastic deposits of the last eustatic cycle in the La Maddalena Archipelago (North Sardinia, Italy). Ital. J. Geosci. 2012, 131, 102–122. [Google Scholar] [CrossRef]
  86. Gacia, E.; Duarte, C.M. Sediment Retention by a Mediterranean Posidonia oceanica Meadow: The Balance between Deposition and Resuspension. Estuar. Coast. Shelf Sci. 2001, 52, 505–514. [Google Scholar] [CrossRef]
  87. De Falco, G.; Molinaroli, E.; Baroli, M.; Bellacicco, S. Grain size and compositional trends of sediments from Posidonia oceanica meadows to beach shore, Sardinia, western Mediterranean. Estuar. Coast. Shelf Sci. 2003, 58, 299–309. [Google Scholar] [CrossRef]
  88. De Muro, S.; Kalb, C.; Ibba, A.; Ferraro, F.; Ferrara, C. Sedimentary processes, morphodynamics and sedimentological map of “Porto Campana”. Rend. Online Soc. Geol. Ital. 2010, 11, 756–757. [Google Scholar]
  89. Tecchiato, S.; Buosi, C.; Ibba, A.; Ryan, D.A.; De Muro, S. A Comparison of Geomorphic Settings, Sediment Facies and Benthic Habitats of Two Carbonate Systems of Western Mediterranean Sea and South Western Australia: Implications for Coastal Management. J. Coast. Res. 2016, 75, 562–566. [Google Scholar] [CrossRef] [Green Version]
  90. Pusceddu, N.; Batzella, T.; Kalb, C.; Ferraro, F.; Ibba, A.; De Muro, S. Short-term evolution of the Budoni beach on NE Sardinia (Italy). Rend. Online Soc. Geol. Ital. 2011, 17, 155–159. [Google Scholar] [CrossRef]
  91. Pagán, J.; López, I.; Tenza-Abril, A.; Luis, A.; Villacampa, Y. Urban growth and beach nourishment: Experiences on the coast of Alicante, Spain. In WIT Transactions on the Built Environment Urban Growth 2018; Syngellakis, S., Melgarejo, J., Eds.; WIT Press: Alicante, Spain, 2018; Volume 179, pp. 93–102. [Google Scholar]
  92. Pagán, J.; Luis, A.; Tenza-Abril, A.; Pallarés, P. The influence of anthropic actions on the evolution of an urban beach: Case study of Marineta Cassiana beach, Spain. Sci. Total Environ. 2016, 559, 242–255. [Google Scholar] [CrossRef]
  93. Cherchi, A.; Da Pelo, S.; Ibba, A.; Mana, D.; Buosi, C.; Floris, N. Benthic foraminifera response and geochemical characterization of the coastal environment surrounding the polluted industrial area of Portovesme (South-Western Sardinia, Italy). Mar. Pollut. Bull. 2009, 59, 281–296. [Google Scholar] [CrossRef]
  94. Salvi, G.; Buosi, C.; Arbulla, D.; Cherchi, A.; De Giudici, G.; Ibba, A.; De Muro, S. Ostracoda and foraminifera response to a contaminated environment: The case of the Ex-Military Arsenal of the La Maddalena Harbour (Sardinia, Italy). Micropaleontology 2015, 61, 115–133. [Google Scholar]
  95. Buosi, C.; Cherchi, A.; Ibba, A.; Marras, B.; Marrucci, A.; Schintu, M. Preliminary data on benthic foraminiferal assemblages and sedimentological characterisation from some polluted and unpolluted coastal areas of Sardinia (Italy). Boll. Soc. Paleontol. Ital. 2013, 52, 35–44. [Google Scholar] [CrossRef]
  96. Poulos, S.; Chronis, G.; Collins, M.B.; Lykousis, V. Thermaikos Gulf Coastal System, NW Aegean Sea: An overview of water/sediment fluxes in relation to air–land–ocean interactions and human activities. J. Mar. Syst. 2000, 25, 47–76. [Google Scholar] [CrossRef]
  97. Pilkey, O.H.; Dixon, K.L. The Corps and the Shore, 4th ed.; Island Press: Washington, DC, USA, 1996. [Google Scholar]
  98. Briand, F. Transformations and evolution of the Mediterranean coastline. Ciesm Sci. Ser. 3Bull. Inst. Oceanogr. 1997, 18, 1–243. [Google Scholar]
  99. Ngom, H.; Ndour, A.; Niang, I. Impacts of Protective Structures on Sandy Beaches: Example of the Saly Balnear Station, Petite Côte, Senegal. J. Coast. Res. 2018, 81, 114–121. [Google Scholar] [CrossRef]
  100. Uda, T.; Serizawa, M.; Miyahara, S. Prediction of Typical Beach Changes Owing to Human Activities. 2018. Available online: https://www.intechopen.com/books/morphodynamic-model-for-predicting-beach-changes-based-on-bagnold-s-concept-and-its-applications/prediction-of-typical-beach-changes-owing-to-human-activities (accessed on 19 December 2020).
  101. Fanini, L.; Marchetti, G.M.; Scapini, F.; Defeo, O. Effects of beach nourishment and groynes building on population and community descriptors of mobile arthropodofauna. Ecol. Indic. 2009, 9, 167–178. [Google Scholar] [CrossRef]
  102. Gourlay, M.R. Beach Processes in the Vicinity of Offshore Breakwaters. In Proceedings of the Fifth Australian Conference on Coastal and Ocean Engineering, Perth, Australia, 25–27 November 1981; pp. 132–137. [Google Scholar]
  103. Zambrano-Monserrate, M.A.; Ruano, M.A.; Sanchez-Alcalde, L. Indirect effects of COVID-19 on the environment. Sci. Total Environ. 2020, 728, 138813. [Google Scholar] [CrossRef]
Figure 1. Geological sketch of southern Sardinia [9].
Water 12 03578 g001
Figure 2. Geographical settings of the study area (Gulf of Cagliari, western Mediterranean Sea) with: (A) wave exposure angles (referred to the N = 0°) and fetch for Poetto (yellow lines) and Giorgino (red lines) beaches. (B) Wind speed and direction from the Cagliari station of the national tidal monitoring network (location: orange star; period 2010–2015). (C) Significant wave height and direction at the National Oceanic and Atmospheric Administration (NOAA) hindcast dataset point (location: green star; period 1979–2009). Image obtained from Porta et al. [38].
Water 12 03578 g002
Figure 3. Satellite aerial image acquired over the Gulf of Cagliari showing the main transitional/fresh water bodies, the main coastal developments along the coastlines of Giorgino and Poetto and the distribution of the P. oceanica meadows obtained from [3,9] (Google Earth V 7.3.3.7786; data acquired on the 10/08/2019; data: System Integration Office (SIO), National Oceanic and Atmospheric Administration (NOAA), United States Navy, National Geospatial-Intelligence Agency (NGA), General Bathymetric Chart of the Oceans (GEBCO)).
Water 12 03578 g003
Figure 4. Schematic representation of main induced coastal currents associated with SE and SW winds at the Poetto ((a) and (b)) and Giorgino ((c) and (d)) beaches. Figures modified from [3,9].
Water 12 03578 g004
Figure 5. Maps (above) showing the spatial distribution of shoreline change envelope (SCE) and net shoreline movement (NSM) along the Poetto beach for pre-nourishment (1954–1998) (left) and post-nourishment (2003–2016) (right) years, superimposed with the limits of the four discriminated sectors (P1–P4); SCE and NSM trends (below) plotted against distance (west to east), with the x-axis showing the limits of the P1−P4 sectors. Positive values of NSM indicate areas of accretion, whilst negative values indicate areas of shoreline retreat.
Water 12 03578 g005
Figure 6. Maps (above) showing the rates of shoreline movement, expressed as end point rates (EPRs) and linear regression rates (LRRs), along the Poetto beach for pre-nourishment (1954–1998) (left) and post-nourishment (2003–2016) (right) years, superimposed with the limits of the four discriminated sectors (P1–P4); EPR and LRR trends (below) plotted against distance (west to east), with the x-axis showing the limits of the P1−P4 sectors. Positive values of indicate areas of accretion, whilst negative values indicate areas of shoreline retreat.
Water 12 03578 g006
Figure 7. Maps showing the spatial distribution of shoreline change envelope (SCE) (a), end point rate (EPR) (b) and net shoreline movement (NSM) (c) along the Giorgino beach for the years 1954–2016, superimposed with the limits of the four discriminated sectors (G1–G4); SCE, NSM, EPR and LRR trends (d) plotted against distance (west to east), with the x-axis showing the limits of the G1–G4 sectors. Positive values of NSM and EPR indicate areas of accretion, whilst negative values indicate areas of shoreline retreat.
Water 12 03578 g007
Figure 8. Comparison of Poetto beach pre-nourishment (1954–1998) and post-nourishment (2003–2016) net shoreline movement (NSM) along the coastal segment with highest recorded shoreline retreat (sector P1).
Water 12 03578 g008
Figure 9. Simplified presentation of accretion and erosion trends normalized to SCE values, showing shoreline changes in the proximity of the main human-made structures found along the Giorgino coastline: (a) protection groynes; (b) breakwaters in the proximity of Rio Santa Lucia outlet (Figure 3); (c) breakwaters along artificial water pump channel (Idrovora del Ponte Vecchio); (d) breakwaters along lagoon mouth.
Water 12 03578 g009
Table 1. Uncertainty associated with sampling errors and natural variability (units in meters).
Image YearσrσdσpσwrσtdσT
19541.031.550.70.30.712.13
19681.201.350.70.30.712.08
19770.221.430.70.30.711.78
19981.070.870.70.30.711.73
20030.171.570.70.30.711.89
20060.462.430.70.30.712.68
20100.780.830.70.30.711.54
20130.841.790.70.30.712.23
20160.000.590.70.30.711.20
Table 2. Summary of the results showing the calculated mean, min and max values for all of the statistical parameters.
Poetto Pre-Nourishment (1954–1998)
SCE (m)NSM (m)EPR (m/y)LRR (m/y)
MeanMinMaxMeanMinMaxMeanMinMaxMeanMinMax
P19.983.6820.25−7.63−20.25−1.65−0.17−0.46−0.04−0.19−0.45−0.07
P210.563.7116.273.21−6.9414.940.07−0.160.340.05−0.120.28
P36.711.2311.06−3.23−10.988.18−0.07−0.250.19−0.07−0.240.20
P441.773.3377.6039.52−7.6977.600.90−0.171.760.89−0.161.68
Poetto Post-Nourishment (2003–2016)
SCE (m)NSM (m)EPR (m/y)LRR (m/y)
MeanMinMaxMeanMinMaxMeanMinMaxMeanMinMax
P138.1511.0555.39−38.02−55.39−9.33−2.92−4.26−0.72−2.69−3.76−0.89
P210.471.9924.625.21−10.0417.750.40−0.771.370.35−0.921.28
P35.651.0311.63−3.03−6.865.16−0.23−0.530.40−0.31−0.610.29
P47.742.0017.563.68−3.4013.080.28−0.261.010.18−0.500.95
Giorgino (1954–2016)
SCE (m)NSM (m)EPR (m/y)LRR (m/y)
MeanMinMaxMeanMinMaxMeanMinMaxMeanMinMax
G144.1210.02111.27−31.46−110.7520.77−0.51−1.790.34−0.47−1.760.44
G230.009.4348.0512.26−9.3143.070.20−0.150.690.20−0.330.80
G340.6313.1757.56−20.03−28.63−0.21−0.32−0.460.00−0.50−0.61−0.05
G438.9613.2472.8532.660.6565.280.530.011.050.47−0.041.14
Publisher’s Note: MDPI stays neutral with regard to jurisdictional claims in published maps and institutional affiliations.

