Review

Baseline Water Temperature: Estimation of the Annual Cycle of Surface Water Temperature in Lakes in North-Central Poland over the 1951–1968 Period

by
Andrzej Hutorowicz
Hydroacoustic Laboratory, Stanisaw Sakowicz Inland Fisheries Institute, Oczapowskiego 10, 10-719 Olsztyn, Poland
Water 2020, 12(12), 3574; https://doi.org/10.3390/w12123574
Submission received: 3 December 2020 / Revised: 16 December 2020 / Accepted: 17 December 2020 / Published: 19 December 2020
(This article belongs to the Section Water Quality and Contamination)

Abstract

:
Water temperature is an important ecological variable that affects the functioning of lakes. Unfortunately, for many lakes there are no long-term observations enabling the assessment of changes in water temperatures. This makes it difficult to include this aspect in research into the biology, ecology and chemistry of such lakes. This paper presents a literature review related to changes of surface water temperatures in lakes and in particular describing the response of water temperatures and stratification to changing climate in Polish lakes. On this basis, a model based on the available data on water temperature in 931 Polish lakes in the years 1951–1968 was proposed, which allows to estimate the baseline water temperature on any day of the year. This model is calculated using the complementary error peak function on the 0–3 m water temperature dataset, which provides the best reduction of diurnal temperature fluctuations. It can be an alternative to the average temperature of surface waters, which are calculated on the basis of systematically collected data. Based on the average water temperature data obtained from 56 thermal profiles in 10 lakes in 2010–2019, the equation was analogically calculated. The average monthly water temperatures in June, July, August and September and the change in water temperature (0.24–0.30 °C decade−1) in the period 1951–1968/2010–2019 were estimated then. Similar regional or single lake trends have been found in studies by other authors covering a similar or longer period of time. The proposed method, which is suitable for simulating temperatures, especially in summer, enables the determination of the value of changes in surface water temperature in Polish lakes when only thermal profiles data from different dates are available, which can be especially helpful when analyzing hydrobiological results.

1. Introduction

Direct and indirect relationships of water temperature and limnological phenomena are numerous and fundamental to the course of biological and chemical processes, as well as to the hydrological cycle [1]. Water temperature is one of the most important abiotic factors which decide the functioning of the lake ecosystem [2,3]. It has a decisive impact on the metabolic rate, shapes sedimentation conditions and affects the number of dissolved gases in water, formation and course of ice phenomena as well as the quantitative and species diversity of flora and fauna [3,4]. This issue becomes particularly important when significant climate change can be observed, which poses a particular threat to lakes [5,6]. Poff et al. [7] claimed that global warming is rapidly transforming aquatic ecosystems. Adrian et al. [5] and Richardson et al. [6] confirmed this by pointing out that the physical, chemical and biological properties of the lakes respond quickly to climate change. Numerous studies have shown that global warming causes changes in the thermal regime of lake waters and ice phenomena [8], including an increase in water temperature in epilimnion [9,10,11,12], an increase in the strength of stratification [13,14], an extension of the stratified period [12,15,16], changes in thermocline depth [17], earlier heating of water in spring, an extension of the summer and an increase in water loss due to evaporation [18,19,20,21,22,23]. There are more and more reports emphasizing the impact of short-termextreme meteorological events (e.g., heat waves and heavy rain) on species-specific changes in the phytoplankton communities in the lakes i.e., biovolumes of individual systematic groups, especially chlorophytes and the filamentous cyanobacterium (e.g., [24]).
Since the mid-19th century, the climate has warmed in Poland [25]; however, in the 1980s and 1990s, the pace of this process clearly increased [26,27,28]. In the 1951–2010 period, the annual air temperature in Poland significant increased, with an average rate of change exceeding 0.2 °C per decade [29]. Significant increases of the number of hot days in summer and the number of tropical nights in a year and distinct changes in the duration of heat waves were also noted [30]. There was also a fairly clear trend of precipitation increase in the northern part (in Pomerania and the Coast) and on the south-eastern edges of Poland, a systematic decrease in the sum of precipitation in the central and southern parts of the country, as well as a change in the number of sunny days with rainfall and rainfall efficiency [31]. Climate changes were also accompanied by changes, noted in the literature, in the thermal regime of lake waters in Poland [32,33].
Despite the enormous role of lakes in the Polish landscape and the potential effects of global warming, it can be concluded that relatively few systematic and long-term in situ lake temperature datasets exist for the area. These types of observations have been conducted as part of the nationwide observation network since 1956. Initially, however, they covered only two lakes, at the end of the 1960s they covered nine lakes, in the 1980s and 1990s they covered 36 lakes and at the beginning of the 21st century 29 lakes [23,34]. Water temperature measurements are taken in the coastal zone (at a depth of 0.4 m, most often from platforms) once a day at 7:00 (6:00 GMT) [3,35]. Literature also signals several days, several months or even several years of data gaps caused by breaks in measurements [23]. Therefore, long-term analyses are few and include a small number of lakes [23,32,33,34]. They were used, inter alia, to determine the directions and values of surface water temperature changes, similarities and differences in thermal conditions as well as the pace and direction of climatic changes and non-climatic factors determining water temperature in Polish lakes [32,34,35]. Alternatively, attempts were made to assess water temperature changes in lakes using a model of surface water temperature forecasts based on their heat balance. These studies were carried out in the 1970s and concerned lakes heated by discharges of heated water from combined heat and power plants [36]. Changes in water temperature in heated lakes were also attempted to be determined by reference to the water temperature in a nearby lake with a natural thermal regime [37,38].
The studies of surface water temperature in Polish lakes so far have shown that the temperature differences between the coastal zone and the open water zone (pelagic zone) during spring and summer can even reach 3.0 °C–3.5 °C, although most often, these differences range from 0.8 °C to 1.5 °C [35], which indicates that the results of the research conducted so far should not be used as a basis for assessing water temperature changes in the central part of the lakes.
The possibility of assessing the differences in thermal conditions in the pelagic zone of lakes from typical conditions in a given area becomes particularly important in connection with progressive climate changes, as changes in the thermal regime and water stratification can have significant ecological consequences affecting processes and water quality in lake systems [39]. Water temperature is one of the abiotic parameters, which is constantly measured during experimental hydrobiological investigations, in which measurements in a given water body are made several times a year at random time of day.
Therefore, the aims of this review paper are: (1) to provide an overview of the current research (2) to establish a curve describing the changes in water temperature in lakes located in a specific geographical region, which can be used as a reference point in the assessment of thermal conditions in lakes for which there are no systematic collected data. This would make it possible to consider the aspect of climate change in hydrobiological studies, e.g., by comparing the water temperature recorded during these studies (in thermal profiles) with the averaged data from this baseline, which illustrates the annual cycle of water temperature in Polish lakes before strong climate change during the second half of the 20th century.

2. Current Research State

The surface of the lakes shows a distinct cycle of temperature changes throughout the year in most climatic zones on Earth. According to Imberger and Patterson [40] and Boehrer and Schultze [41], the main causes of these changes are: thermal contact with the atmosphere, widespread exposure of lakes and the atmosphere to the seasons, resulting from changes in the incoming solar radiation. The exchange of heat across the air–water interface is one of the key factors influencing the temperature of a water body [42,43].

2.1. Lake Surface Water Temperature Long-Term Trends

The rate of increase of the average annual surface water temperature in the lakes of Europe and the world is defined in the range of 0.21–0.54 °C decade−1 (Table 1). O’Reilly et al. [11] have shown that warming is widespread and shows clear regional variation. Moreover, research shows that the warming of surface waters in lakes is not uniform throughout the year. Hampton et al. [44] showed that over 60 years in Lake Baikal, changes are most visible in surface waters (0 m) in summer and autumn (average temperature increase by about 0.20 °C decade−1, and in summer by 0.38 °C decade−1). Between 1970 and 2002, the waters of Lake Tahoe warmed the most in October [45]. According to Straile et al. [46], some ice-free lakes in Europe experience strong warming in winter. The analysis of the average monthly surface water temperature in the seven largest lakes in Latvia showed that a statistically significant positive trend could be observed in July in only two lakes (Liepājas, Rāznas) and in August in four lakes [47]. The research of Ptak et al. [32] showed that the highest rate of water temperature increase in the years 1972–2016 in the 14 lakes studied was recorded in May (average −0.74 °C decade−1; median −0.71 °C decade−1), while the lowest rate of increase was recorded in January (average −0.16–0.71 °C decade−1; median −0.19–0.71 °C decade−1). From June to August, the temperature increase (median 0.47 °C decade−1, 0.48 °C decade−1, 0.50 °C decade−1 and 0.40 °C decade−1, respectively) was similar to the annual change of the average temperature in these lakes (0.43 °C decade−1). The study of six Polish lakes has shown that in the summer, in the ‘10-day’ periods, it is possible to observe not only the variability of values, but also different directions of temperature trends. In the years 1961–2000, despite the general increase in water temperature in the third decade of June, in all tested lakes (and three also at the end of July) a negative 40-year mean trend in water temperature (from −0.012 °C to −0.044°C) was observed [48].
The study of water temperature changes in 14 Polish lakes in 1972–2016 showed that the greatest variability of trends (mean difference 0.59 °C decade−1) of water temperature changes between the 14 lakes studied was observed in November, December, May, June and September, while much lower variability was observed in January, February and August—on average 0.29 °C decade−1 [32]. Similar values of the trend in June, July, August and September in 28 lakes located in the Polish lowlands in the years 1971–2010 (Table 2) were also shown by Sobolewski et al. [34]. A comparison of the value of the trend of water temperature changes in the years 1961–2000 and 1971–2010 in four Polish lakes shows that the effect of rapid climate warming reveals higher values of the trend calculated from the data collected in these 40-year periods, which are shifted in relation to each other by only 10 years (Table 2).

2.2. Variability of Water Temperature in the Yearly and Daily Cycle

Four periods can be distinguished in the thermal regime of surface waters in the middle of the 20th century [44]: two periods of clear stabilization of water temperature (winter and summer) and two periods of large changes (spring and autumn) can be distinguished [22].
Winter, which lasted from December to March, was characterized by a stable water temperature in the range of 0–2 °C and low inter-day amplitudes. In the spring (April–May), a sharp increase in temperature and large amplitudes, up to 8 °C, were observed. Summer thermal stratification occurs when the water temperature in the surface layer (up to 1 m) exceeds 6–8 °C and shows large daily increases. In summer (June–August), the temperatures were relatively stable, in the range of 17–20 °C, and the amplitudes were smaller, down to 5 °C. In autumn (September–November), the temperature dropped to the winter minimum and the amplitudes were moderate. The minimum temperature was observed in January or February, and the maximum temperature was observed in July, less frequently in August [55]. Further heating of the water and its mixing (caused mainly by wind waves) resulted, in a relatively short time, an emergence of the overheated layer reaching up to 2–3 m depth (sometimes more) and a thermal jump in a layer of low thickness. In this phase of water thermal stratification formation, there may be clear differences in the position of the thermocline [23]. However, the lower limit of the thermocline is more stable than its upper limit [32]. The location of the thermocline and the thickness and depth of occurrence during the summer depends on many factors. Nevertheless, particularly important are the morphometric features (especially surface and depth) of lakes [56], wind action [22,46,57,58,59,60] and the variability of weather conditions [2,34]. This is evidenced by differences in location and thickness of the thermocline and thermal gradients during the summer stagnation in different years [34]. Research on the thermal structure of water at various points of the lakes, with different thermal properties and mictic conditions of water masses, showed clear differences in the location of the thermocline, especially its upper layer, throughout the year [34].
A characteristic feature of all water reservoirs are the clear daily temperature cycles arising during sunny and windless weather, especially during days with insolation lasting approximately (and more than) 10 h [35]. In the summer, the temperature rise period begins between 6:00 and 7:00 and lasts until between 13:00 and 14:00, followed by a slow decline. In the daily course of surface water temperature, its highest values are recorded between 15:00 and 18:00, while its lowest values are most often recorded at 5:00 and 7:00 [35]. In deeper layers, the water temperature reaches a daily maximum later than on the surface, while the minimum is reached almost simultaneously. Around 10:00 and 23:00, the water temperature is closest to the average daily value [2,35]. The daily temperature amplitude in the pelagic zone of the lakes, depending on the meteorological conditions, can be 0.5°C–1.9°C during the summer [35,61]. In the daily cycle, the maximum difference in favor of the temperature of the littoral zone was recorded most often from 10:00–11:00 to 21:00–22:00, with the maximum between 15:00–16:00 [35].
Long-term observations carried out in carp ponds located in southern Poland have shown that the daily temperature amplitude is clearly dependent on the absorbed solar radiation, heat loss due to evaporation, water circulation caused by winds and depth, and decreases exponentially along with the average depth. The extreme values of water temperature in the daily cycle in the ponds are recorded at about 6:00 and 14:00, while the values closest to the daily average can be obtained by measuring the temperature at 10:00 or 23:00. However, the moment when the maximum water temperature appears depends on the weather conditions. During sunny weather, the temperature closest to the daily average value appears earlier, around 9:00 and 22:00 [2].

2.3. Surface Layer in the Lake

According to Skowron and Piasecki [35], there is a layer of water on the lake with a thickness of 1.0–1.5 m, which can be called the “the surface layer in the lake.” Measurements taken at a depth of 0.4–0.6 m best reflect the nature of the diurnal and seasonal course of water temperature [62]. The published characteristics of the thermal relations of Polish lakes show that the annual sinusoidal temperature course is most distinct in the surface layer up to several meters thick [22,34,35]. Daily fluctuations at a depth of 1 m may exceed 1.5 °C. In Lake Ewingi at the end of June 1958, they reached 1.9 °C [61], and 2.0 °C on August 19/20, 1949 in Lake Niegocin [63].
In Lake Niegocin, the daily minimum was recorded at 6:00, and the maximum at 17:00 [63], but measurements in Lake Ewingi at two locations at different depths showed significantly different hours for the minimum and maximum daily temperatures recorded: on the shallower stand at 11:00 and 19:30, respectively, and on the deeper stand at 09:15 and 17:00 [61].
The study of the temperature in the vertical distribution in two lakes, polymictic and bradymictic, which was carried out in the summer period of stratification (July and August), allowed to observe that the greatest change in daily temperature, at an amplitude of 2.5–3.5 °C, occurred at a depth of 4–8 m [35]. According to these authors, these statements confirmed changes in the number of water temperature pulsations with an amplitude greater than or equal to 0.5 °C, which were measured at hourly intervals at depths of 0.5 m, 1 m, 2 m, 4 m, 6 m and 8 m in three lakes from 15 July to 15 August 2005. In the layer with a depth of 0.5 to 4 m, pulsations were observed from April to September, and their number was clearly greater at a depth of 4 and 6 m than in the shallower water layer (Figure 1) [35]. The differences in the number of pulsations at the depth of 2 m and 4 m were significantly different from each other (p < 0.001).
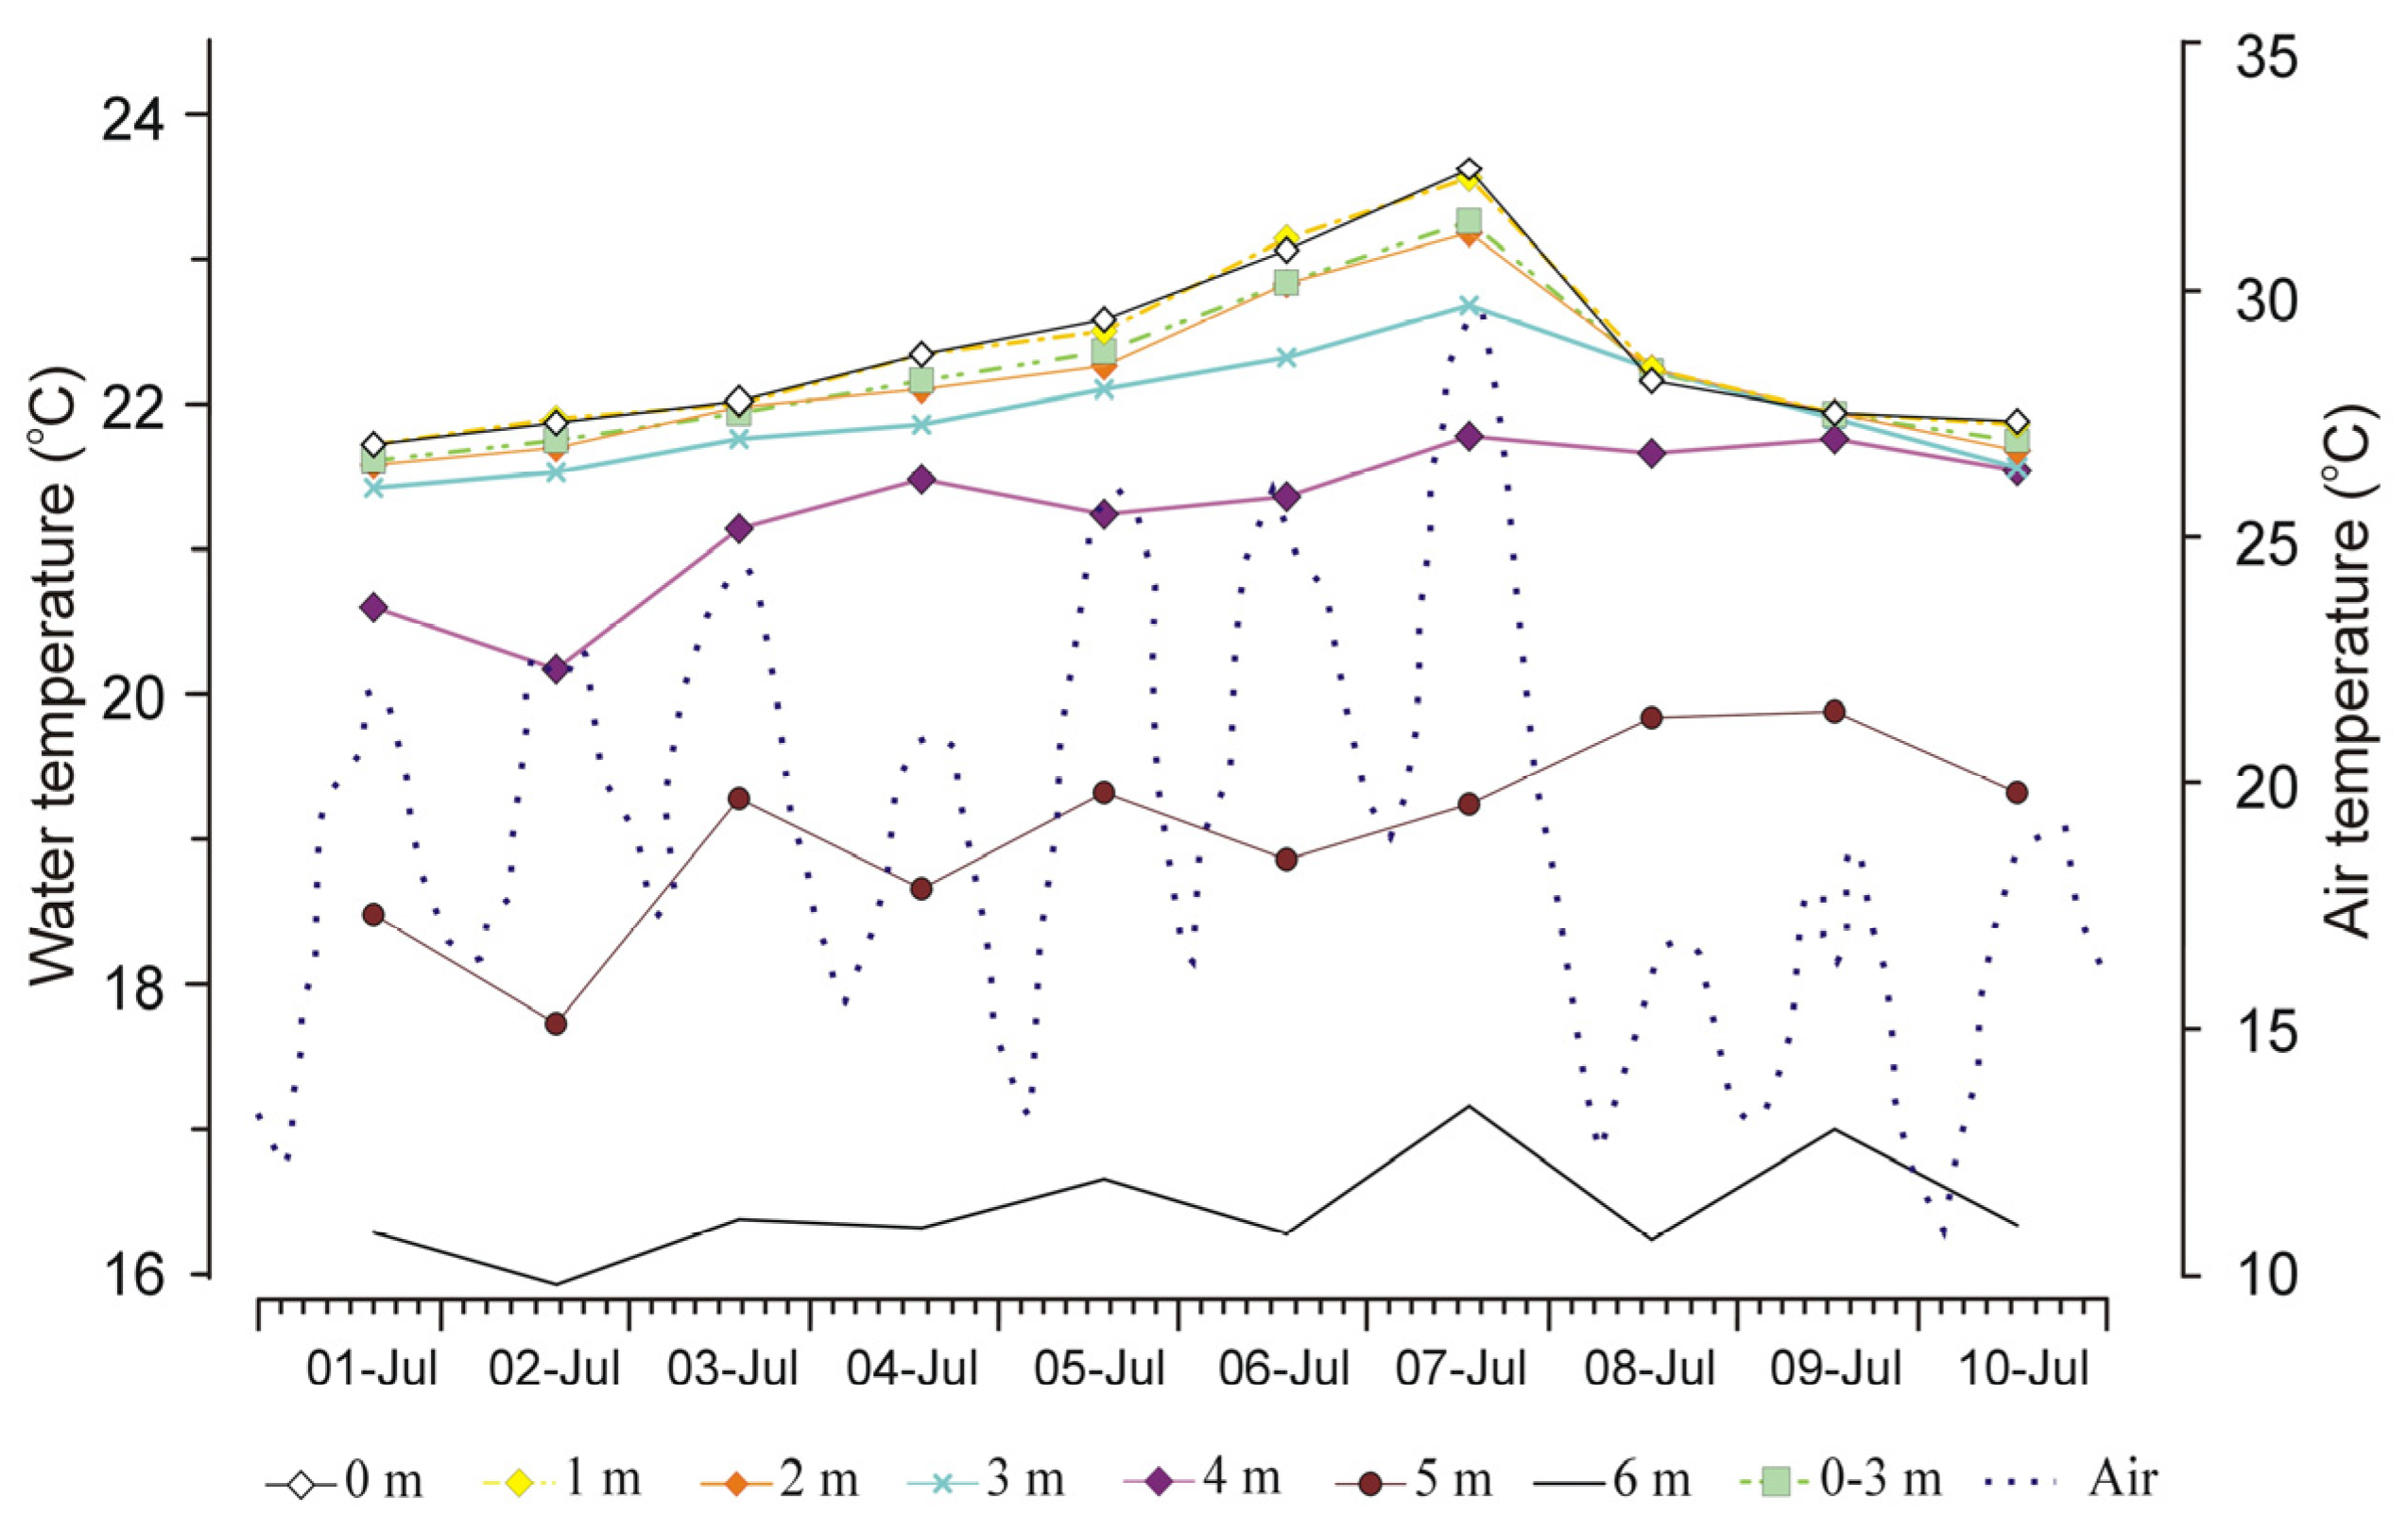
Similar relationships were noted by Chojnowski [55] in the gutter Lake Ślesińskie in the first decade of July 1969, i.e., when the lake retained its natural thermal conditions. (Measurements were made every 1 m deep at five stations that were located along the long axis of the lake, in places of varying depth from 13.7 to 25.7 m). Changes in the average water temperature at depths of 0 m, 1 m, 2 m and 3 m were in line with the air temperature change trend (Figure 2). In the deeper layers of the water, this trend was much less noticeable. The greatest amplitude of temperature fluctuations (above 2.1 °C) was recorded at a depth of 5 m [55]. Carried out on the basis of the data of Chojnowski [55], an analysis of the concordance of the preferential series using the Kendall concordance coefficient τ showed that the temperature changes in the water layers from 0 m to 3 m were co-monotonic (from 0 m to 2 m all values τ > 0.8 with p < 0.01, for 3 m τ > 0.78 with p < 0.05). On the other hand, the Kendall test showed a low agreement of temperature changes in the 0–3 m layer and at depths of 4 m and 5 m (τ < 0.54 with p > 0.06).
Based on the above, it can be assumed that the water temperature in the 0–3 m layer is the most appropriate basis for determining the baseline.

3. Baseline of Water Temperature

3.1. Selection of the Function Best Suited to the Annual Cycle of Water Temperature Change

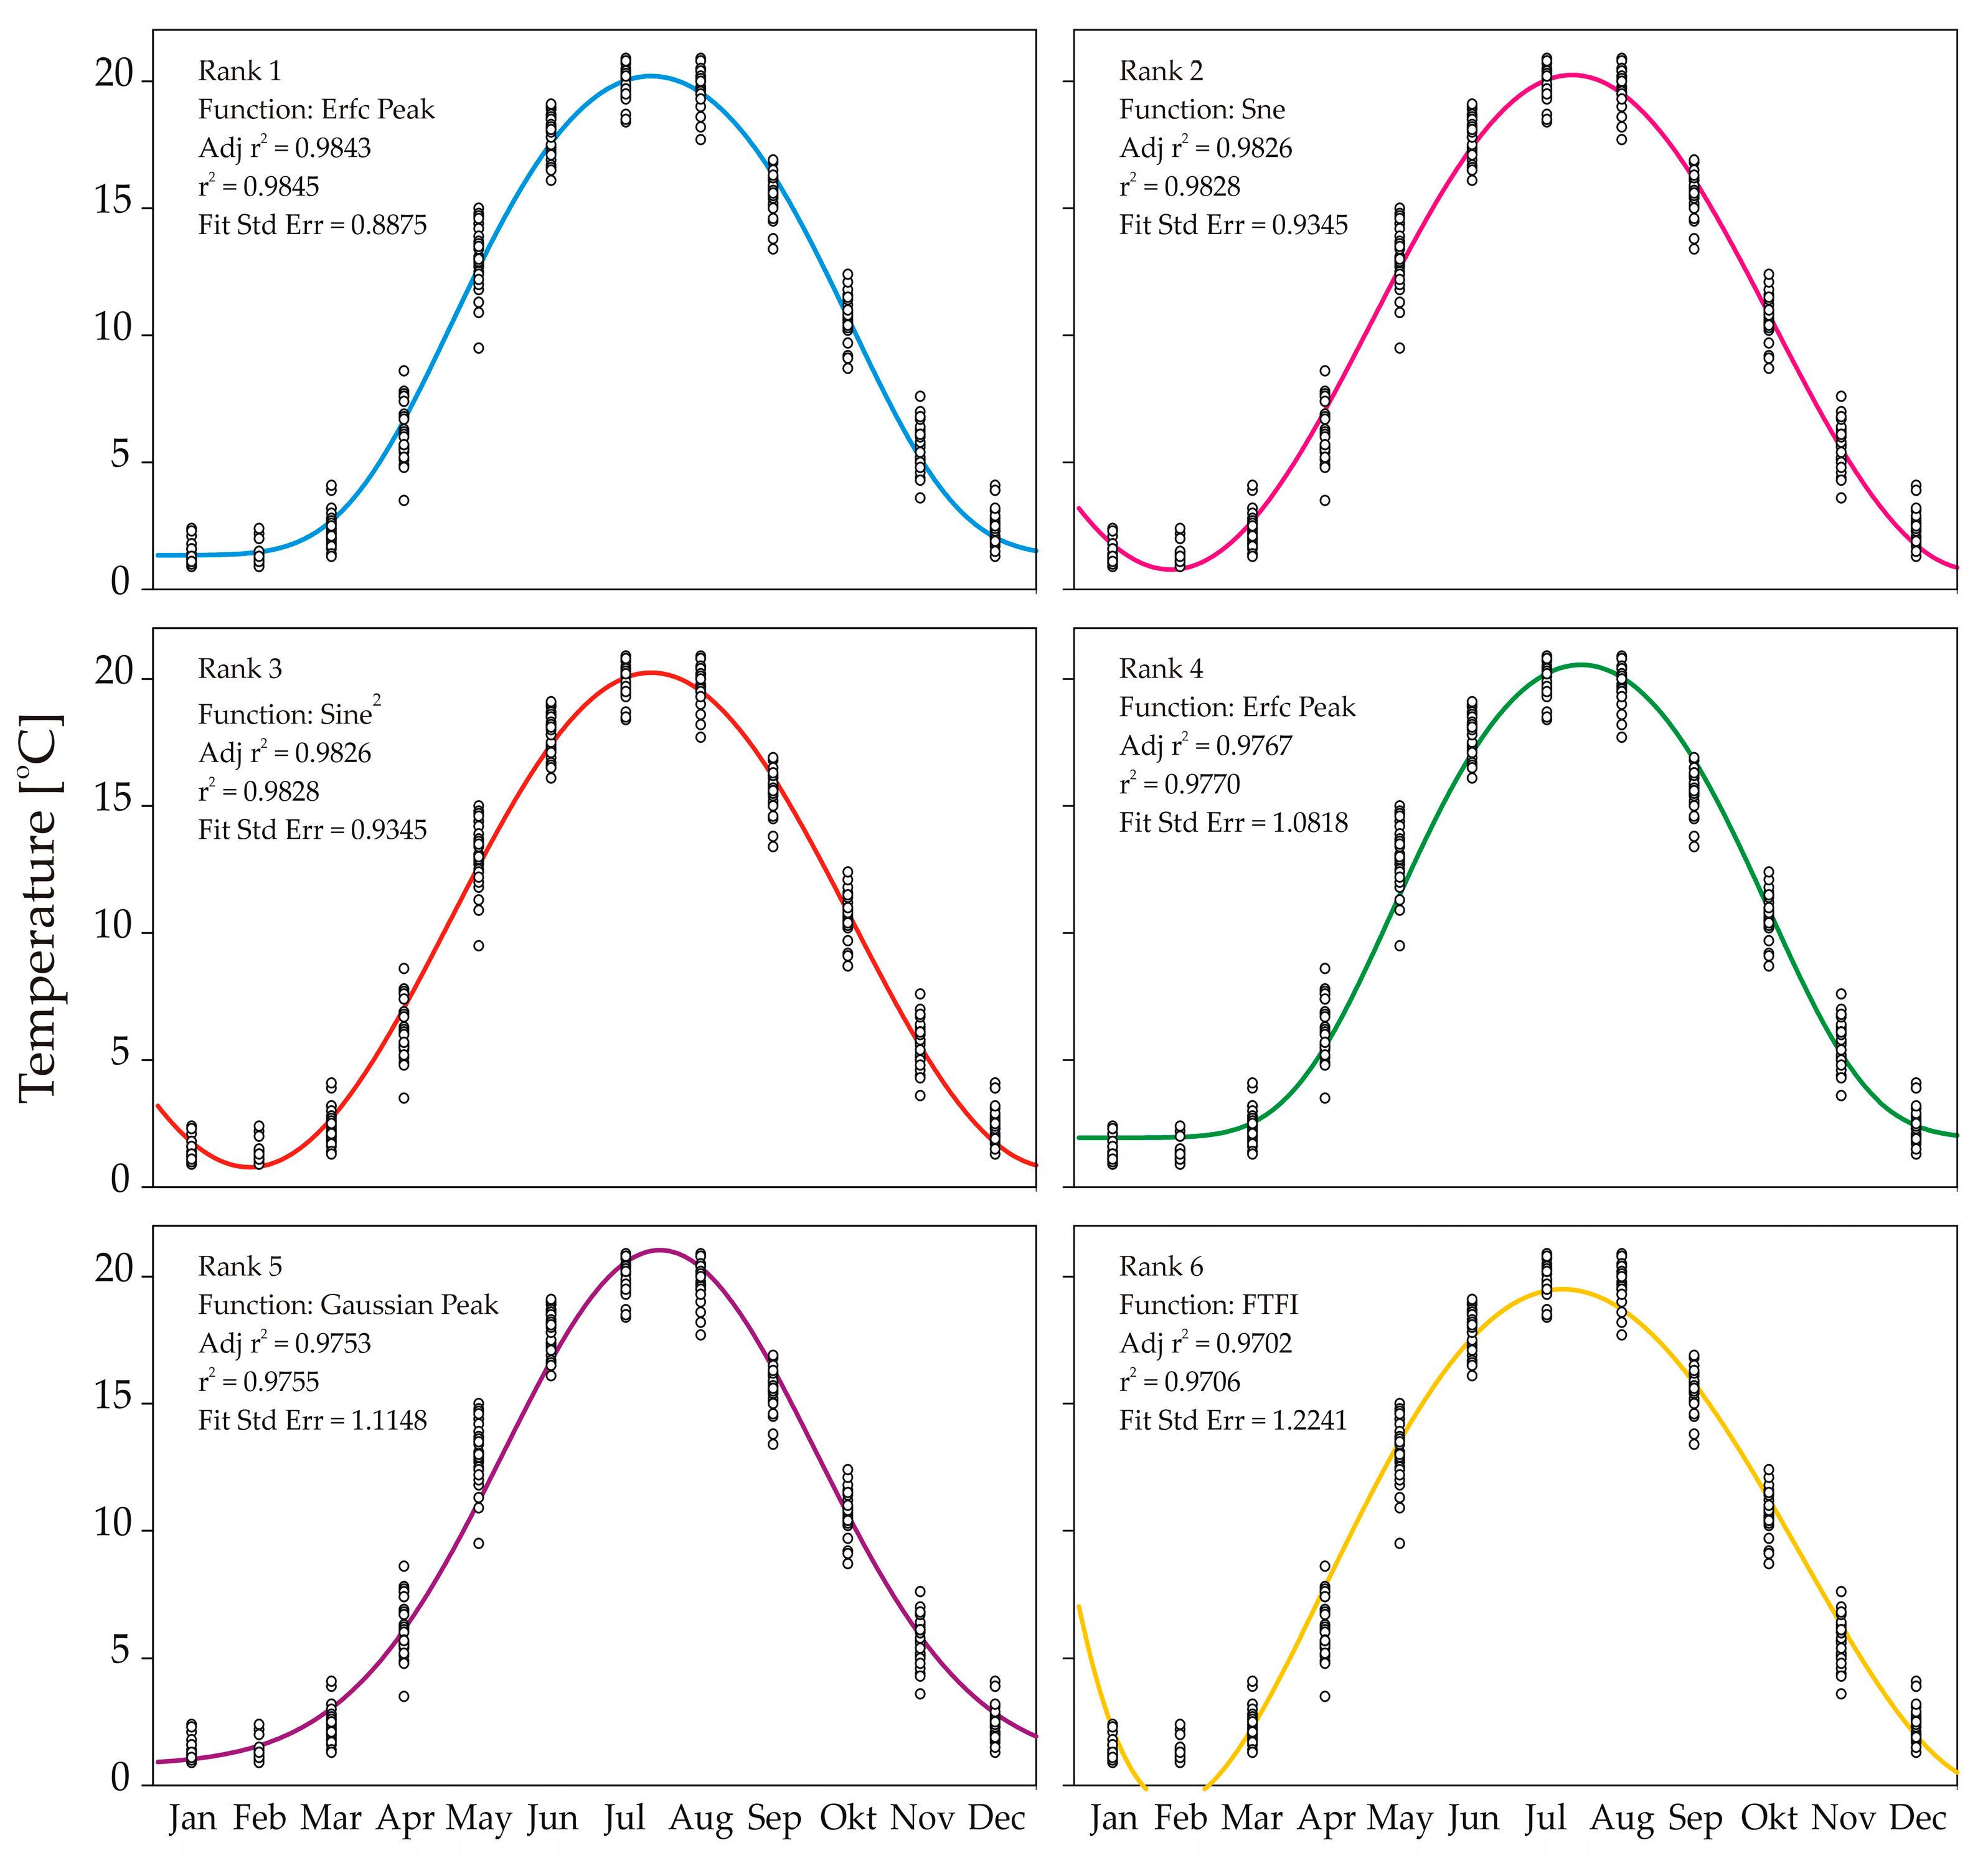
An extremely important aspect of the analyses related to the determination of the baseline of temperature is the selection of an appropriate curve describing the annual cycle of water temperature changes in lakes of the temperate climate zone. Investigations of the thermal conditions of water carried out on Polish lakes with different morphometric properties have shown that the annual temperature course in these reservoirs has a distinct seasonal cycle with a sinusoidal rhythm [32,34,35]. The sinusoidal course of water temperature throughout the year is apparently preserved in the surface layer up to several meters thick [34,35]. This suggests the type of curve that should best reflect the annual cycle of changes in the thermal regime of the lakes. However, a 2000 curve fitting procedure was performed to indicate the most appropriate curve type. The calculations were based on the data published by Sobolewski et al. [34]. They included the average monthly water temperature in the years 1971–2010 in 30 Polish lakes. The adjustment to these data was assessed on the basis of the DOF adjusted r2, which was the sort criterion [64]. The best fit for the variables (rank 1) was shown by one of the possible curves of the complementary error function peak (CEFP) (Figure 3). The calculations were performed with TableCurve v. 3.11 software [64].
In order to check whether the calculated values are consistent with the average monthly surface water temperature (°C) in Polish lakes in the years 1971–2010, calculated on the basis of the values given by Sobolewski et al. [34], the values were checked for a Pearson product moments correlation. Table 3 shows this (slightly) deterioration in the level of correlation when estimating the temperature with the use of successive mathematical formulas from the ranking in Figure 3. Based on the above, it can be assumed that the CEFP function is most suitable for the baseline estimation of the surface water temperature in lakes.

3.2. Water Temperature Data

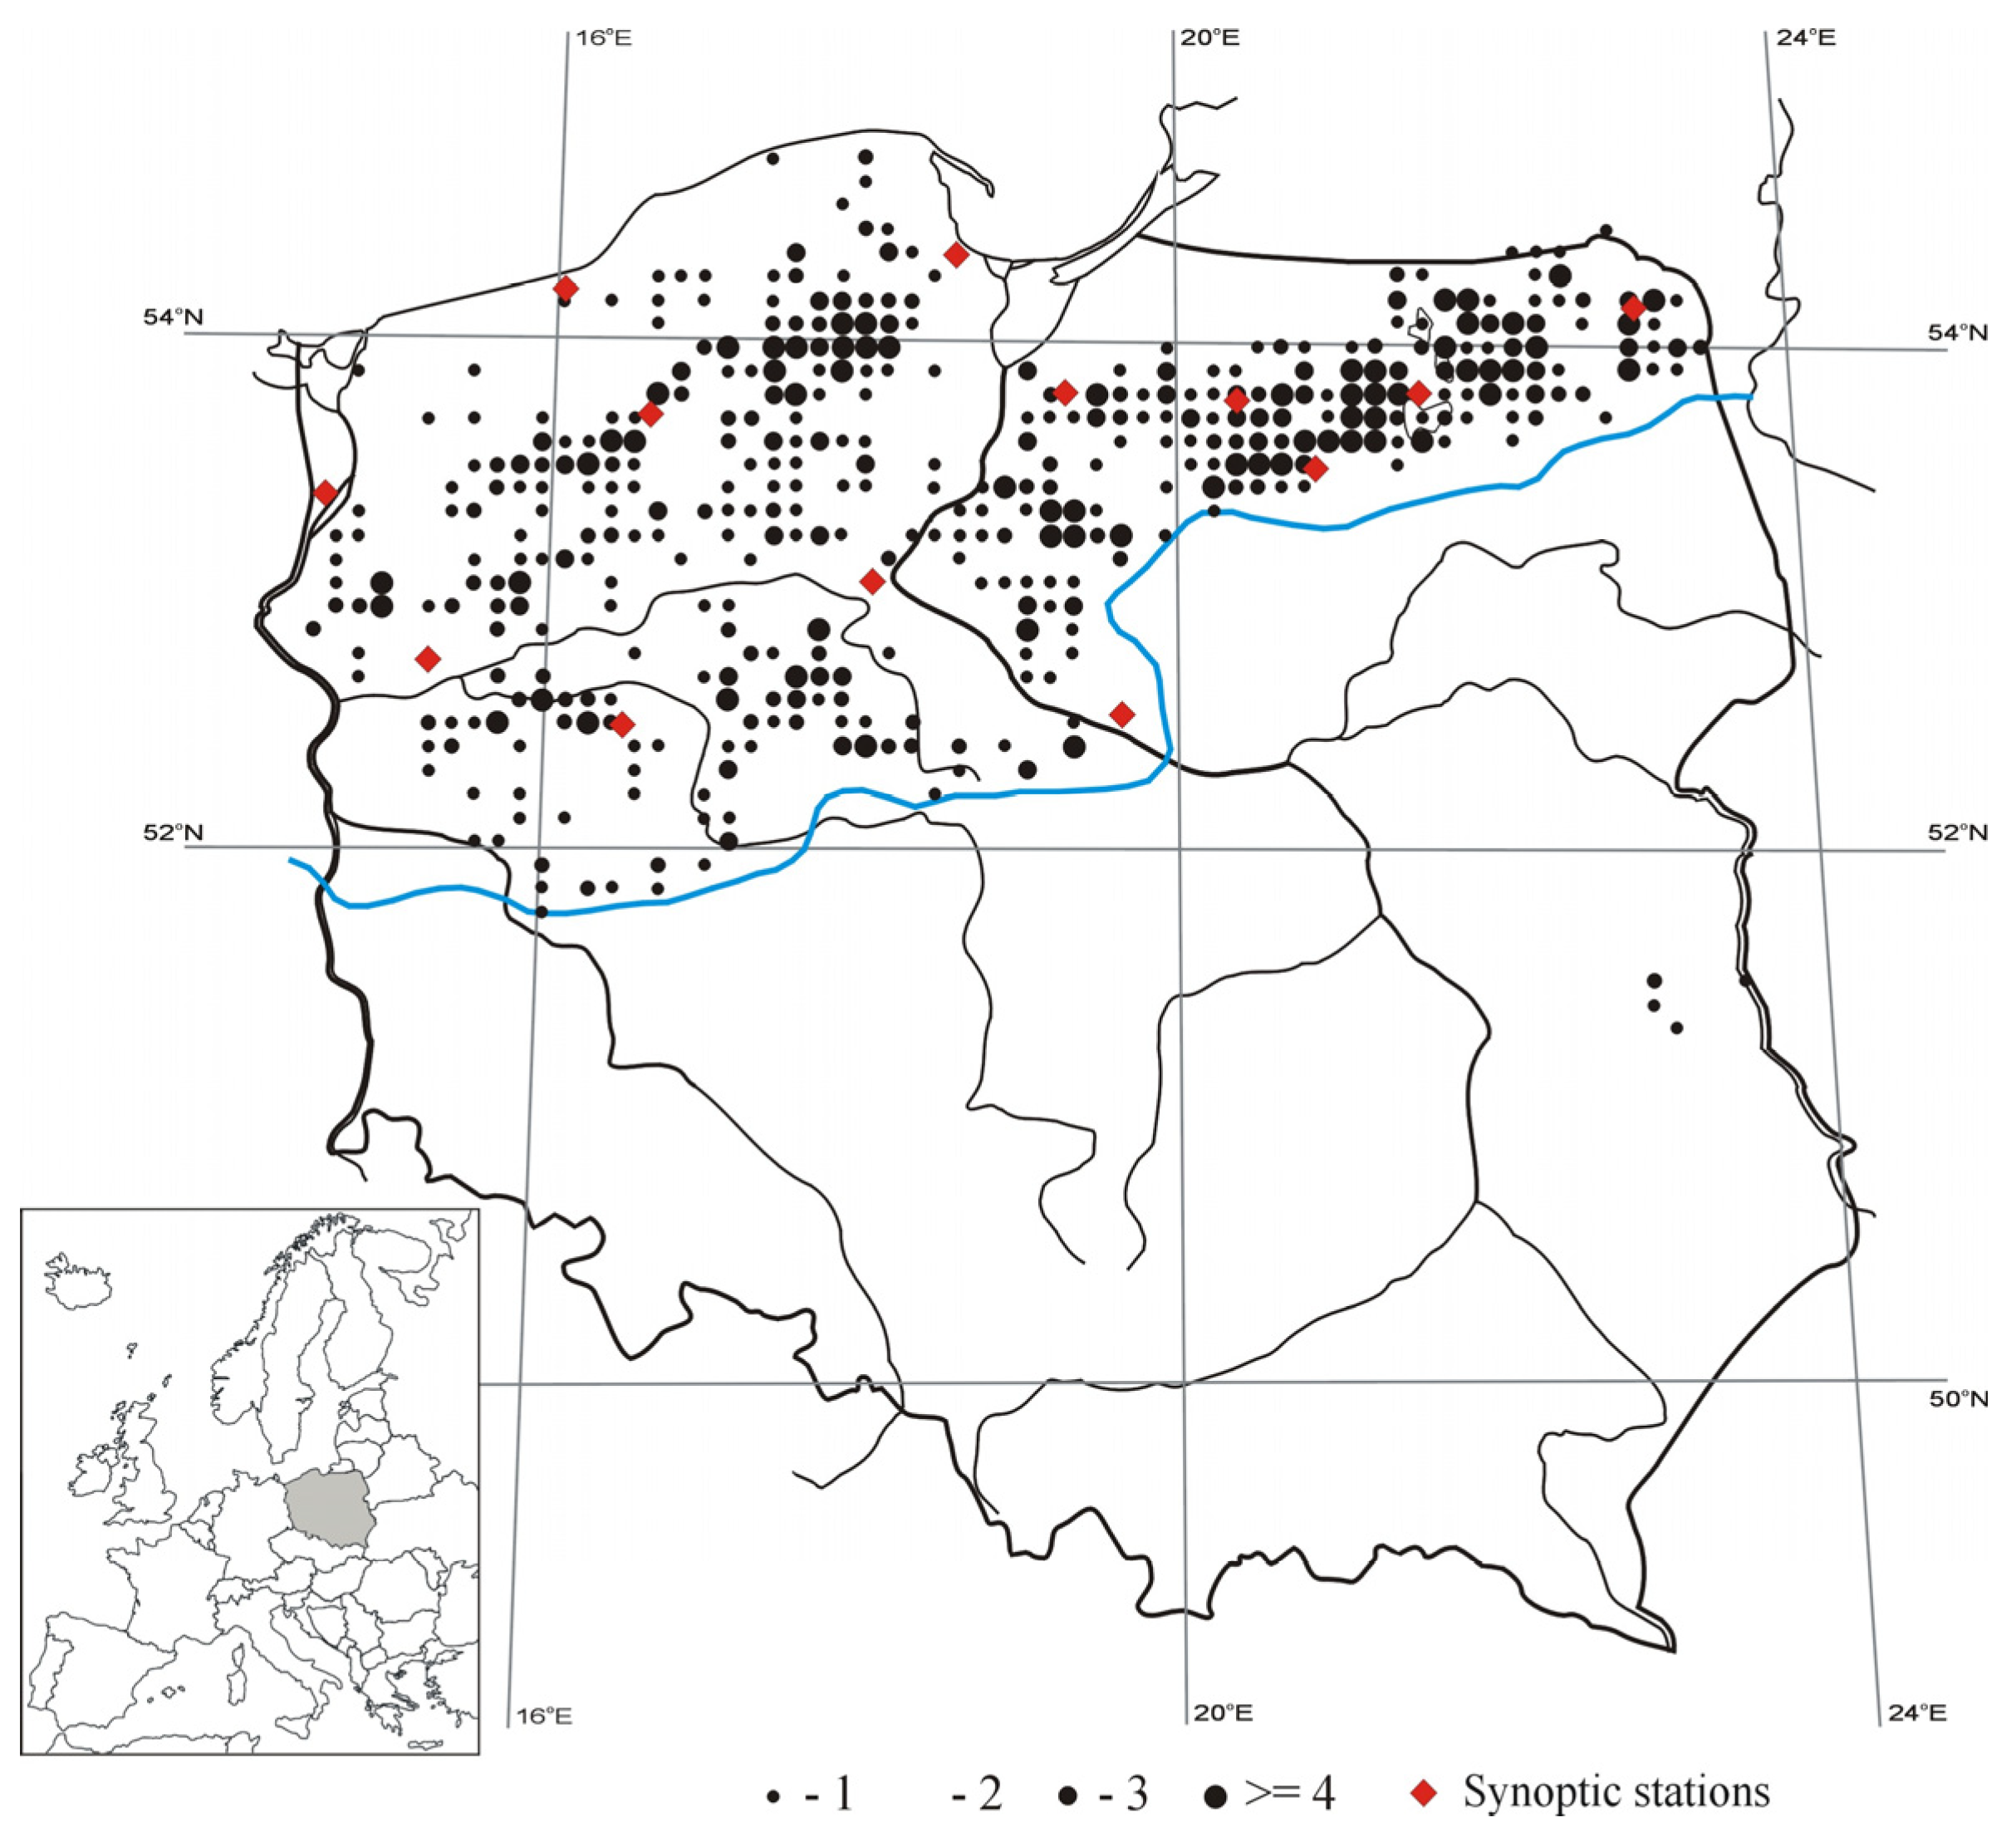
The analyses were based on the temperature profiles for 931 lakes from Poland in 1951–1968, which are located north of the Baltic glaciation range line (from 14°21′ to 23°30′ E and 51°51′ to 54°49′ N). According to Choiński [65], there are 6793 lakes in this area with an area of more than 1 ha, which is over 95% of all lakes in Poland with this area (Figure 4). The 931 lakes covered by the research have a wide range of sizes (from 3.0 to 11 340.4 ha), and the maximum depth is from 5.0 to 65.0 m (based on data from the Inland Fisheries Institute in Olsztyn). The maximum depth of almost 76% of these lakes did not exceed 20 m, and only 5% were deeper than 40 m. Among the examined lakes, the most numerous were reservoirs with an area of 50−100 ha (38%), and the least numerous were large and small lakes (about 2% each).
Most of the data on the water temperature come from measurements made by the Inland Fisheries Institute in Olsztyn in the years 1953−1968 during research related to the development of the fishing economy of Polish lakes. These data are documented in tables of assumptions for the fisheries management of these studied lakes, and a set of these studies is stored in the Library of the Inland Fisheries Institute. Water temperature was measured randomly during the day at the deepest point of the lakes, with an accuracy of about 0.1 °C using thermometers placed inside Ruttner or Patalas samplers [57]. In the water layer from 0.3 to 15 m, the temperature was measured every 2.5 m, but in the thermocline area every 1 m, and below 15 m—every 5 m.
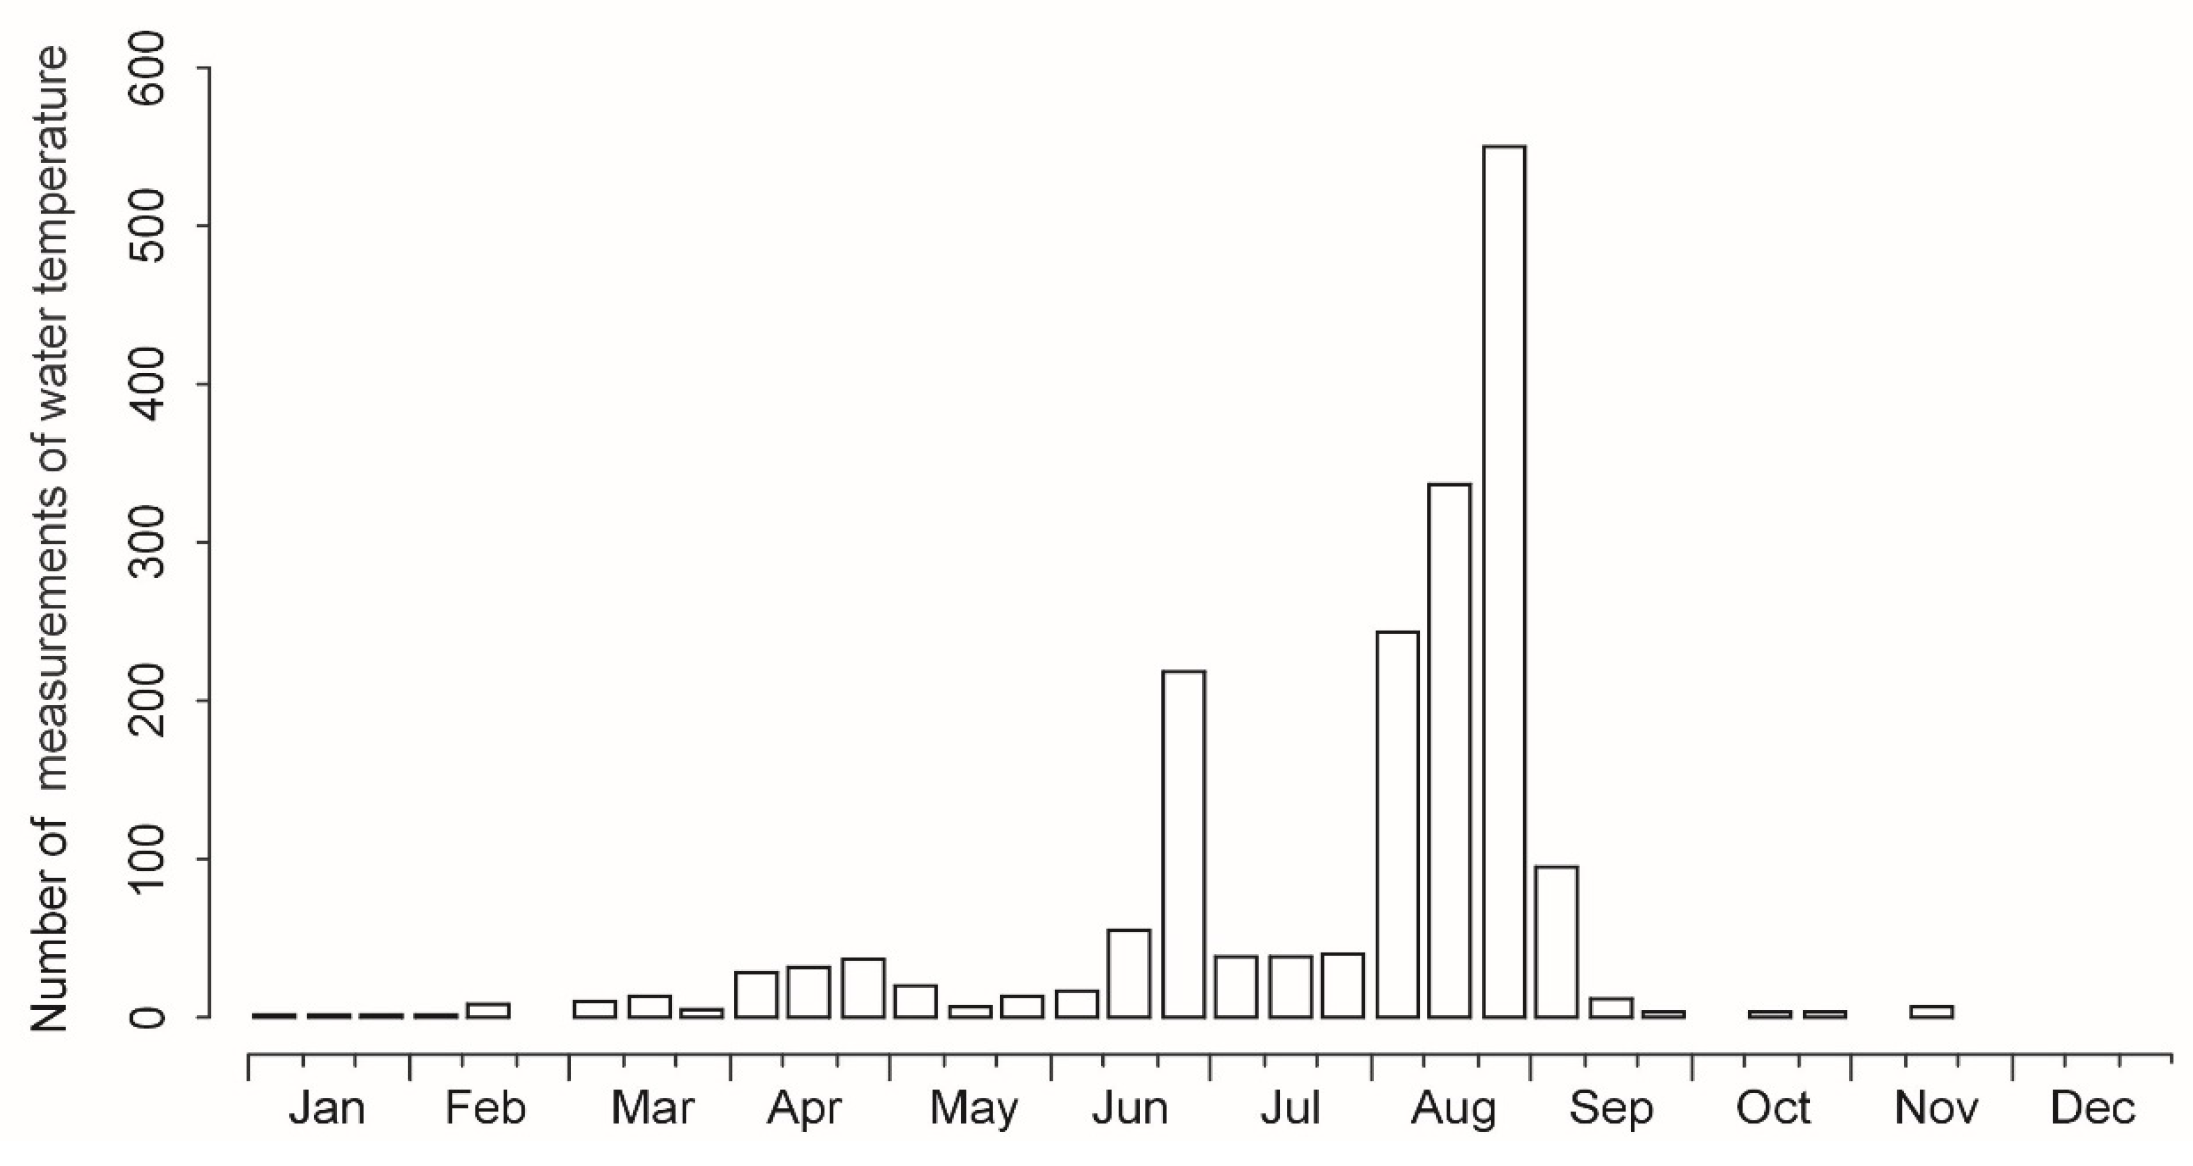
These data were supplemented with published results [57,68,69,70,71,72,73,74] and the final database contained 1841 water temperature measurements. Nearly half of the lakes (47.5%) represented one measured thermal profile, 30.0% two and 22.5% 3–17 profiles. Most of the data come from June (15.7% of data) and August (61.2%). The rest are from January, February, March, May, October and November (5.5% of the total data), April (5.2%), July (6.4%) and September (6.1%; Figure 5).
Because many profiles lacked temperature data at individual depths, they were estimated using a third or fourth degree polynomial regression line. The curves were fitted to a series of at least four measured temperature values from the closest depths. The temperature was estimated at a depth that was in the middle of this series. It was assumed that a good curve fit to the data series was obtained when R2 ≥ 0.99. The calculations were made in an Excel spreadsheet.
A similar data type was used to determine regression lines for annual average deep water temperatures in lakes distributed throughout Europe [75], in Lake Washington [49] as well as changes in the lake thermal structure for 231 lakes across northeastern North America [6] and variation in temperature of 142 lakes across Wisconsin [76]. The sampling frequency and temporal extent of those data were very different. For example, sampling intervals varied between weekly in Windermere (UK) and monthly in Swedish lakes [75]. The assessment of changes in deep water temperatures in lakes was based on fragmentary data covering the period 100 years [77]. To compare long-term temperature changes in water layers in a lake, the long-term dataset of water temperatures was compiled from discrete monthly measurements collected around noon at the center of the lake [54]. In studies of 231 lakes across northeastern North America, the majority of temperature observation sets came from citizen monitoring, in which temperatures are generally collected once during spring and three times between June and September [76]. All the examples cited prove that on the basis of data obtained from temperature profiles, analyses related to the analysis of long-term changes in water temperature were carried out, though the data formed a series of data (for each lake) with different measurement intervals. Carried out by Kraemer et al. [78] sensitivity analyses showed that data gaps of more than 1 year (to 2, 3, 3, 7 and 10 years) in several lakes do not significantly bias stratification trend estimates. This also suggests that when using a database (as in this study) containing a certain number of individual temperature measurements in a particular lake, the estimated water temperatures do not need to differ significantly from the actual mean values.
An important issue was to establish whether the data used for the baseline estimates describing the mean water temperature were representative. It was assumed that the basis for recognizing their representativeness is demonstrating the relationship between the temperature of surface waters and the air. The existence of a correlation between the data on water temperature and air temperature in Poland has already been demonstrated in previous publications [35,48,74,79,80]. Ptak et al. [32] showed that the course of the average annual water temperature in the years 1972–2016 indicates its clear warming, closely corresponding to the air temperature. Air temperature time series have also been used many times to construct models describing water temperature changes [18], e.g., Prats and Danis [81] published a model for calculating the epilimnion and hypolimnion temperature of inland waters on the basis of air temperature, as well as geographic and morphological features of these lakes.

3.3. Water Temperature

The thermal regime of surface waters is significantly influenced by air temperature and other weather variables, such as the speed and direction of the solar wind [2,4,18,23,32,33,43,48,82]. The existence of a clear/strong correlation between lake water temperature and air temperature may indicate that the collected data, which cover periods between 1951 and 1968, properly reflect the thermal conditions in the lakes. For this reason, the representativeness of the data on thermal conditions in lakes was assessed by comparing the average monthly air temperatures calculated on the basis of data from 12 meteorological stations (the data of the Institute of Meteorology and Water Management—National Research Institute in Warsaw have been processed), which are located in the Polish Lowlands (Figure 4; in the case of three stations: Olsztyn, Mikołajki, Suwałki, missing data from 1966–1968 were supplemented with data from the nearest stations) and average monthly water temperatures calculated on the basis of data from the database 931 lakes.
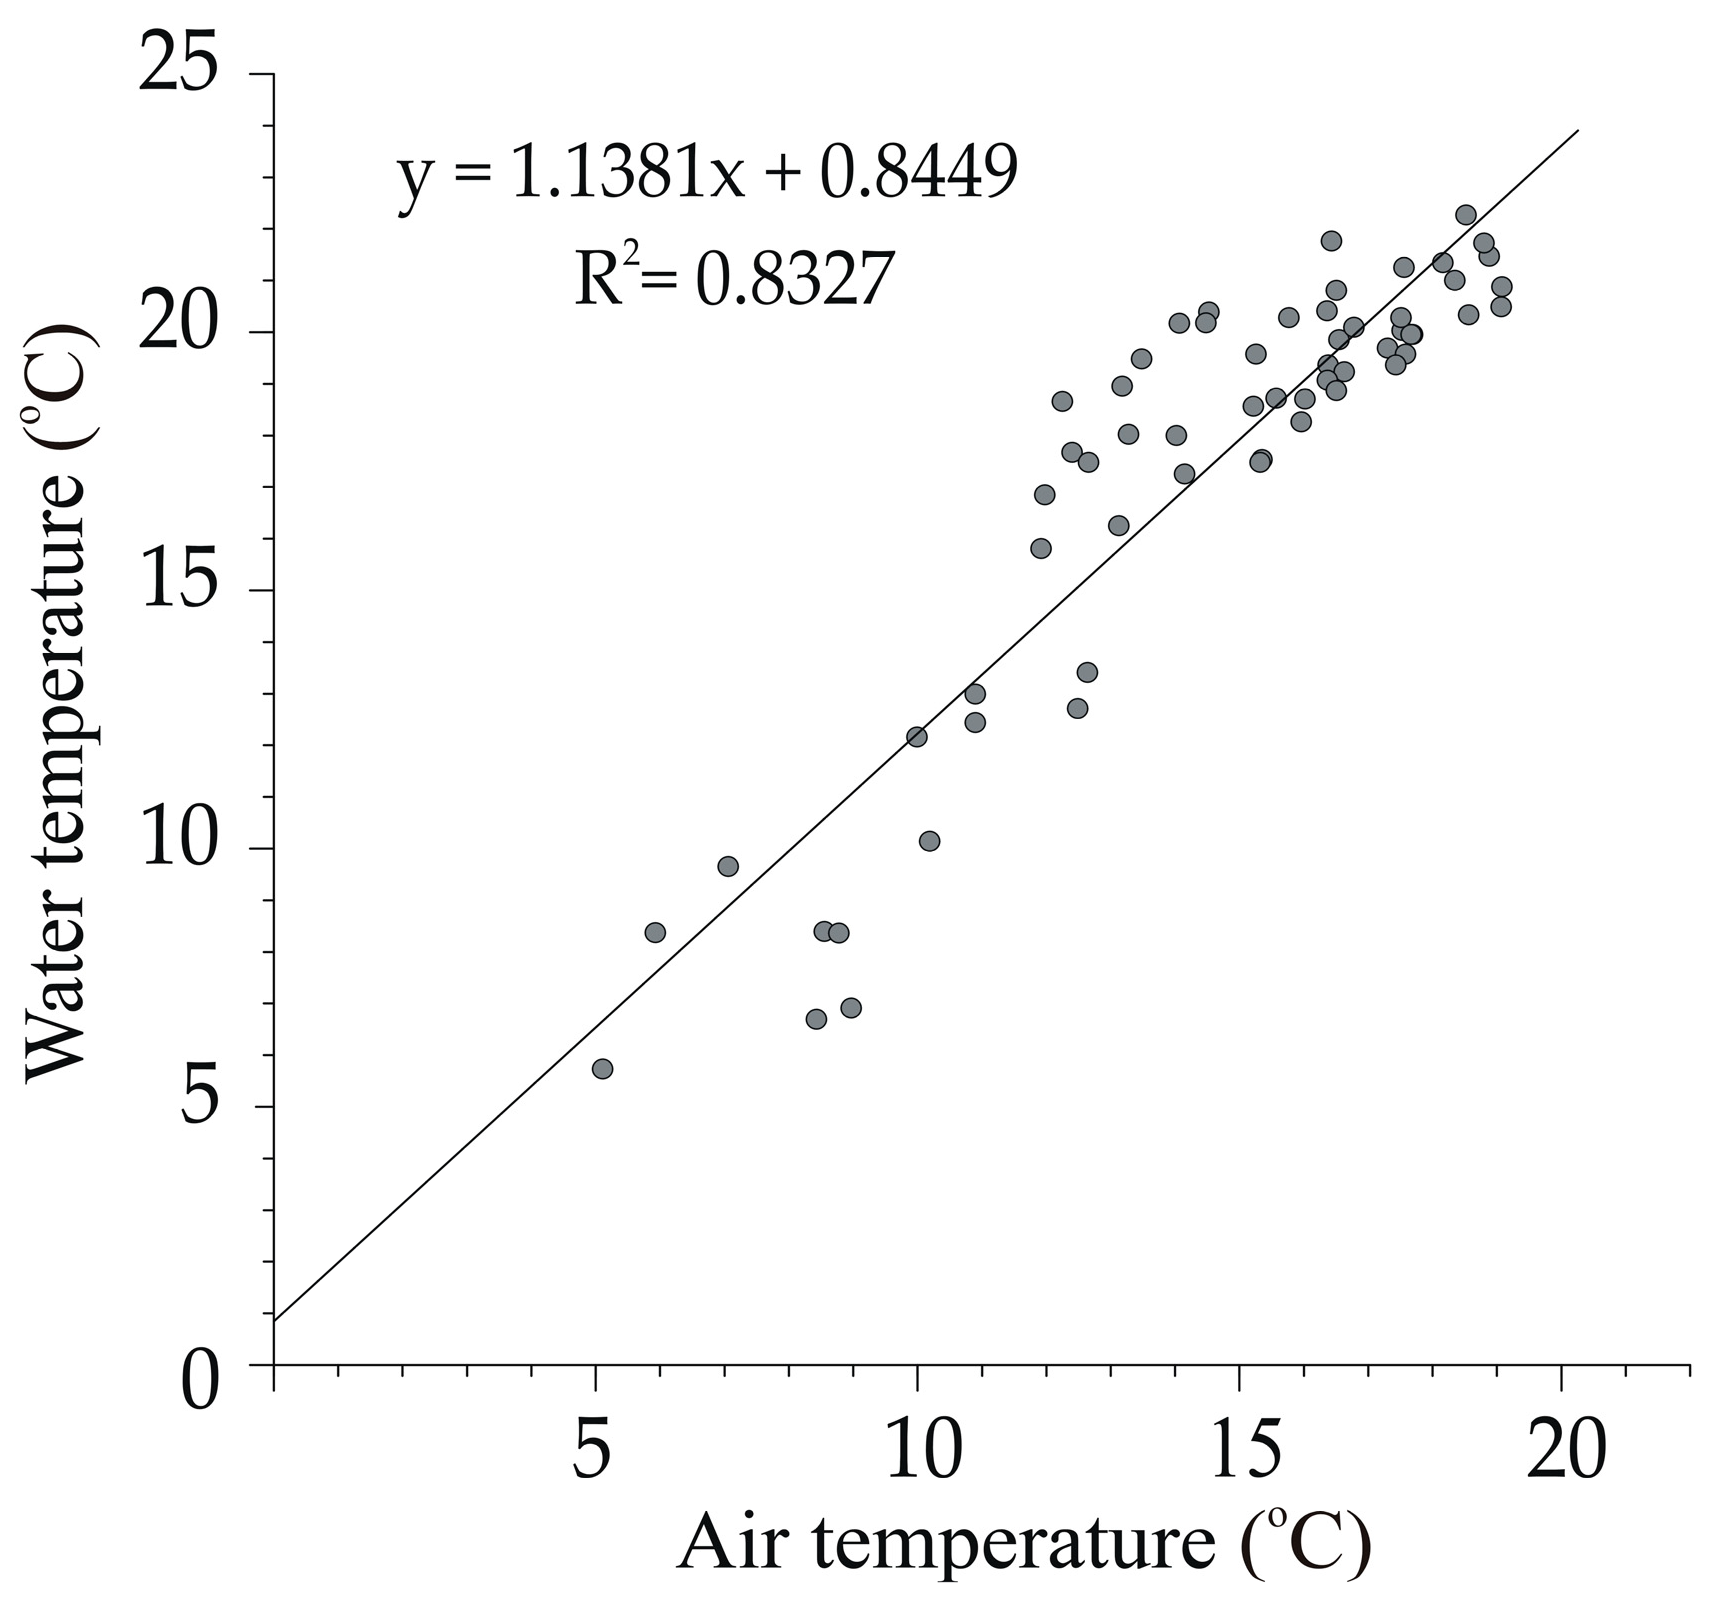
A strong statistically significant correlation relation was also found between mean monthly air temperature and mean water temperature in the 1951–1968 period (Figure 6). Pearson’s correlation coefficient was 0.91, with p < 0.001. A similar relationship was found by Ptak et al. [32] in 14 lakes for which the coefficients were calculated for the data from meteorological stations located at the shortest distance. The correlation coefficients of these dependencies ranged from 0.74 to 0.93 and variability of correlations was observed even in the case of lakes located near each other. Therefore, it can be considered that the data are adequate (sufficiently representative) to create a baseline for the water temperature.

3.4. Baseline of Water Temperature

Changes in the average water temperature in the 0–3 m layer during the year in the 1951–1968 period are best described (Figure 7) with the complementary error function peak (CEFP) with the formula:
T d = 0.3351 + 20.2468 × e r f c [ ( n 203.9830 122.7088 ) 2 ] ,
where Td is the estimated average water temperature in the 0–3 m layer for the nth day of the year and n is the calendar day in the year
The measured values of water temperature in the 0–3 m layer (in individual lakes and measurement dates) were very diverse. A good fit of this type of CEFP curve was most likely due to the near-parallel x-axis course of water temperature changes in the lakes in the winter months [82,83,84].
Daily values of water temperature in Polish lakes in the years 1951–1968 estimated according to this CEPF model Equation (1) are presented in Table S1.

3.5. Baseline Or Warm and Cold Years

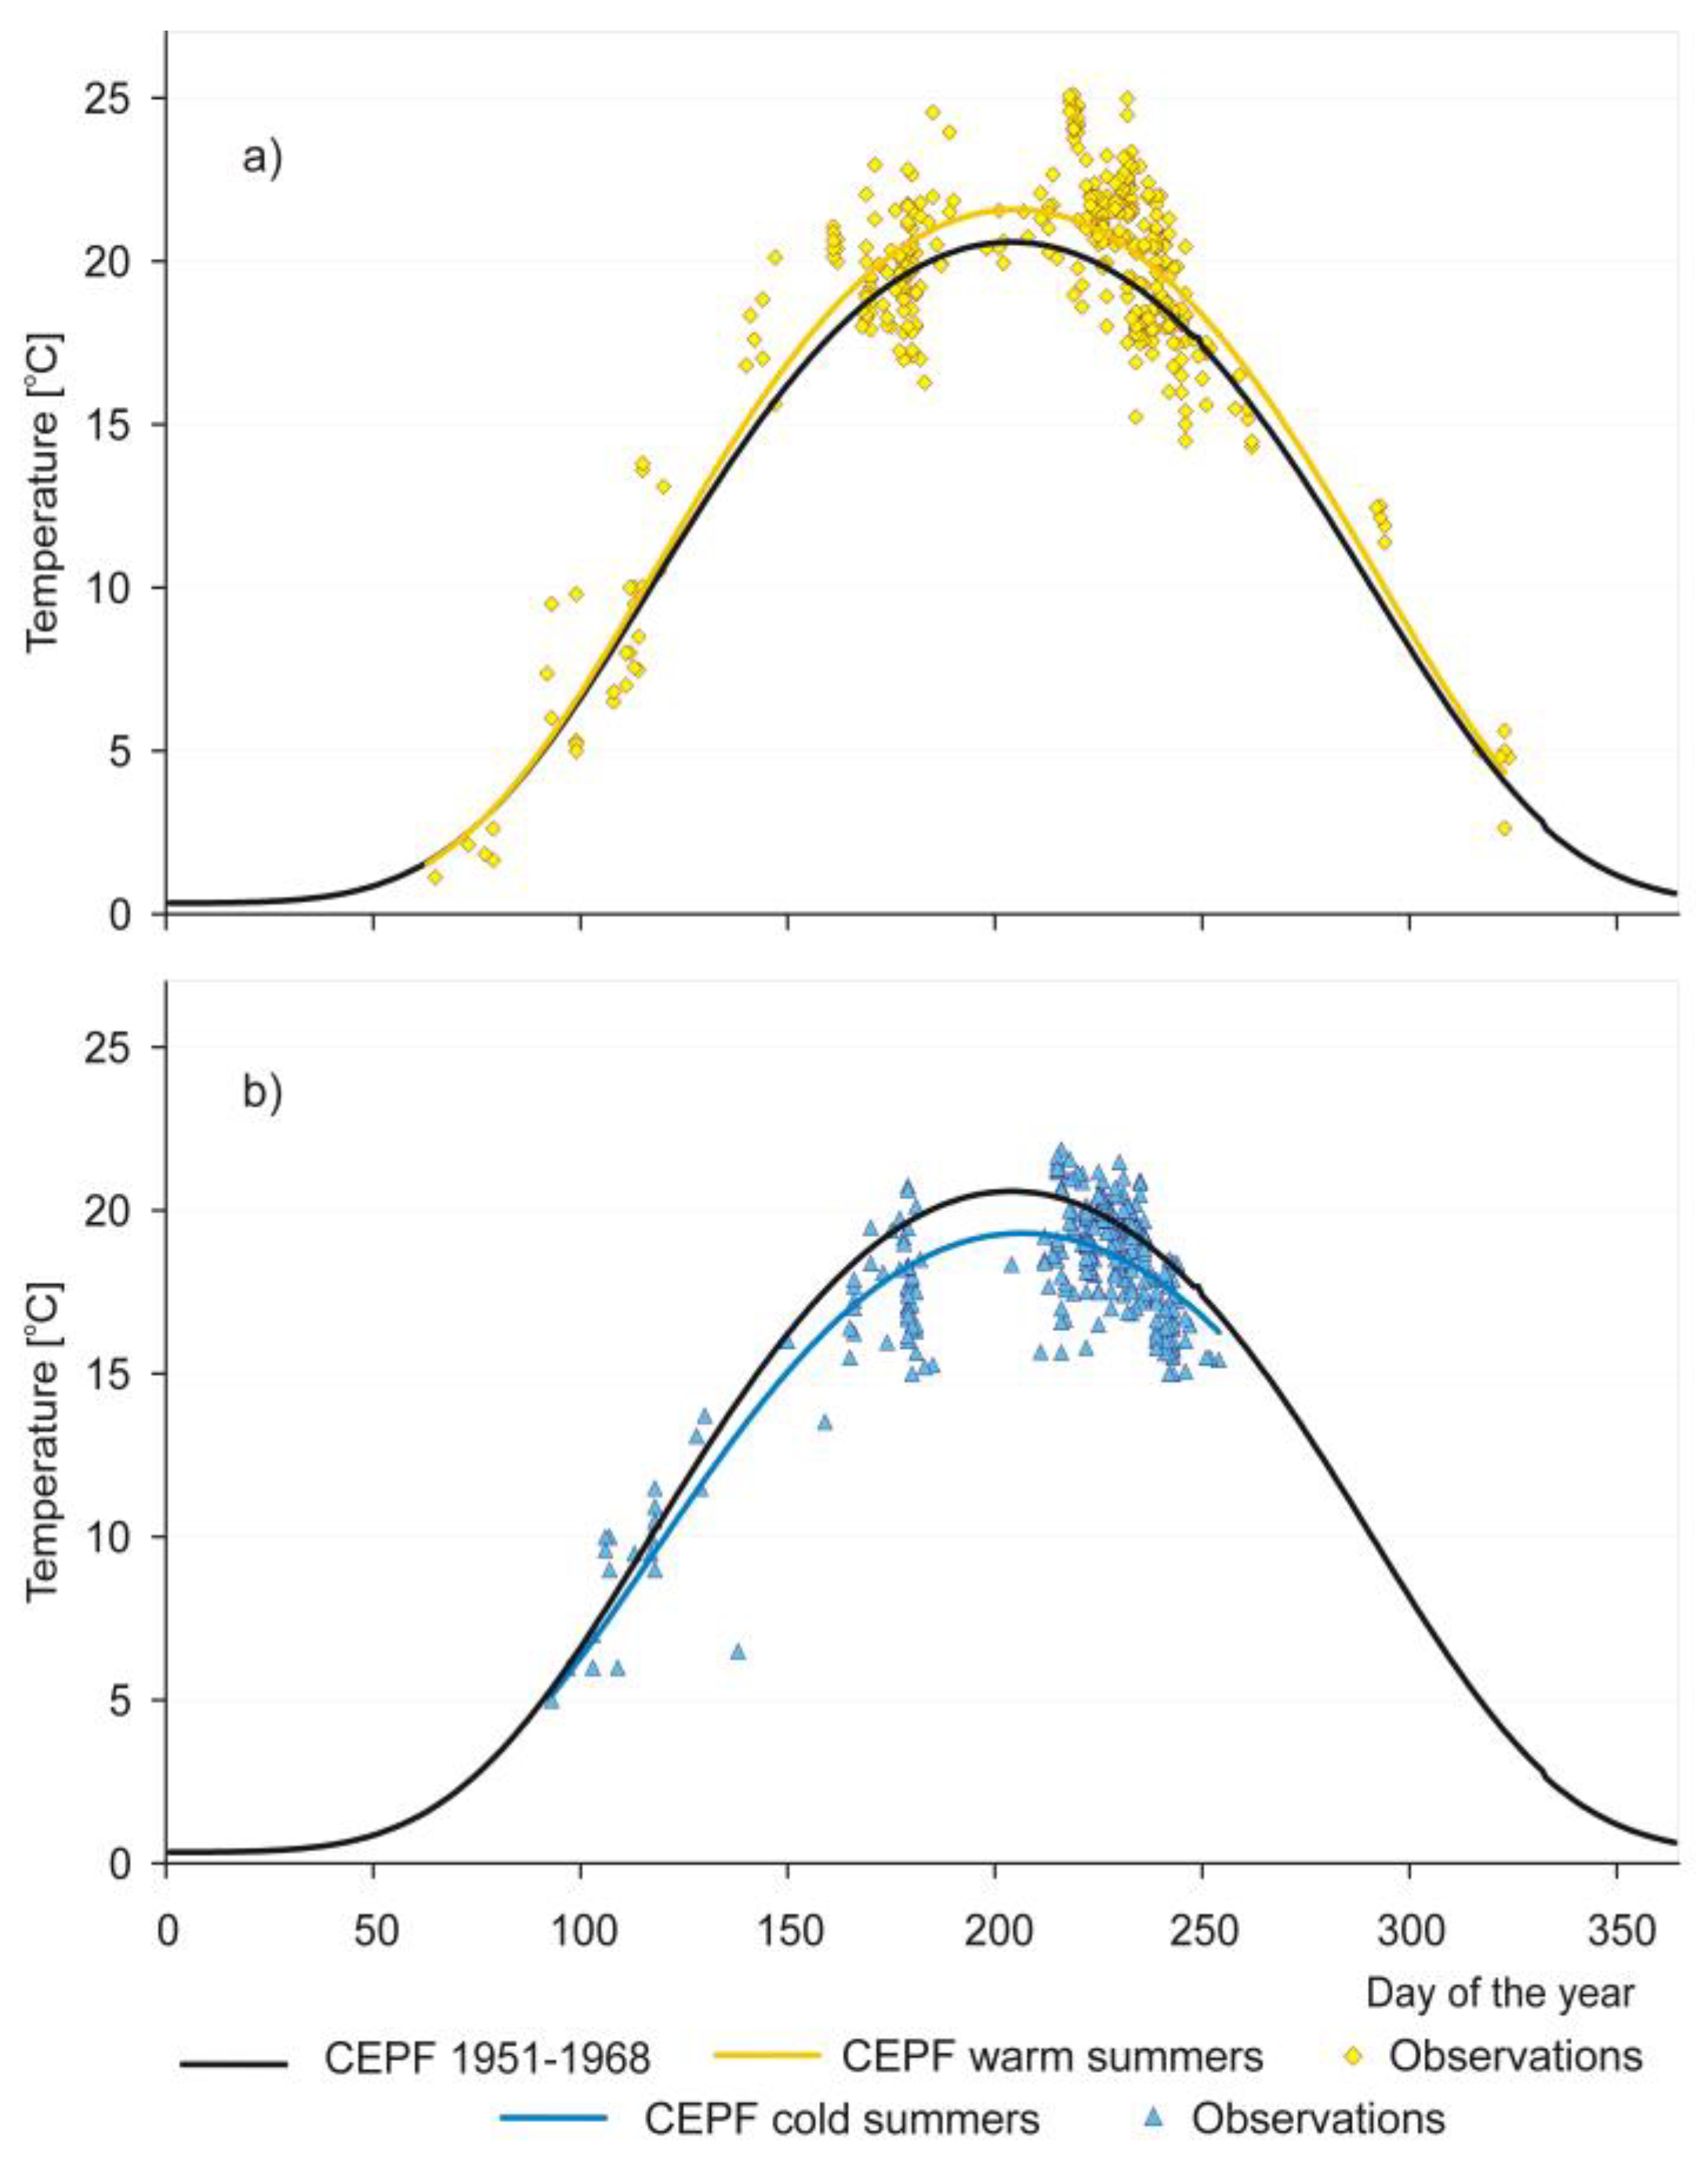
An attempt was also made to determine the CEFP for the warmest and coldest years in the period 1951–1968. The calculations take into account data from two years, with the warmest and the coldest summer, respectively. The analysis of the variability of Poland’s climatic conditions in the second half of the 20th century shows that in the years 1951–1968, the lowest air temperatures in Poland in the summer season occurred in 1962 (the anomaly compared to the average for the multi-year period 1971–1990 was −1.2 °C) and in 1965 (the anomaly was −0.9 °C) [31]. Among the 18 years analyzed in the study, the warmest periods of summer were recorded in 1959 and 1963. The anomaly in relation to the average for the long-term period 1971–1990 was 1.5 °C and −0.9 °C, respectively [31].
The CEFP for the warmest years from 1951−1968 is described by the formula:
T d = 0.2521 + 21.3304 × e r f c [ ( n 204.7604 123.0719 ) 2 ] ,
whereas the CEFP for the coldest years from 1951−1968 is described by the formula:
T d = 0.4907 + 18.8046 × e r f c [ ( n 206.4577 125.4403 ) 2 ] ,
where Td is the estimated average water temperature in the 0–3 m layer for the nth day of the year and n is the calendar day in the year.
The average water temperature in the 0–3 m layer in the two warmest years estimated by the CEFP line was higher by 0.8 °C in June and by 1.0 °C in July and August than the average water temperature in 1951–1968, determined on the basis of Equation (1) (Figure 8a). On the other hand, the average water temperature estimated by the CEFP line in the two coldest years was lower by 1.3 °C in June and July and by 1.0 °C in August than the corresponding mean water temperatures determined on the basis of Equation (1) (Figure 8b).

3.6. Response of Water Temperatures to Climate Changing (Meta-Analysis)

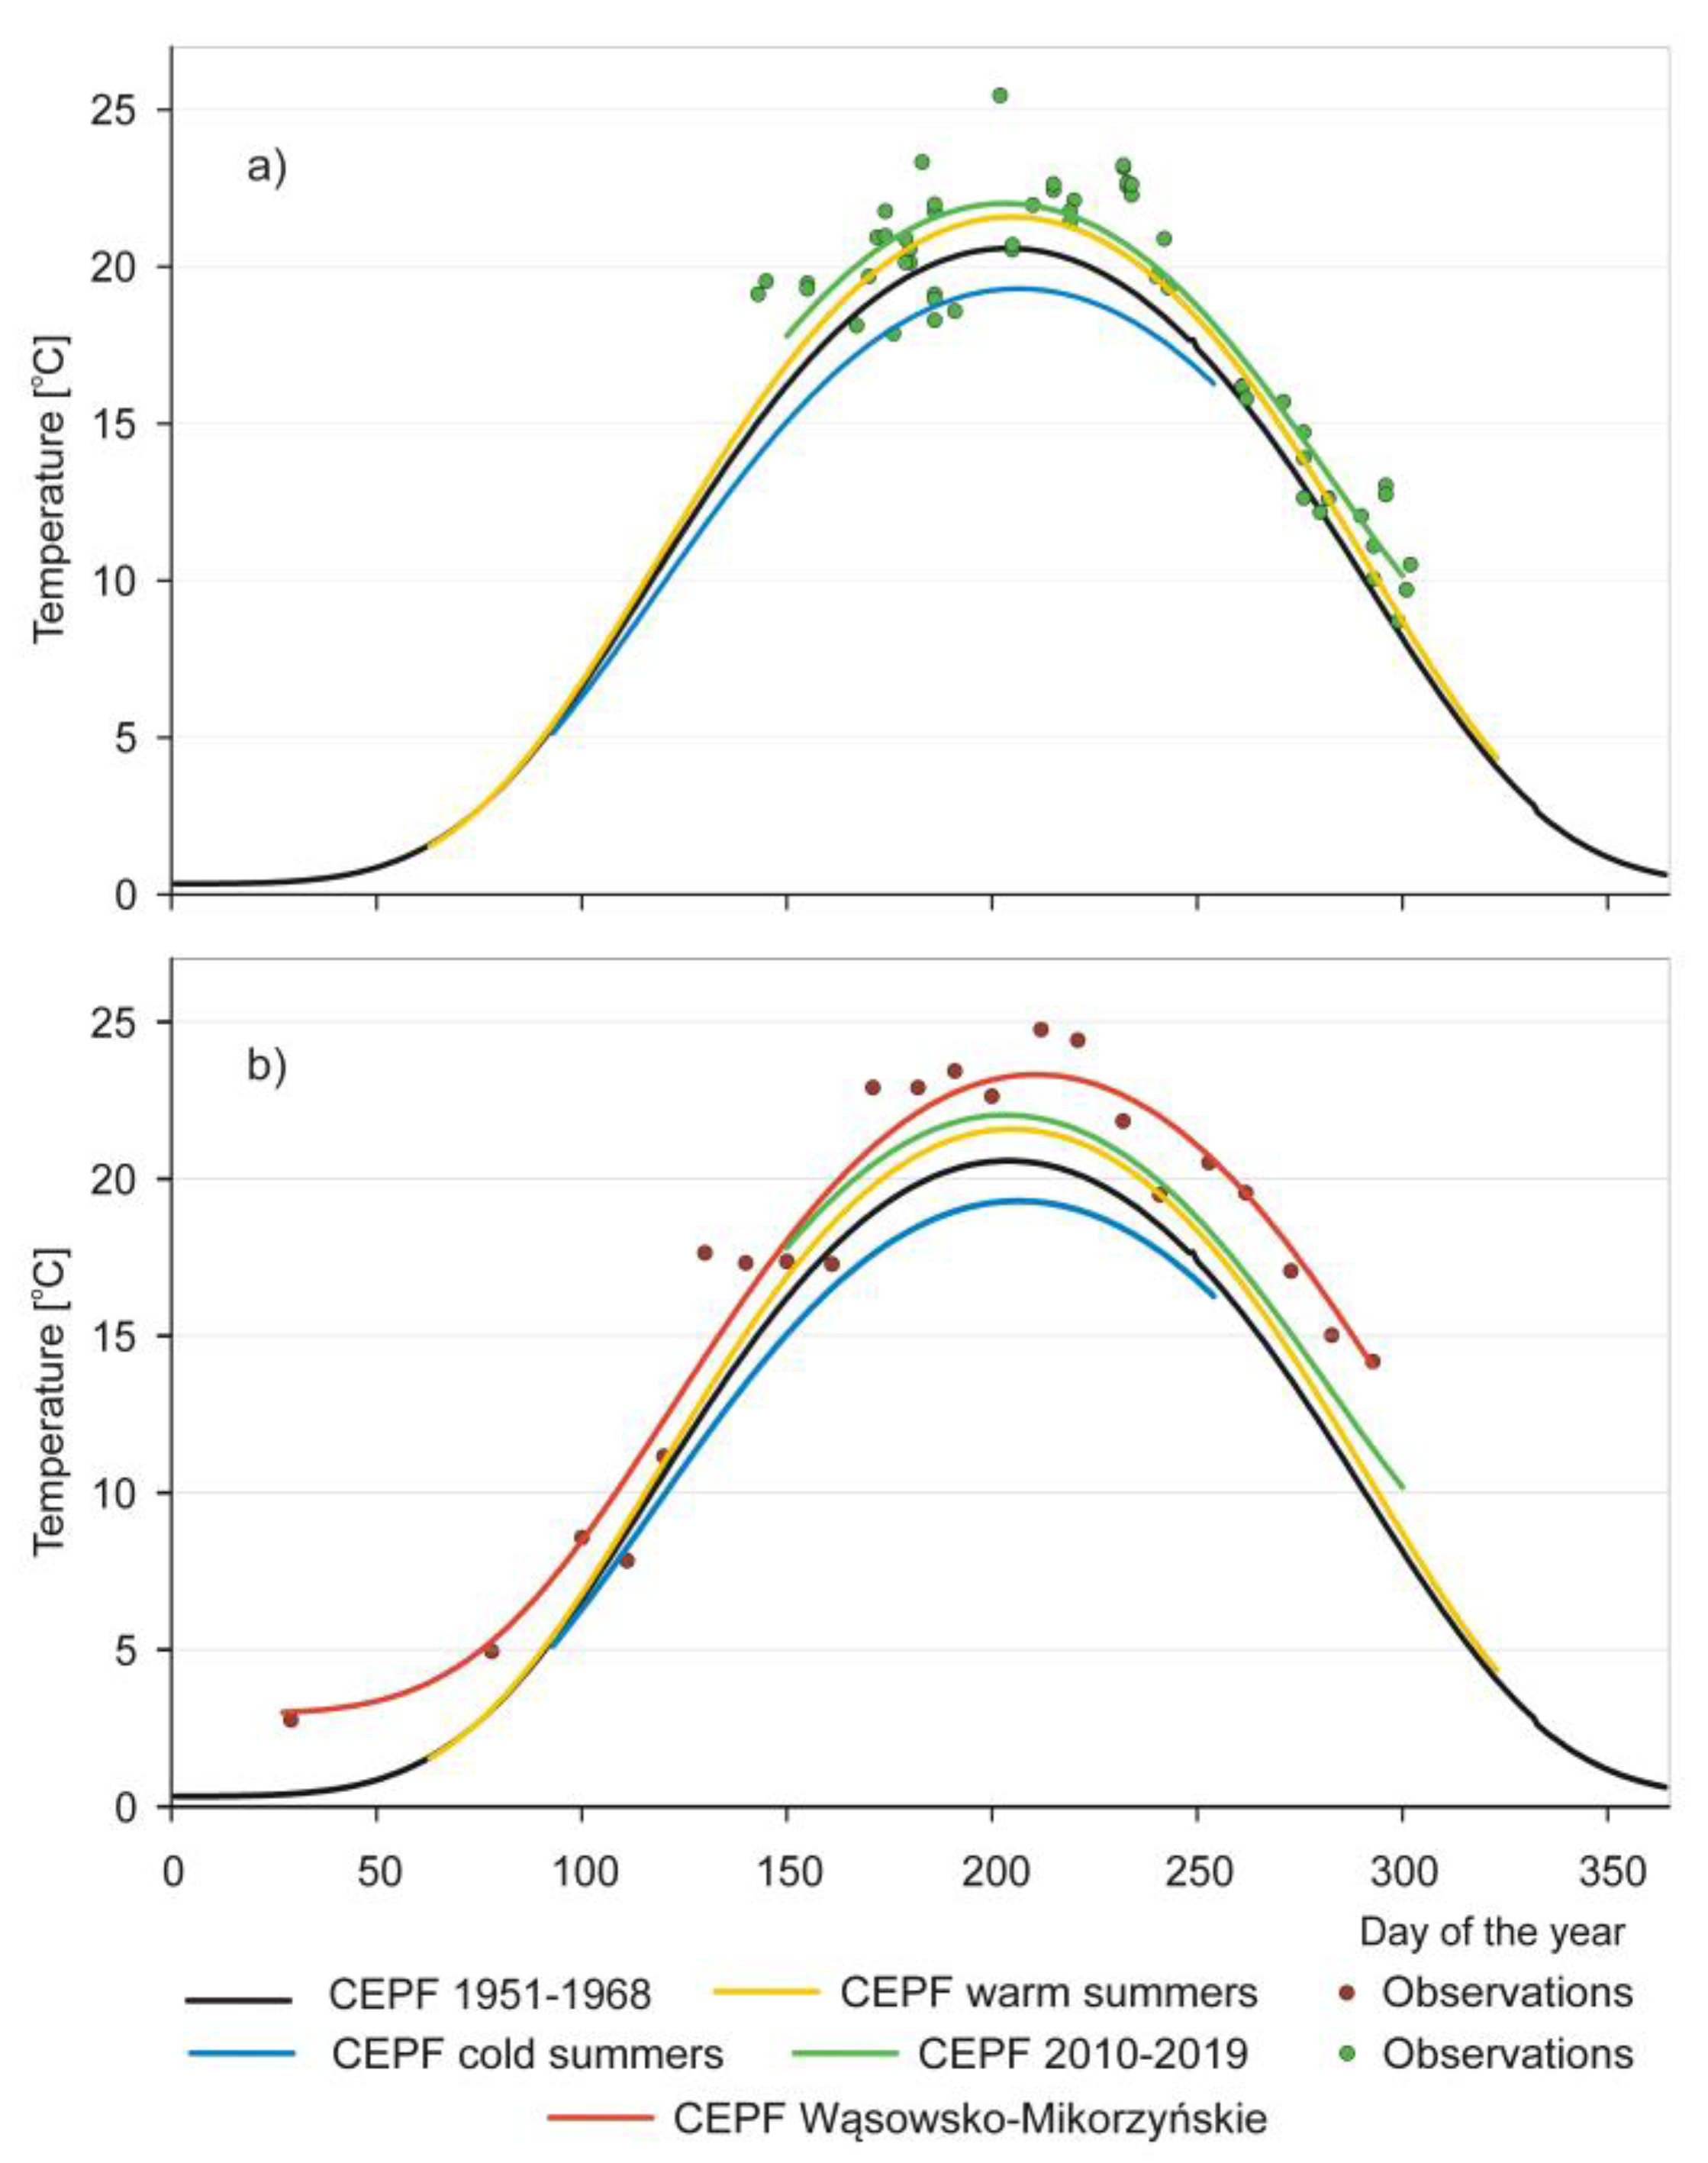
In order to verify the suitability of the CEFP for determining the average trends in surface water temperature changes on the basis of unpublished data from the Hydroacoustics Laboratory of the Inland Fisheries Institute in Olsztyn, the CEFP was calculated in the same way as for Equation (1). Data included water temperature in the 0–3 m layer, measured in 10 lakes located in the north-western Poland (from 20°24’ to 21°08’ E and 53°31’ to 53°59’ N) in the period May–October 2010–2019. The equation describing the water temperature in these lakes was as follows (Figure 9a):
T d = 5.4832 + 16.5493 × e r f c [ ( n 203.2580 110.9620 ) 2 ] ,
Based on the comparison of two CEFP models from the base period 1951–1968, Equation (1), and 2010–2019, Equation (4), the water temperature differences in the 0–3 m layer in June = 1.54 °C, in July = 1.47 °C, in August = 1.40 °C and in September 1.37 °C were determined. A similar range of temperature changes, by 0.2 °C −1.1 °C, was observed in 1961–2000 in six Polish lakes [24]. Additionally, Apsite et al. [54] showed that during the 15 years period (to 2002), the annual mean water temperature in Latvia’s seven largest lakes increased by 0.4 °C –0.8 °C in comparison to the preceding period. Mooij et al. [47] showed that the annual mean lake water temperature in the Netherlands increased by 2 °C between 1961 and 2006. According to Kraemer et al. [79], lake surface temperatures rose by 0.84 °C between 1970 and 2010 in 26 lakes worldwide. The CEFP temperature model estimated for 10 lakes in north-eastern Poland also shows that the surface waters in these reservoirs in 2010–2019 were warmer than in the warmest years of 1951–1963 (Figure 9a). The water temperature differences in the 0–3 m layer in the following months were as follows: in June −0.73 °C, in July −0.49 °C, in August 0.39 °C and in September 0.47 °C.
Man-made ‘heat islands’ such as heated tanks are a good benchmark that can also predict the response of a geographic region’s lake ecosystem to climate change. The most famous areas of this type in Poland are the Konińskie Lakes, heated with cooling water from power plants [85]. From 1958, three lakes (out of five) were included in the cooling cycle, initially at the Konin Power Plant, and from 1970, along with two other lakes, also at the Pątnów Power Plant [86]. The heating of the waters of these lakes resulted in enormous changes in the structure of ecosystems [86], including a reduction in the number of more temperature-sensitive phytoplankton species, which led to the creation of characteristic communities with a rich species composition, where most species were represented in a small number. Only a few taxa dominated, mainly diatoms, less frequently cyanobacteria [87]. Eventually, they became a cluster of different species and the target of invasion of alien and introduced species [85].
Research on thermal phenomena in five Konin lakes carried out in 1969 showed that on Lake Wąsowsko-Mikorzyńskie, despite the low load of (then) heated water, the water temperature increased by approximately 3 °C. Summer thermal stratification had already appeared in April [55]. On the basis of measurements carried out at eight sites located along the axis of this lake [55], the average decade water temperature in the 0–3 m layer was calculated, and then the CEFP model (Figure 9b):
T d = 2.9181 + 20.4041 × e r f c [ ( n 210.7327 125.5483 ) 2 ] .
The comparison of the CEFP models from the base period 2010–2019 Equation (4) and for the heated Wąsowsko-Mikorzyńskie Lake Equation (5) showed that the difference in water temperature between these lakes was the lowest in June (−0.49 °C). In July, the difference was 1.08 °C, in August 1.78 °C and in September 2.49 °C. The maximum “average” water temperature in lakes in 2010–2019 was lower by 1.29 °C than in a heated lake. At the same time, it was already 0.45 °C higher than the maximum temperature in the warm years of the period 1951–1968 (Figure 9b).
On the basis of the near-surface (0–3 m) CEFP models (average in 1951–1968 to average in 2010–2019), an attempt was made to estimate trends in water temperature changes in lakes in 10 lakes of the north-eastern region in Poland (Table 4). The trend values obtained in this study fell within the range of values given by Marszelewski and Pius [52] and Dąbrowski et al. [48] in the summer months for several Polish lakes in 39- and 54-year observation periods conducted from 1961 (Table 2). Trend values obtained in this study were close to the mean summer surface water temperature trends (LSSWT) in 118 lakes of the world in 1985–2009 period (Table 1) reported by O’Railly et al. [11] and in four lakes in Great Britain in 1960–2000 reported by Arvola et al. [50]. This indicates that the results obtained with the proposed method of estimating the trend of water temperature changes in lakes, not covered by many years of research, may be comparable with the results of data analyses carried out over long periods of time.
The comparison of the rate of temperature changes does not falsify the proposed method of determining the base temperature in lake surface waters on the basis of data obtained from thermal profiles, which are not time series. Of course, the model proposed in this study—the CEFP baseline—should be modified as data on water temperature in Polish lakes from the mid-20th century are collected.
The proposed method may make it possible to assess the impact of climate change on changes in, for example, the composition, distribution and abundance of hydrophytes in lakes in the course of hydrobiological research, which will enable the consideration of the impact of climate change on lakes. It also seems that this method could be applied in countries where surface water temperature monitoring has been introduced relatively recently. Rapid warming signals an urgent need to consider climate impacts in sensitivity assessments and adaptation efforts for lakes [11].

3.7. Limitations of the Proposed Modeling Approach

The approach proposed in the paper based on averaging the historical observations in the form of determining the water temperature function depending on the day of the year is a significant simplification. Although the water layer was indicated (0–3 m), in which the influence of the thermocline on the recorded temperatures is usually not observed, and the specific mean water temperature values showed a fairly strong correlation with the air temperature; however, the various limitations of the proposed method of determining water temperature changes in lakes must be taken into account. First, given the statistical nature of the parameterization, the baseline (Equation 1) describing the average lake water temperature in the period 1951–1968 is based on data unevenly distributed over the subsequent years of the study (cumulated in the periods from June to August). Therefore, it is not recommended to use the current version of the model for estimating changes out of this range of historical observations. Moreover, climate change impact assessments should be interpreted with caution, not only because of the statistical nature of the model, but also because it does not take into account the above-mentioned factors that affect the thermal conditions in individual lakes.
As the obvious limitation of the models are the assumptions from which they were derived [88,89], the proposed model is suitable for estimating the average temperature in lakes with characteristics similar to those in the data set used to calculate the mathematical formulas. Therefore, it is not suitable for lakes shallower than 5 m. Moreover, due to the statistical nature of the equations, particular attention should be paid to creating a set of input data for the created equations, taking care to ensure their representativeness, i.e., an appropriate number of temperature measurements carried out at possibly even intervals in one reservoir or several lakes located in a relatively small area. Referring to the Equation (4), created during the Meta-analysis, a similar number of data points (average water temperature in the water layer 0–3 m) can be recommended, which are fairly evenly distributed over time, preferably in the period previously indicated as the most appropriate for using Equations (1), i.e., from June to August.

4. Conclusions

The study results presented in this paper show that it is possible to calculate the equation describing the trend of surface water temperature changes in lakes during the calendar year on the basis of non-systematically collected data over the long-term (1951–1968). This was confirmed by the analyses showing a similar trend of daily water temperature variations in water at a depth of 0–3 m and a strong correlation of the average water temperature in this layer with the air temperature (this confirmed the adequacy of such data). Assuming the sinusoidal nature of the annual changes in water temperature in the lakes of the temperate zone, five mathematical functions were tested in order to indicate the most appropriate for the construction of the model of annual changes in water temperature. The comparison of the fit of six curves to the average monthly values of water temperature in particular years and (slightly) deterioration in the level of correlation of Pearson between the values estimated using these functions and the average monthly water temperature in the multiannual period showed that the complementary error peak function equation is the most suitable.
A meta-analysis was also carried out, in which the complementary error peak function equation was analogically determined for data from 10 lakes in north-eastern Poland from 2010–2019. On this basis, the average estimated water temperature in June, July, August and September in 2010–2019 was calculated, and then the average increase in lake surface water temperature in these months was estimated. They were compared with the results of other authors obtained on the basis of systematic measurements of water temperature over many years. This showed that the results estimated with the proposed method are close to the values determined on the multi-year data sequences.
The proposed method could be used, above all, in hydrobiological research, as an alternative to models to calculate the water temperature of inland water bodies, such as e.g., presented by [81], parameterized by using official monitoring data and the satellite temperature data, model, which is based on air temperature and on their geographical and morphological characteristics.

Supplementary Materials

The following are available online at https://www.mdpi.com/2073-4441/12/12/3574/s1. Table S1: Daily water temperature values in Polish lakes in 1951−1968 estimated according to the CEPF model Equation (1).

Funding

This study was funded by the Inland Fisheries Institute under research project number S-029.

Acknowledgments

The author is grateful to the anonymous reviewers for their valuable comments and suggestions.

Conflicts of Interest

The author declare that they have no conflict of interest.

References

  1. MacCallum, S.; Merchant, C. Surface water temperature observations of large lakes by optimal estimation. Can. J. Remote Sens. 2012, 38, 25–45. [Google Scholar] [CrossRef]
  2. Szumiec, M.A. Termika Stawów Karpiowych; Państwowe Wydawnictwo Naukowe: Warszawa, Poland, 1984. [Google Scholar]
  3. Skowron, R. Water temperature in investigations of Polish lakes. Limnol. Rev. 2017, 17, 31–46. [Google Scholar] [CrossRef] [Green Version]
  4. Ptak, M. Changes in water temperature and ice phenomena in the Ner River (Central Poland) in the years 1965-2014. Polish J. Sustain. Dev. 2017, 21, 49–56. [Google Scholar] [CrossRef]
  5. Adrian, R.; Reilly, C.M.O.; Zagarese, H.; Baines, S.B.; Hessen, D.O.; Keller, W.; Livingstone, D.M.; Sommaruga, R.; Straile, D.; Van Donk, E. Lakes as sentinels of climate change. Limnol. Oceanogr. 2009, 54, 2283–2297. [Google Scholar] [CrossRef] [PubMed]
  6. Richardson, D.C.; Melles, S.J.; Pilla, R.M.; Hetherington, A.L.; Knoll, L.B.; Williamson, C.E.; Kraemer, B.M.; Jackson, J.R.; Long, E.C.; Moore, K.; et al. Transparency, geomorphology and mixing regime explain variability in trends in lake temperature and stratification across Northeastern North America (1975–2014). Water 2017, 9, 442. [Google Scholar] [CrossRef]
  7. Poff, N.L.; Brinson, M.M.; Day, J.W. Aquatic Ecosystems & Global Climate Change: Potential Impacts on Inland Freshwater and Coastal Wetland Ecosystems in the United States. 2002. Available online: https://www.c2es.org/site/assets/uploads/2002/01/aquatic.pdf (accessed on 6 May 2020).
  8. Magnuson, J.; Robertson, D.; Benson, B.J.; Wynne, R.; Livingstone, D.M.; Arai, T.; Assel, R.A.; Barry, R.G.; Card, V.M.; Kuusisto, E.; et al. Historical Trends in Lake and River Ice Cover in the Northern Hemisphere. Science 2000, 289, 1743–1746. [Google Scholar] [CrossRef] [PubMed] [Green Version]
  9. Dobiesz, N.E.; Lester, N.P. Changes in mid-summer water temperature and clarity across the Great Lakes between 1968 and 2002. J. Great Lakes Res. 2009, 35, 371–384. [Google Scholar] [CrossRef]
  10. Shimoda, Y.; Azim, E.; Perhar, G.; Ramin, M.; Kenney, M.; Sadraddini, S.; Gudimov, A.; Arhonditsis, G. Our current understanding of lake ecosystem response to climate change: What have we really learned from the north temperate deep lakes? Lancet 2011, 37, 173–193. [Google Scholar] [CrossRef]
  11. O’Reilly, C.M.; Rowley, R.J.; Schneider, P.; Lenters, J.D.; Mcintyre, P.B.; Kraemer, B.M. Rapid and highly variable warming of lake surface waters around the globe. Geophys. Res. Lett. 2015, 42, 1–9. [Google Scholar] [CrossRef] [Green Version]
  12. Ficker, H.; Luger, M.; Gassner, H. From dimictic to monomictic: Empirical evidence of thermal regime transitions in three deep alpine lakes in Austria induced by climate change. Freshw. Biol. 2017, 62, 1335–1345. [Google Scholar] [CrossRef]
  13. Rempfer, J.; Livingstone, D.M.; Blodau, C.; Forster, R.; Niederhauser, P.; Kipfer, R. The effect of the exceptionally mild European winter of 2006–2007 on temperature and oxygen profiles in lakes in Switzerland: A foretaste of the future? Limnol. Oceanogr. 2010, 55, 2170–2180. [Google Scholar] [CrossRef]
  14. Hadley, K.R.; Paterson, A.M.; Stainsby, E.A.; Michelutti, N.; Yao, H.; Rusak, J.A.; Ingram, R.; McConnell, C.; Smol, J.P. Climate warming alters thermal stability but not stratification phenology in a small north-temperate lake. Hydrol. Process 2014, 28, 6309–6319. [Google Scholar] [CrossRef]
  15. Livingstone, D.M. Impact of secular climate change on the thermal structure of a large Temperate Central European lake. Clim. Chang. 2003, 57, 205–225. [Google Scholar] [CrossRef]
  16. Woolway, R.I.; Meinson, P.; Nõges, P.; Jones, I.D.; Laas, A. Atmospheric stilling leads to prolonged thermal stratification in a large shallow polymictic lake. Clim. Change 2017, 141, 759–773. [Google Scholar] [CrossRef] [Green Version]
  17. Schindler, D.W.; Beaty, K.G.; Fee, E.J.; Cruishank, D.R.; DeBruyn, E.D.; Findlay, D.L.; Linsey, G.A.; Shearer, J.A.; Stainton, M.P.; Turner, M.A. Effects of climatic warming on lakes of the central boreal forest. Science 1990, 250, 967–970. [Google Scholar] [CrossRef] [PubMed]
  18. Robertson, D.M.; Ragotzkie, R.A. Changes in the thermal structure of moderate to large sized lakes in response to changes in air temperature. Aquat. Sci. 1990, 52, 360–380. [Google Scholar] [CrossRef]
  19. Hondzo, M.; Stefan, H.G. Regional water temperature characteristics of lakes subjected to climate change. Clim. Change 1993, 24, 187–211. [Google Scholar] [CrossRef]
  20. Stefan, H.G.; Fang, X.; Hondzo, M. Simulated climate change effects on year-round water temperatures in temperate zone lakes. Clim. Change 1998, 40, 547–576. [Google Scholar] [CrossRef]
  21. Peeters, F.; Livingstone, D.M.; Goudsmit, G.-H.; Kipfer, R.; Forster, R. Modeling 50 years of historical temperature profiles in a large central European lake. Limnol. Oceanogr. 2002, 47, 186–197. [Google Scholar] [CrossRef] [Green Version]
  22. Skowron, R. Annual cycle of surface water temperature in the lakes in the Polish Lowland and its changeability. In Water Circulation in Natural and Transformed Environment; Michalczyk, Z., Ed.; Badania Hydrograficzne w Poznawaniu Środowiska 8, Wyd; UMCS: Lublin, Poland, 2007; pp. 452–461. [Google Scholar]
  23. Skowron, R. The Differentiation and the Changeability of Chosen of Elements the Thermal Regime of Water in Lakes on Polish Lowland; Toruń; Wydawnictwo Uniwersytetu M: Kopernika, Poland, 2011; pp. 1–345. [Google Scholar]
  24. Bergkemper, V.; Weisse, T. Do current European lake monitoring programmes reliably estimate phytoplankton community changes? Hydrobiologia 2018, 824, 143–162. [Google Scholar] [CrossRef] [Green Version]
  25. Przybylak, R. Change in Poland climate over the last Millennium. Czas. Geogr. 2011, 82, 23–48. [Google Scholar]
  26. Kożuchowski, K.; Żmudzka, E. The warming in Poland: The range and seasonality of the changes in air temperature in the second half of 20th century. Przegląd Geofiz. 2001, 46, 81–90. [Google Scholar]
  27. Kożuchowski, K.; Żmudzka, E. Cyrkulacja atmosferyczna i jej wpływ na zmienność temperatury powietrza w Polsce. Przegląd Geogr. 2002, 74, 591–604. [Google Scholar]
  28. Żmudzka, E. Long-term changes of thermal resources in the vegetative period and the active growth of plants in Poland. Woda-Środowisko-Obszary Wiejskie 2012, 12, 377–389. [Google Scholar]
  29. Wójcik, R.; Miętus, M. Some features of long-term variability in air temperature in Poland (1951–2010). Przegląd Geogr. 2014, 86, 339–364. [Google Scholar] [CrossRef] [Green Version]
  30. Graczyk, D.; Pińskwar, I.; Kundzewicz, Z.W.; Hov, Ø.; Førland, E.J.; Szwed, M.; Choryński, A. The heat goes on—changes in indices of hot extremes in Poland. Theor. Appl. Climatol. 2016, 110, 103–113. [Google Scholar] [CrossRef] [Green Version]
  31. Marosz, M.; Wójcik, R.; Biernacik, D.; Jakusik, E.; Pilarski, M.; Owczarek, M.; Miętus, M. Zmienność klimatu Polski od połowy XX wieku. Prace i Studia Geogr. 2011, 47, 51–66. [Google Scholar]
  32. Ptak, M.; Sojka, M.; Choiński, A.; Nowak, B. Effect of environmental conditions and morphometric parameters on surface water temperature in Polish Lakes. Water 2018, 10, 580. [Google Scholar] [CrossRef] [Green Version]
  33. Skowron, R. Water temperature in the lakes of Northern Poland during the bathing season. Bull. Geogr. Phys. Geogr. Ser. 2018, 15, 75–90. [Google Scholar] [CrossRef] [Green Version]
  34. Sobolewski, W.; Borowiak, D.; Borowiak, M.; Skowron, R. Baza Danych Jezior Polski i jej Wykorzystanie w Badaniach Limnologicznych. PICADOR Komunikacja Graficzna s.c. Lublin. 2014. Available online: https://kl.ug.edu.pl/download/BDJP.pdf (accessed on 17 April 2019).
  35. Skowron, R.; Piasecki, A. Dynamics of the daily course of water temperature in Polish lakes. J. Water Land Dev. 2016, 31, 149–156. [Google Scholar] [CrossRef]
  36. Koczorowska, R. The impact of a fuel-energy complex on selected elements of water balance. Probl. Ekologii Kraj. 2001, 10, 158–163. [Google Scholar]
  37. Pasławski, Z. Stosunki termiczne i wodne Jeziora Pątnowskiego. Gospod. Wodna 1967, 27, 117–122. [Google Scholar]
  38. Zdanowski, B. Wpływ zrzutu wód podgrzanych na stosunki termiczno-tlenowe i przezroczystość wody jezior konińskich. Roczniki Nauk Rol. 1976, 97-H-3, 141–162. [Google Scholar]
  39. Magee, M.R.; Wu, C.H. Response of water temperatures and stratification to changing climate in three lakes with different morphometry. Hydrol. Earth Syst. Sci. 2017, 21, 6253–6274. [Google Scholar] [CrossRef] [Green Version]
  40. Imberger, J.; Patterson, J.C. Physical Limnology. In Advances in Applied Mechanics; Hutchinson, J.W., Wu, T.Y., Eds.; Elsevier: Amsterdam, The Netherlands, 1989; Volume 27, pp. 303–475. [Google Scholar]
  41. Boehrer, B.; Schultze, M. Stratification of lakes. Rev. Geophys. 2008, 46, L16405. [Google Scholar] [CrossRef] [Green Version]
  42. Edinger, J.E.; Duttweiler, D.W.; Geyer, J.C. The response of water temperatures to meteorological conditions. Water Resour. Res. 1968, 4, 1137–1144. [Google Scholar] [CrossRef]
  43. Kettle, H.; Thompson, R.; Anderson, N.J.; Livingstone, D.M. Empirical modeling of summer lake surface temperatures in southwest Greenland. Limnol. Oceanogr. 2004, 49, 271–282. [Google Scholar] [CrossRef]
  44. Hampton, S.E.; Izmest’eva, L.R.; Moore, M.V.; Katz, S.L.; Dennis, B.; Silow, E.A. Sixty years of environmental change in the world’s largest freshwater Lake–Lake Baikal, Siberia. Glob. Chang. Biol. 2008, 14, 1947–1958. [Google Scholar] [CrossRef] [Green Version]
  45. Coats, R.; Perez-Losada, J.; Schladow, G.; Richards, R.; Goldman, C. The warming of Lake Tahoe. Clim. Chang. 2006, 76, 121–148. [Google Scholar] [CrossRef]
  46. Straile, D.; Joehnk, K.; Rossknecht, H. Complex effects of winter warming on the physico-chemical characteristics of a deep lake. Limnol. Oceanogr. 2003, 48, 1432–1438. [Google Scholar] [CrossRef]
  47. Apsite, E.; Elferts, D.; Zubaničs, A.; Latkovska, I. Long-term changes in hydrological regime of the lakes in Latvia. Hydrol. Res. 2014, 45, 308–321. [Google Scholar] [CrossRef]
  48. Dąbrowski, M.; Marszelewski, W.; Skowron, R. The trends and dependencies between air and water temperatures in lakes in northern Poland from 1961–2000. Hydrol. Earth Syst. Sci. Discuss. Eur. Geosci. Union 2004, 8, 79–87. [Google Scholar] [CrossRef] [Green Version]
  49. Austin, J.A.; Colman, S.M. A century of temperature variability in Lake Superior. Limnol. Oceanogr. Methods 2008, 53, 2724–2730. [Google Scholar] [CrossRef]
  50. Arvola, L.; George, G.; Livingstone, D.M.; Järvinen, M.; Blenckner, T.; Dokulil, M.T.; Jennings, E.; Aonghusa, C.N.; Nõges, P.; Nõges, T.; et al. The impact of the changing climate on the thermal characteristics of lakes. In The Impact of Climate Change on European Lakes; George, D.G., Ed.; Aquatic Ecology Series; Springer: Dordrecht, The Netherlands, 2009; pp. 65–101. [Google Scholar] [CrossRef]
  51. Mooij, W.M.; De Senerpont Domis, L.N.; Hülsmann, S. The impact of climate warming on water temperature, timing of hatching and young-of-the-year growth of fish in shallow lakes in the Netherlands. J. Sea Res. 2008, 60, 32–43. [Google Scholar] [CrossRef]
  52. Marszelewski, W.; Pius, B. Effect of climate change on thermal-ice regime of shallow lakes compared to deep lakes: Case study of lakes in the temperate zone (Northern Poland). J. Limnol. 2019, 78, 27–39. [Google Scholar] [CrossRef]
  53. Arhonditsis, G.B.; Brett, M.T.; DeGasperi, C.L.; Schindler, D.E. Effects of climatic variability on the thermal properties of Lake Washington. Limnol. Oceanogr. 2004, 49, 256–270. [Google Scholar] [CrossRef]
  54. Niedrist, G.H.; Psenner, R.; Sommaruga, R. Climate warming increases vertical and seasonal water temperature differences and inter-annual variability in a mountain lake. Clim. Chang. 2018, 151, 473–490. [Google Scholar] [CrossRef] [Green Version]
  55. Chojnowski, S. Preliminary characteristics of thermal phenomena in the Konin Lakes. Prace Państwowego Inst. Hydrol. Meteorol. 1972, 107, 99–117. [Google Scholar]
  56. Davies-Colley, R.J. Mixing depths in New Zealand lakes. New Zealand J. Mar. Freshw. Res. 1988, 22, 517–528. [Google Scholar] [CrossRef] [Green Version]
  57. Patalas, K. Stosunki termiczne i tlenowe oraz przezroczystość wody w 44 jeziorach okolic Węgorzewa. Roczn Nauk Rol. B 1960, 77, 105–222. [Google Scholar]
  58. Skowron, R. Struktura termiczna wody w okresie letniej stagnacji na przykładzie wybranych jezior z Pojezierza Gnieźnieńskiego i Kujawskiego. Acta Univ. Nicolai Copernici. Geogr. 1990, 22, 45–83. [Google Scholar]
  59. Jańczak, J.; Maślanka, W. Cases of occurrence of secondary metalimnia in some lakes of the Ełk Lakeland. Limnol. Rev. 2006, 6, 123–128. [Google Scholar]
  60. Maślanka, W.; Nowiński, K. Diversity of development of summer thermocline layers in Lake Upper Raduńskie. Limnol. Rev. 2006, 6, 201–206. [Google Scholar]
  61. Januszkiewicz, T. Przyczynek do znajomości chemizmu jeziora Ewingi. Pol. Arch. Hydrobiol. 1965, 13, 63–88. [Google Scholar]
  62. Skowron, R. Zmiany temperatury wody i zasobów ciepła w przebiegu dobowym na przykładzie epitermicznego jeziora Gopło. Acta Univ. Nicolai Copernici. Geogr. 2000, 31, 289–306. [Google Scholar]
  63. Kondracki, J. Obserwacje nad termiką jeziora Niegocin na stacji naukowej Polskiego Towarzystwa Geograficznego w Giżycku (1949-1951). Przegl. Geogr. 1952, 24, 49–71. [Google Scholar]
  64. TableCurve (Curve Fitting Software); Version 3.11; Manual; Systat Software: San Jose, CA, USA, 1992.
  65. Choiński, A. Katalog jezior Polski; Wydawnictwo Naukowe UAM: Poznań, Poland, 2006. [Google Scholar]
  66. Komsta, L. Rewizja matematyczna siatki geobotanicznej ATPOL-propozycja algorytmów konwersji współrzędnych. Ann. UMCS Sectio E Agric. 2016, 71, 31–37. [Google Scholar]
  67. Verey, M. Teoretyczna analiza i praktyczne konsekwencje przyjęcia modelowej siatki ATPOL jako odwzorowania stożkowego definiującegokonwersję współrzędnych płaskich na elipsoidę WGS 84. Fragm. Florist. Geobot. Polon. 2017, 24, 469–488. [Google Scholar]
  68. Olszewski, P. Obserwacje chemiczne z jeziora Tajty. Roczn. Nauk Roln. 1953, 67, 23–65. [Google Scholar]
  69. Walczak, J. Sielawa (Coregonus albula L.) kilku jezior Pomorza Zachodniego. Roczn. Nauk Rol. 1953, 67, 21–37. [Google Scholar]
  70. Walczak, J. Przemieszanie i rozpraszanie się stada sielawowego w jeziorze Charzykowo. Roczn. Nauk Rol. 1953, 67, 39–51. [Google Scholar]
  71. Spodniewska, I. The plankton of Lake Tajty. Ekol. Polska 1955, 3, 181–228. [Google Scholar]
  72. Olszewski, P.; Paschalski, J. Wstępna charakterystyka limnologiczna niektórych jezior Pojezierza Mazurskiego. Zesz. Nauk. WSR w Olszt. 1959, 4, 1–109. [Google Scholar]
  73. Szmal, Z. Badania hydrochemiczne jezior lobeliowych Pomorza Zachodniego. PTPN Wydz. Mat. Przyr. Prace Kom. Biol. 1959, 19, 1–107. [Google Scholar]
  74. Olszewski, P.; Tadajewski, A.; Lossow, K.; Więcławski, F. Wstępna charakterystyka limnologiczna niektórych jezior Pojezierza Mazurskiego. Cz. II. Zesz. Nauk. Akad. Rol. Tech. w Olsztynie. Ochrona Wód i Ryb Śród. 1978, 7, 3–80. [Google Scholar]
  75. Dokulil, M.T.; Jagsch, A.; George, G.D.; Anneville, O.; Jankowski, T.; Wahl, B.; Lenhart, B.; Blenckner, T.; Teubner, K. Twenty years of spatially coherent deepwater warming in lakes across Europe related to the North Atlantic Oscillation. Limnol. Oceanogr. 2006, 51, 2787–2793. [Google Scholar] [CrossRef] [Green Version]
  76. Winslow, L.A.; Read, J.S.; Hansen, G.J.A.; Hanson, P.C. Small lakes show muted climate change signal in deepwater temperatures. Geophys. Res. Lett. 2015, 42, 355–361. [Google Scholar] [CrossRef]
  77. Dokulil, M.T.; Teubner, K.; Jagsch, A. Climate change affecting hypolimnetic water temperatures in deep alpine lakes. Verh. Internat. Verein Limnol. 2006, 29, 1285–1288. [Google Scholar] [CrossRef]
  78. Kraemer, B.M.; Anneville, O.; Chandra, S.; Dix, M.; Kuusisto, E.; Livingstone, D.M.; Rimmer, A.; Schladow, S.G.; Silow, E.; Sitoki, L.M.; et al. Morphometry and average temperature affect lake stratification responses to climate change. Geophys. Res. Lett. 2015, 42, 4981–4988. [Google Scholar] [CrossRef] [Green Version]
  79. Paluch, J.; Małecki, Z.J.; Gołebiak, P. Wpływ zbiornika zaporowego Gołuchów na mikroklimat w zlewni Ciemnej (Trzemnej), lewobrzeżnym dopływie Prosny. Zeszyty Naukowe Inżynieria Lądowa i Wodna w Kształtowaniu Środowiska 2009, 1, 26–34. [Google Scholar]
  80. Ptak, M.; Nowak, B. Warunki termiczno-tlenowe Jeziora Białego Włodawskiego w półroczu letnim (2012–2015. Ann. Univ. Mariaecurie Skłodowska Lublin Polonia 2016, 71, 61–71. [Google Scholar] [CrossRef]
  81. Prats, J.; Danis, P.A. An epilimnion and hypolimnion temperature model based on air temperature and lake characteristics. Knowl. Manag. Aquat. Ecosyst. 2019, 420, 8. [Google Scholar] [CrossRef]
  82. Marszelewski, W.; Skowron, R. Extreme ice phenomena on the lakes of Northern Poland. Limnol. Rev. 2009, 9, 81–89. [Google Scholar]
  83. Layden, A.; Merchant, C.; MacCallum, S. Global climatology of surface water temperatures of large lakes by remote sensing. Int. J. Climatol. 2015, 35, 4464–4479. [Google Scholar] [CrossRef] [Green Version]
  84. Lieberherr, G.; Wunderle, S. Lake Surface Water Temperature Derived from 35 Years of AVHRR Sensor Data for European Lakes. Remote Sens. 2018, 10, 990. [Google Scholar] [CrossRef] [Green Version]
  85. Najberek, K.; Solarz, W. Konin Lakes as a hot spot for biological invasions in Poland. In Alien Species in the Fauna of Poland; Głowaciński, Z., Okarma, H., Pawłowski, J., Solarz, W., Eds.; Instytut Ochrony Przyrody PAN: Kraków, Poland, 2011; pp. 614–623. [Google Scholar]
  86. Kraska, M. Reactions of Lake Ecosystem on Heated Waters, with Special Regard to Hydromacrophytes; Wydawnictwo Naukowe UAM: Poznań, Poland, 1988. [Google Scholar]
  87. Sosnowska, J. Effect of heated effluents on the phytoplankton in some lakes near Konin. Rocz. Nauk Rol. 1988, Ser H 101, 9–130. [Google Scholar]
  88. Robson, B.J. When do aquatic systems models provide useful predictions, what is changing, and what is next? Environ. Modell. Softw. 2014, 61, 287–296. [Google Scholar] [CrossRef]
  89. Chang, M.Q.; Teurlincx, S.; DeAngelis, D.L.; Janse, J.H.; Troost, T.A.; Van Wijk, D.; Mooij, W.M.; Janssen, A.B.G. A Generically Parameterized model of Lake eutrophication (GPLake) that linksfield-, lab- and model-based knowledge. Sci. Total. Environ. 2019, 695, 13388. [Google Scholar] [CrossRef]
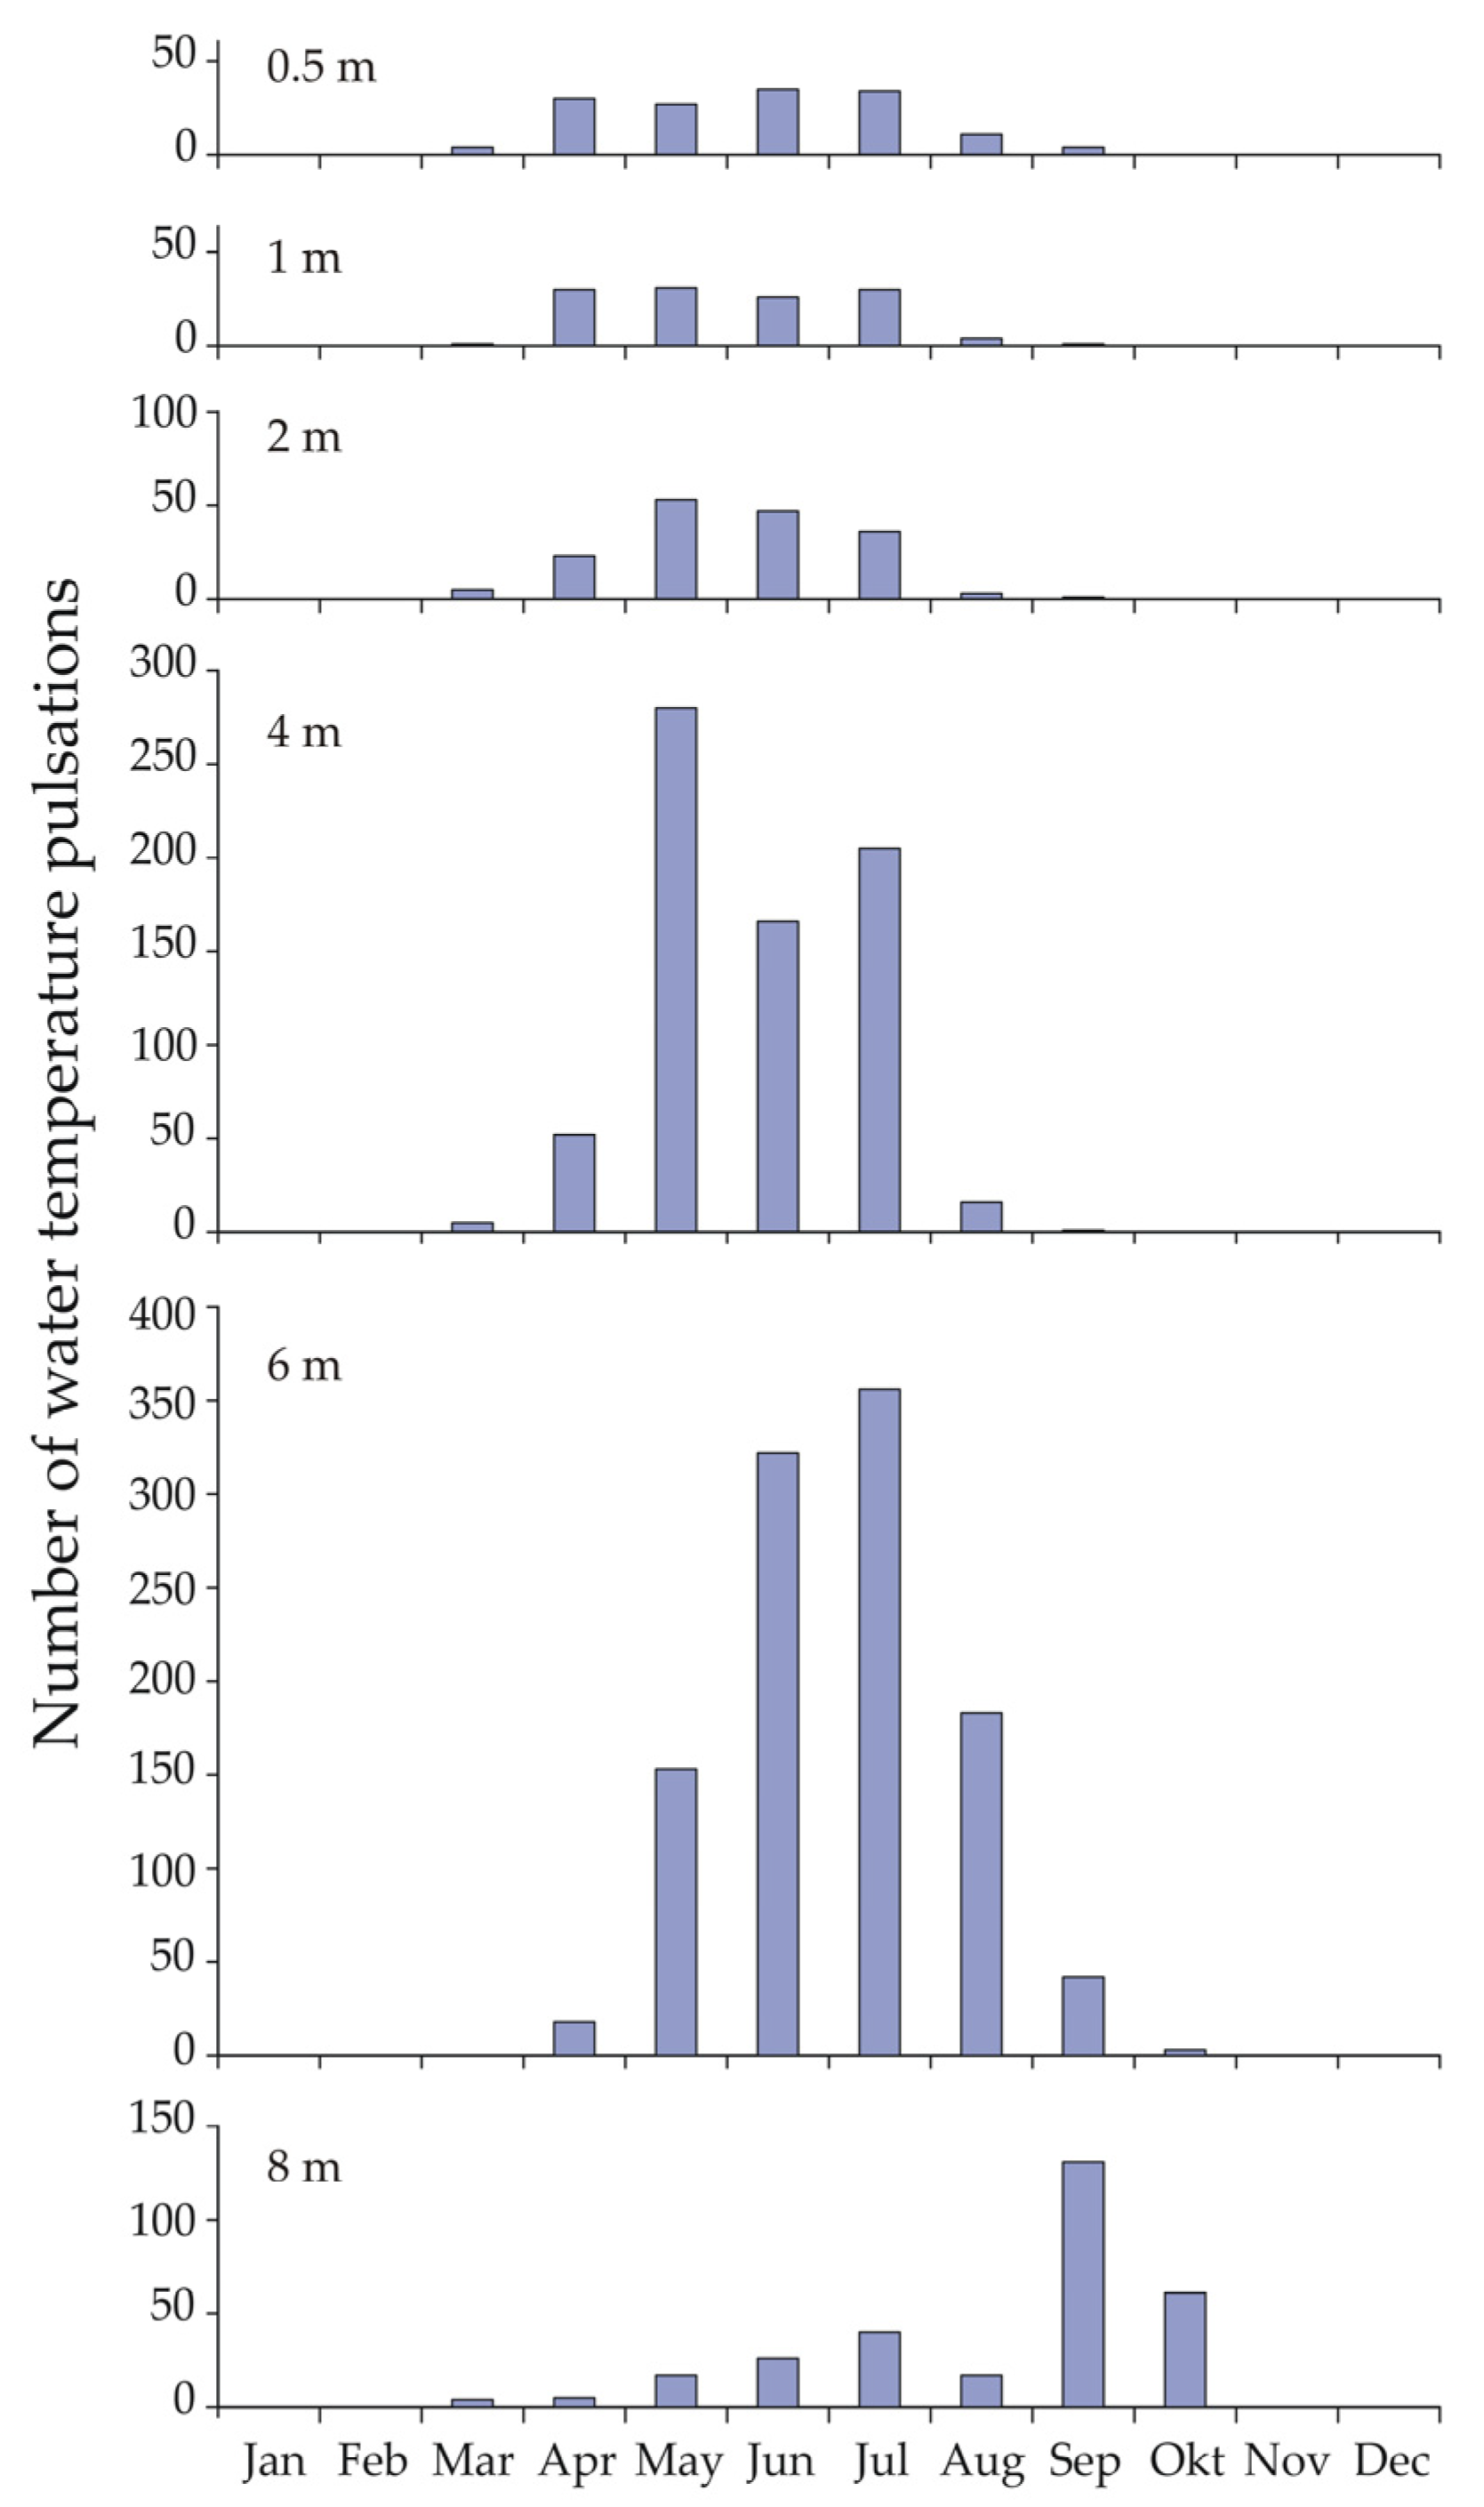
Figure 1. Number of water temperature pulsations (≥0.5 °C) in hourly intervals in Lake Bachotek in 2006. Based on data from Skowron and Piasecki [35].
Water 12 03574 g001
Figure 2. The course of the mean water temperature at depths of 0, 1, 2, 3, 4, 5 and 6 m and the average water temperature at 0–3 m in Lake Ślesińskie in the period from 1 to 10 July 1969 according to data from Chojnowski [55].
Water 12 03574 g002
Figure 3. The annual course of surface water temperature (°C) in Polish lakes in the years 1971–2010 (according to data compiled by Sobolewski et al. [34] based on the data of the Institute of Meteorology and Water Management) and the six best linear fitting results and nonlinear models for these data in TableCurve software [64]. CEFP—complementary error function peak; FTFI—four term function with intercept.
Water 12 03574 g003
Figure 4. Location of the studied lakes and synoptic stations used in the research. The blue line marks the area of the last glaciation. 1–4 is the number of lakes in the square of the ATPOL geobotanical grid, cf. [66,67]. The conversion of geographic coordinates into ATPOL designations and Cartesian grid coordinates was made using the MS Excel calculator, which is available on the website of the Institute of Botany of the W. Szafer Institute of Botany of the Polish Academy of Sciences in Krakow (https://botany.pl/atpol/).
Water 12 03574 g004
Figure 5. Number of in situ measurements of the water temperature (temperature profiles) in the 1951–1968 period in Polish lakes.
Water 12 03574 g005
Figure 6. Correlation between average monthly air temperatures and average monthly water temperatures. Correlation is statistically significant at a level of p < 0.001. Gray points are individual months; black points are individual months from June to August. The regression between average monthly air temperature and average monthly water temperature is shown at the solid line.
Water 12 03574 g006
Figure 7. The in situ measurements of the water temperature (average in the layer 0–3 m) in Polish lakes in the 1951–1968 period, with linear interpolation to calculate the daily temperature.
Water 12 03574 g007
Figure 8. The in situ measurements of the water temperature (average in the layer 0–3 m) in Polish lakes (a) in the years with a warm summer (with the warmest in 1959 and 1963) and (b) in the years with a cold summer (with the coldest in 1962 and 1965) in the 1951–1968 period, with linear interpolation to calculate the daily temperature. CEFP 1951–1968—complementary error peak function for the 1951–1968 period—Equation (1); CEFP warm summer—complementary error peak function for the years with the warm summer in the 1951–1968 period—Equation (2); CFPF cold summer—complementary error peak function for the years with the cold summer in the 1951–1968 period—Equation (3).
Water 12 03574 g008
Figure 9. The in situ measurements of the water temperature (average in the layer 0–3 m) in Polish lakes (a) in the years 2010–2019 and (b) in heated Lake Wąsowsko-Mikorzyńskie in 1969 (data after [56]), with linear interpolation to calculate the daily temperature. CEFP 1951–1968—complementary error peak function for the 1951–1968 period—Equation (1); CEFP warm summer—complementary error peak function for the years with the warm summer in the 1951–1968 period—Equation (3); CEFP cold summer—complementary error peak function for the years with the cold summer in the 1951–1968 period—Equation (4); CEFP Wąsowsko-Mikorzyńskie—complementary error peak function for heated Lake Wąsowsko-Mikorzyńskie in 1969.
Water 12 03574 g009
Table 1. Lake surface water temperature (LSWT) trends ranging from a global suite of lakes to a single lake. Presented trends are average or median (sometimes range) in °C decade−1, unless otherwise noted. “Type” indicates how measurements were taken (“IS” = in situ, “SAT” = satellite). The number following in parentheses indicates the number of lakes included in the study. “Location” indicates if the study was global, regional (“R”) or single lake (“SL”), with the country code (A—Austria; CH—Switzerland; PL—Poland; U.S.—United States) and/or the lake name (studies on single lake).
CitationTypeLocationLSWT Trends (°C Decade−1)Years
[49]IS (1)SL: L. Superior0.27 a1906–2005
[15]IS (1)SL: L. Zurich (CH)0.41 b1947–1998
[50]IS (4)R: UK0.35 c
(0.30–0.39) c
1960–2000
[50]IS (4)R: Austria0.43 c
(0.17–0.54) c
1961–2000
[51]IS (3)R: Holand0.42 d1961–2005
[52]IS (2)SL: L. Łebsko (PL)
SL: L. Charzykowskie (PL)
0.26 e
0.25 e
1961–2015
[53]IS (1)SL: L. Washington (U.S.)0.45 f1964−1998
[6]IS (85)
IS (226)
R: northeastern
North America
0.54 g
0.52 g
1975–2014
1985–2014
[54]IS (1)SL: Piburgersee (A)~0.36 h
0.65 h
0.10 h
1972–2015
1972−1993
1993–2015
[32]IS (14)R: Poland0.43 i
(0.32–0.64) i
1972–2016
[11]IS (118)
SAT (128)
Global0.34 j
(–0.7–1.3) j
1985–2009
Notes: a—Water temperature measured at Lake Superior outlet as a proxy of the offshore LSWT; b—temperature measured in surface mixed layer (0–2.5 m); c—surface–water temperature trends in summer; d—annual increase of water temperature irrespective of lake size and depth; e—mean annual water temperature trends; f—temperature data weighted over the surface (0–10 m); g—average near-surface water temperature trends; h—lake surface water temperature trends, 0–0.5 m; i—lake surface water temperature trends at a depth of 0.4 m under the water surface at 6.00 UTC; j—lake summer surface water temperatures trends (LSSWT).
Table 2. Lake surface water temperature (LSWT) trends of northern Poland lakes. Presented trends are the average (sometimes range) in °C decade−1.
CitationLake Name/ Number of LakesJuneJulyAugustSeptemberYears
[48]L. Jeziorak0.000.240.560.141961–2000
L. Mikołajskie−0.020.090.21−0.11
L. Hańcza0.290.210.38−0.04
L. Studzieniczne0.150.090.24−0.29
[34]280.390.580.480.391971–2010
(0.2–0.8)(0.4–1.0)(0.2–0.9)(0.1–0.7)
L. Jeziorak0.20.60.60.6
L. Mikołajskie0.30.60.50.4
L. Hańcza0.70.60.40.2
L. Studzieniczne0.20.60.40.3
[32]14(0.2–0.8)(0.4–0.8)(0.4–0.6)(0.1-0.7)1972–2016
Table 3. Correlation of the values estimated with the six best models from Figure 3 to average monthly surface water temperature (°C) in Polish lakes in the years 1971–2010. Source: Author calculations according to data compiled by Sobolewski at al. [34] based on the data of the Institute of Meteorology and Water Management.
Rank t CoefficientCorrelation Coefficientp Value
1CEFP64.590.99880<0.001
2Sine50.320.99803<0.001
3Sine250.320.99803<0.001
4CEFP 230.200.99456<0.001
5Gaussian29.000.99411<0.001
6FTFI24.600.99184<0.001
Notes: CEFP—complementary error function peak; Sine—sine waveform; Sine2—sine2 waveform; CEFP 2—complementary error function peak with other coefficients than CEFP; Gaussian—Gaussian peak; FTFI—four term function with intercept.
Table 4. Lake surface (in defined water layer 0–3 m) temperature trends of northern Poland lakes. Presented trends are average (sometimes range) in °C decade−1.
CitationNumber of LakesJuneJulyAugustSeptemberYears
This study100.240.290.300.261951–1968/2010–2019
Publisher’s Note: MDPI stays neutral with regard to jurisdictional claims in published maps and institutional affiliations.