Article

Warming of Near-Surface Summer Water Temperatures in Lakes of the Conterminous United States

1
Fisheries and Aquatic Sciences, School of Forest Resources and Conservation, University of Florida, Gainesville, FL 32653, USA
2
Department of Biology, York University, Toronto, ON M3J 1P3, Canada
*
Author to whom correspondence should be addressed.
Water 2020, 12(12), 3381; https://doi.org/10.3390/w12123381
Submission received: 30 October 2020 / Revised: 22 November 2020 / Accepted: 27 November 2020 / Published: 2 December 2020
(This article belongs to the Section Biodiversity and Functionality of Aquatic Ecosystems)

Abstract

:
Because warming water temperatures have widespread consequences for freshwater communities, we were interested in estimating the patterns and rates of change of near-surface summer water temperatures in United States lakes. We developed multiple regression models to relate daily surface water temperatures in lakes of the conterminous United States to 8-day average air temperatures, latitude, elevation, and sampling month and year using data from 5723 lake samples in the months of June-September during the period 1981–2018. Our model explained 79% of the variation with a root-mean-square error of 1.69 °C. We predicted monthly average near-surface water temperatures for 1033 lakes for each year from 1981 through 2018. Lakes across the conterminous United States have been warming for the period 1981–2018 at an average heating rate of 0.32 °C per decade for the summer months (June–September). The average summer warming from 1981–2018 would be the equivalent of a lake decreasing 259 m in elevation or moving 233 km south. On the basis of national air temperatures starting in 1895, it was inferred that lake water temperatures are variable from year to year and have been steadily increasing since 1964, but that maximum temperatures in the 1930s were just as warm as those in 2008–2018.

Graphical Abstract

1. Introduction

In recent decades, lakes have shown extensive responses to climate change including less seasonal winter ice cover [1,2], warmer surface water temperatures [3], modified mixing regimes [4], and decreases in water level and in surface water extent [5]. Warming water temperatures, in particular, have impacts on the increased likelihood of algal blooms [6,7], shifts in fish species distributions [8,9], declining fish productivity [10], and ecosystem functioning [11]. Because of the widespread importance of surface water temperatures to lake ecosystem functioning and ecosystem services, here we explore the patterns and trends in water temperatures across thousands of lakes distributed across the conterminous United States.
Near-surface summer lake water temperatures are highly influenced by climate conditions, such as air temperatures, shortwave and longwave solar radiation, cloud cover, and wind speed [12,13,14,15]. Generally, warmer lakes are found in regions with warmer air temperatures and higher solar radiation inputs [16]. In addition, lake morphometry and water chemistry, such as surface area, lake depth, and water clarity, can be important determinants of surface water temperatures. For example, within the same region, smaller, shallower, and clearer lakes tend to be warmer [14,17,18].
In a recent study, we found that 8-day average air temperatures, latitude, longitude, elevation, and month of sampling were important predictors of near-surface summer lake water temperatures for lakes distributed across the conterminous United States and southern Canada and then developed an empirical model to predict summer near-surface water temperatures of unsampled lakes [16]. The overall purpose of this study was to use those or similar equations to hindcast near-surface water temperatures in lakes across the United States for past years in order to quantify to what extent lakes have been warming. Our study involved six objectives: (1) test how well the Bachmann et al. [16] models predicted water temperatures across a broader temporal period (1981–2018), because the original models were developed with data from 2007 and 2012; (2) develop predictive models to hindcast water temperatures for any day for any lake in the conterminous United States for the months of June through September in the years 1981–2018; (3) calculate average summer water temperatures for each of 1033 United States lakes for the years 1981–2018; (4) use the calculated water temperatures for each year to determine summer warming trends for United States lakes over the period 1981–2018; (5) examine national average air temperature data for 1895–2018 to identify temporal patterns that might reflect changes in average lake water temperatures; and (6) use changes between average summer lake water temperatures with latitude and elevation to express lake heating rates in equivalent changes in latitudinal position and lake elevation. The 1033 lakes associated with the third objective had been selected as a part of a statistically based sampling program in the 2007 National Lakes Assessment (NLA) of the United States Environmental Protection Agency (USEPA) [19,20] that made it possible to use the results of those samples to find annual average values of water temperatures that are representative of 49,803 lakes in the conterminous United States.

2. Materials and Methods

2.1. Testing Predictive Equations of Bachmann et al.

For the purposes of this study, near-surface lake water temperatures are defined as the water temperatures measured at a depth of 1 m sometime during the daylight hours and hereafter will be referred to simply as water temperatures. In an earlier study [16], we developed predictive models that showed water temperatures in the summer months of lakes in the conterminous United States and southern Canada were quantitatively related to their 8-day average air temperature, sampling month, latitude, longitude, and elevation above sea level. The best model explained 81% of the variation in water temperature. However, the models of Bachmann et al. [16] were based on data collected in 2007 and 2012. Piccolroaz et al. [21] had cautioned about the use of air–water regression models when applied to air temperature ranges beyond the limits of the time series used in developing the equations. This raised the question of how well Bachmann et al.’s 2019 models [16] would perform for hindcasting temperatures outside of the 2007/2012 study years. We, therefore, devised a test of the ability of the equations to hindcast water temperatures in each of the 38 years in the period 1981–2018 by expanding our data collection for lakes sampled within the conterminous United States between 1981 and 2018.
We extracted water temperature data on lakes (natural and manmade) from the United States Geological Survey’s (USGS’s) Water Quality Portal (https://www.waterqualitydata.us/), which aggregates access to multiple databases, including the USEPA’s Storage and Retrieval Data Warehouse (STORET) and the USGS National Water Information System (NWIS). We filtered the data to obtain water temperatures measured at 1 m depth in the months of June through September. The obtained water temperatures were measured by a variety of government agencies and universities and we assumed them to be accurate. However, in many cases, stringent quality control programs like those of the USEPA’s NLA were not associated with the measurements. Our search also provided the geographic coordinates of each of the selected lakes. Ultimately, we obtained from 49 to 207 lake water measurements for each year in the 1981–2018 period with an average of 133 lakes per year. Data were obtained for lakes in 36 states as not all states contributed data to the Water Quality Portal. Most measurements came from lakes in Minnesota, Michigan, Wisconsin, North Carolina, and Vermont. Because most of the sampled lakes were from low elevations, we added data from several lakes with elevations greater than 500 m that were collected as a part of the NLA [20,22]. Our final dataset included 5078 lake temperature measurements from the Water Quality Portal and 645 lake temperature measurements from the NLA for a total of 5723 samples in the period 1981–2018. In some cases, temperature measurements were obtained from the same lake for 1 to 4 months in the same year or for more than one year. A flow chart of the data sets and analyses used in this study is presented in Figure 1. Mean air temperatures at each lake for the day of sampling and for each of the preceding seven days were obtained from the website of the PRISM Climate Group, Oregon State University (http://prism.oregonstate.edu, created 23 May 2019). Their website allows one to obtain mean daily air temperatures, other meteorological data, and lake elevations based on a grid of 30-arcseconds of latitude and longitude. The cells are about 900 m × 700 m in size [23]. We tested the four predictive models developed by Bachmann et al. [16] on the 5723 lake temperature samples collected in this study to calculate estimated water temperatures for each of the samples. The measured water temperatures at each lake were subtracted from the calculated water temperatures to evaluate how well the models developed by Bachmann et al. [16] could hindcast past temperatures. Regressions were run of the differences between calculated and measured values versus the year of sampling.

2.2. Development of New Predictive Equations for 1981–2018

We found that when we applied the equations of Bachmann et al. [16] to our sample values over the period 1981–2018, the calculated values tended to overestimate the measured temperatures early in the time period (see Results). We, therefore, developed a new set of predictive equations. We randomly split our data set into a training group (4723 observations) and a testing group (1000 observations). With the training group, we used multiple regression models for each month using a forward stepwise multiple regression of water temperatures as the dependent variable and 8-day air temperature, latitude, elevation, and year as independent variables. When each variable was added to the regression, we recorded the probability that the variable was statistically significant, the coefficient of determination (R2), the root-mean-square error (RMSE), and the Akaike information criterion (AIC). In our final equations, we only included variables that were statistically significant (p < 0.05) and reduced the AIC when they were added. We used the observations in the testing group to determine how well the new equations predicted the water temperatures. We also calculated standardized beta coefficients to compare the importance of the independent variables in the predictive equations. We used the JMP software, v14.0 [24] for all of our statistical summaries and analyses.

2.3. Calculation of Near-Surface Water Temperatures

We used the new multiple regression equations which included sampling year as a variable to calculate the daily summer water temperatures in a representative sample of United States lakes in order to calculate an average summer near-surface water temperature for each year. For this objective, we used the locations of the 1033 lakes sampled by the USEPA during the 2007 NLA [20]. These lakes had been selected as a part of a statistically based sampling program designed to find national average values for various chemical and biological variables. The lakes were identified using the National Hydrography Dataset as a basis and selected with a stratified random sampling technique [19,25]. This design was necessary because lakes are found mostly in the few states that had been impacted by the Wisconsin glaciation, but we wanted to sample lakes in all 48 contiguous states. Likewise, we wanted to obtain information on larger lakes, even though most lakes are of smaller size. In this process, each lake was given a numerical weight to represent a number of similar lakes in terms of size and location. In the NLA, the measured chemical or biological variables in each lake were multiplied times their numerical weights to find average values that are representative of 49,803 lakes in the conterminous United States. In our case, we used the calculated daily temperatures in each of the 1033 lakes and their weights to find a weighted national daily near-surface water temperature for each summer day for each of the 38 years using the new equations developed from the multiple regressions for each month. Data on air temperatures were again obtained from the PRISM website, and latitude and elevation were obtained from the NLA data set. We used the calculated daily water temperatures to calculate an average near-surface water temperature for each summer month for each lake for each of the 38 years in our study. We also calculated an average annual summer water temperature using the average annual monthly temperatures for the months of June, July, August, and September.

2.4. Calculation of Rates of Change of Lake Water Temperatures

For each of the 38 years of study, we calculated the average annual water temperatures for the months of June, July, August, and September and for the summer period of June through September. For each month and the summer period, the annual average near-surface water temperatures were regressed against years to determine if the slopes of the regressions were statistically different from 0.0 (p < 0.05). Thus, the slopes would represent the rates of change in near-surface water temperatures for the population of lakes in the United States in the period 1981 through 2018.
An alternative approach was to look for changes in annual average temperatures in each of the 1033 individual lakes by finding the slopes of the regressions of annual average water temperatures for the months of June, July, August, and September individually and for the summer period versus years. The slopes also would represent the rates of change in water temperatures in the period 1981–2018. We then determined the means, standard deviations, and the frequency distributions of the slopes for the summer and each of the summer months. To determine if the rates of temperature change in individual lakes were related to geographical locations of the lakes, we plotted the monthly slopes on maps of the conterminous United States to identify spatial patterns.
To determine if rates of changes in average water temperatures in individual lakes were related to rates of change in average monthly air temperatures over the lakes, we again used the PRISM website to find the average monthly air temperatures in the summer for each of the 1033 lakes for each of the years 1981–2018. For each lake, we ran regressions of average annual air temperatures by month and the summer against years to find the slopes of the rates changes in average air temperatures over the period 1981–2018. The rates of change of average air temperatures were plotted on maps to compare with the distributions of rates of change of water temperatures.

2.5. Finding Annual Average Summer Lake Temperatures

The process we have used to find the estimated average water temperatures of United States lakes works well, but it is limited to recent years as the detailed mean air temperatures data for each lake do not start on the PRISM website until 1981. To look for relationships that might indicate trends in water temperatures for years prior to 1981, we extracted the average annual national summer air temperatures for the contiguous United States for the period 1 June through 30 September for each of the 38 years using the website of the National Oceanic and Atmospheric Administration (NOAA, https://www.ncdc.noaa.gov/cag/). We then ran a regression for our calculated average annual estimated summer water temperatures versus the annual national summer average air temperatures. Because we found that there was a close relationship between the average annual national summer air temperatures and the average annual water temperatures, we plotted the national summer average air temperatures in United States lakes during the period 1895–2018 against time as an indication of how lake temperatures might have changed in that time period. We used Locally Weighted Scatterplot Smoothing (LOWESS) to fit a non-parametric curve of temperatures versus time using the method of Cleveland [26] in the JMP statistical package [24].

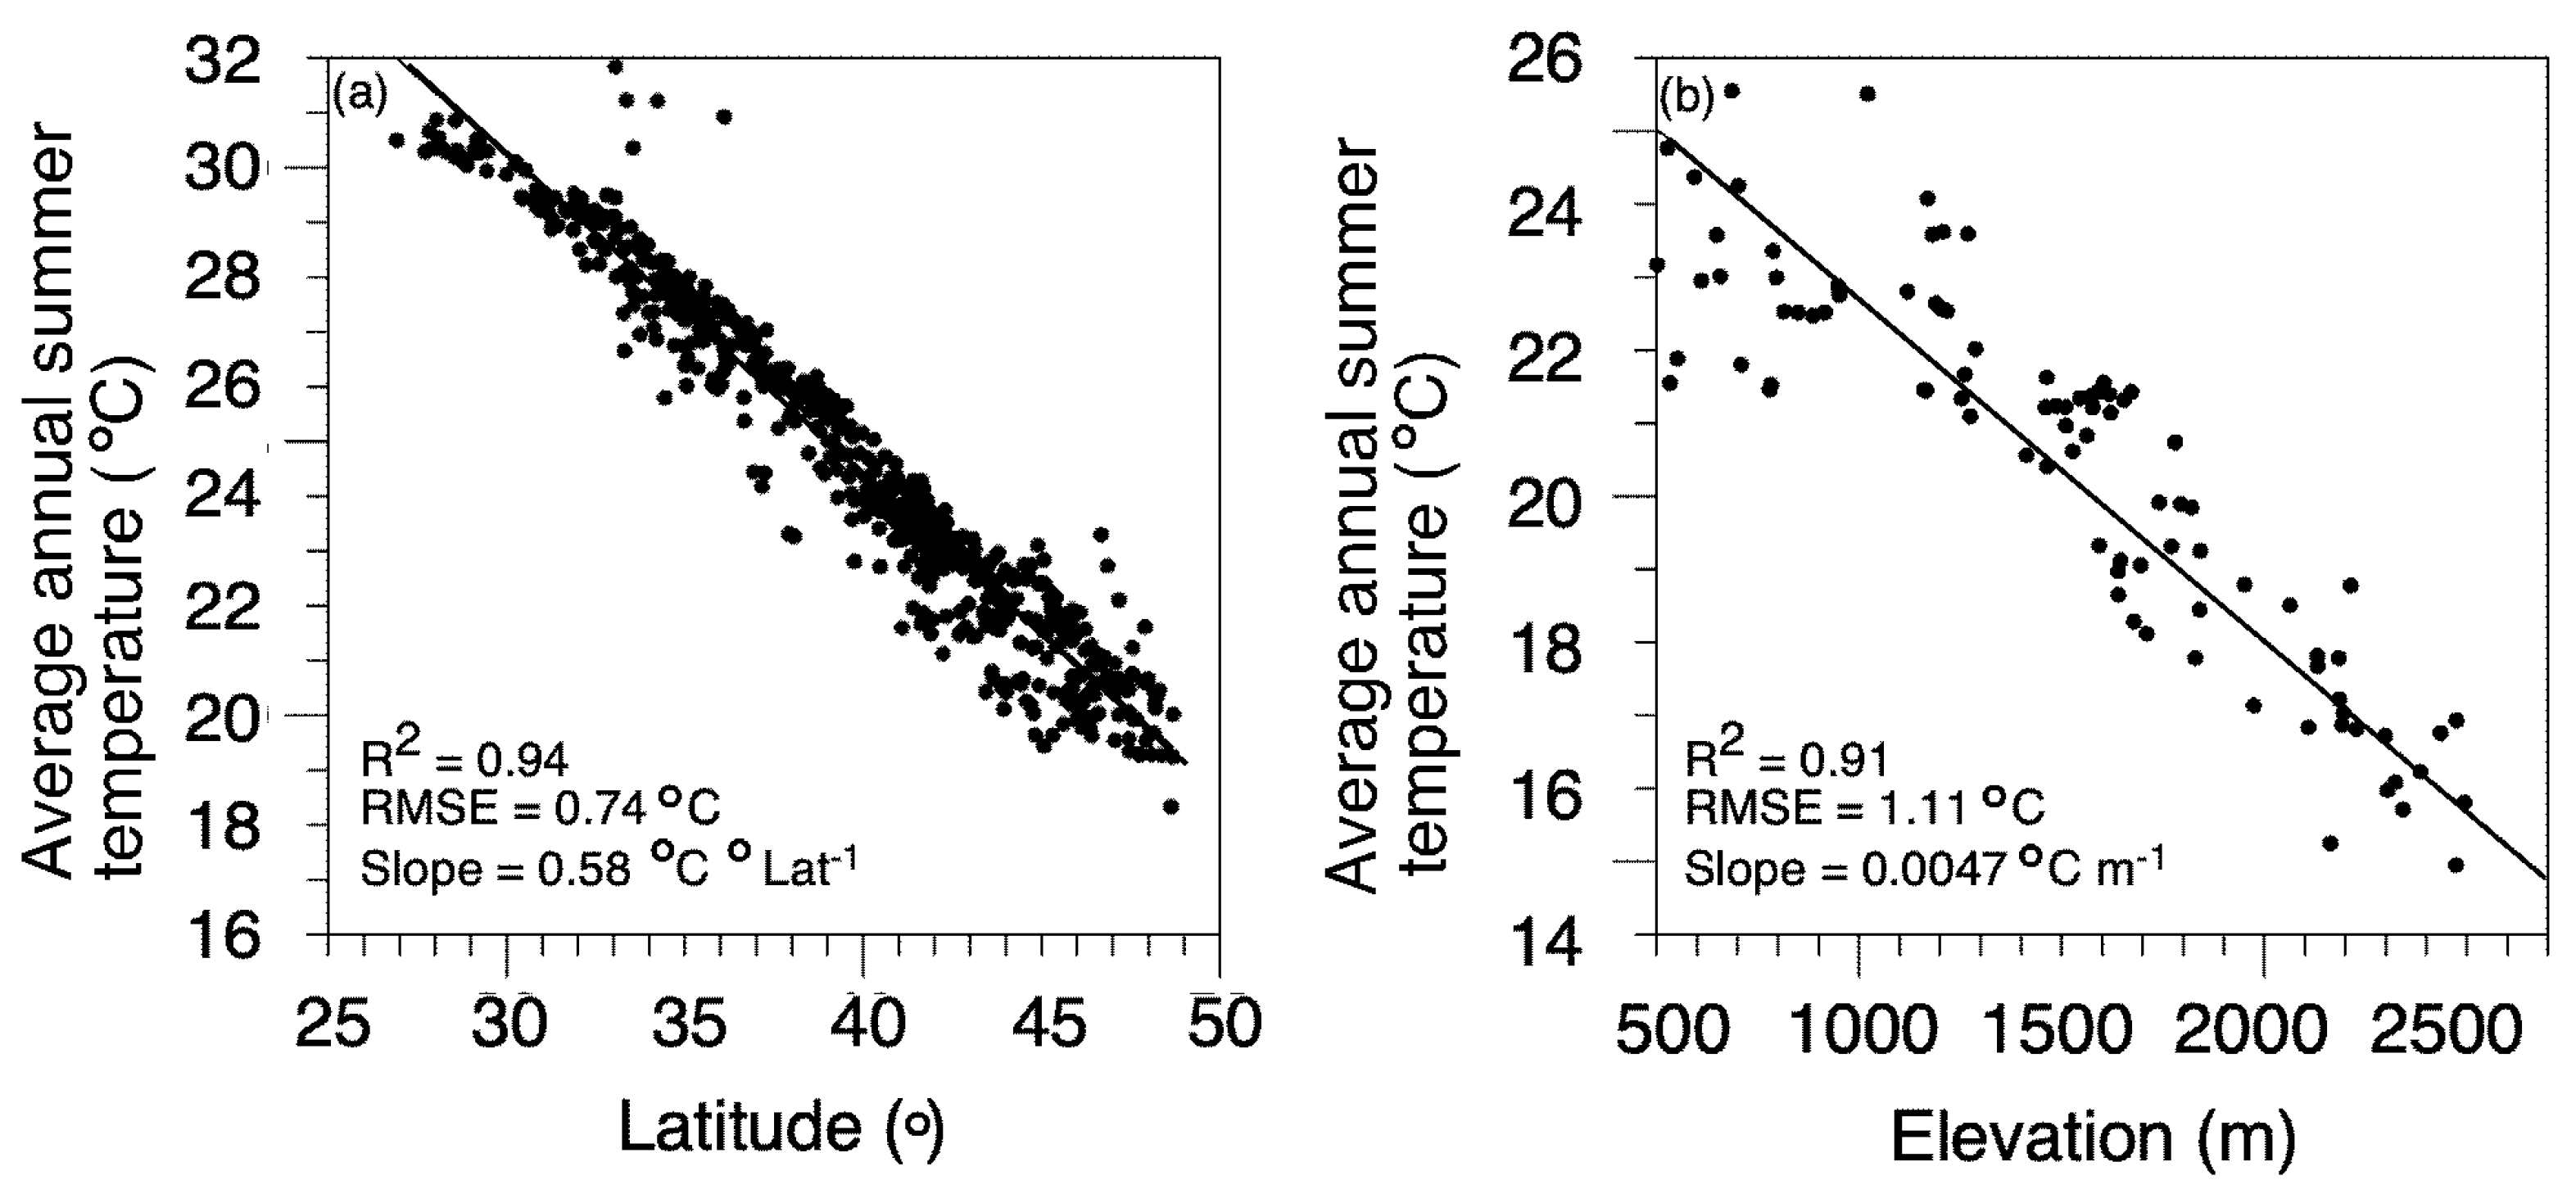
2.6. Effects of Latitude and Elevation on Water Temperatures

Because it was known that summer lake temperatures decrease with increases in latitude and elevation [16], we wished to relate the average rates of change in summer water temperatures over time to the changes in averaged water temperatures observed with latitude and elevation because of the effects such changes could have on lake biota. For the effect of latitude, we used the averages of summer water temperatures for the 1033 individual lakes in the period 1981–2018 and removed lakes with elevations greater than 500 m in order to reduce the known effects of elevation on water temperatures. We then ran a regression of average summer water temperatures versus latitude and found the slope of the regression in units of changes in water temperatures divided by changes in latitudes in degrees. We used the common conversion factor of 111 km per degree of latitude [27] to convert the slope to change in temperature per kilometer. For the analysis of the effects of elevation, we used lakes with elevations of 500 m or greater. To further reduce the possible effects of latitude we only used lakes whose latitudes were in the range of 37 to 42 degrees north latitude. We regressed average summer temperatures versus elevation and found the slope in units of degrees of water temperature per meter of elevation. This information was used to convert rates of change in temperature with time to equivalent decreases in distances moved south for lowland lakes and in decreases in elevation for high elevation lakes.

3. Results

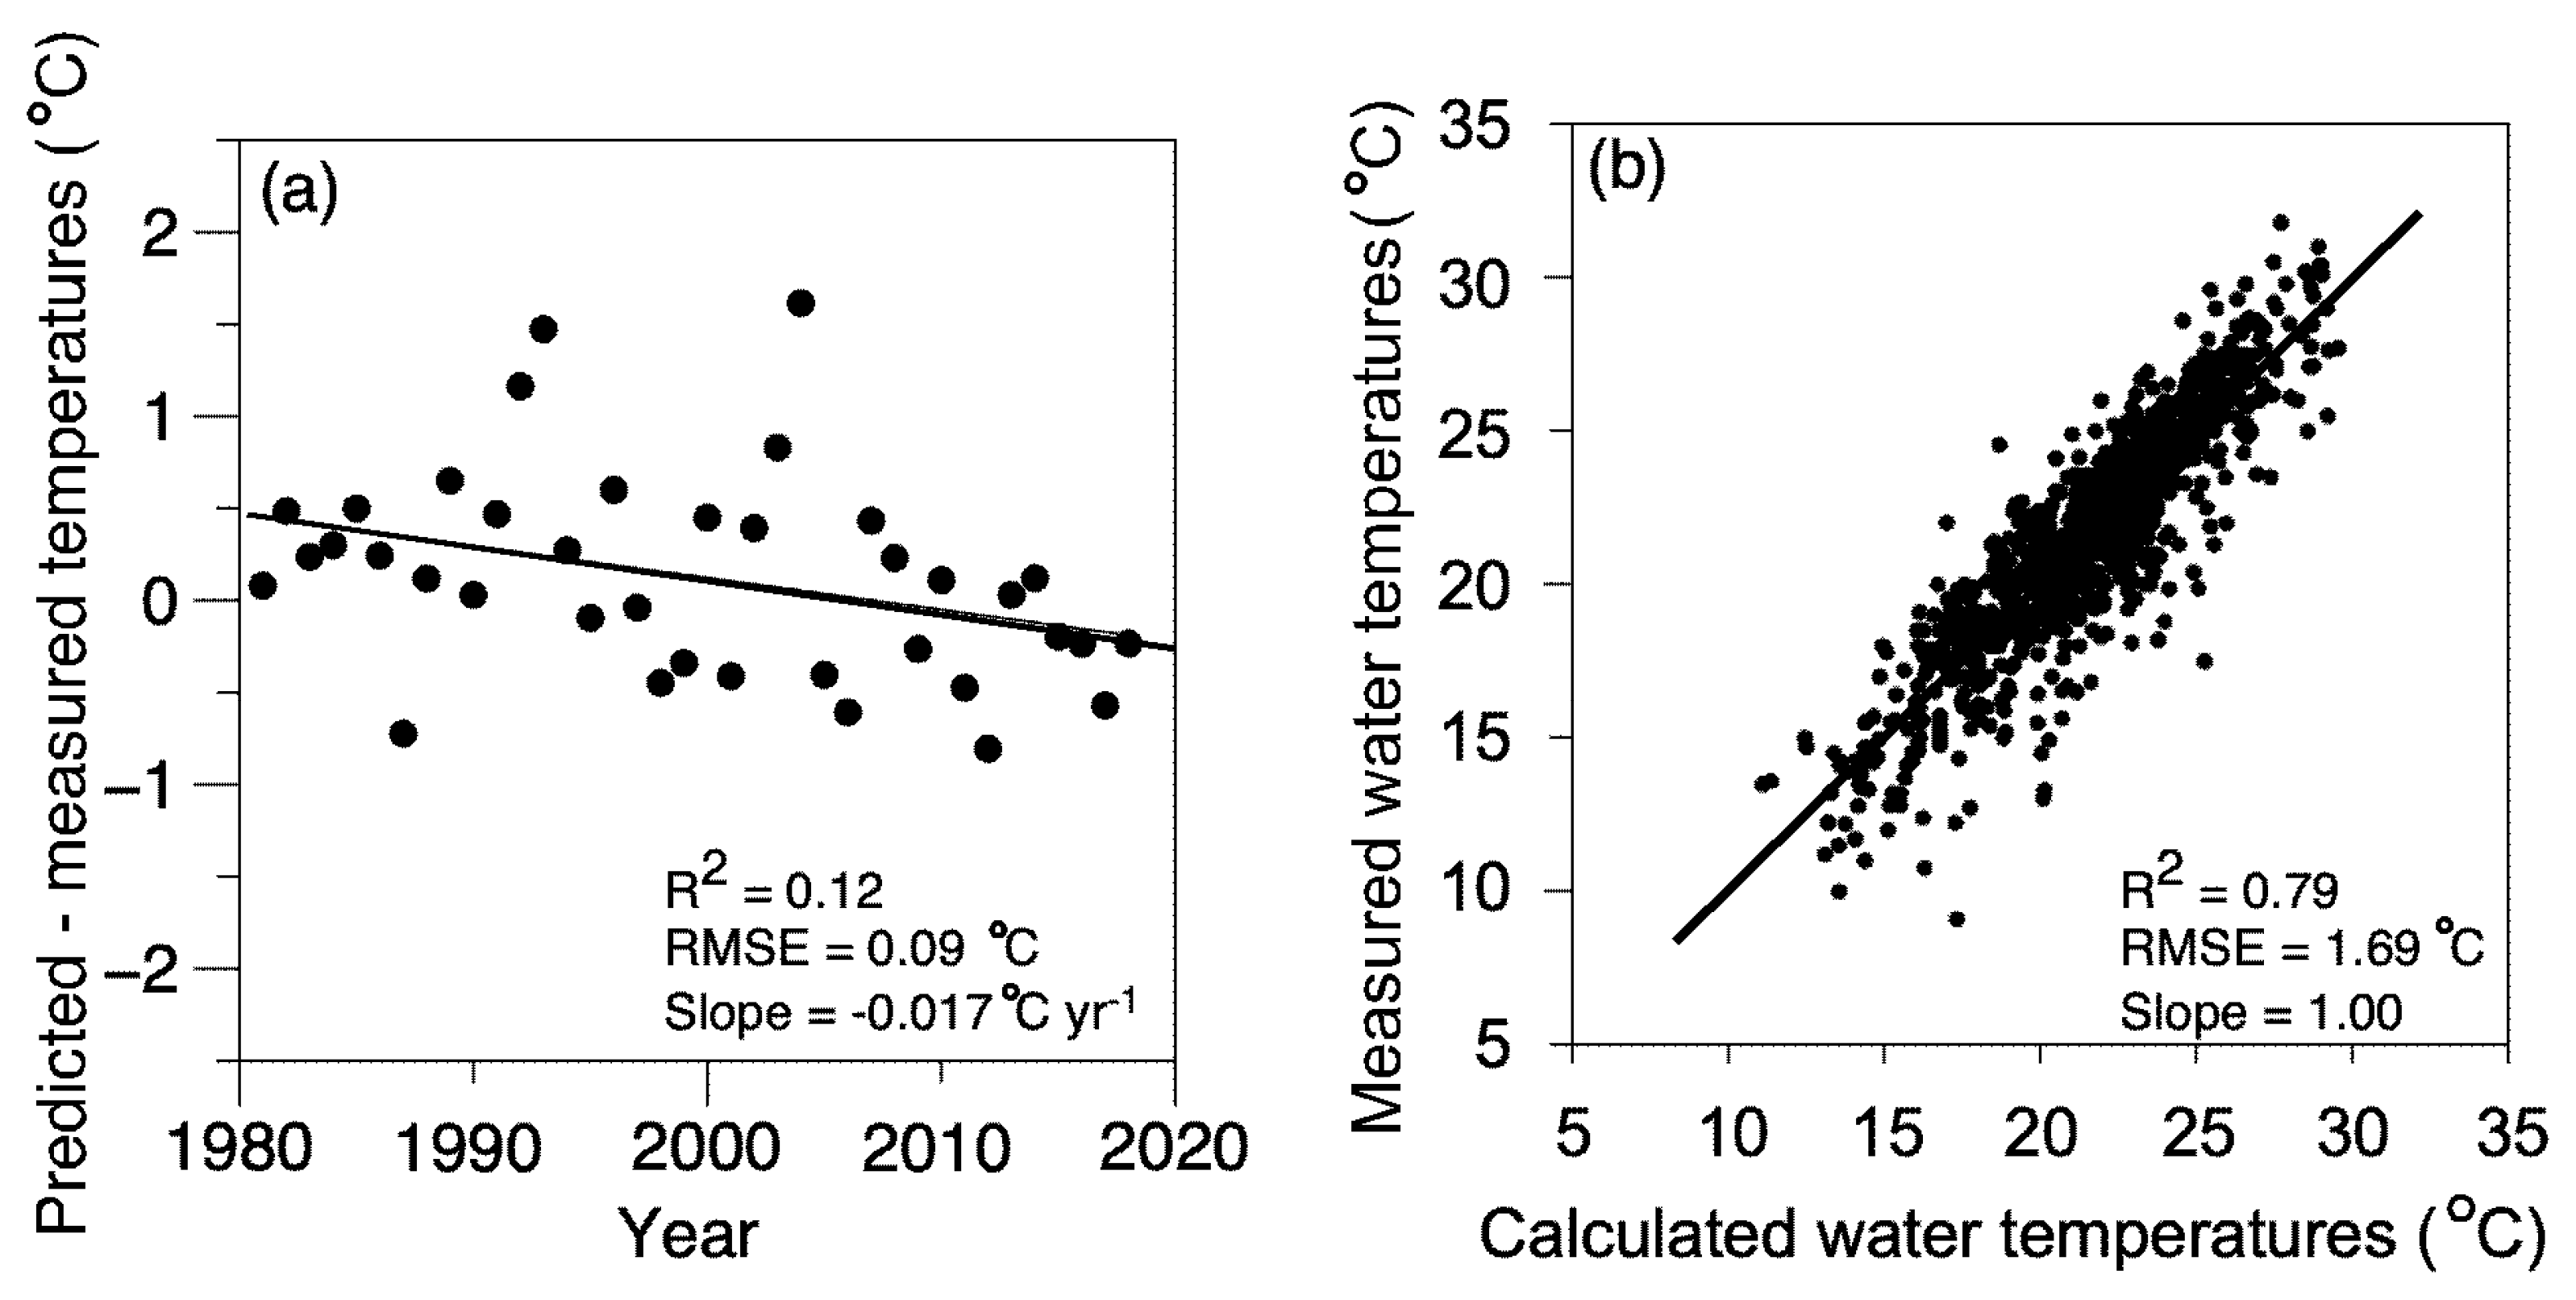
3.1. Developing Predictive Equations for the Period 1981–2018

We found the differences between the measured water temperatures and those calculated with the four predictive models developed by Bachmann et al. [16] for the 5723 lake temperature samples collected in this study between 1981 and 2018. When regressions were run on the differences between measured and calculated water temperatures, we found that the slopes of these regressions, though relatively small, were significantly different from 0.0 (Figure 2a, p < 0.05). This indicated that the year of sampling needed to be included in the predictive equations to account for changes in the relationships between air and surface water temperatures in the period 1981–2018. We developed four new predictive relationships for hindcasting water temperatures in United States lakes in the period 1981–2018. The equations for the months of June, July, August, and September are:
TempJune = −8.93+ 0.620 Air − 0.114 Lat − 0.00158 Elev + 0.0122 Year
TempJuly = −15.42+ 0.513Air − 0.132 Lat − 0.00254 Elev + 0.0178 Year
TempAugust = −11.69+ 0.542 Air − 0.209 Lat − 0.00205 Elev + 0.0170 Year
TempSeptember = −23.09 + 0.538 Air − 0.315 Lat − 0.00158 Elev + 0.0239 Year
where TempMonth is the calculated daily water temperature in the subscripted month (°C), Air is the 8-day average mean daily air temperature (average of daily maximum and minimum) at a lake ending on the day of sampling (°C), Lat is the latitude of the lake (°), Elev is the elevation of the lake above sea level (m), and Year is the year of sampling. When we applied the equations to the lakes in our testing data set, we found good agreement between measured and calculated summer daily water temperatures for 1000 lakes sampled between 1981 and 2018 Figure 2b. The R2 was 0.79 and the RMSE was 1.69 °C. Using the averages of the standardized beta coefficients in the multiple regressions for the months of June, July, August, and September, we found that the 8-day air temperatures were most important with a value of 0.63. Next in importance were elevation with −0.29, latitude with −0.18, and years with 0.07.

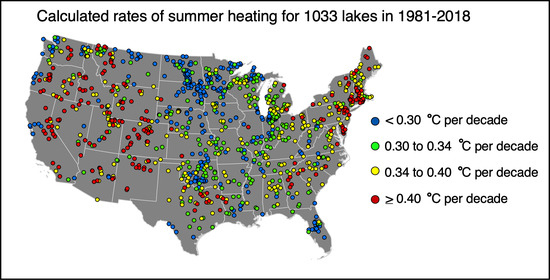
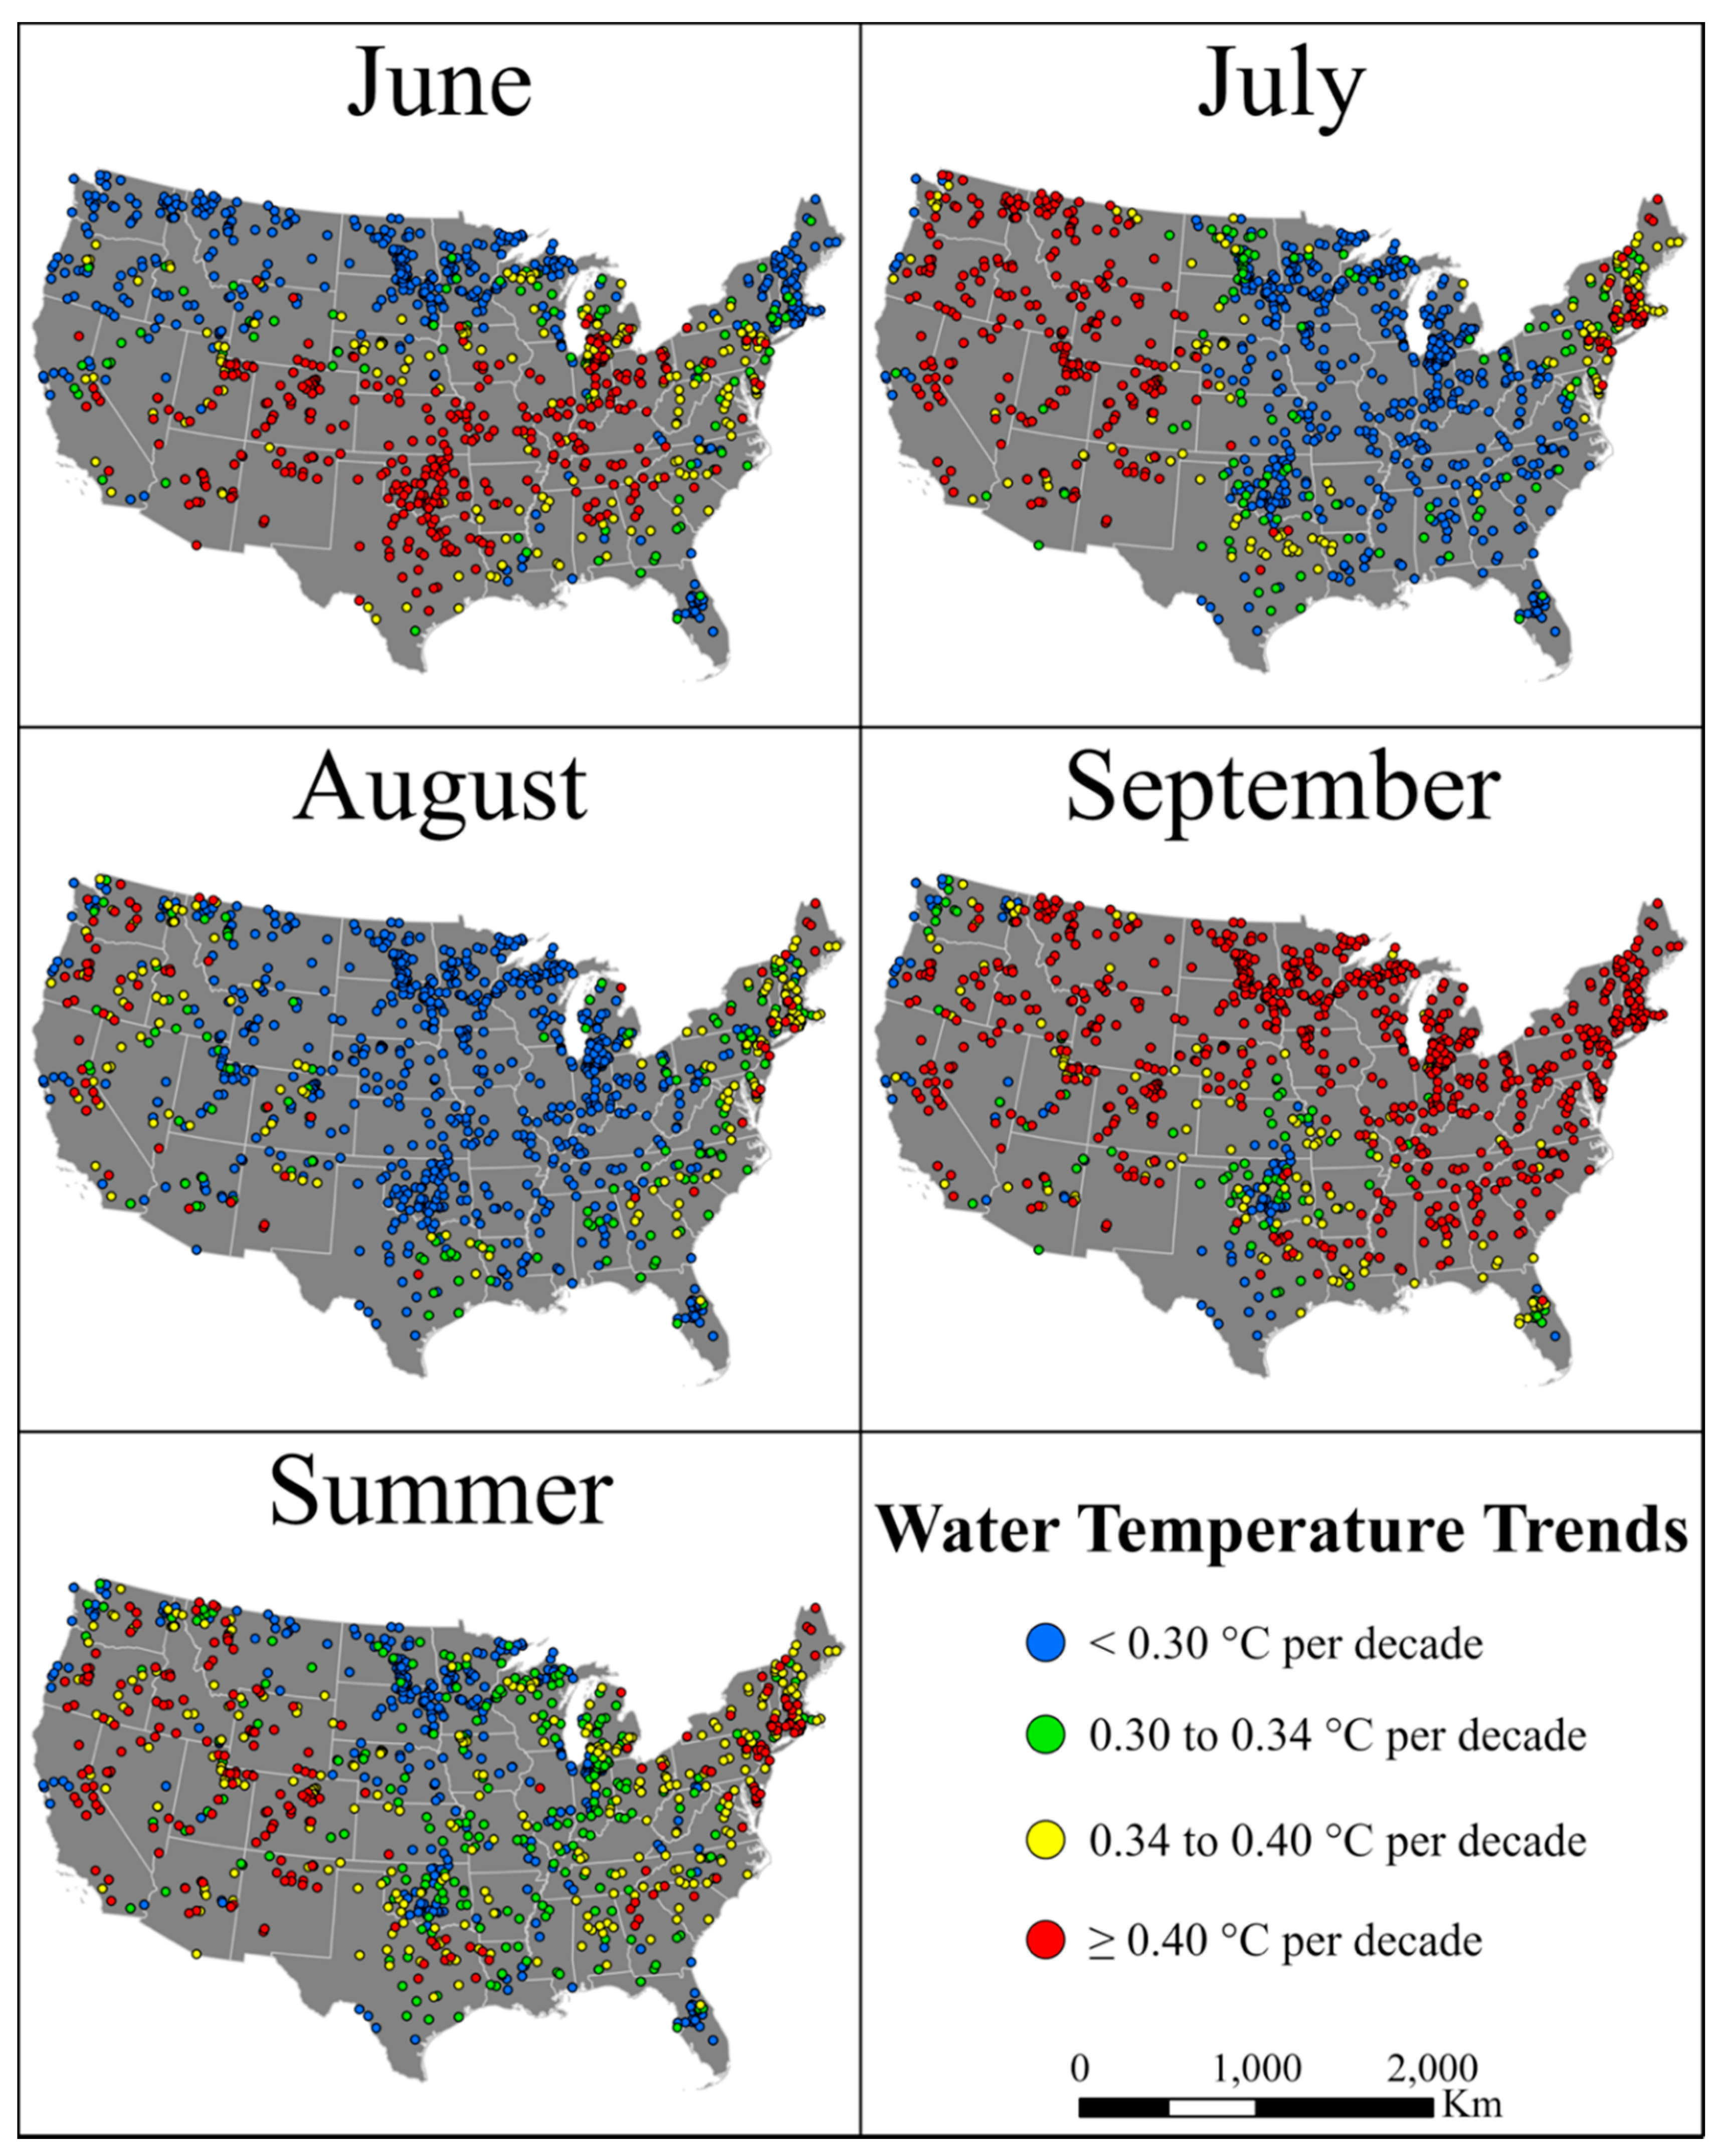
3.2. Trends in Average Summer Water Temperatures in the Period 1981−2018

We found that the near-surface summer water temperatures of United States lakes on average have been warming during the period 1981–2018. Our regressions of monthly weighted average water temperatures developed by the application of Equations (1)–(4) to our sample of 1033 lakes against year of sampling showed statistically significant positive slopes for each of the summer months and the 4-month summer, see Figure 3a–e and Table 1.
For the four-month summer period, the warming rate was 0.32 °C decade−1. The fastest warming rate was for the month of September with 0.49 °C decade−1 followed by the months of June and July both with rates of 0.31 °C decade−1, and August (0.22 °C decade−1). We also calculated our results for different combinations of three or two months for comparisons with the results of other studies (Table 1).
When we examined the distribution of rates of change in water temperatures in the period 1981 to 2018 among individual lakes, see Table 2, we found that the mean and median rates were very similar to each other and ranked the same as the rates calculated on the basis of average annual water temperature for United States lakes, see Table 1. The highest rates of warming were in September followed by June, July, and August, see Table S1. There was considerable variation among lakes for each time period as shown by the coefficients of variation that ranged from 22% in September to 46% in August.
There was an uneven distribution of the rates of temperature change in the individual lakes across the contiguous United States depending on the period of sampling, see Figure 4. For example, the lakes with the highest rates of temperature change (indicated by red dots showing >0.40 °C decade−1) are clustered southwest of the center of the map in June. In July, the greater rates of change extended across most of the western states, but by August there were small numbers of lakes with changes > 0.40 °C decade−1 in the northwest and northeast United States. For September, there were large clusters of lakes in the north-central states and in the eastern states warming rapidly, while for the entire summer the highest rates tended to cluster in the western states with warming rates >0.40 °C decade−1. For the summer, the five highest average rates were found in the states of New Mexico, Colorado, New Jersey, Delaware, and Wyoming while the five lowest average rates were in the states of South Dakota, North Dakota, Florida, Minnesota, and Indiana, see Table S2. Variations in the lake water heating rates were related to variations in the rates of increase in average air temperatures in the period 1981–2018, see Figure 5.

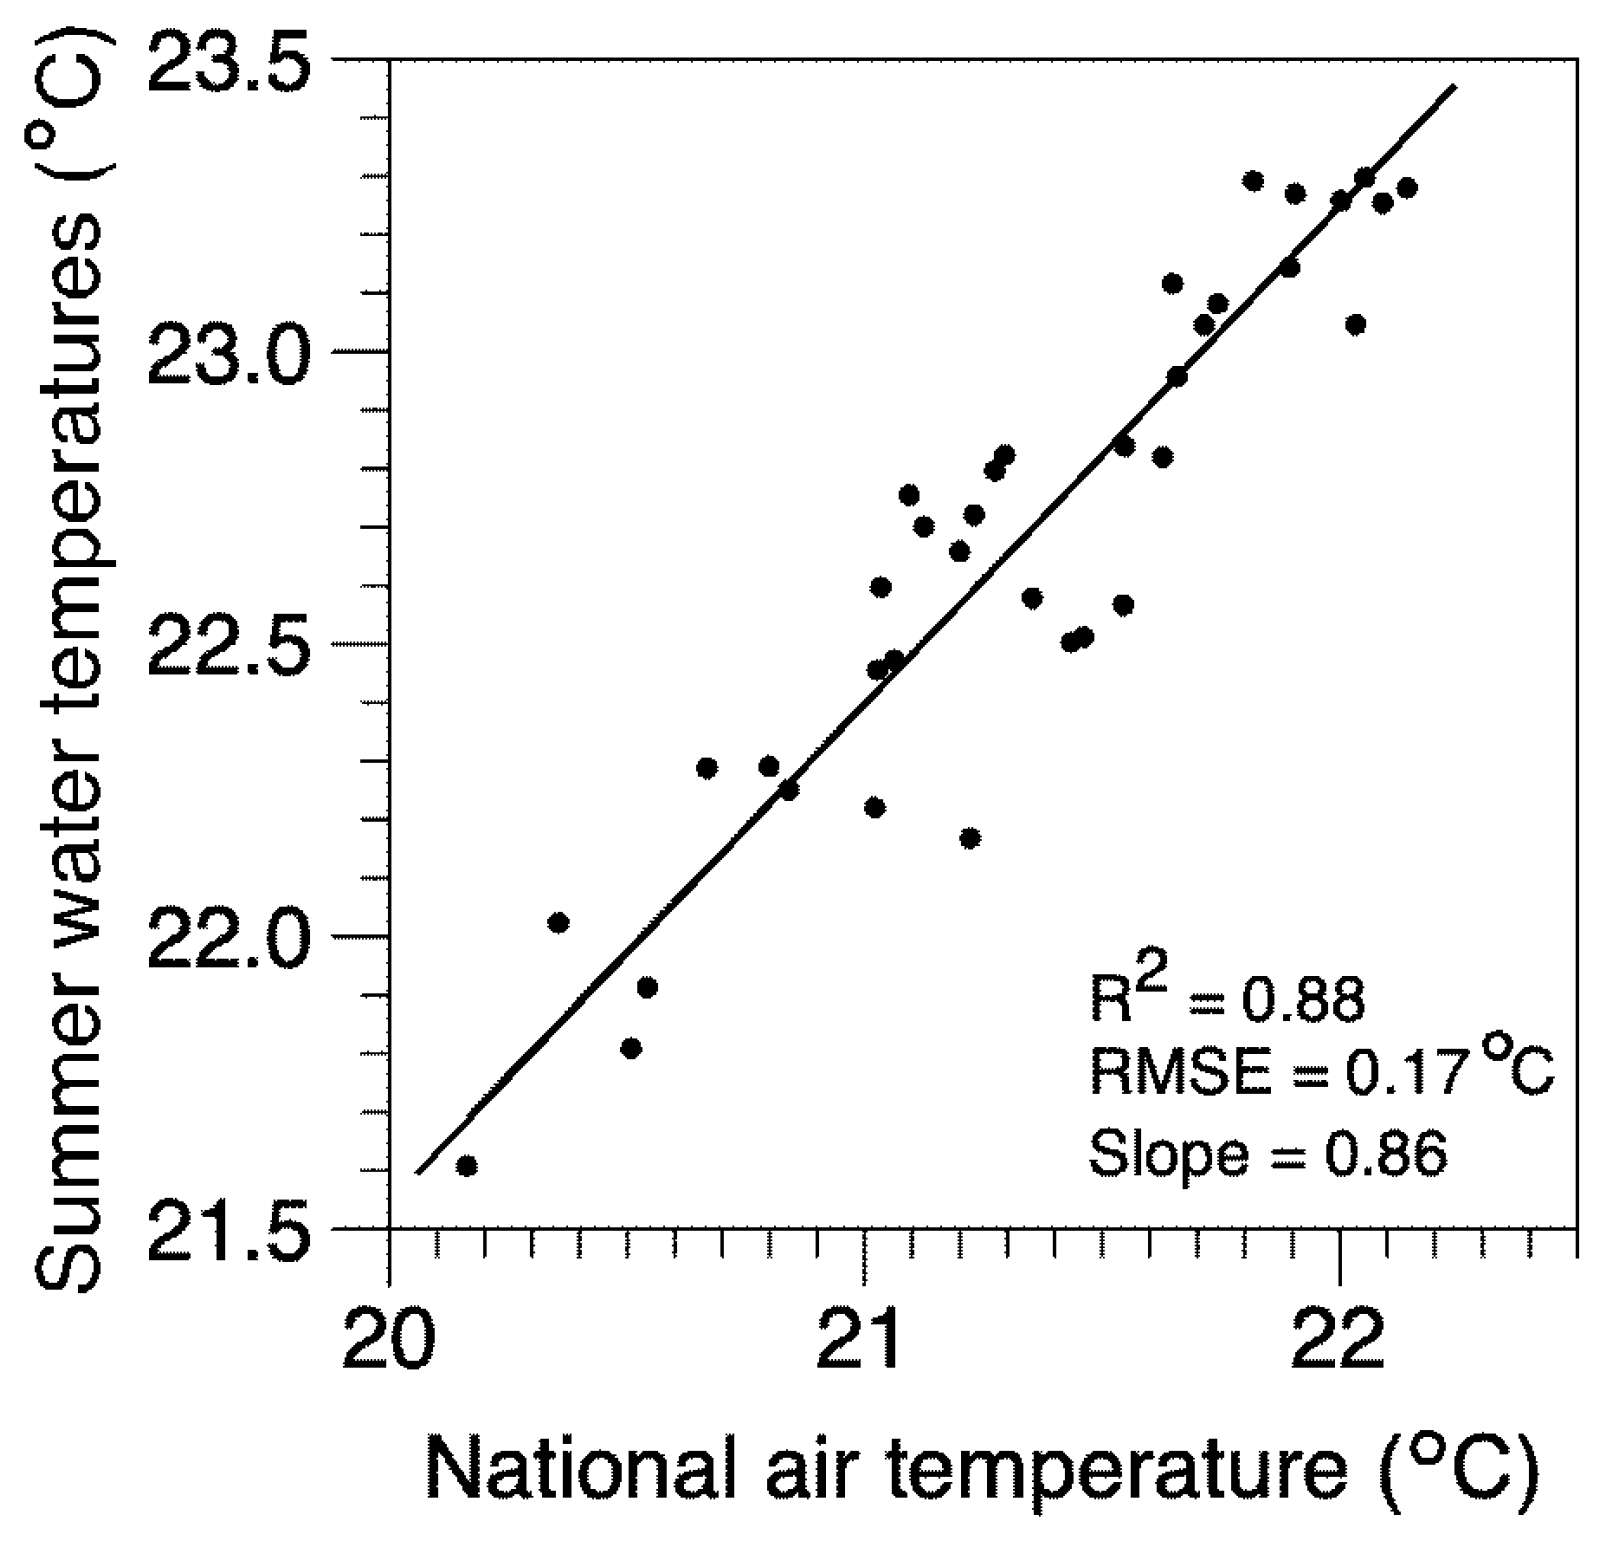
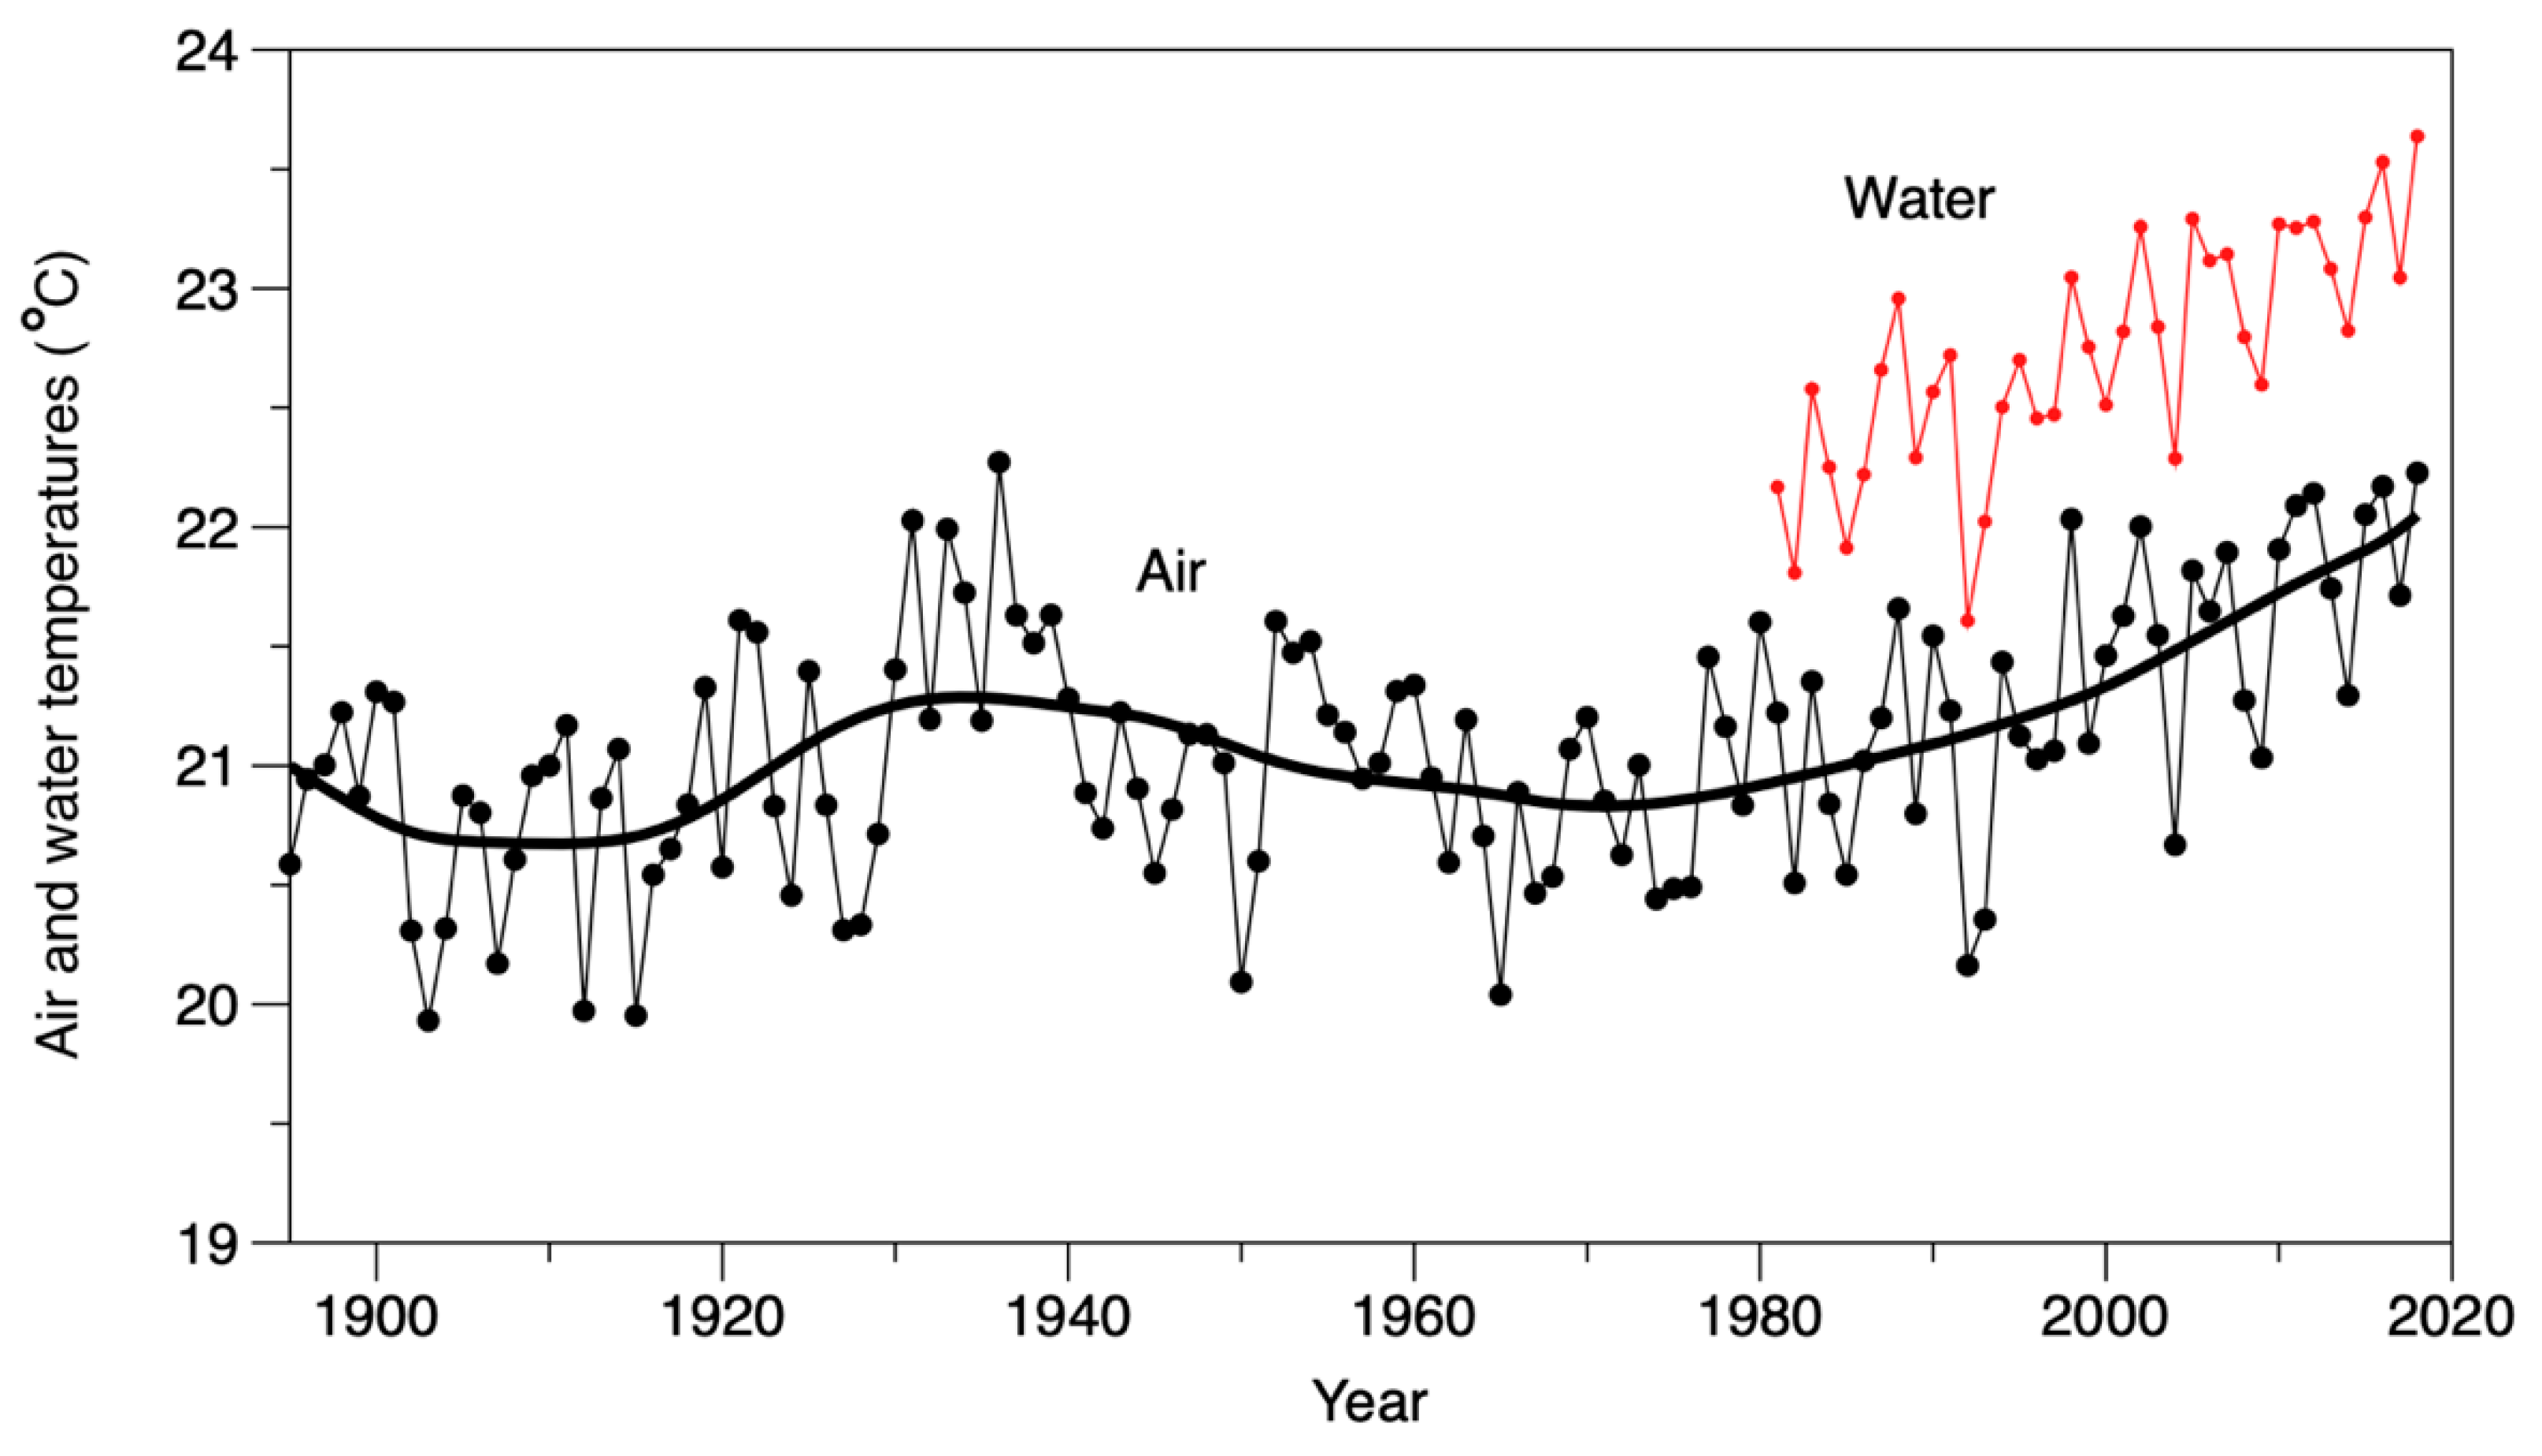
3.3. Trends in Average National Summer Air and Water Temperatures

The average rates of change in water temperature for United States lakes in the summer for the years 1981–2018 were strongly related to the average annual summer national air temperatures for the contiguous United States with an R2 of 0.88 and an RMSE of 0.17 °C, see Figure 6. The relationship is given by:
WT = 4.57+ 0.857 AirNational
where WT is the predicted average summer water temperature for conterminous United States lakes and AirNational is the average annual summer national air temperatures for the contiguous United States. This finding was important because data on national average summer air temperatures on NOAA’s website (https://www.ncdc.noaa.gov/cag/) start in 1895, so the long-term changes in national air temperatures should give an indication for the long-term changes in lake temperatures for United States lakes over 122 years, see Figure 7. Because Equation (5) was developed for the period 1981–2018, we cannot use it to directly calculate past temperatures in the period 1895–1980 as there may have been changes in the exact relationship between air and water temperatures in that time period. We do expect that in general the trends will be similar with years of high air temperatures being years of high lake water temperatures, see Figure 4, Figure 5 and Figure 7.
There is great variability in the average national air temperatures from year to year, see Figure 7, during the 1895 to 2018 period. Using LOWESS regression analysis, we found a small reduction in average air temperatures until about 1910. Air temperatures then tended to rise to a high point in the early 1930s, followed by a decrease until about 1964, after which national air temperatures began an increasing trend through 2018. The greatest air temperatures calculated for the 1930s are similar to the maximum air temperatures found in the period 2008 to 2018. Because of the common finding that lake water temperatures tend to follow air temperatures, the general trends in lake temperatures most likely mirror those of the national air temperatures, see Figure 6 and Figure 7.

3.4. Temperature Changes with Changes in Latitude and Elevation

There were strong relationships between the average water temperatures and latitudes (R2 = 0.94) and elevations (R2 = 0.91) such that temperatures decreased with increasing latitude and increasing elevations, see Figure 8a,b. Temperatures increased by 0.58 °C per degree of latitude progressing in a southerly direction, thus, the latitude effect would be 0.0052 °C km−1. For elevations, the slopes of the regression lines indicated that average water temperatures increased by 0.0047 °C for every meter of decrease in elevation. This value is close to the rate of 0.0038 °C m−1 found by Lewis [28] for several tropical lakes.

4. Discussion

4.1. Predictive Equations for Summer Lake Temperatures

In this study, we developed models to predict near-surface summer water temperatures for individual lakes across the conterminous United States. Multiple linear regression models including air temperatures, latitude, elevation, and sampling year reliably predicted summer surface water temperatures for 1000 lakes. The relationship between predicted and measured daily temperatures yielded an RMSE of 1.69 °C. These models were an improvement on the earlier predictive equations developed by Bachmann et al. [16] as we found that the predicted values in the earlier years tended to overestimate the measured values in the period 1981–2018. By including year as a coefficient, we have accounted for changes over time in the relationship between air temperatures and water temperatures in this sample of lakes [8], because the Bachmann et al. [16] equations were developed with data from 2007 and 2012. It is possible that other important climatic variables such as wind velocity, humidity, cloud cover, and solar radiation inputs may have changed during this time period.

4.2. Trends in Average Summer Water Temperatures in the Period 1981–2018

We found that the annual average near-surface water temperatures of United States lakes in the summer months of June through September in the period 1981–2018 warmed at an average rate of 0.32 °C decade−1, see Table 1. This is in agreement with O’Reilly et al. [3] who found an average heating rate of 0.34 °C decade−1 in the period 1985–2009 for a global group of 235 lakes for the months of July through September. Our heating rate for the same period (July through September) was 0.34 °C decade−1. For comparison, Adrian et al. [29] presented July heating rates for 12 lakes for various periods between 1970 and 2009 and found an average rate of warming of 0.43 °C decade−1. Specifically, the rates of warming for their lakes ranged from 0.00 °C decade−1 (Lakes Baikal, Muggelesee, and Champlain and Blue Chalk Lake) to 1.57 °C decade−1 (Lake Stensjon). The value of 0.00 indicates no significant change in temperatures.
When looking at water temperature averages for United States lakes, we found September was the fastest-warming month with a warming rate of 0.49 °C decade−1. Water temperatures in June and July warmed at rates of 0.31 °C decade−1, while the August average rate was the slowest at 0.22 °C decade−1. Other lake temperature studies focused on Wisconsin also found that for most of the Wisconsin lakes they studied, the maximum heating rates were found in the fall months and resulted in a delay in fall cooling [30,31]. Higher rates of warming in lakes in the fall season could be contributing to delayed dates of ice formation in north temperate lakes [32]. However, we also found a high degree of variability in warming rates among lakes with monthly coefficients of variation ranging from 22% to 46%, such that some individual lakes showed no or negative rates of temperature change.
The geographic distribution of rates of temperature change differed by month, see Figure 4. Areas showing high or low rates of change in one month would not necessarily show the same patterns in other months. For example, the fastest-warming lakes in June were found in the southern United States typically below the 0 °C isotherm where lakes are unlikely to experience winter ice cover [2]. In contrast, lakes found in more northern regions of the United States exhibited the fastest rates of warming in September.

4.3. Trends in Average Summer Air and Water Temperatures 1895–2018

The plot of national air temperatures versus years showed that since 1895 there has been large variability in the average temperatures from year to year, see Figure 7. However, the application of a LOWESS regression to the data suggested there were general patterns in the heating and cooling of air temperatures over time. The greatest measured air temperatures found in the 1930s during the Dust Bowl years [33] are similar to maximum air temperatures found in the period 2008 to 2018. Given that we and others have found a close correspondence between air temperature and lake water temperatures, we expect that average lake water temperatures will follow the same trends as air temperatures over time. This expectation is in accord with the findings of Lathrop et al. [31] who found that the summer epilimnetic temperatures in Wisconsin lakes during many years in the 1930s and 1940s were likely as warm as recent (up through 2017) epilimnetic temperatures. Lathrop et al. [31] also noted that the Wisconsin lakes they studied had unusually cool epilimnetic temperatures in the summers of 1992 and 1993. This was attributed to solar dimming resulting from the eruption of Mt. Pinatubo in the Philippines in June 1991 that resulted in summer cooling in 1992–1993 in several regions across the globe. We also note the decrease in the average national air temperatures in 1992 and 1993, see Figure 7, and the corresponding dips in lake water temperatures in 1992, see Figure 3a–e.

4.4. Implications of Lake Warming

Our summer warming rates of 0.032 °C year−1 in the period 1981–2018 would be the equivalent of a lake moving south about 6.1 km year−1or losing 6.8 m of elevation a year. Over the 38-year period from 1981 to 2018, the summer warming of lake near-surface water temperatures would be the equivalent of a lowland lake moving 233 km south or an average mountain lake decreasing 258 m in elevation. These calculations give some perspective on how lake heating may influence lake properties and distributions of aquatic organisms, such as macrophytes, invertebrates, and fish. For example, the range of warmwater fishes, such as the smallmouth bass (Micropterus dolomieu), are expanding northwards in direct response to the warming of near-surface summer water temperatures in north temperate lakes [34,35]. Concurrently, the range of suitable thermal habitat for coolwater and coldwater fishes, such as walleye (Sander vitreus), cisco (Coregonus artedi), and lake trout (Salvelinus namaycush), are rapidly disappearing from the northern United States [36,37]. The northern United States is at the southern extent of the biological range for many coolwater and coldwater fish species, such as walleye and lake trout, and the vulnerability of these fishes is further exacerbated by the loss of suitable thermal habitat in direct response to climate change as well as competitive interactions with warmwater fishes, such as smallmouth bass [9,37]. Continued accelerated warming of near-surface water temperatures may continue to impact freshwater ecosystems across the United States in unexpected ways.

4.5. Methodology for Estimating Near-Surface Water Temperatures

There is an interest in knowing what lake temperatures were in the past. For example, the distributions of many aquatic animals like fish are dependent on lake temperatures. Increases in water temperatures may allow some species to expand their range northwards and force other species to decline in an area because the waters are becoming warmer. The zoogeographer is hindered because there are only a small number of lakes with temperature records that extend over several decades. We were trying to find a way to extend our knowledge of lake warming to a broader range of lakes that do not have a history of temperature records. One approach would be to construct numerical models based on the physics involved in the determination of lake temperatures. Eindinger et al. (1968) explained that one of the most important factors governing the temperature of a lake is the exchange of heat across the air–water interface, and that the rate of heat exchange is the sum of the rates that heat is transferred by radiative processes, evaporation, and conduction between water and the overlying air. They discussed how a knowledge of meteorological variables could be used to estimate temperatures in water bodies. As an example of this approach, Hondzo and Stephan (1993) developed predictive models of temperatures for Minnesota lakes using solar radiation, air temperature, dew point temperature, wind speed, wind direction, and precipitation.
There is a limit to the expansion of such physical models, however, since we do not have historical data for many of those meteorological variables for a broad range of lakes. Of necessity, we followed an alternative approach using relationships between air temperatures and near-surface water temperatures in lakes. There have been many studies where relationships have been developed between air temperatures and the surface water temperatures in the summer in a particular lake [38,39,40,41,42]. These empirical models yield fairly good results, even though they do not directly use all of the important physical variables. Kettle et al. (2004) make the point that air temperatures are important in calculating surface water temperatures because they are related to all heat exchange processes except the absorption of solar radiation and the emission of long-wave radiation from the lake surface. They also point out that air temperatures are often correlated with humidity and cloud cover. Thus, these models work because the air temperatures are related to several of the factors that are directly involved in the transfer of heat energy in and out of lakes. This is shown by the fact that an air-temperature-based model cannot be applied directly to another lake that was not used in its calibration. Presumably, the factors not measured like solar radiation and relative humidity vary enough across the United States to alter the constants in the simple models. We found serendipitously in a previous study [16] that we could develop models that could be widely applied to lakes in the conterminous United States and southern Canada if we included information on geographic location like latitude and elevation as well as summer month. Presumably, these variables accounted for alterations in the models from place to place. In this study, we found that the relationships between air temperatures and water temperatures in lakes of the conterminous United States changed slightly between 1981 and 2018. These changes might reflect some basic changes in the factors that are directly involved in determining lake water temperatures. Our empirical models are limited in their accuracy because they do not directly measure many of the important physical variables; however, they did perform well (RMSE 1.69 °C) when applied to 1000 lake samples not used in the formulation of the models for the period 1981–2018. This study was designed specifically for the lakes in the conterminous United States. It was dependent on the grid of historic temperature data obtainable from the PRISM website. The approach might work in other geographic regions where there is comparable historic air temperature data as well as water temperature data on lakes over time that could be used in a calibration.

5. Conclusions

Near-surface water temperatures in lakes of the conterminous United States vary from year to year, but on average have been increasing at a rate of 0.32 °C decade−1 during the summer months of 1981–2020. Warming rates were greatest in September (0.49 °C decade−1) and lowest in August (0.22 °C decade−1). For individual lakes, the monthly heating rates were not evenly distributed across the United States and changed from month to month. The highest summer rates were found in lakes of New Mexico, Colorado, New Jersey, Delaware, and Wyoming and the lowest in South Dakota, North Dakota, Minnesota, and Oklahoma. The observed lake heating may influence lake properties and the distributions of aquatic organisms, such as macrophytes, invertebrates, and fish.

Supplementary Materials

The following are available online at https://www.mdpi.com/2073-4441/12/12/3381/s1, Table S1: Calculated heating rates by month for each of the 1033 lakes in our statistical sample. Table S2: Average monthly heating rates by state.

Author Contributions

Conceptualization, R.W.B., D.E.C.J., and S.S.; methodology, R.W.B., D.E.C.J., and S.S.; software, R.W.B.; formal analysis, R.W.B.; data curation, R.W.B.; writing—original draft preparation, R.W.B., D.E.C.J., and S.S.; writing—review and editing, R.W.B., D.E.C.J., S.S., and V.L.; visualization, V.L. All authors have read and agreed to the published version of the manuscript.

Funding

There was no outside funding for this study.

Conflicts of Interest

The authors declare no conflict of interest.

References

  1. Magnuson, J.J.; Robertson, D.M.; Benson, B.J.; Wynne, R.H.; Livingstone, D.M.; Arai, T.; Assel, R.A.; Barry, R.G.; Card, V.; Kuusisto, E.; et al. Historical trends in lake and river ice cover in the Northern Hemisphere. Science 2000, 289, 1743–1746. [Google Scholar] [CrossRef] [Green Version]
  2. Sharma, S.; Blagrave, K.; Magnuson, J.J.; O’Reilly, C.M.; Oliver, S.; Batt, R.D.; Magee, M.R.; Straile, D.; Weyhenmeyer, G.A.; Winslow, L.; et al. Widespread loss of lake ice around the Northern Hemisphere in a warming world. Nat. Clim. Chang. 2019, 9, 227–231. [Google Scholar] [CrossRef]
  3. O’Reilly, C.M.; Sharma, S.; Gray, D.K.; Hampton, S.E.; Read, J.S.; Rowley, R.J.; Schneider, P.; Lenters, J.D.; McIntyre, P.B.; Kraemer, B.M.; et al. Rapid and highly variable warming of lake surface waters around the globe. Geophys. Res. Lett. 2015, 42, 10773–10781. [Google Scholar] [CrossRef] [Green Version]
  4. Woolway, R.I.; Kraemer, B.M.; Lenters, J.D.; Merchant, C.J.; O’Reilly, C.M.; Sharma, S. Global lake responses to climate change. Geophys. Res. Lett. 2020, 1, 388–403. [Google Scholar]
  5. Wan, W.; Zhao, L.; Xie, H.; Liu, B.; Li, H.; Cui, Y.; Ma, Y.; Hong, Y. Lake surface water temperature change over the Tibetan plateau from 2001 to 2015: A sensitive indicator of the warming climate. Geophys. Res. Lett. 2018, 45, 11–77. [Google Scholar] [CrossRef]
  6. Brookes, J.D.; Carey, C.C. Resilience to blooms. Science 2011, 334, 46–47. [Google Scholar] [CrossRef]
  7. Rigosi, A.; Hanson, P.; Hamilton, D.P.; Hipsey, M.; Rusak, J.A.; Bois, J.; Sparber, K.; Chorus, I.; Watkinson, A.J.; Qin, B.; et al. Determining the probability of cyanobacterial blooms: The application of Bayesian networks in multiple lake systems. Ecol. Appl. 2015, 25, 186–199. [Google Scholar] [CrossRef]
  8. Sharma, S.; Jackson, D.A.; Minns, C.K.; Shuter, B.J. Will northern fish populations be in hot water because of climate change? Glob. Chang. Biol. 2007, 13, 2052–2064. [Google Scholar] [CrossRef]
  9. Van Zuiden, T.M.; Chen, M.M.; Stefanoff, S.; Lopez, L.; Sharma, S. Projected impacts of climate change on three freshwater fishes and potential novel competitive interactions. Divers. Distrib. 2016, 22, 603–614. [Google Scholar] [CrossRef] [Green Version]
  10. O’Reilly, C.M.; Alin, S.R.; Plisnier, P.D.; Cohen, A.S.; McKee, B.A. Climate change decreases aquatic ecosystem productivity of Lake Tanganyika, Africa. Nature 2003, 424, 766–768. [Google Scholar] [CrossRef]
  11. Lehnherr, I.; Louis, V.L.S.; Sharp, M.; Gardner, A.S.; Smol, J.P.; Schiff, S.L.; Muir, D.C.; Mortimer, C.A.; Michelutti, N.; Tarnocai, C.; et al. The world’s largest High Arctic lake responds rapidly to climate warming. Nat. Commun. 2018, 9, 1–9. [Google Scholar] [CrossRef]
  12. Edinger, J.E.; Duttweiler, D.W.; Geyer, J.C. The response of water temperatures to meteorological conditions. Water Resour. Res. 1968, 4, 1137–1143. [Google Scholar] [CrossRef]
  13. Hondzo, M.; Stefan, H.G. Regional water temperature characteristics of lakes subjected to climate change. Clim. Chang. 1993, 24, 187–211. [Google Scholar] [CrossRef]
  14. Sharma, S.; Walker, S.C.; Jackson, D.A. Empirical modelling of lake water-temperature relationships: A comparison of approaches. Freshw. Biol. 2008, 53, 897–911. [Google Scholar] [CrossRef]
  15. Woolway, R.I.; Merchant, C.J.; Van Den Hoek, J.; Azorin-Molina, C.; Nõges, P.; Laas, A.; Mackay, E.B.; Jones, I.D. Northern Hemisphere atmospheric stilling accelerates lake thermal responses to a warming world. Geophys. Res. Lett. 2019, 46, 11983–11992. [Google Scholar] [CrossRef] [Green Version]
  16. Bachmann, R.W.; Sharma, S.; Canfield, D.E.; Lecours, V. The distribution and prediction of summer near-surface water temperatures in lakes of the coterminous United States and Southern Canada. Geosciences 2019, 9, 296. [Google Scholar] [CrossRef] [Green Version]
  17. Woolway, R.I.; Jones, I.D.; Maberly, S.C.; French, J.R.; Livingstone, D.M.; Monteith, D.T.; Simpson, G.L.; Thackeray, S.J.; Andersen, M.R.; Battarbee, R.W.; et al. Diel surface temperature range scales with lake size. PLoS ONE 2016, 11, e01542466. [Google Scholar] [CrossRef] [Green Version]
  18. Rose, K.C.; Winslow, L.A.; Read, J.S.; Hansen, G.J. Climate-induced warming of lakes can be either amplified or suppressed by trends in water clarity. Limnol. Oceanogr. Lett. 2016, 1, 44–53. [Google Scholar] [CrossRef]
  19. Peck, D.; Olsen, A.R.; Weber, M.H.; Paulsen, S.G.; Peterson, C.; Holdsworth, S.M. Survey design and extent estimates for the National Lakes Assessment. Freshw. Sci. 2013, 32, 1231–1245. [Google Scholar] [CrossRef]
  20. USEPA. National Lakes Assessment: A Collaborative Survey of Lakes in the United States; EPA 841-R-16-009; United States Environmental Protection Agency: Washington DC, USA, 2009. [Google Scholar]
  21. Piccolroaz, S.; Healey, N.C.; Lenters, J.D.; Schladow, S.G.; Hook, S.J.; Sahoo, G.B.; Toffolon, M. On the predictability of lake surface temperature using air temperature in a changing climate: A case study for Lake Tahoe (USA). Limnol. Oceanogr. 2018, 63, 243–261. [Google Scholar] [CrossRef] [Green Version]
  22. USEPA. National Lakes Assessment 2012: A Collaborative Survey of Lakes in the United States; EPA 841-R-16-113; United States Environmental Protection Agency: Washington DC, USA, 2016. [Google Scholar]
  23. Daly, C.M.; Halbleib, J.I.; Smith, W.P.; Gibson, M.K.; Doggett, G.H.; Taylor, J.; Curtis, P.A. Pasteris. Physiographically-sensitive mapping of temperature and precipitation across the conterminous United States. Int. J. Climatol. 2008, 28, 2031–2064. [Google Scholar] [CrossRef]
  24. SAS Institute. JMP Statistics and Graphics Guide, Release 14.0; SAS Institute: Cary, NC, USA, 2019. [Google Scholar]
  25. Dewald, T.G. Applications of the NHD at the US Environmental Protection Agency. Water Resour. Impact 2006, 8, 5–7. [Google Scholar]
  26. Cleveland, W.S. Robust locally weighted regression and smoothing scatterplots. J. Am. Stat. Assoc. 1979, 74, 829–836. [Google Scholar] [CrossRef]
  27. Haynes, W.M. CRC Handbook of Chemistry and Physics; CRC Press: Boca Raton, FL, USA, 2014. [Google Scholar]
  28. Lewis, W.M., Jr. The thermal regime of Lake Lanao (Philippines) and its theoretical implications for tropical lakes 1. Limnol. Oceanogr. 1973, 18, 200–217. [Google Scholar] [CrossRef] [Green Version]
  29. Adrian, R.; O’Reilly, C.M.; Zagarese, H.; Baines, S.B.; Hessen, D.O.; Keller, W.; Livingstone, D.M.; Sommaruga, R.; Straile, D.; Van Donk, E.; et al. Lakes as sentinels of climate change. Limnol. Oceanogr. 2009, 54, 2283–2297. [Google Scholar] [CrossRef]
  30. Winslow, L.A.; Read, J.S.; Hansen, G.J.; Rose, K.C.; Robertson, D.M. Seasonality of change: Summer warming rates do not fully represent effects of climate change on lake temperatures. Limnol. Oceanogr. 2017, 62, 2168–2178. [Google Scholar] [CrossRef]
  31. Lathrop, R.C.; Kasprzak, P.; Tarvainen, M.; Ventelä, A.M.; Keskinen, T.; Koschel, R.; Robertson, D.M. Seasonal epilimnetic temperature patterns and trends in a suite of lakes from Wisconsin (USA), Germany, and Finland. Inland Waters 2019, 9, 471–488. [Google Scholar] [CrossRef]
  32. Woolway, R.I.; Merchant, C.J. Worldwide alteration of lake mixing regimes in response to climate change. Nat. Geosci. 2019, 12, 271–276. [Google Scholar] [CrossRef]
  33. Donat, M.G.; King, A.D.; Overpeck, J.T.; Alexander, L.V.; Durre, I.; Karoly, D.J. Extraordinary heat during the 1930s US dust bowl and associated large-scale conditions. Clim. Dyn. 2016, 46, 413–426. [Google Scholar] [CrossRef]
  34. Alofs, K.M.; Jackson, D.A.; Lester, N.P. Ontario freshwater fishes demonstrate differing range-boundary shifts in a warming climate. Divers. Distrib. 2014, 20, 123–136. [Google Scholar] [CrossRef]
  35. Van Zuiden, T.M.; Sharma, S. Examining the influence of smallmouth bass invasion on walleye populations in Ontario lakes: Can walleye beat the heat? Divers. Distrib. 2016, 22, 1069–1079. [Google Scholar] [CrossRef]
  36. Sharma, S.; Vander Zanden, M.J.; Magnuson, J.J.; Lyons, J. Comparing climate change and species invasions as drivers of coldwater fish population extirpations. PLoS ONE 2011, 6, e22906. [Google Scholar] [CrossRef] [Green Version]
  37. Hansen, G.J.; Read, J.S.; Hansen, J.F.; Winslow, L.A. Projected shifts in fish species dominance in Wisconsin lakes under climate change. Glob. Chang. Biol. 2017, 23, 1463–1476. [Google Scholar] [CrossRef]
  38. Livingstone, D.M.; Lotter, A.F. The relationship between air and water temperatures in lakes of the Swiss Plateau: A case study with paleolimnological implications. J. Paleolimnol. 1998, 19, 191–198. [Google Scholar] [CrossRef]
  39. Livingstone, D.M.; Dokulil, M.T. Eighty years of spatially coherent Austrian lake surface temperatures and their relationship to regional air temperature and the North Atlantic Oscillation. Limnol. Oceanogr. 2001, 46, 1220–1227. [Google Scholar] [CrossRef]
  40. Toffolon, M.; Piccolroaz, S.; Majone, B.; Soja, A.M.; Peeters, F.; Schmid, M.; Wüest, A. Prediction of surface temperature in lakes with different morphology using air temperature. Limnol. Oceanogr. 2014, 59, 2185–2202. [Google Scholar] [CrossRef] [Green Version]
  41. Robertson, D.M.; Ragotzkie, R.A. Changes in the thermal structure of moderate to large sized lakes in response to changes in air temperature. Aquat. Sci. 1990, 52, 360–380. [Google Scholar] [CrossRef]
  42. McCombie, A.M. Some relations between air temperatures and the surface water temperatures of lakes. Limnol. Oceanogr. 1959, 4, 252–258. [Google Scholar] [CrossRef]
Figure 1. Flow chart for most analyses made in this study. Boxes enclosed with solid lines represent data sources or results of analyses. Boxes enclosed with dashed lines indicate calculations and analyses made with the data. NLA = National Lakes Assessment, NOAA = National Oceanic and Atmospheric Administration.
Water 12 03381 g001
Figure 2. (a) Average annual difference between predicted [16] and measured water temperatures versus years. (b) Measured daily water temperatures versus calculated water temperatures for United States lakes found in the National Water Quality data set for the years 1981 through 2018. Calculated temperatures were found with Equations (1)–(4).
Water 12 03381 g002
Figure 3. Calculated average water temperatures for United States lakes in June (a), July (b), August (c), September (d) and for the entire summer (e) for each year in the period 1981–2018. Fitted linear regression lines are shown. The slopes are all statistically significantly different from zero (p = 0.05).
Water 12 03381 g003
Figure 4. Rates of temperature change in 1033 United States lakes during the time period 1981–2018.
Water 12 03381 g004
Figure 5. Rates of temperature change in average air temperatures at the locations of 1033 United States lakes during the time period 1981–2018.
Water 12 03381 g005
Figure 6. The calculated average annual summer water temperatures for the lakes of the conterminous United States for the years 1981–2018 plotted against the average of the national summer air temperatures during the same years.
Water 12 03381 g006
Figure 7. National average summer air temperatures for the conterminous United States for the period 1895 through 2018 with a non-parametric (Locally Weighted Scatterplot Smoothing (LOWESS)) line. The upper red line represents the average summer water temperatures.
Water 12 03381 g007
Figure 8. (a) Average summer water temperatures of United States lakes located between latitudes of 26° N and 49° N and at elevation less than 500 m. (b) Average summer water temperatures of United States lakes located between latitudes 37° N and 42° N and at elevations greater than 500 m.
Water 12 03381 g008
Table 1. Slopes (°C decade−1) with standard errors of average near-surface water temperatures in lakes of the conterminous United States versus years for different time periods in the summers of 1981–2018. The summer temperatures represent the average summer temperatures for the months of June through September each year. Slopes for other combinations of 2 or 3 months are also presented.
Time PeriodRate of Change in Temperature (°C Decade−1)Standard Error of the Mean (°C)
June0.310.08
July0.310.06
August0.220.08
September0.490.07
Summer (June–September)0.320.05
June–August0.290.06
July–September0.340.05
July–August0.260.06
August–September0.360.05
Table 2. Summary statistics for the distributions of rates of temperature change (°C decade−1) in the period 1981–2018 for 1033 lakes in the conterminous United States.
JuneJulyAugustSeptemberSummer
Descriptive Statistics
Mean0.340.340.240.460.34
Standard deviation0.140.140.110.070.08
Standard error0.0040.0040.0030.0100.003
Coefficient of variation4141462222
N10331033103310331033
Frequency Distributions
Minimum−0.070.01−0.030.040.02
10th%0.170.190.090.320.26
20th%0.230.230.140.370.28
30th%0.270.250.180.410.30
40th%0.300.280.220.440.32
Median0.350.300.250.470.34
60th%0.380.340.280.490.36
70th%0.420.390.310.510.38
80th%0.450.450.340.540.41
90th%0.510.560.380.580.44
Maximum0.780.870.780.810.75
Publisher’s Note: MDPI stays neutral with regard to jurisdictional claims in published maps and institutional affiliations.

