Study on the Classification of Urban Waterlogging Rainstorms and Rainfall Thresholds in Cities Lacking Actual Data
Abstract
1. Introduction
2. Materials and Methods
2.1. Study Area
2.2. Data Description
2.3. Methods Description
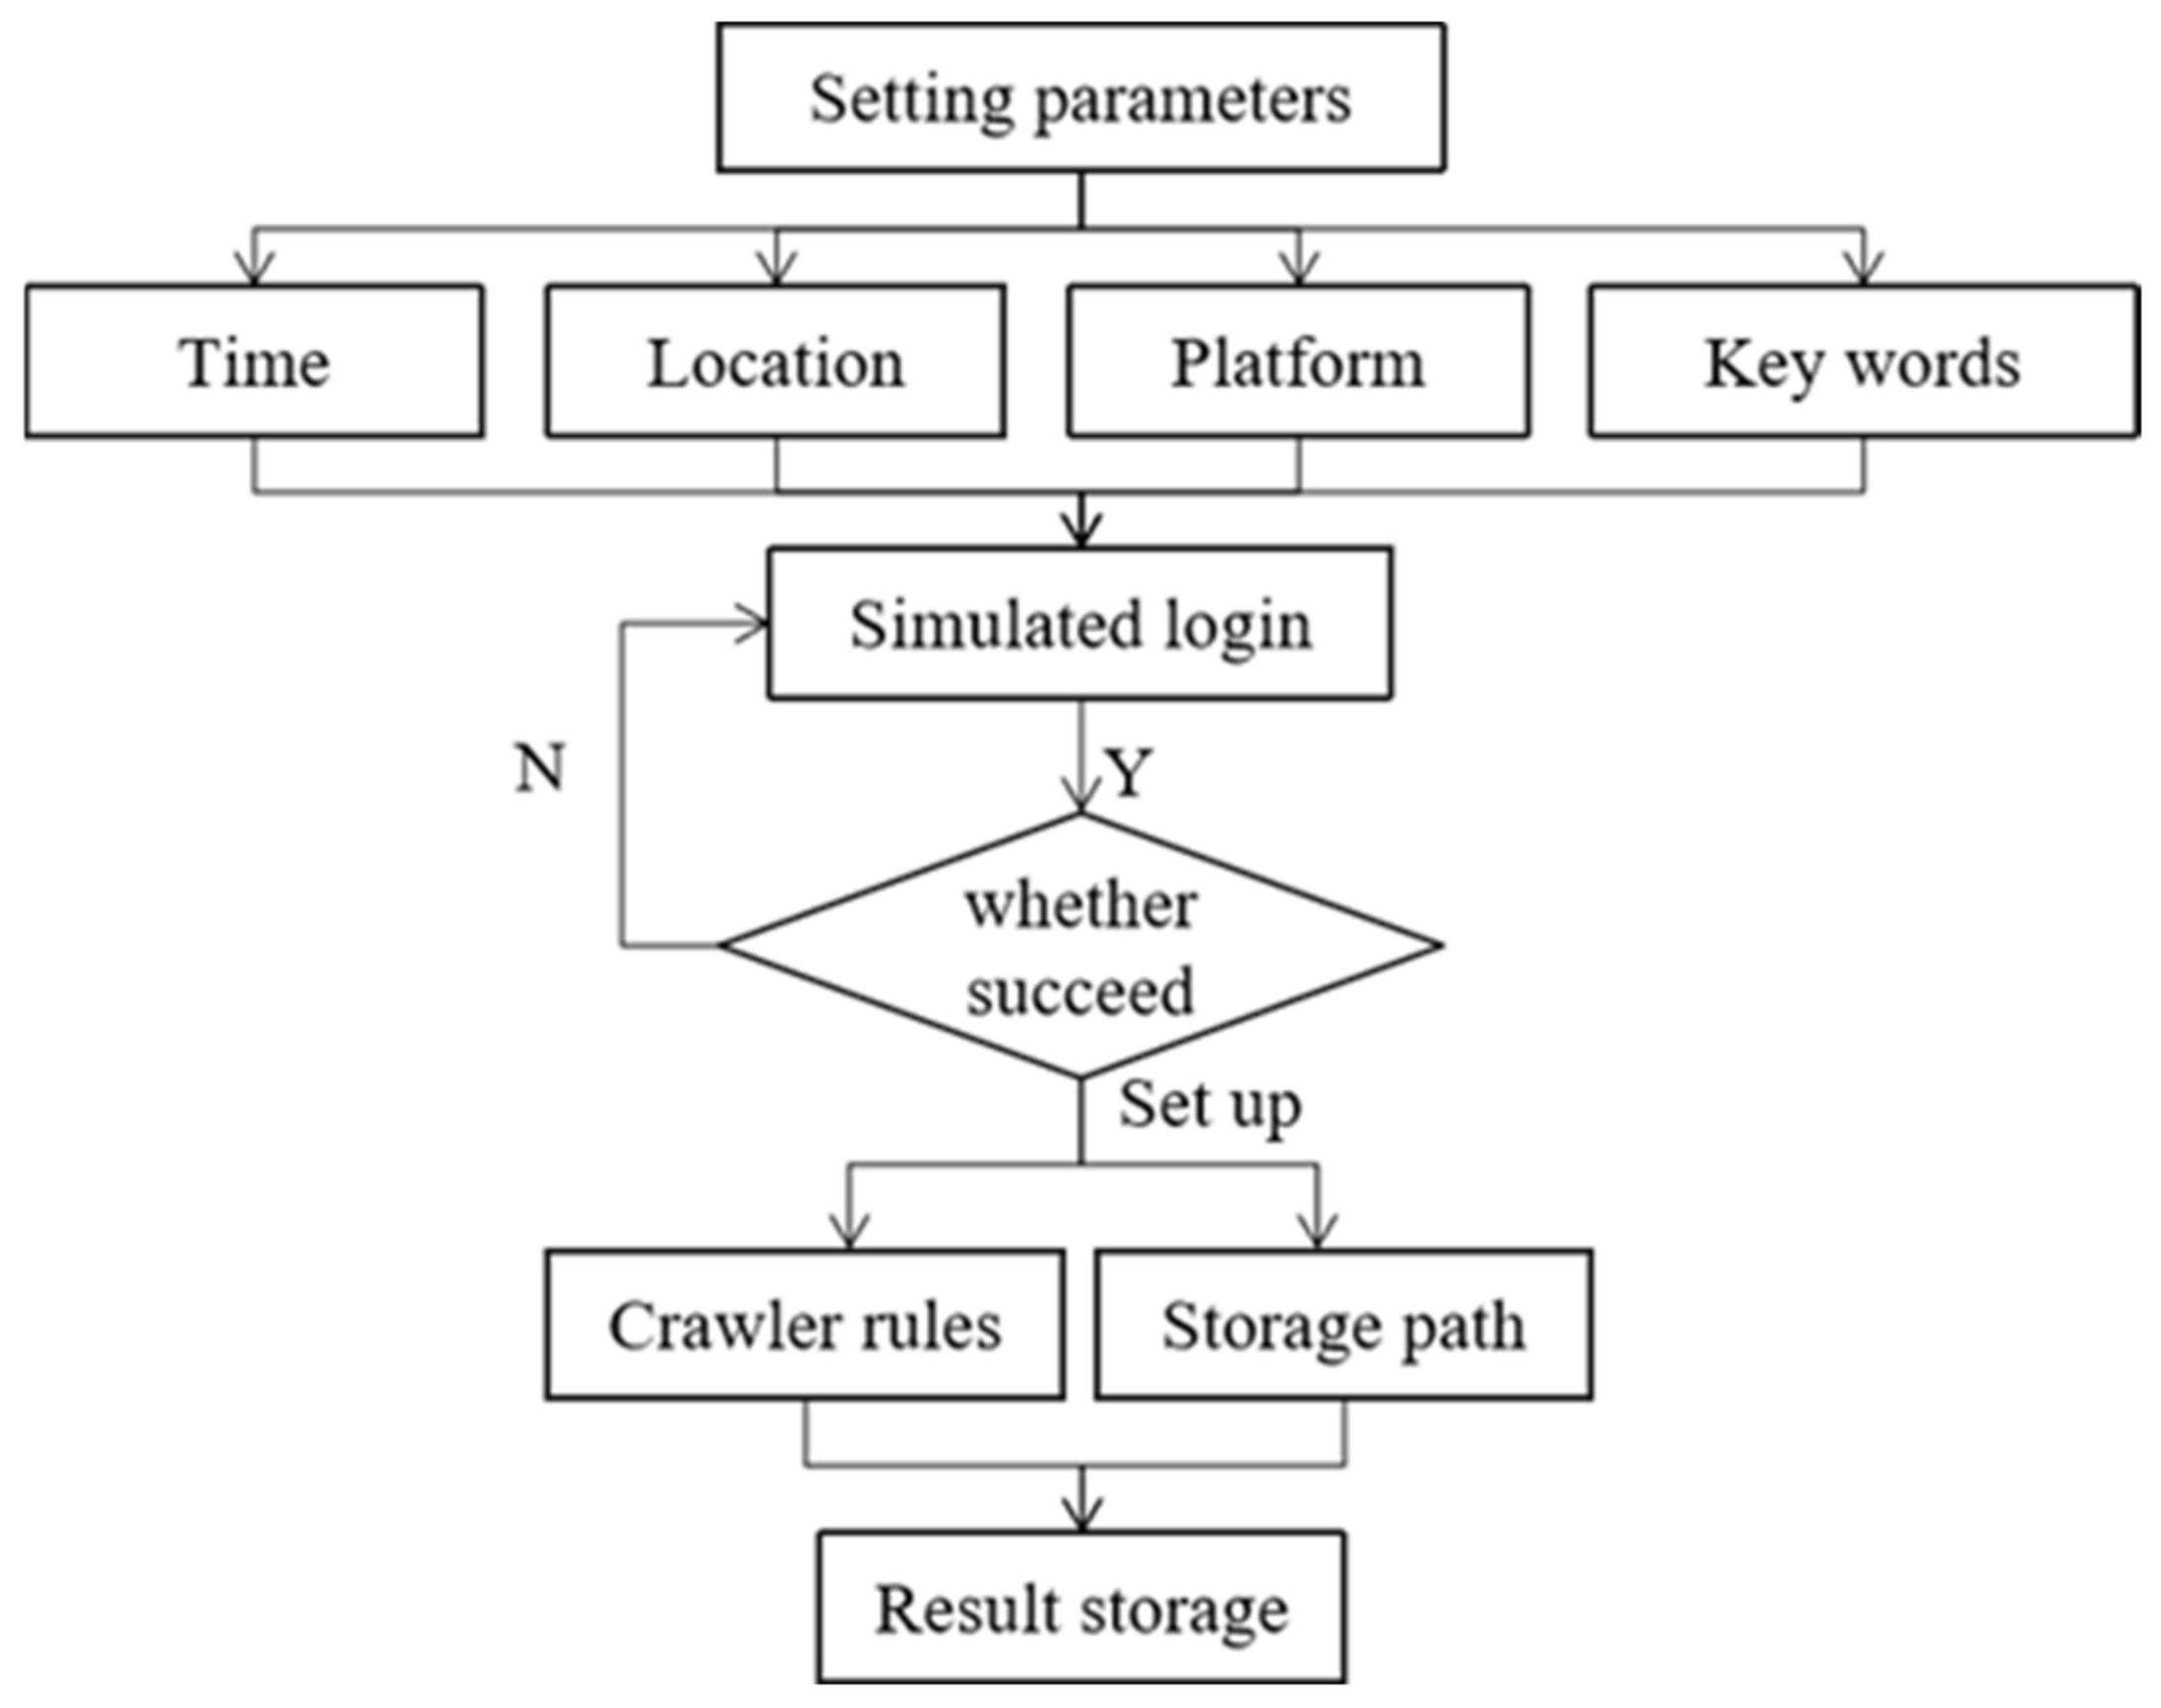
2.3.1. Crowdsourced Data Acquisition of Urban Waterlogging Based on Web Crawlers
2.3.2. Waterlogging Rainstorms Thresholds Based on Intensity–Duration (ID) Curves
- (1)
- M20 ≥ 21.36 mm and M60 ≥ 35.35 mm. It shows that both of the intensity and amount of rainfall have reached the flood-causing conditions, which is CW.
- (2)
- M20 ≥ 21.36 mm, M60 < 35.35 mm. It means rainfall is concentrated and rapidly attenuating, resulting IW.
- (3)
- M20 < 21.36 mm, M60 ≥ 35.35 mm. It shows that the rainfall is uniform and lasts for a long time, the corresponding waterlogging is AW.
- (4)
- M20 < 21.36 mm and M60 < 35.35 mm. Which means the amount and intensity are both small and not enough to cause waterlogging disasters, corresponding to NW.
2.3.3. Analysis of Urban Waterlogging Process Based on SWMM
3. Results
3.1. Analysis of Web Crawler Results
3.2. Urban Waterlogging Rainstorm Thresholds
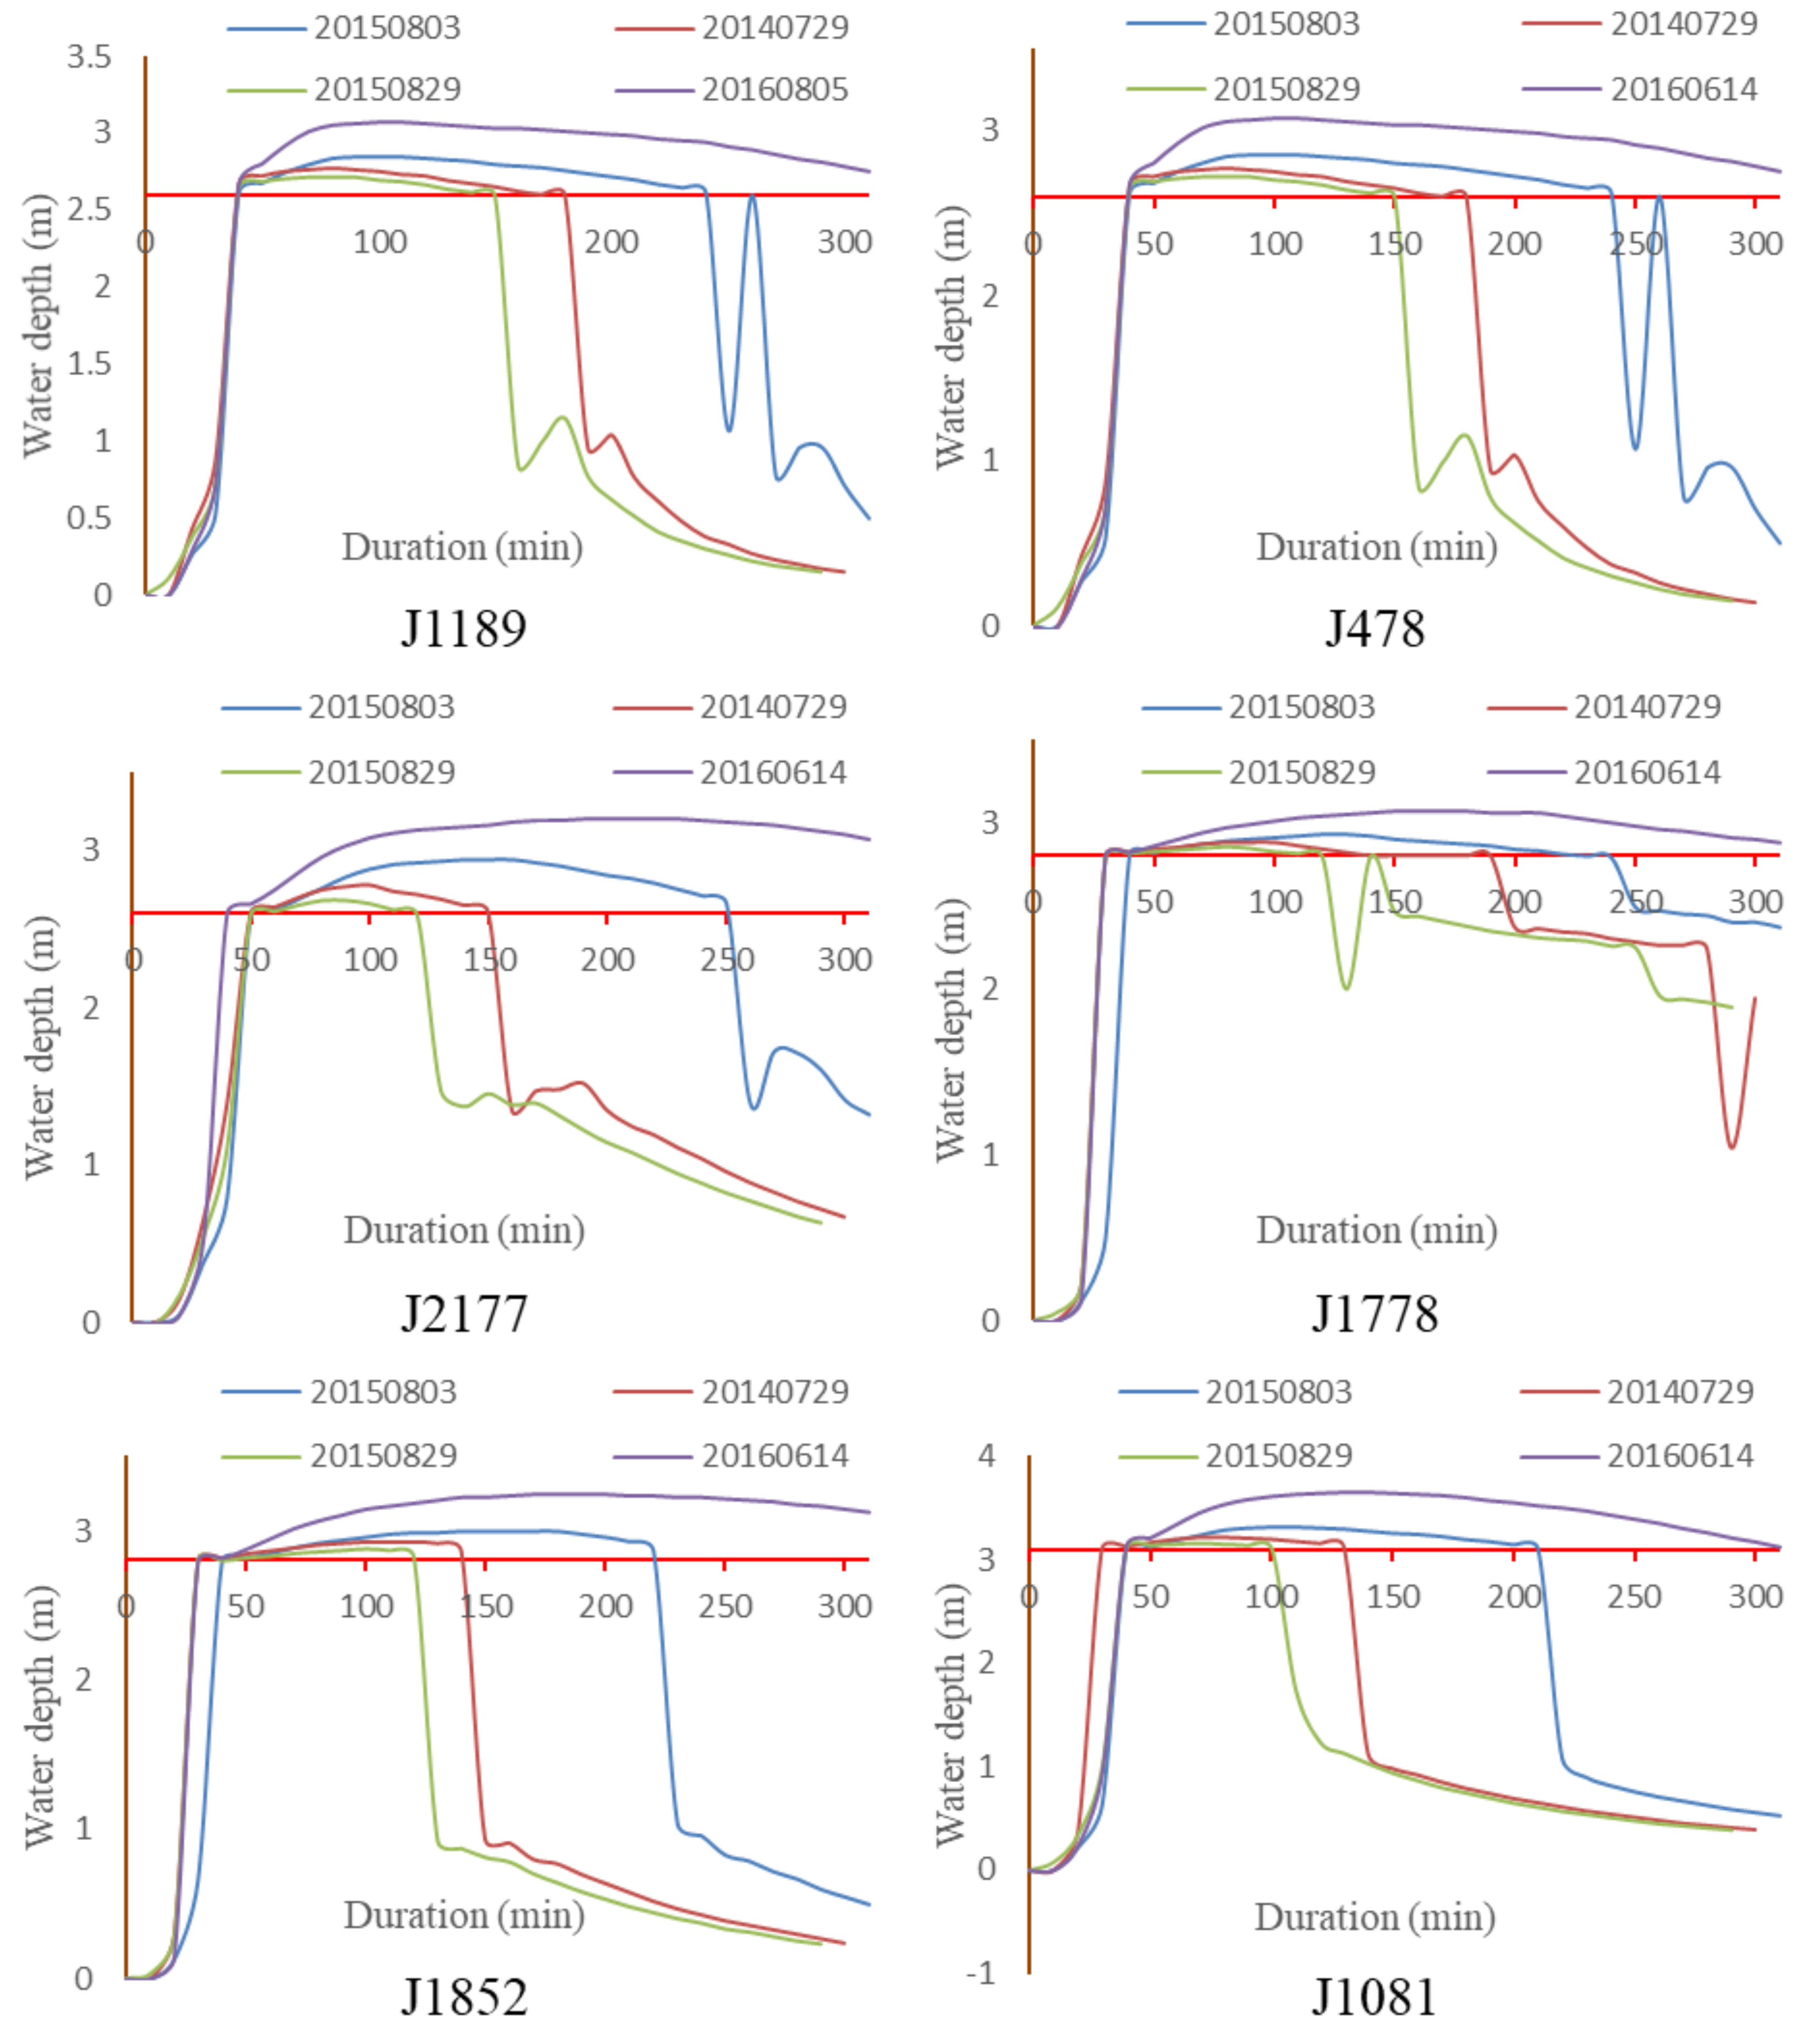
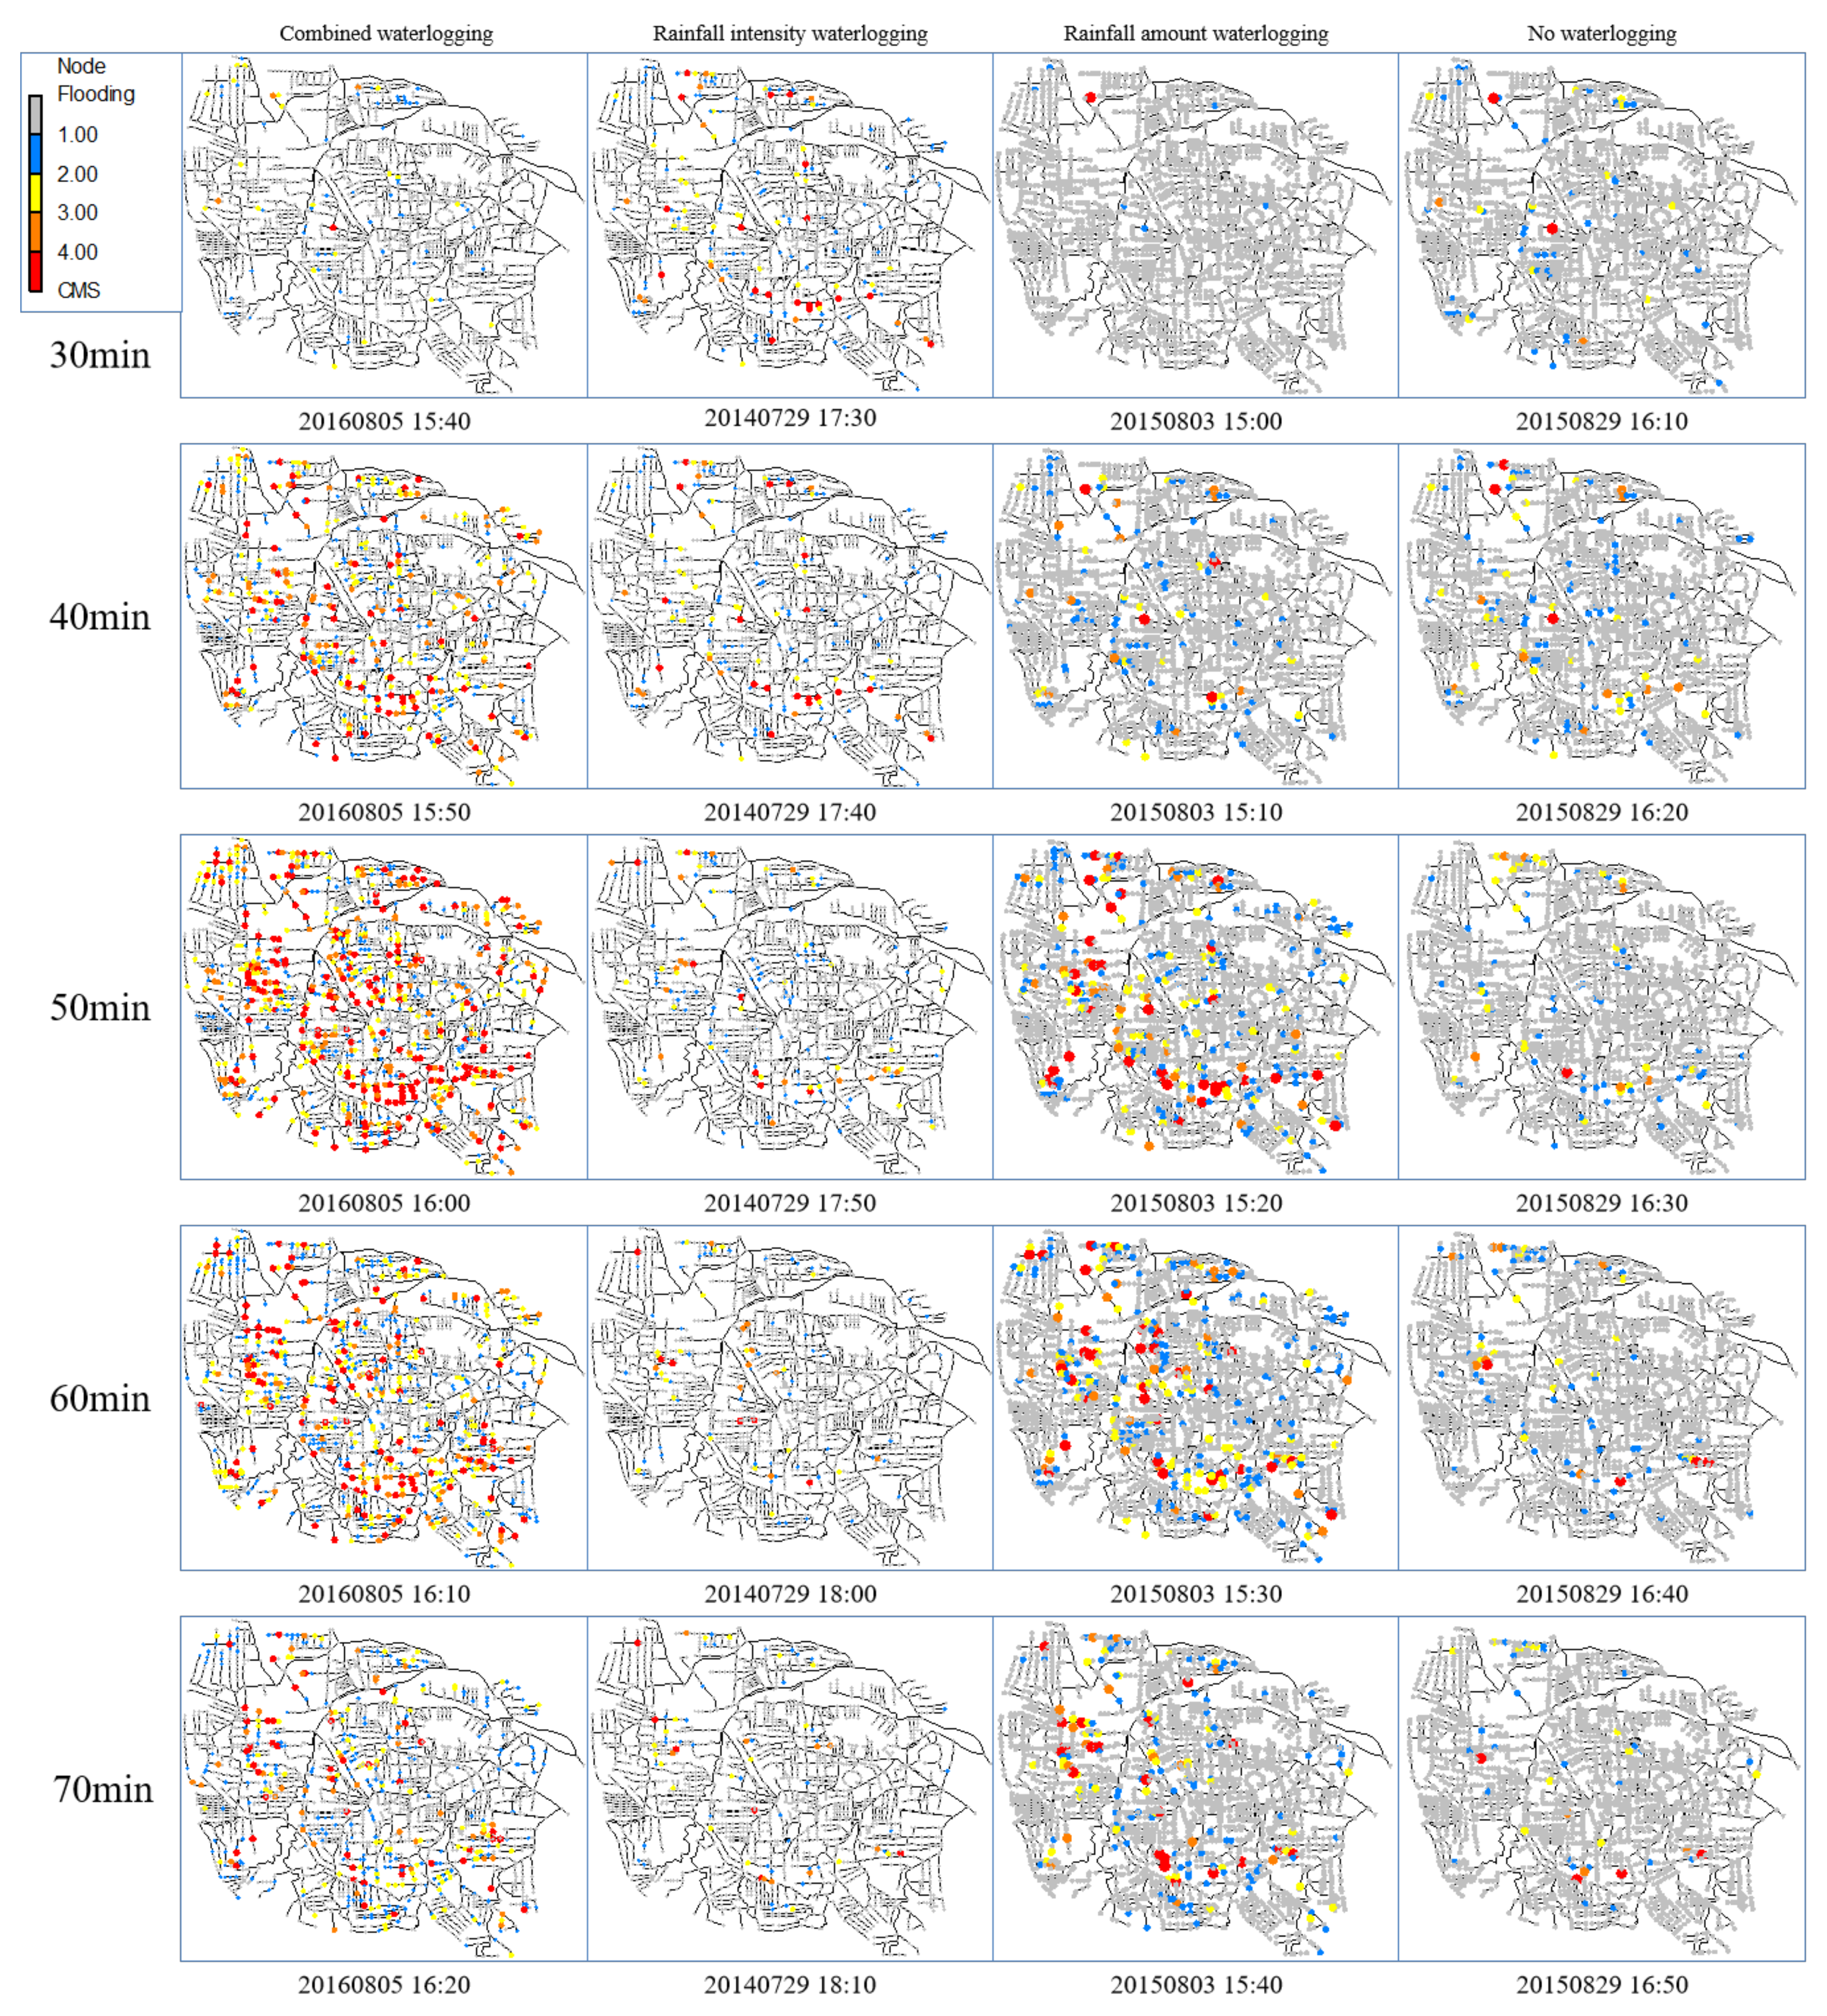
3.3. Analysis of Waterlogging Characteristics Based on SWMM
4. Discussion
5. Conclusions
Author Contributions
Funding
Conflicts of Interest
References
- Miller, J.D.; Kim, H.; Kjeldsen, T.R.; Packman, J.; Grebby, S.; Dearden, R. Assessing the impact of urbanization on storm runoff in a pen-urban catchment using historical change in impervious cover. J. Hydrol. 2014, 515, 59–70. [Google Scholar] [CrossRef]
- Apel, H.; Trepat, O.M.; Hung, N.N.; Chinh, D.T.; Merz, B.; Dung, N.V. Combined fluvial and pluvial urban flood hazard analysis: Concept development and application to Can Tho city, Mekong Delta, Vietnam. Nat. Hazards Earth Syst. Sci. 2016, 16, 941–961. [Google Scholar] [CrossRef]
- Dan, M.; Huili, G.; Xiaojuan, L.I.; Siyao, Y. Spatiotemporal distribution of the rainstorm and the relationship between urban heat island and urban rain island in Beijing on July 21,2012. Remote. Sens. Land Resour. 2017, 29, 178–185. [Google Scholar] [CrossRef]
- Alexander, K.; Hettiarachchi, S.; Ou, Y.X.; Sharma, A. Can integrated green spaces and storage facilities absorb the increased risk of flooding due to climate change in developed urban environments? J. Hydrol. 2019, 579, 9. [Google Scholar] [CrossRef]
- Su, M.; Zheng, Y.; Hao, Y.; Chen, Q.; Chen, S.; Chen, Z.; Xie, H. The influence of landscape pattern on the risk of urban water-logging and flood disaster. Ecol. Indic. 2018, 92, 133–140. [Google Scholar] [CrossRef]
- Liu, J.; Shao, W.W.; Xiang, C.; Mei, C.; Li, Z. Uncertainties of urban flood modeling: Influence of parameters for different underlying surfaces. Environ. Res. 2020, 182, 108929. [Google Scholar] [CrossRef]
- Merz, B.; Thieken, A.H. Separating natural and epistemic uncertainty in flood frequency analysis. J. Hydrol. 2005, 309, 114–132. [Google Scholar] [CrossRef]
- Zhang, Q.W.; Yan, F.; Shen, J.; Ye, S.; Ren, B.; Zhang, X.K. A novel seed spread algorithm-based approach for the simulation of rainstorm water logging in urban area. Desalin. Water Treat. 2018, 121, 265–274. [Google Scholar] [CrossRef]
- Freitag, B.M.; Nair, U.S.; Niyogi, D. Urban Modification of Convection and Rainfall in Complex Terrain. Geophys. Res. Lett. 2018, 45, 2507–2515. [Google Scholar] [CrossRef]
- Zhang, X.; Hu, M.; Chen, G.; Xu, Y. Urban Rainwater Utilization and its Role in Mitigating Urban Waterlogging Problems-A Case Study in Nanjing, China. Water Resour. Manag. 2012, 26, 3757–3766. [Google Scholar] [CrossRef]
- Saksena, S.; Dey, S.; Merwade, V.; Singhofen, P.J. A Computationally Efficient and Physically Based Approach for Urban Flood Modeling Using a Flexible Spatiotemporal Structure. Water Resour. Res. 2020, 56, e2019WR025769. [Google Scholar] [CrossRef]
- Morrison, J.E.; Smith, J.A. Scaling Properties of Flood Peaks. Extremes 2001, 4, 5–22. [Google Scholar] [CrossRef]
- Hurford, A.P.; Parker, D.J.; Priest, S.J.; Lumbroso, D.M. Validating the return period of rainfall thresholds used for Extreme Rainfall Alerts by linking rainfall intensities with observed surface water flood events. J. Flood Risk Manag. 2012, 5, 134–142. [Google Scholar] [CrossRef]
- Seenu, P.Z.; Rathnam, E.V.; Jayakumar, K.V. Visualisation of urban flood inundation using SWMM and 4D GIS. Spat. Inf. Res. 2020, 28, 459–467. [Google Scholar] [CrossRef]
- Egger, C.; Maurer, M. Importance of anthropogenic climate impact, sampling error and urban development in sewer system design. Water Res. 2015, 73, 78–97. [Google Scholar] [CrossRef]
- Panziera, L.; Gabella, M.; Zanini, S.; Hering, A.; Germann, U.; Berne, A. A radar-based regional extreme rainfall analysis to derive the thresholds for a novel automatic alert system in Switzerland. Hydrol. Earth Syst. Sci. 2016, 20, 2317–2332. [Google Scholar] [CrossRef]
- Zhou, Z.; Smith, J.A.; Yang, L.; Baeck, M.L.; Chaney, M.; Ten Veldhuis, M.C.; Deng, H.; Liu, S. The complexities of urban flood response: Flood frequency analyses for the Charlotte metropolitan region. Water Resour. Res. 2017, 53, 7401–7425. [Google Scholar] [CrossRef]
- Hou, J.; Du, Y. Spatial simulation of rainstorm waterlogging based on a water accumulation diffusion algorithm. Geomat. Nat. Hazards Risk 2020, 11, 71–87. [Google Scholar] [CrossRef]
- Cheng, M.; Qin, H.; Fu, G.; He, K. Performance evaluation of time-sharing utilization of multi-function sponge space to reduce waterlogging in a highly urbanizing area. J. Environ. Manag. 2020, 269. [Google Scholar] [CrossRef]
- Chen, Z.; Yin, L.; Chen, X.; Wei, S.; Zhu, Z. Research on the characteristics of urban rainstorm pattern in the humid area of Southern China: A case study of Guangzhou City. Int. J. Climatol. 2015, 35, 4370–4386. [Google Scholar] [CrossRef]
- Toth, E. Estimation of flood warning runoff thresholds in ungauged basins with asymmetric error functions. Hydrol. Earth Syst. Sci. 2016, 20, 2383–2394. [Google Scholar] [CrossRef]
- Knighton, J.; Steinschneider, S.; Walter, M.T. A Vulnerability-Based, Bottom-up Assessment of Future Riverine Flood Risk Using a Modified Peaks-Over-Threshold Approach and a Physically Based Hydrologic Model. Water Resour. Res. 2017, 53, 10043–10064. [Google Scholar] [CrossRef]
- Vorobevskii, I.; Al Janabi, F.; Schneebeck, F.; Bellera, J.; Krebs, P. Urban Floods: Linking the Overloading of a Storm Water Sewer System to Precipitation Parameters. Hydrology 2020, 7, 35. [Google Scholar] [CrossRef]
- Arosio, M.; Martina, M.L.V.; Creaco, E.; Figueiredo, R. Indirect Impact Assessment of Pluvial Flooding in Urban Areas Using a Graph-Based Approach: The Mexico City Case Study. Water 2020, 12, 1753. [Google Scholar] [CrossRef]
- Yang, T.-H.; Yang, S.-C.; Ho, J.-Y.; Lin, G.-F.; Hwang, G.-D.; Lee, C.-S. Flash flood warnings using the ensemble precipitation forecasting technique: A case study on forecasting floods in Taiwan caused by typhoons. J. Hydrol. 2015, 520, 367–378. [Google Scholar] [CrossRef]
- Bouwens, C.; Veldhuis, M.C.T.; Schleiss, M.; Tian, X.; Schepers, J. Towards identification of critical rainfall thresholds for urban pluvial flooding prediction based on crowdsourced flood observations. Hydrol. Earth Syst. Sci. Discuss. 2018, 1–24. [Google Scholar] [CrossRef]
- Silva Cervantes, M.; Hernando, A.; Garcia-Abril, A.; Valbuena, R.; Velazquez Saornil, J.; Manzanera, J.A. Simulation of overflow thresholds in urban basins: Case study in Tuxtla Gutierrez, Mexico. River Res. Appl. 2020, 36, 1307–1320. [Google Scholar] [CrossRef]
- Campion, B.B.; Venzke, J.-F. Rainfall variability, floods and adaptations of the urban poor to flooding in Kumasi, Ghana. Nat. Hazards 2013, 65, 1895–1911. [Google Scholar] [CrossRef]
- Mei, C.; Liu, J.; Wang, H.; Li, Z.; Yang, Z.; Shao, W.; Ding, X.; Weng, B.; Yu, Y.; Yan, D. Urban flood inundation and damage assessment based on numerical simulations of design rainstorms with different characteristics. Sci. China-Technol. Sci. 2020, 63, 2292–2304. [Google Scholar] [CrossRef]
- Cipolla, G.; Francipane, A.; Noto, L.V. Classification of Extreme Rainfall for a Mediterranean Region by Means of Atmospheric Circulation Patterns and Reanalysis Data. Water Resour. Manag. 2020, 34, 3219–3235. [Google Scholar] [CrossRef]
- Rodriguez, R.; Navarro, X.; Casas, M.C.; Ribalaygua, J.; Russo, B.; Pouget, L.; Redano, A. Influence of climate change on IDF curves for the metropolitan area of Barcelona (Spain). Int. J. Climatol. 2014, 34, 643–654. [Google Scholar] [CrossRef]
- Ashish, S.; Babel, M.S.; Weesakul, S.; Vojinovic, Z. Developing Intensity–Duration–Frequency (IDF) Curves under Climate Change Uncertainty: The Case of Bangkok, Thailand. Water 2017, 9, 145. [Google Scholar]
- Sun, Y.; Wendi, D.; Kim, D.E.; Liong, S.-Y. Deriving intensity-duration-frequency (IDF) curves using downscaled in situ rainfall assimilated with remote sensing data. Geosci. Lett. 2019, 6, 17. [Google Scholar] [CrossRef]
- Lutz, J.; Grinde, L.; Dyrrdal, A.V. Estimating Rainfall Design Values for the City of Oslo, Norway-Comparison of Methods and Quantification of Uncertainty. Water 2020, 12, 1735. [Google Scholar] [CrossRef]
- Bezak, N.; Šraj, M.; Mikoš, M. Copula-based IDF curves and empirical rainfall thresholds for flash floods and rainfall-induced landslides. J. Hydrol. 2016, 541, 272–284. [Google Scholar] [CrossRef]
- Zhou, W.; Tang, C. Rainfall thresholds for debris flow initiation in the Wenchuan earthquake-stricken area, southwestern China. Landslides 2014, 11, 877–887. [Google Scholar] [CrossRef]
- Tian, X.; ten Veldhuis, M.-C.; Schleiss, M.; Bouwens, C.; van de Giesen, N. Critical rainfall thresholds for urban pluvial flooding inferred from citizen observations. Sci. Total Environ. 2019, 689, 258–268. [Google Scholar] [CrossRef]
- Thelwall, M.; Vann, K.; Fairclough, R. Web issue analysis: An Integrated Water Resource Management case study. J. Am. Soc. Inf. Sci. Technol. 2006, 57, 1303–1314. [Google Scholar] [CrossRef]
- Brin, S.; Page, L. The anatomy of a large-scale hypertextual web search engine. Comput. Netw. 2012, 56, 3825–3833, reprinted in Comput. Netw. ISDN Syst. 1998, 30, 107–117.. [Google Scholar] [CrossRef]
- Huong, H.T.L.; Pathirana, A. Hydrology and Earth System Sciences Urbanization and climate change impacts on future urban flooding in Can Tho city, Vietnam. Hydrol. Earth Syst. Sci. 2013, 17, 379–394. [Google Scholar] [CrossRef]
- Palla, A.; Gnecco, I. Hydrologic modeling of Low Impact Development systems at the urban catchment scale. J. Hydrol. 2015, 528, 361–368. [Google Scholar] [CrossRef]
- Behrouz, M.S.; Zhu, Z.; Matott, L.S.; Rabideau, A.J. A new tool for automatic calibration of the Storm Water Management Model (SWMM). J. Hydrol. 2020, 581, 124436. [Google Scholar] [CrossRef]
- Dai, Y.; Chen, L.; Shen, Z. A cellular automata (CA)-based method to improve the SWMM performance with scarce drainage data and its spatial scale effect. J. Hydrol. 2020, 581, 124402. [Google Scholar] [CrossRef]
- Jamali, B.; Bach, P.M.; Deletic, A. Rainwater harvesting for urban flood management-An integrated modelling framework. Water Res. 2020, 171, 115372. [Google Scholar] [CrossRef]
- Gironas, J.; Roesner, L.A.; Rossman, L.A.; Davis, J. A new applications manual for the Storm Water Management Model (SWMM). Environ. Modell. Softw. 2010, 25, 813–814. [Google Scholar] [CrossRef]
- Chen, C.-F.; Liu, C.-M. The definition of urban stormwater tolerance threshold and its conceptual estimation: An example from Taiwan. Nat. Hazards 2014, 73, 173–190. [Google Scholar] [CrossRef]


| Station Number | Latitude and Longitude | Time Interval (min) | Station Number | Latitude and Longitude (°) | Time Interval (min) |
|---|---|---|---|---|---|
| 00 | 113.670, 34.766 | 10 | 07 | 113.623, 34.872 | 10 |
| 01 | 113.631, 34.830 | 10 | 08 | 113.673, 34.782 | 10 |
| 02 | 113.702, 34.761 | 10 | 09 | 113.662, 34.744 | 10 |
| 03 | 113.767, 34.764 | 10 | 10 | 113.773, 34.721 | 10 |
| 04 | 113.708, 34.688 | 10 | 11 | 113.670, 34.766 | 10 |
| 05 | 113.574, 34.817 | 10 | 12 | 113.631, 34.830 | 10 |
| 06 | 113.315, 34.809 | 10 | 13 | 113.631, 34.830 | 10 |
| Rainfall Events | Cumulative Rainfall (mm) | Duration (min) | Maximum Rainfall Intensity (mm/min) | Return Periods (a) | |||
|---|---|---|---|---|---|---|---|
| 0.5 | 1 | 2 | 5 | ||||
| 20140729 | 58.0 | 70 | 2.20 | CW | CW | CW | CW |
| 20160805 | 53.5 | 80 | 1.75 | CW | CW | CW | IW |
| 20170812 | 63.5 | 110 | 1.70 | CW | CW | CW | AW |
| 20130807 | 78.5 | 110 | 1.60 | CW | CW | CW | AW |
| 20120827 | 50.0 | 130 | 1.50 | CW | CW | CW | NW |
| 20130811 | 52.0 | 90 | 1.15 | CW | CW | AW | NW |
| 20150722 | 35.0 | 90 | 1.05 | CW | NW | NW | NW |
| 20160719 | 24.5 | 130 | 1.10 | NW | NW | NW | NW |
| 20160605 | 37.5 | 140 | 0.95 | CW | NW | NW | NW |
| 20180727 | 38.0 | 150 | 0.75 | AW | NW | NW | NW |
| 20170729 | 43.0 | 180 | 0.60 | AW | NW | NW | NW |
| 20150501 | 19.5 | 180 | 0.15 | NW | NW | NW | NW |
| News Volume | Degree of Waterlogging | Rain Events | Average News Volume | Average Rainfall (mm) | Average Duration (h) | Average Rainfall Intensity (mm/h) |
|---|---|---|---|---|---|---|
| 0–3 | No waterlogging | 18 | 2.11 | 10.94 | 1.55 | 7.08 |
| 4–10 | Less waterlogging | 18 | 6.61 | 13.50 | 2.61 | 5.17 |
| 11–39 | Waterlogging | 17 | 23.95 | 28.05 | 2.46 | 11.41 |
| >40 | Flood disaster | 17 | 96.78 | 38.61 | 2.54 | 15.22 |
| Return Periods (a) | Types of Waterlogging Rainstorms | Number | Return Periods (a) | Types of Waterlogging Rainstorms | Number |
|---|---|---|---|---|---|
| 0.5 | CW | 26 | 2 | CW | 10 |
| IW | 0 | IW | 8 | ||
| AW | 0 | AW | 7 | ||
| NW | 0 | NW | 1 | ||
| 1 | CW | 20 | 5 | CW | 5 |
| IW | 3 | IW | 2 | ||
| AW | 3 | AW | 4 | ||
| NW | 0 | NW | 15 |
| Return Periods (a) | Rainstorms | |||
|---|---|---|---|---|
| 20160805 | 20140729 | 20150803 | 20150829 | |
| 0.5 | CW | CW | CW | CW |
| 1 | CW | CW | CW | CW |
| 2 | CW | IW | AW | NW |
| 5 | CW | IW | NW | NW |
| Types of Waterlogging Rainstorms | Maximum 20 min Rainfall (mm) | Maximum 60 min Rainfall (mm) |
|---|---|---|
| CW | ≥26.47 | ≥43.80 |
| IW | ≥26.47 | <43.80 |
| AW | <26.47 | ≥43.80 |
| NW | <26.47 | <43.80 |
Publisher’s Note: MDPI stays neutral with regard to jurisdictional claims in published maps and institutional affiliations. |
© 2020 by the authors. Licensee MDPI, Basel, Switzerland. This article is an open access article distributed under the terms and conditions of the Creative Commons Attribution (CC BY) license (http://creativecommons.org/licenses/by/4.0/).
Share and Cite
Ma, B.; Wu, Z.; Wang, H.; Guo, Y. Study on the Classification of Urban Waterlogging Rainstorms and Rainfall Thresholds in Cities Lacking Actual Data. Water 2020, 12, 3328. https://doi.org/10.3390/w12123328
Ma B, Wu Z, Wang H, Guo Y. Study on the Classification of Urban Waterlogging Rainstorms and Rainfall Thresholds in Cities Lacking Actual Data. Water. 2020; 12(12):3328. https://doi.org/10.3390/w12123328
Chicago/Turabian StyleMa, Bingyan, Zening Wu, Huiliang Wang, and Yuan Guo. 2020. "Study on the Classification of Urban Waterlogging Rainstorms and Rainfall Thresholds in Cities Lacking Actual Data" Water 12, no. 12: 3328. https://doi.org/10.3390/w12123328
APA StyleMa, B., Wu, Z., Wang, H., & Guo, Y. (2020). Study on the Classification of Urban Waterlogging Rainstorms and Rainfall Thresholds in Cities Lacking Actual Data. Water, 12(12), 3328. https://doi.org/10.3390/w12123328


