Article

Impact of Land Cover Change Due to Armed Conflicts on Soil Erosion in the Basin of the Northern Al-Kabeer River in Syria Using the RUSLE Model

Department of Geography, College of Arabic Language and Social Studies, Qassim University, Buraydah 51452, Saudi Arabia
Water 2020, 12(12), 3323; https://doi.org/10.3390/w12123323
Submission received: 17 October 2020 / Revised: 19 November 2020 / Accepted: 22 November 2020 / Published: 26 November 2020
(This article belongs to the Special Issue Soil Water Erosion)

Abstract

:
Due to armed conflicts, the sudden changes in land cover are among the most drastic and recurring shocks on an international scale, and thus, have become a major source of threat to soil and water conservation. Throughout this analysis, the impact of land cover change on spatio-temporal variations of soil erosion from 2009/2010 to 2018/2019 was investigated using the Revised Universal Soil Loss Equation (RUSLE) model. The goal was to identify the characteristics and variations of soil erosion under armed conflicts in the basin of the Northern Al-Kabeer river in Syria. The soil erosion rate is 4 t ha−1 year−1 with a standard deviation of 6.4 t ha−1 year−1. In addition, the spatial distribution of erosion classes was estimated. Only about 10.1% of the basin is subject to a tolerable soil erosion rate and 79.9% of the study area experienced erosion at different levels. The soil erosion area of regions with no changes was 10%. The results revealed an increase in soil erosion until 2013/2014 and a decrease during the period from 20013/2014 to 2018/2019. This increase is a result of forest fires under armed conflict, particularly toward the steeper slopes. Coniferous forest as well as transitional woodland and scrub are the dominant land cover types in the upper part of the basin, for which the average post-fire soil loss rates (caused by factor C) were 200% to 800% higher than in the pre-fire situation. In the period from 2013/2014 to 2019/2020, soil erosion was mitigated due to a ceasefire that was agreed upon after 2016, resulting in decreased human pressures on soils in contested areas. By comparing 2009/2010 (before war) with 2018/2019 (at the end of the war stage), it can be concluded that the change in C factors slowed down the deterioration trend of soil erosion and reduced the average soil erosion rate in more than half of the basin by about 10–75%. The area concerned is located in the western part of the basin and is relatively far from the centers of armed conflicts. In contrast, the areas with increased soil erosion by about 60–400% are situated in the northeast and east, with shorter distances to armed conflict centers. These findings can be explained by forest fires, after which the burned forests were turned into agricultural land or refugee camps and road areas. Understanding the complex biophysical and socio-economic interactions of exposure to land loss is a key to guarantee regional environmental protection and to conserve the ecological quality of soil and forest systems.

1. Introduction

Soil erosion and its consequent land degradation in the marginal lands of the Mediterranean is a serious problem, as it directly affects the environment and sustainable development [1,2,3,4,5]. The eastern Mediterranean area is especially vulnerable to erosion, since it is subject to long dry spells accompanied by heavy rainfall falling on steep slopes with weak soil [2,6]. Erosion levels are predicted to rise in the 21st century due to climate change [7]. While soil erosion results from the interplay between soil erodibility and rainfall erosivity factors, maladjusted human activities such as slope agriculture, deforestation, expansion of urban areas and highways as well as overgrazing exacerbate the issue [8,9]. Erosion has been growing due to land cover change and unsustainable land cover transition management activities. The increase of wildfires are one of the most important sources of land-use change in the Middle East [10,11]. This problem has been intensified by the emergence of numerous armed conflicts. Syrian ecosystems are often vulnerable to wildfires. Accelerated deforestation cycles due to wildfires in these ecosystems are a significant limiting factor in their sustainability. In the mountainous regions of Syria, where dense forests cover much of the area, forest fires are the worst human intrusion [12]. These fires have increased dramatically over the past 10 years along with changes in land use due to the Civil War. Many regions were subject to extensive fires in conflict areas, which led to the destruction of crops and forests [13,14]. In 2010, Syria had 116 kha of natural forest, covering over 0.62% of its land area. From 2010 to 2019, Syria lost 16.18 kha of forest, which is equivalent to a 14% decrease in tree cover since 2010 [15]. Although fires are a natural occurrence that can have beneficial effects on the revitalization of vegetation, the high frequency and intensity of these fires have caused the destruction of forest habitats. Warfare and armed conflicts are among the most dramatic shocks, and can have tremendous impacts on communities and, hence, on land systems. Although widely believed to have significant consequences on land-use transition and soil erosion, research into how military wars influence land-use decisions and soil erosion as well as its trends is rare. Studies have indicated that the impact of armed conflicts on forests and land use can be broadly summarized as reaching in two directions: firstly, this interaction entails a shift in resources or land usages caused by the intensified or inappropriate utilization of natural resources throughout the war. Examples of this include intensified timber and fuelwood use close to refugee settlements [16,17], a lack of habitat, where protected areas are shelters for terrorists, or areas being left unguarded, leading to stolen natural resources throughout periods of fighting [18]. Secondly, the interaction between armed conflicts and forests and land use suggests that biodiversity and ecosystems may also benefit from military conflicts. This would, for example, be the case in the dispute areas where human activity is reduced or in landmine-contaminated areas (e.g., the demilitarized area between North and South Korea) [19,20]. Forest recovery has also been associated with more complex social and economic shifts tied to civil war and global trade in El Salvador [17,21].
The Syrian coastal mountain fires are one of the most important sources of land-use change in the Middle East. Erosion due to the wildfire impact is of great concern to land managers. Research on soil degradation due to water erosion in Syria is restricted to a few studies focused on experimental and modeling studies. For instance, Karydas et al. [22] found that the runoff coefficient was three times greater on burned watershed than the unburned part. In an experimental study, in Ein Al-Jaouz/Tartous the soil erosion rate was 0.1 t ha−1 year−1 for the area that was not burned and 7.2 t ha−1 year−1 when burned. Reference experimental sites in the Syrian coastal mountains region found that the soil loss rates ranged between 9 and 56.5 t ha−1 year−1 in the burned forest compared to 1.4 and 15 t ha−1 year−1 before burning and 165 t ha−1 year−1 when the slope was 45% in the agricultural system [23]. Mohammed et al. (2020) found that the average soil erosion rate ranged between 1.4 and 7.4 t ha−1 year−1 in the burned forest in five locations in the coastal region of Syria [24]. Abdo and Salloum (2017) found a high soil erosion rate of 4% in the Alqerdaha basin of north-west Syria [25]. Barakat et al. (2014) [2] produced a soil erosion risk map based on the COoRdination of Information on the Environment (CORINE) model for the middle and down the basin of the Northern Al-Kabeer River and showed that 2% of the study area had a high-risk soil erosion rate, 22% a moderate-risk soil erosion and 75% a low-risk soil erosion.
The impact of the war on erosion has not been addressed. Most studies were limited to the effect of the war on agricultural production [13], the impact of the war on green spaces in the city of Aleppo [26] and the impact of oil refining on the environment [27]. The conflict situation adversely affected the agricultural sector, leading to a change in the land use patterns and a reduction in both the cultivated land and forest areas.
There are several models for predicting the magnitude of the erosion caused by water. The models range from the empirical RUSLE (Revised Universal Soil Loss Equation [28]) and EPM (Erosion Potential Method [29]) to the physical PESERA (Pan European Soil Erosion Risk Assessment), Water Erosion Prediction Project [30,31] and WEPP (Water Erosion Prediction Project [32,33]).
These models vary considerably in factors and in the complexity involved in calculating each factor [2,34,35,36,37,38]. Among them, the RUSLE model is considered as one of the widely applied empirical model for estimating soil water erosion [39,40,41]. This model has not yet been verified in Syria [25], but it has been verified in a number of Mediterranean regions (Portugal, Italy and the Palestinian Autonomous Area) [42,43,44,45] that are similar to the study area. For example, Abu Hammad et al. [44] checked the RUSLE in the study region and used field plots soil erosion measurements in the southeast of the Ramallah District in the Palestinian Autonomous Area (65 km2). The results showed the RUSLE soil loss was estimate to be three times the actual soil loss. By adjusting the RUSLE, according to the prevailing conditions of the Mediterranean area, they improved the performance of the model three times. Aiello et al. [45] also verified the rates of soil erosion at the sub-basin scale of the Bradano basin (1500 km2) by comparison with the San Giuliano reservoir silting value. The total amount of gross soil loss ranges between ~1.04 × 10⁶ t year−1, as computed with the Revised Universal Soil Loss Equation for Complex Terrain (RUSLE3D), and ~1.33 × 10⁶ t year−1, as computed with the measured silting data. The RUSLE estimation showed a good match with the measured silting data. We also verified the rates of soil erosion in our study area at the sub-basin of the Northern Alkabeer basin by comparing them with an analysis of the sediments in the reservoir provided by Hasan et al. [46] on 16 November 2017. The RUSLE calculation showed good consistency with the measured sediment outputs. The total gross soil loss ranges from 465,785 t year−1, as calculated with RUSLE, to 474,865 t year−1, as sedimentation has been measured. The validation attempts of the RUSLE model showed its feasibility to estimate the spatial distribution of soil loss for a region in the Mediterranean areas, to provide estimates for soil erosion at the watershed scale and to ensure a good match with the measured silting data. Based on this, we used the RUSLE model, considering that its input parameters are easily available [6,47,48].
In view of the above, the primary objective of this article is to estimate the impact of land cover change on the spatio-temporal distribution and to identify characteristics of soil erosion for the basin of the Northern Al-Kabeer river from 2009/2010 (hydrological year from September to August) to 2018/2019 under armed conflict. Estimates are to be made using the RUSLE model Remote Sensing (RS) and Geographic Information Systems (GIS) technologies with free available data for conditions before and during armed conflict in Syria. The second goal is to provide decision-makers and planners with knowledge to take sufficient priority steps for forest and soil protection when the war is over.

2. Materials and Methods
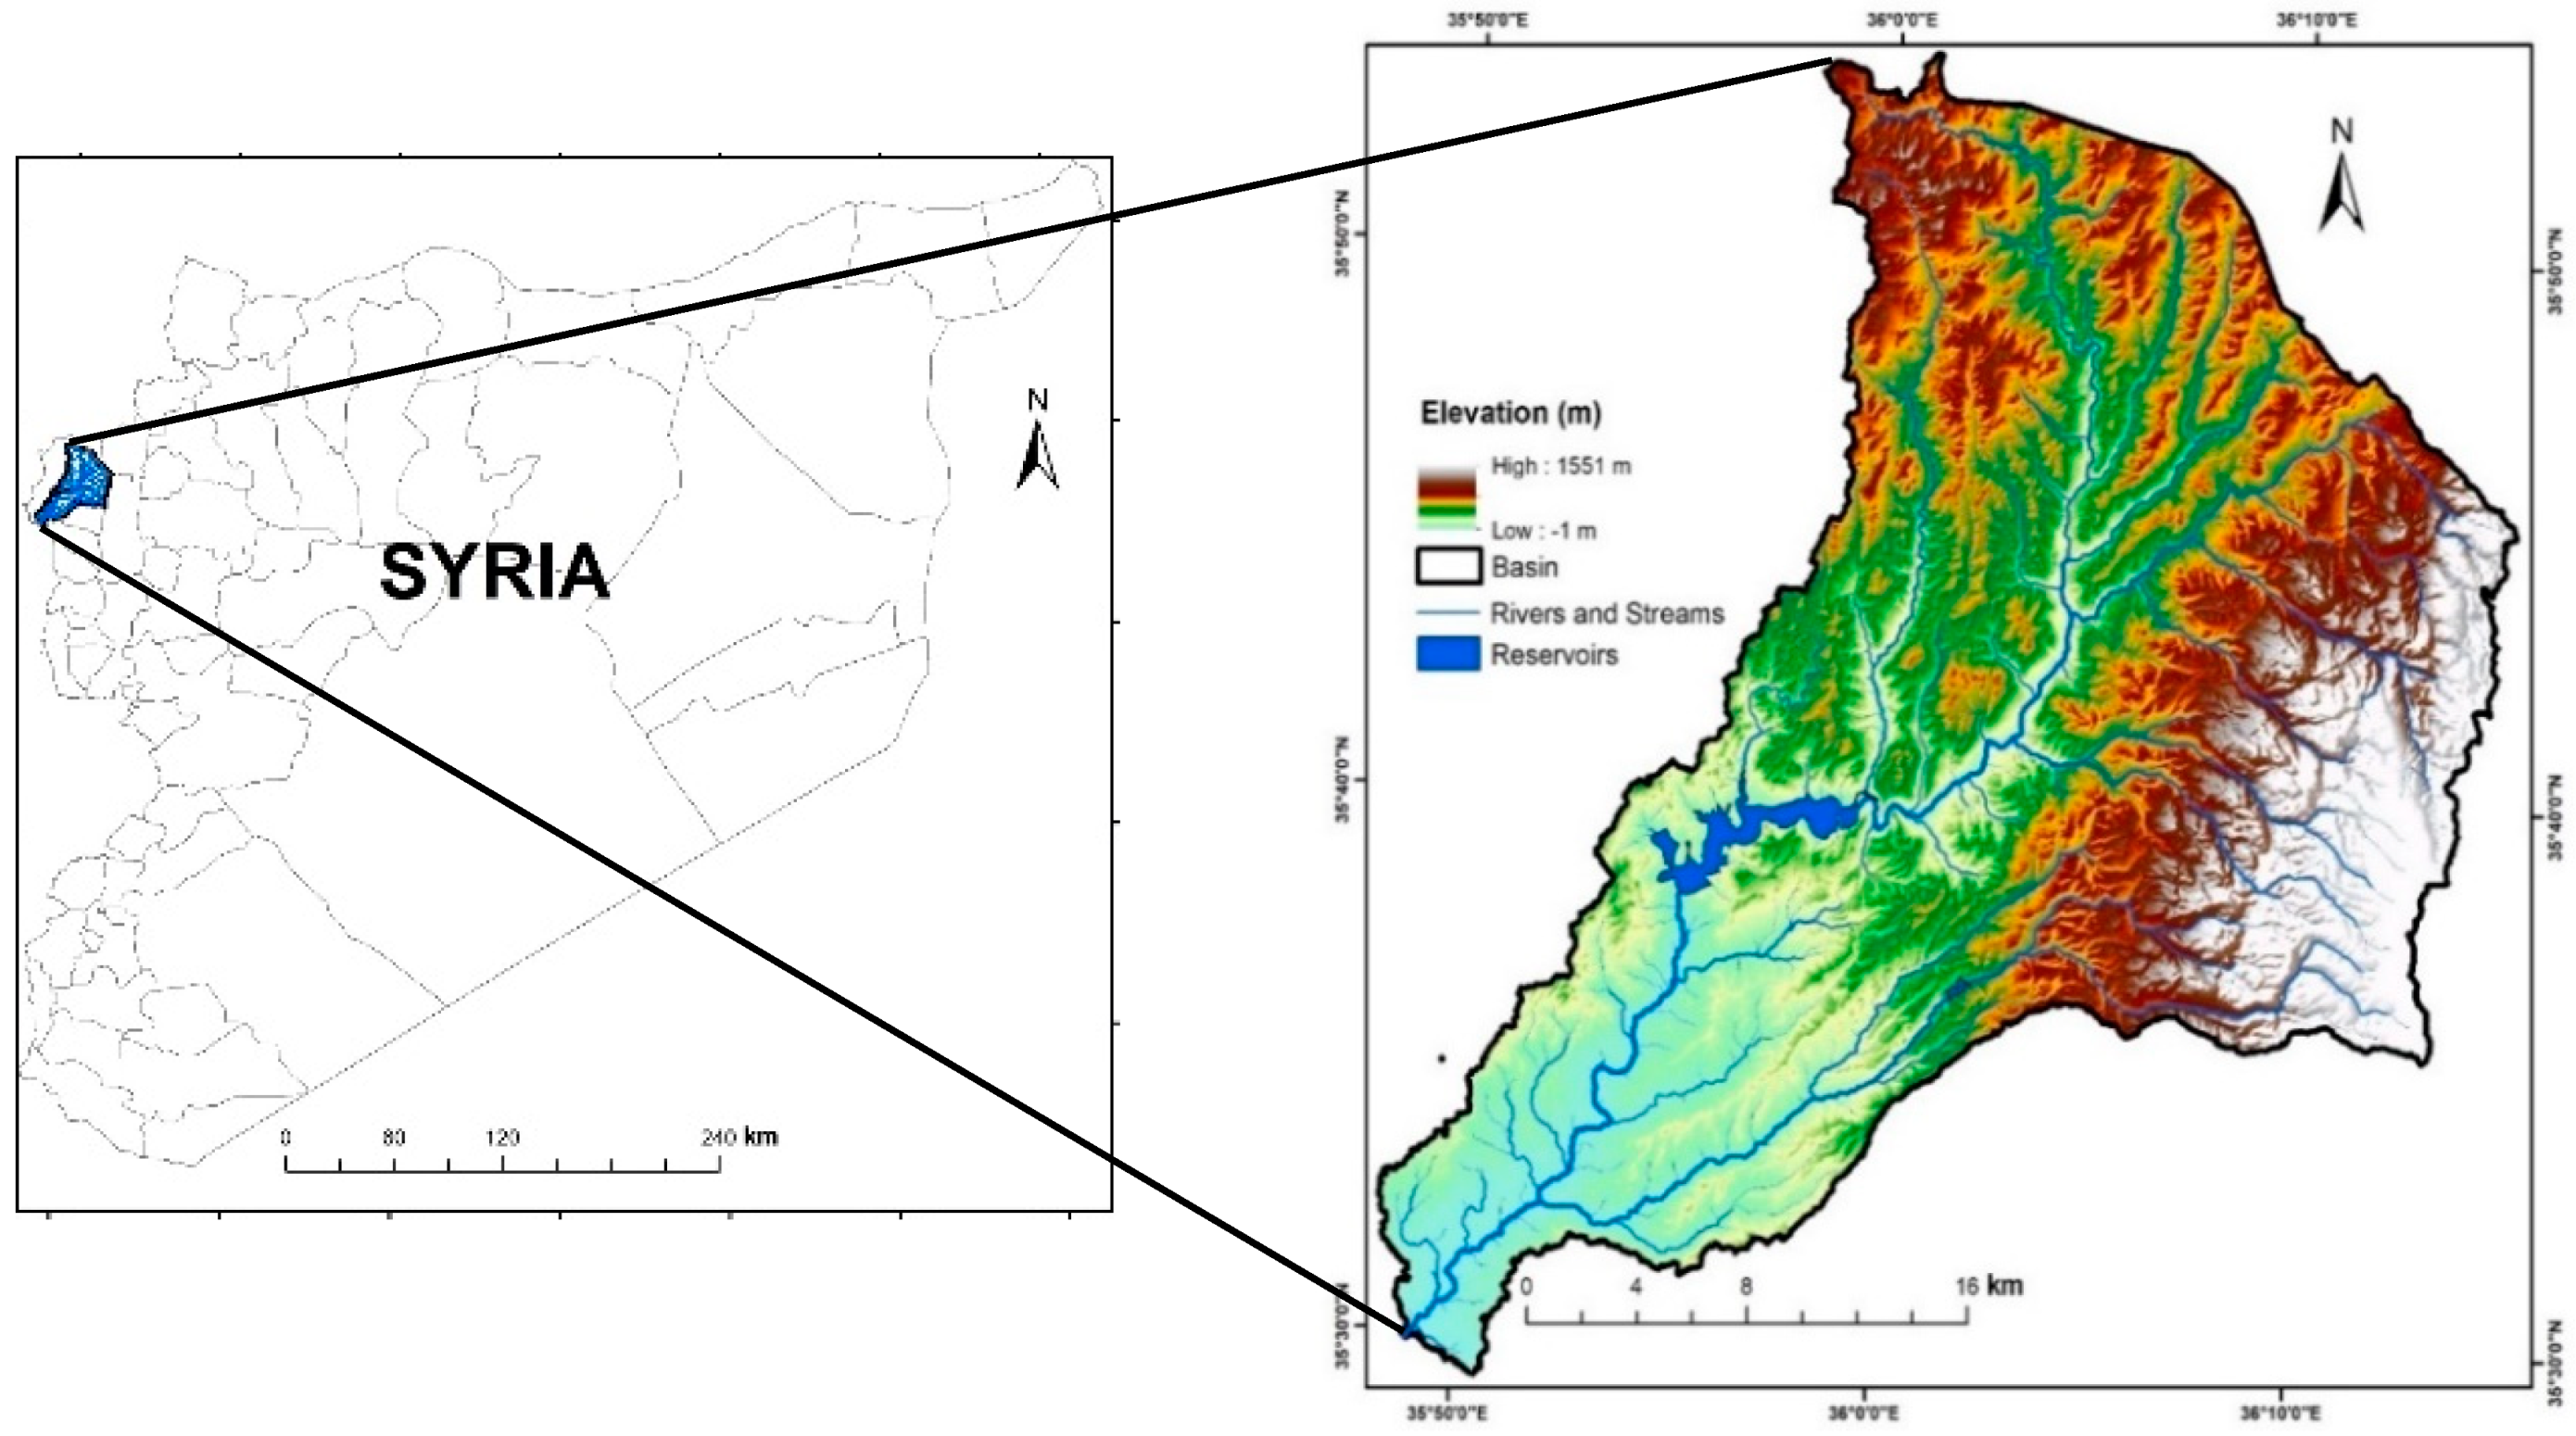
2.1. Study Area

The research was performed in the basin of the Northern Al-Kabeer River of the Northern Province of Latakia (Syria), one of the main coastal rivers. The Northern Al-Kabeer watershed covers an 845 km2 area (35°29′11.546″ to 35°53′48.59″ N, and 35°48′14.36″ to 36°15′7.47″ E) (Figure 1). The length of the river within the Syrian lands is about 60 km. It originates from the northern end of the western mountains of Latakia, specifically from the high mountains situated at the Turkish border and as the Ansari Mountains of the northern province of Latakia. The altitudinal range is from around 1 m above mean sea level in the western plain (the so-called Latakia Plains) to the northeastern coastal mountains (1551 m) (Figure 1). About 81% of the total basin area includes hilly and mountainous regions; the remaining 19% are flatlands. The region lies within the Mediterranean climate zone [49]. It is mainly characterized by seasonal atmospheric circulations, altitude and topography, has an average annual temperature of 12–28 °C and an annual precipitation of 550–1100 mm. The main land-use areas are forests and shrubland in the east basin, whereas components from agriculture field, forest groves of citrus and olive trees and other fruits can be found in the western basin [49]. Forests cover widespread areas throughout the upper basin and parts of the central basin. The most important of these host species are Pinus bruti, Quercus calliprino and Pistasia palaestina (Boiss) [50].

2.2. Data

The key relevant data included in this study are based on five input parameters derivable from the RUSLE model’s soil properties, precipitation, topography, cover and crop management as well as conservation practices as follows:
Due to the lack of climatic data from earth stations during the war, we selected daily Climate Hazards Group InfraRed Precipitation with Station data (CHIRP) V2.0 with a spatial resolution of 0.25° for this study. The rainfall is estimated from Rain Gauge and Satellite Observations. Monthly and yearly data were calculated according to the hydrological year (September–August) for the years 2009/2010, 2013/2014 and 2018/2019.
In this research, freely available data from the Panchromatic Remote-sensing Instrument for Stereo Mapping, Digital Elevation Model (PALSAR DEM) with a spatial resolution of 12.5 m were collected from the Alaska Satellite Facility Distributed Active Archive Data Center (ASF DAAC) in GIS-ready GeoTIFF format. Landsat TM remote sensing images in 2009/2010 and Landsat 8 Operational Land Imager (OLI) data from 2013/2014 and 2018/2019 were collected from the Data Sharing Infrastructure of Earth System Science (http://www.geodata.cn), with a spatial resolution of 30 m.
Soil data sets in SoilGrids system at 250 m, including soil type distribution map soil properties (sand, clay, silt and organic carbon fractions), were compiled by International Soil Reference and Information Centre (ISRIC)—World Soil Information.

2.3. Soil Erosion Using RUSLE Model

In the RUSLE model, the following five parameters were used to predict soil loss [51]:
A = R × K × LS × C × P
here, A: computed spatial yearly soil loss (t ha−1 year−1); R: Rainfall erosivity factor (MJ mm ha h−1 year−1); K = soil erodibility factor (t h−1MJ−1 mm−1); LS = slope length factor and slope steepness factor (unitless); C= land surface cover management factor (unitless); and P = conservation practice factor or erosion control (unitless).
Due to the ongoing war in the region and the high costs of field work measurements [52,53], the study relied on secondary data available in the Geographic Information System (GIS) and remote sensing. Field work was limited to field trips to verify fires, land use changes and soil erosion in 2012–2016.
The R factor determines the erosivity of rainfall at a given location, depending on the amount and intensity of rainfall and the rate of rainfall-related runoff [54]. The majority of sheet or rill erosion is caused by high runoff flow as a consequence of heavy storms. In this analysis, the approach of Arnoldus (1977) was employed, as it was derived under similar climate conditions as in the study region and is commonly used in Syria [49,55] (see Appendix A). The rainfall erosivity factor (R) was calculated using a method based on monthly average rainfall aggradations given by data from the Climate Hazards Group InfraRed Precipitation with Station (CHIRPS) including the interpolation tool Inverse Distance Weighted (IDW) in the program ArcGIS 10.7.
Soil erodibility factor (K) is a dynamic property that quantifies the susceptibility of soil particles in sheet flow and rills to detachment and transport by a splash during runoff, water flow or both [53,56,57,58]. Soil erodibility is related to the combined impact of rainfall, drainage and soil loss penetration, and is generally referred to as soil erosion factor (K). This study used the K factor (Figure 2a), estimated using soil properties (sand, silt, clay and organic carbon fractions) at 5 cm depth compiled by ISRIC—World Soil Information with a spatial resolution of 250 m [39]. The equation was used to estimate the erodibility of soil, as suggested by [59] (see Appendix A).
The LS factor reflects the influence of local topography on the soil erosion rate, integrating the effects of the slope length (L) and slope steepness (S). The LS factor has been generated using the PALSAR DEM with a spatial resolution of 12.5 m (2011), which has been collected from the Alaska Satellite Facility Distributed Active Archive Data Center (ASF DAAC).
The slope length factor (L) is provided by the Desmet and Govers (1996) [60], and is enhanced by the USLE estimation technique. It considers the upstream contribution area, where the impact of the slope length is a function of the ratio of rill erosion to inter-rill erosion (caused by raindrop impact) and is more appropriate for areas with complex slopes. Steep slopes (L) and rolling topography provide a vital medium for a lower position of the springing runoff water. The slope-steepness factor (S) shows how easily water can flow over a given surface that interacts with the ground angle and affects the soil erosion rate [40]. The estimation of the S-factor originally proposed by Wischmeier and Smith (1978) was proposed by McCool et al. (1987) in the RUSLE model to achieve an improved representation of the slope steepness factor, taking into account the ratio of the rill and inter-rill erosion. McCool et al. (1987) found that soil erosion occurred more rapidly on slopes with a steepness of more than 9%. Therefore, he used one algorithm for slopes < 9% and another for slopes > 9% (see Appendix A).
The Normalized Difference Vegetation Index (NDVI) is one method to estimate the C factor from remotely sensed data and is the most widely used vegetation index. In Europe, van der Knijff et al. [61] developed the following relationship with the image satellite-based standardized vegetation difference index (NDVI) between field-calibrated C factor values to produce a continuous C factor surface (Equation (2)):
C = e x p [ 2 NDVI ( 1 NDVI ) ]
It was proposed to use the NDVI image acquired when soil erosion is strongly active during the rainy season. Thus, the C factor layer (Figure 2b) used in our study was created using Landsat TM remote sensing images in 2009/2010 and Landsat 8 Operational Land Imager (OLI) 2013/2014 and 2018/2019 for the rainy seasons (September–May) using Equation (2).
The Conservation Practice Factor in the RUSLE model expresses the effect of conservation practices mitigating erosion by minimizing the volume and rate of water runoff. It is the ratio of soil loss to the related loss of slope-parallel tillage with a particular support activity on cropland. As a result of the lack of support activities in place in the Northern Al-Kabeer river basin, a value of 1.0 for the entire region was assumed to support the conservation practice factor.

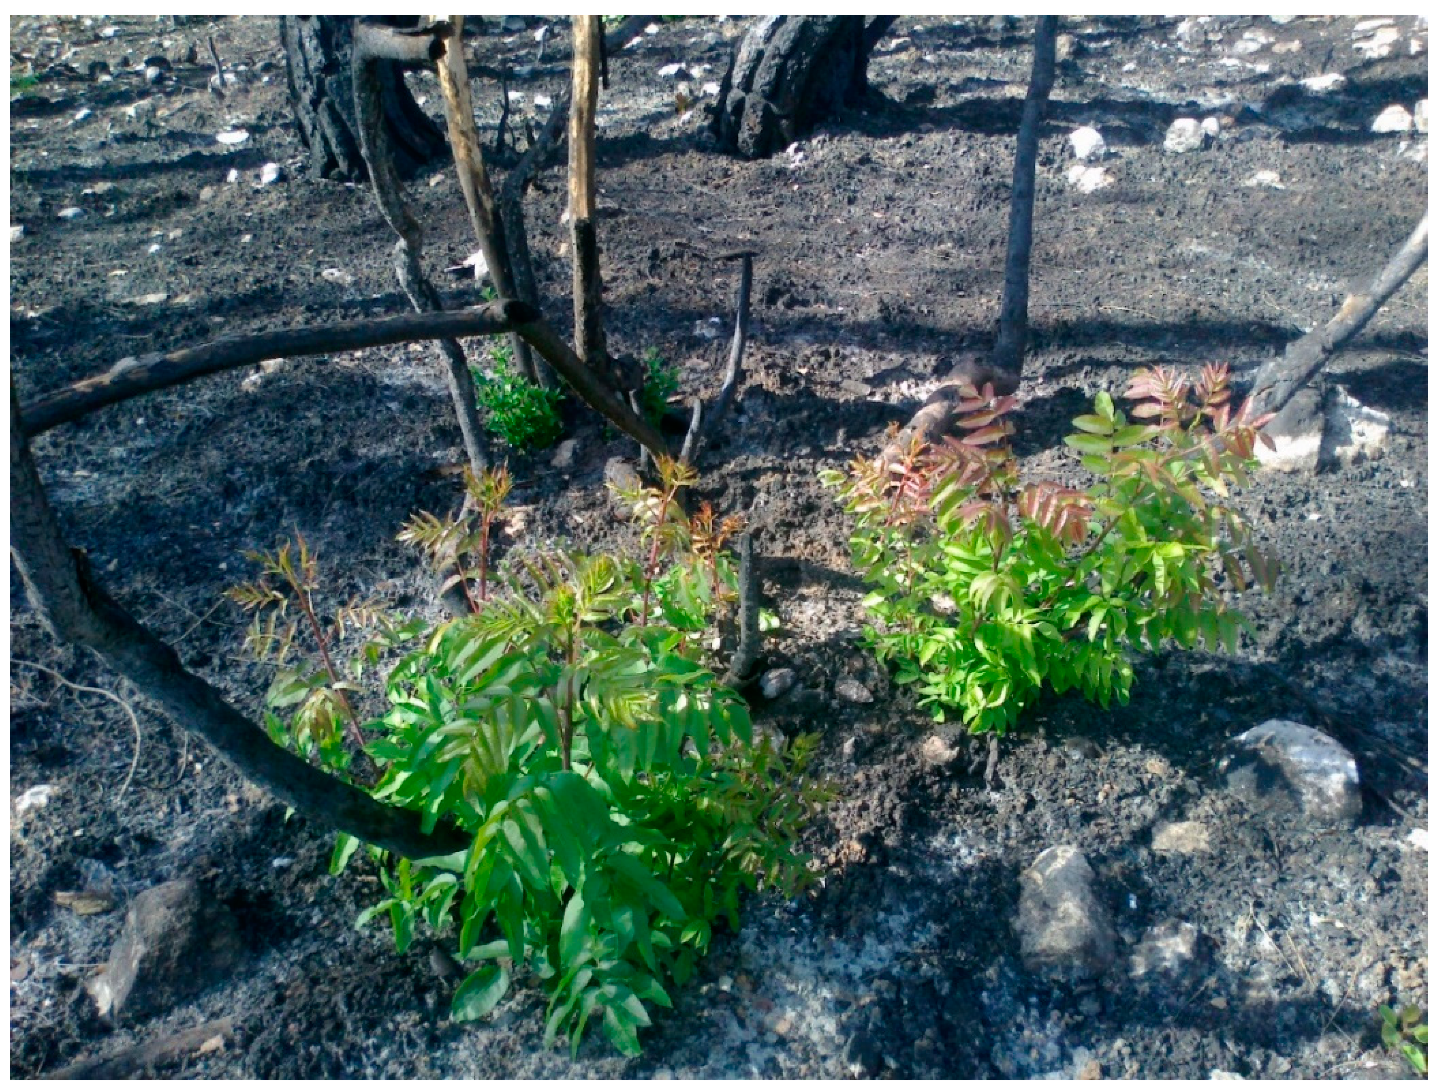
2.4. Role of Vegetation in the Soil Erosion Changes

In order to detect the role of vegetation in soil loss transition, the soil erosion modulus of various times has been determined in tow scenarios according to Wang and Su [62]. The natural condition and C factor fixation to detect the role of vegetation in soil loss transition and the contribution rate of vegetation to soil erosion were analyzed by comparing the average soil erosion modulus under C factor fixation scenarios with the real average soil erosion modulus in the natural condition:
-
The first scenario showed the natural condition of the soil erosion modulus in the initial year in each period of 2009/2010–2013/2014, 2013/2014–2018/2019 and 2009/2010–2018/2019, i.e., the actual soil erosion modulus in each period.
-
Scenario C factor fixation is the soil erosion modulus calculated by the C factor value using the end year of each period, i.e., 2013/2014 and 2018/2019, while other factors values remain as used at the initial year of each periods.
The wildfire inventory dataset was created using the GPS data from the field surveys in 2012–2016 and evaluated using the hotspots of MODIS and Google Earth images. These corrections were manually done in the geographic information system ArcGIS 10.7. However, they did not include all wildfire events due to difficulty in access as a result of fires, artillery and missile shelling.

3. Results

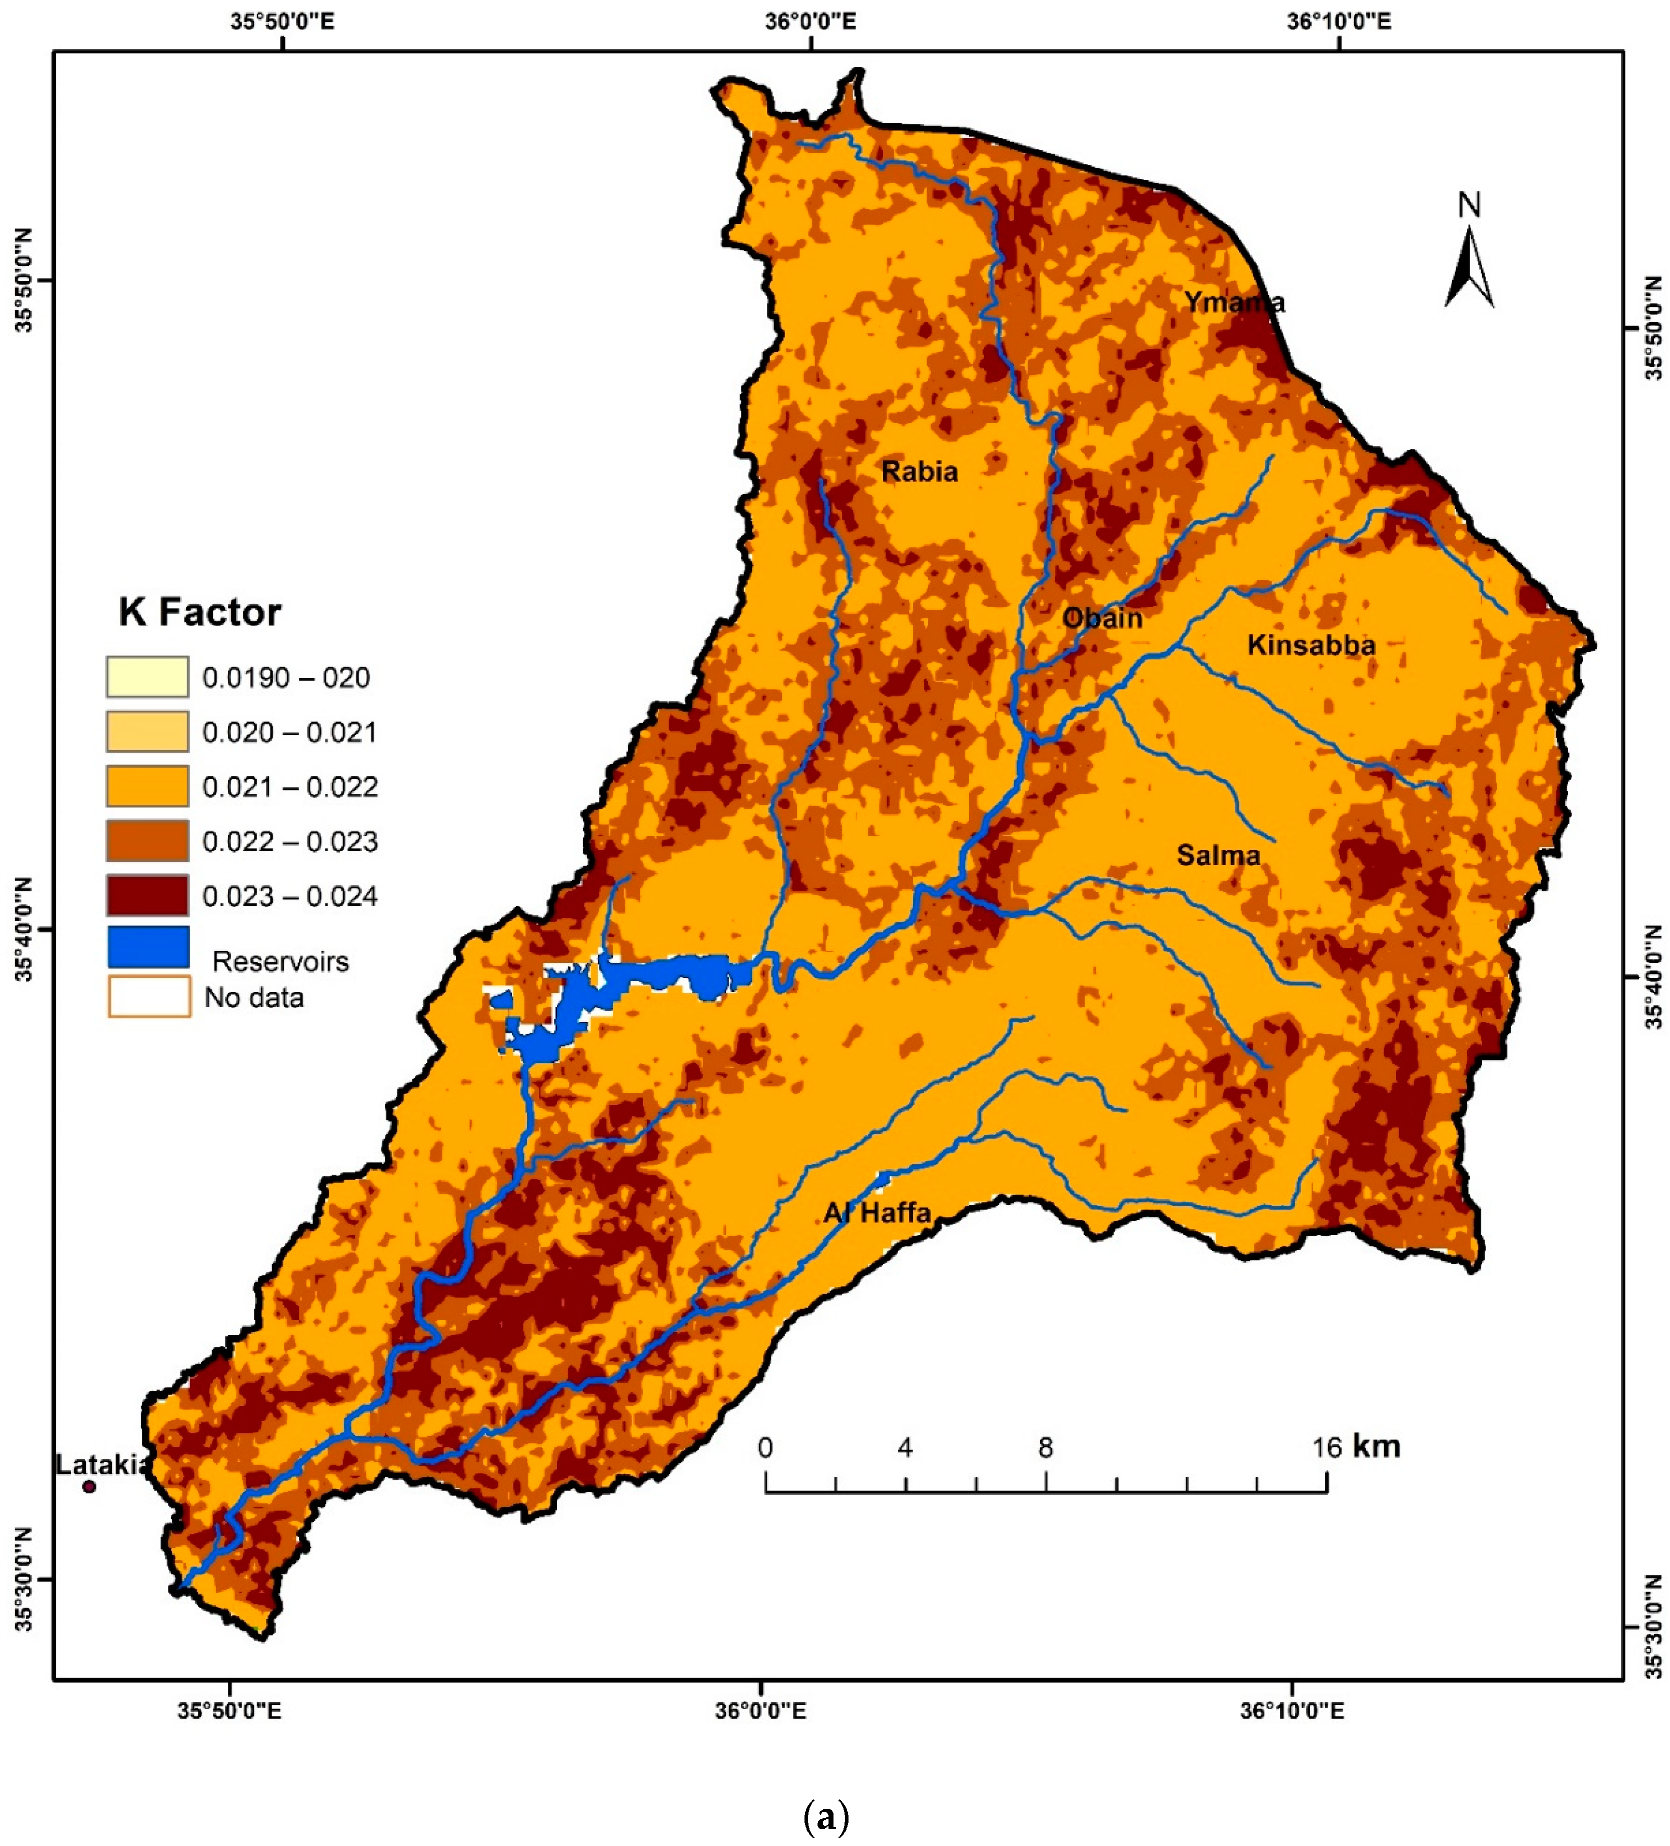
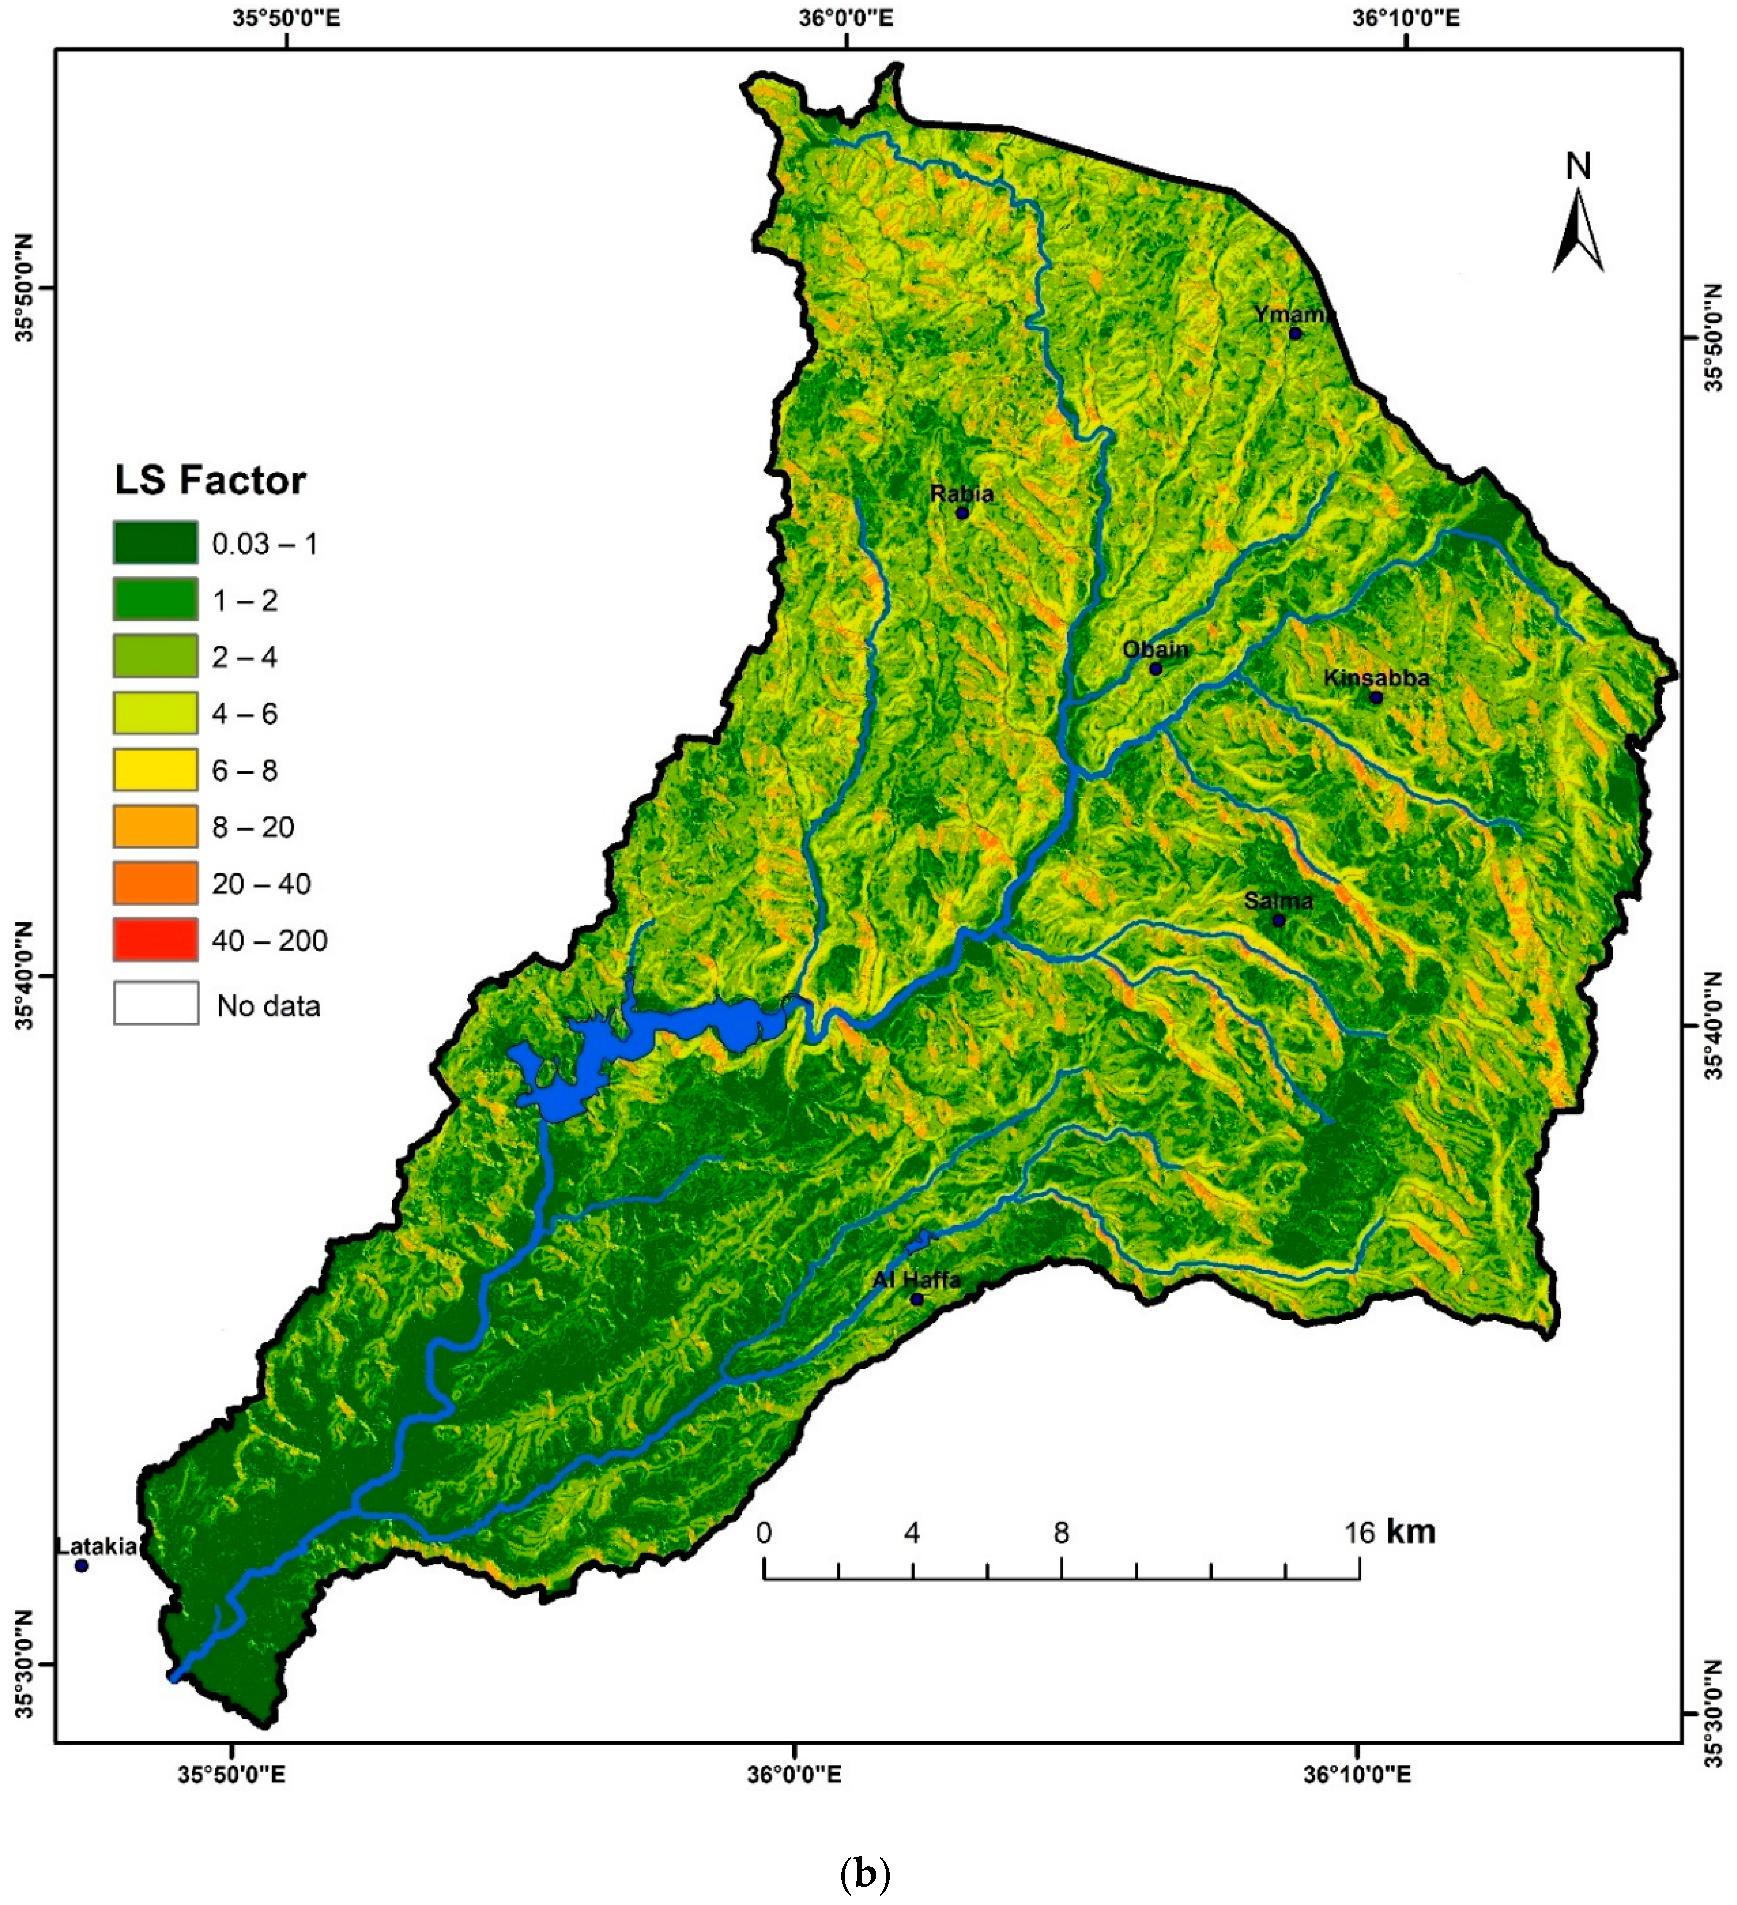
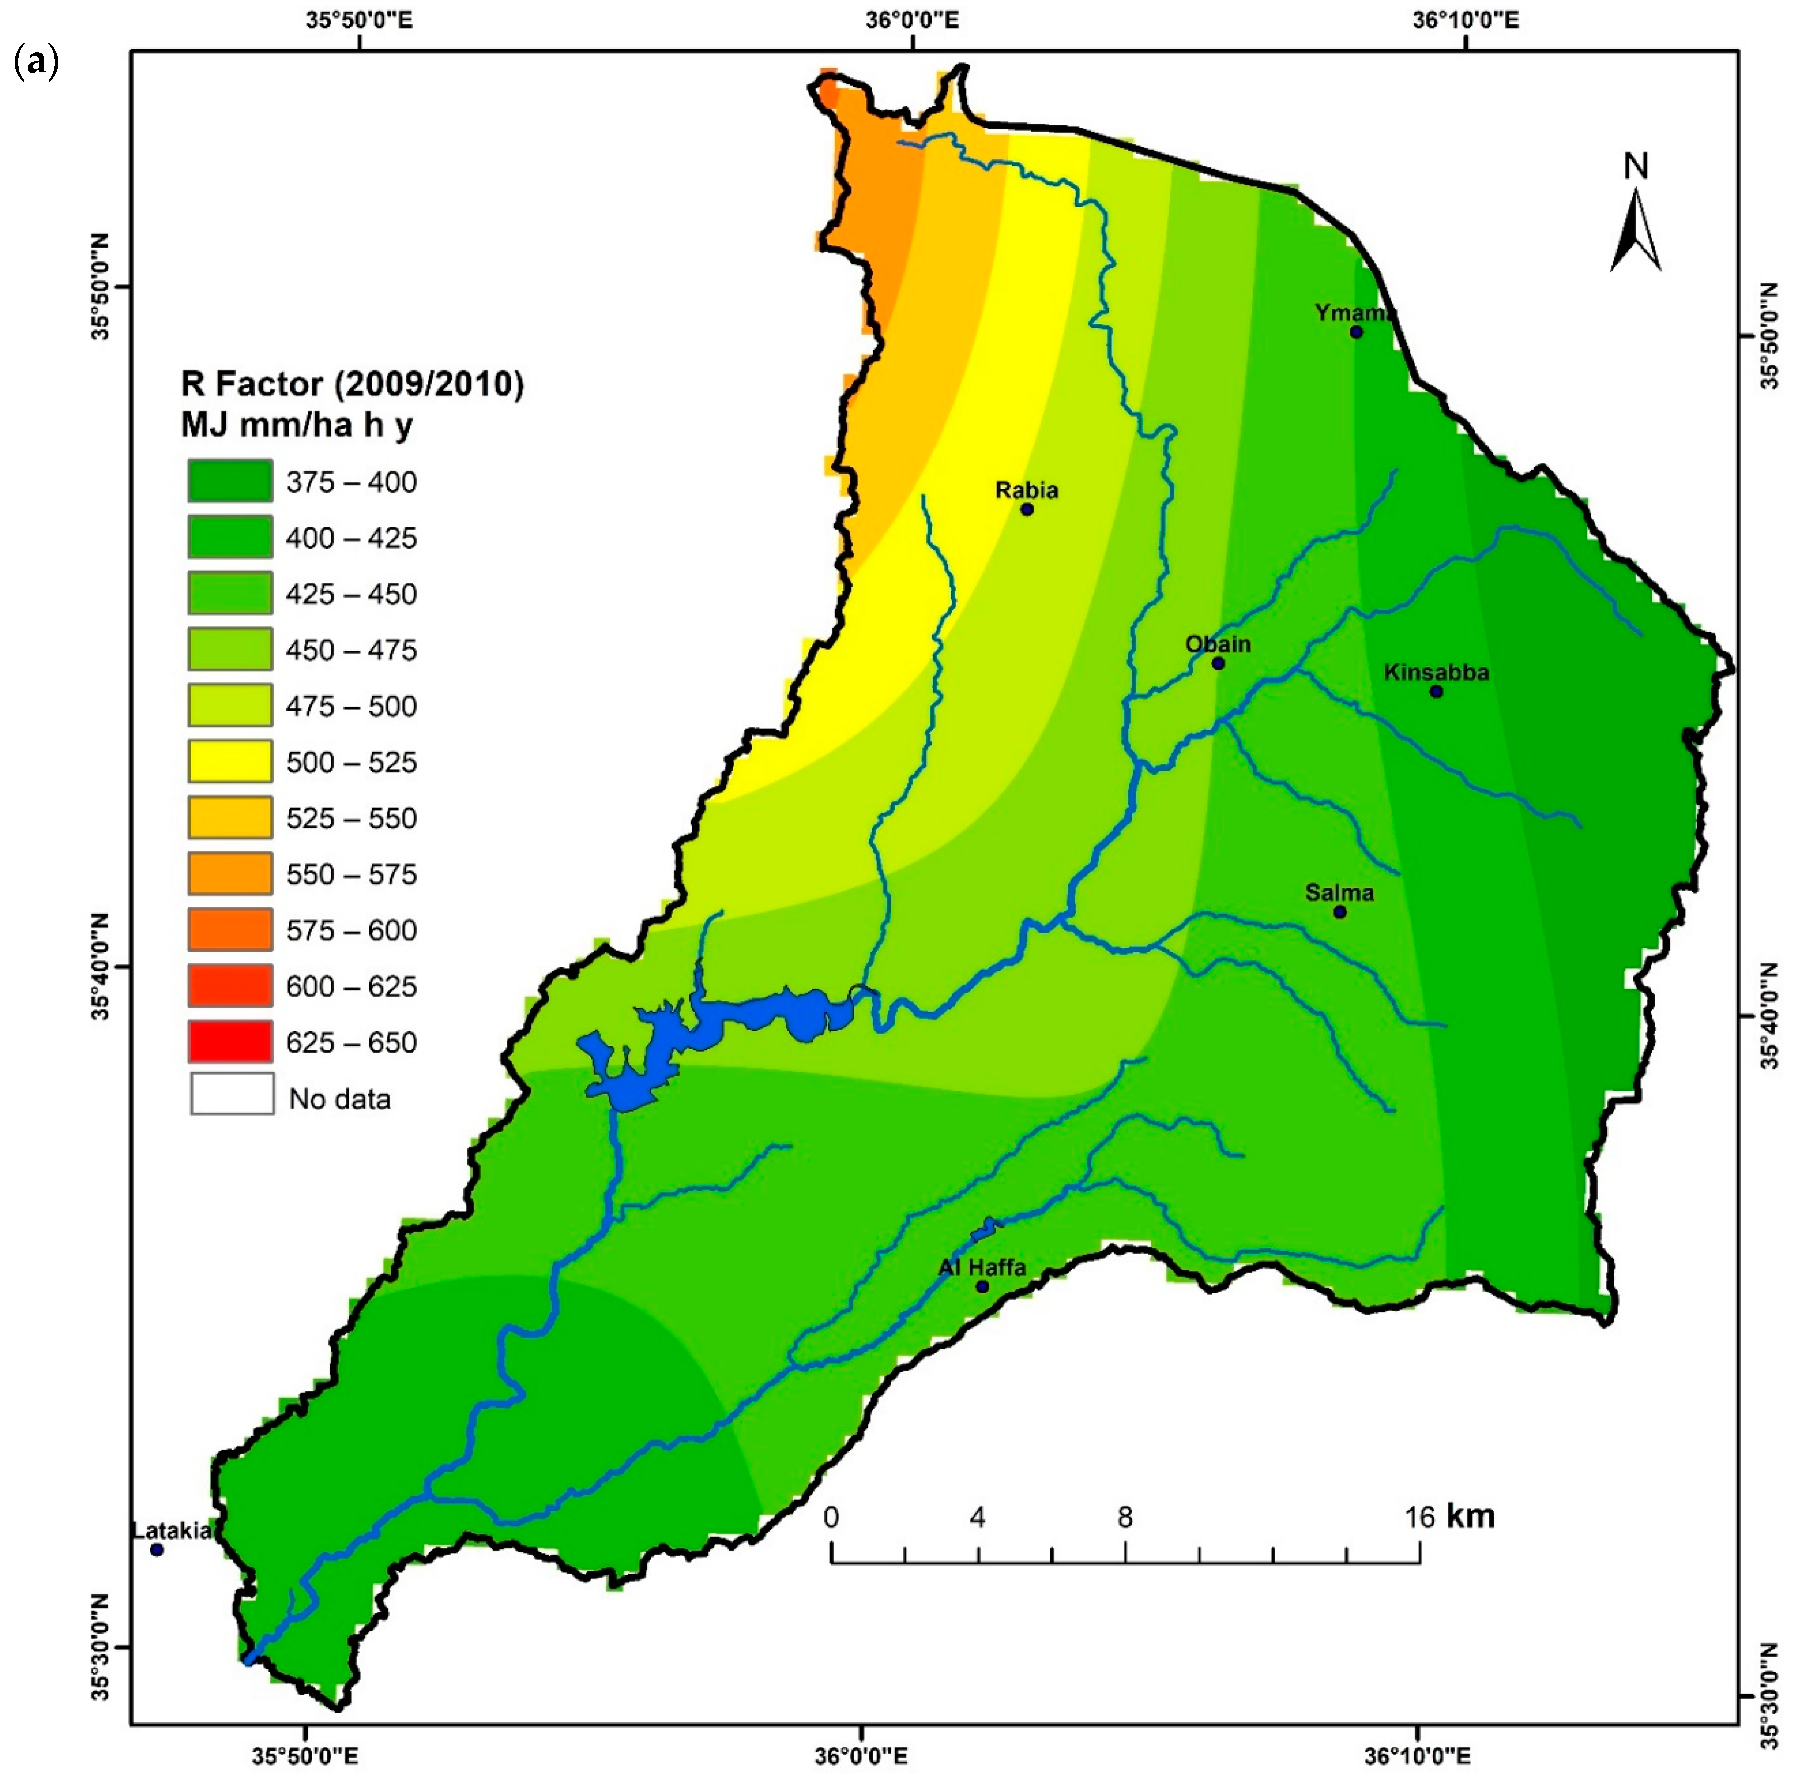
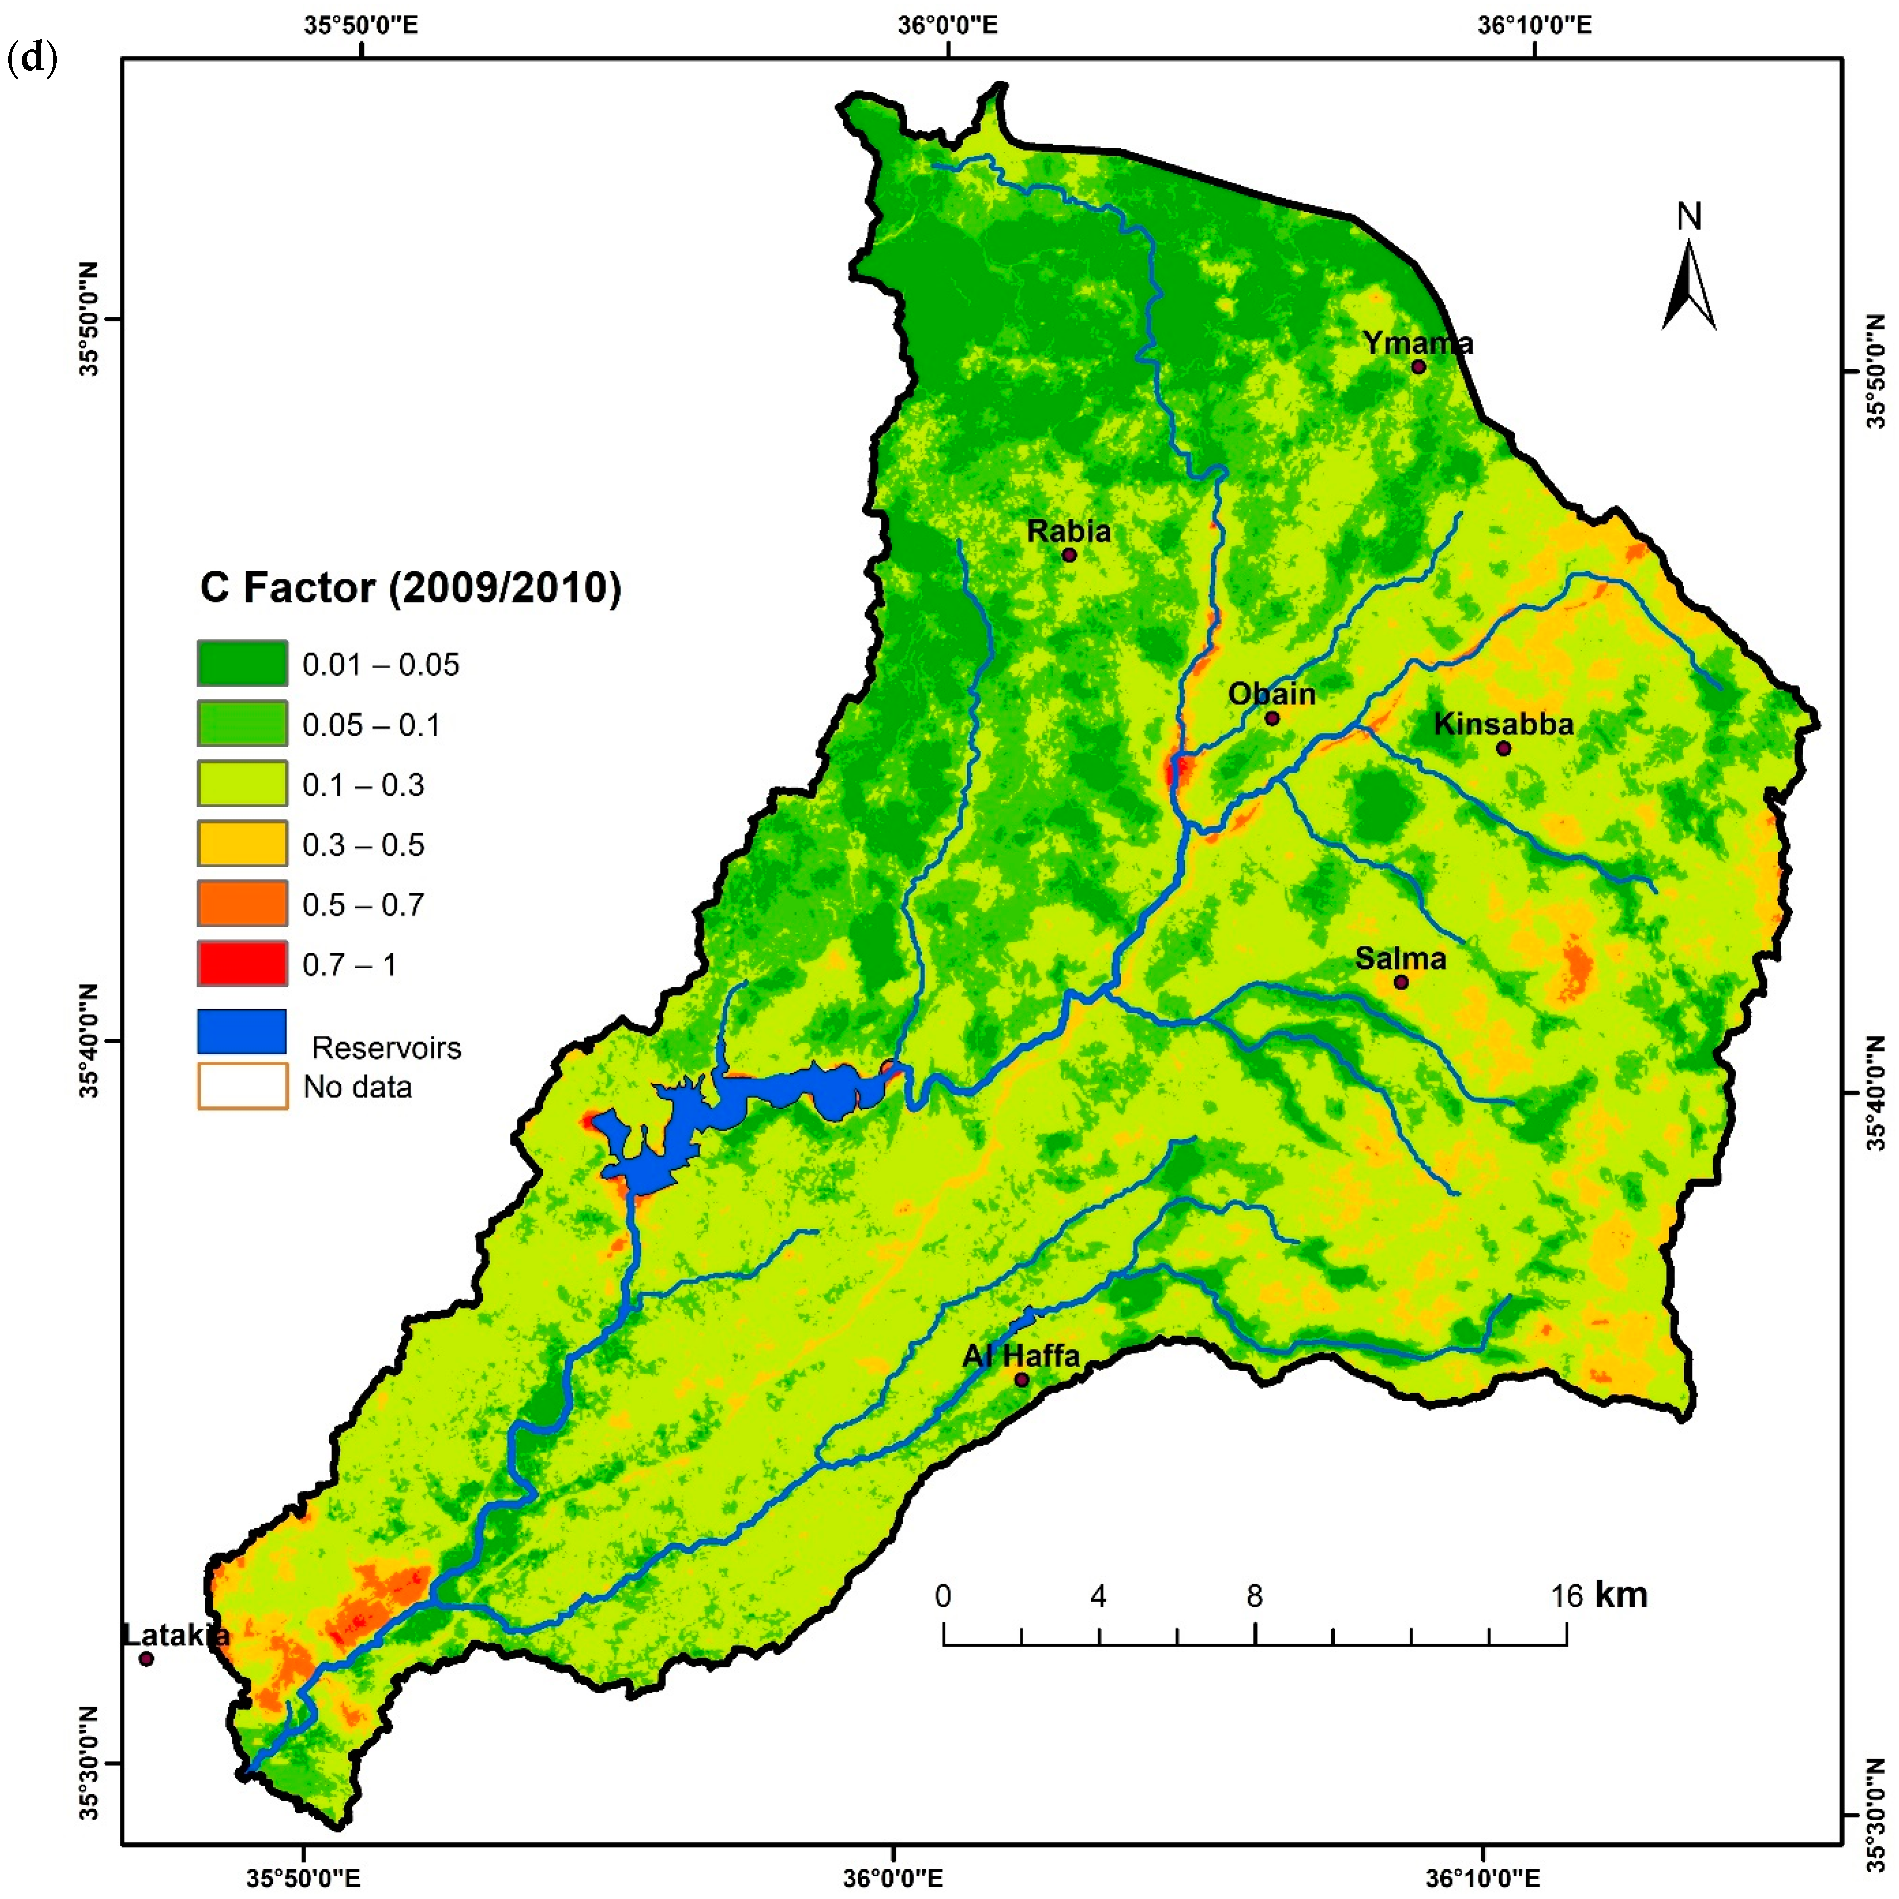
3.1. Distribution of Soil Erosion Factors in the Northern Al-Kabeer River Basin

The factors were mapped by ArcGIS environment in the Northern Al-Kabeer river basin. The erosion layers were generated at a cell size of 12.5 m, following the DEM resolution, which was the finest among the input datasets. The results indicate that the value of the K factor varied from 0.019 to 0.023 t h−1MJ−1 mm−1 (Figure 2a). Much of the Northern Al-Kabeer basin areas are covered with a texture of sand, clay and loam. The value of the LS factor ranged from 0.03 to 200 for the entire region (Figure 2b). The cover management factor (C) value varied between 0 and 1. The R factor value ranges from 375 to 650 MJ mm ha−1 h−1 yr−1, with the maximum values in the north-eastern part of the basin and the lowest values in the south-western part of the basin. (Figure 3a–c). The average R factor was 430 MJ mm ha h−1 year−1 in 2010 and then increased to 505 MJ mm ha h−1 year−1 in 2013/2014, but decreased again to 445 MJ mm ha h−1 year−1 in 2019/2020. The value of the C factor decreased in 2013/2014 in comparison to 2009/2010 due to the forest fire in 2012 and 2013. After that it increased again until 2019/2020. The soil that is covered by trees and forests, and hence protected from soil erosion, are classified as low (0.001–0.03). Built-up areas/settlements and barren land are associated with high soil loss and a value of 0.8–1. Similarly, there is less soil erosion associated with farming. These are ranked as 0.18 and 0.28, respectively (Figure 3d–f).

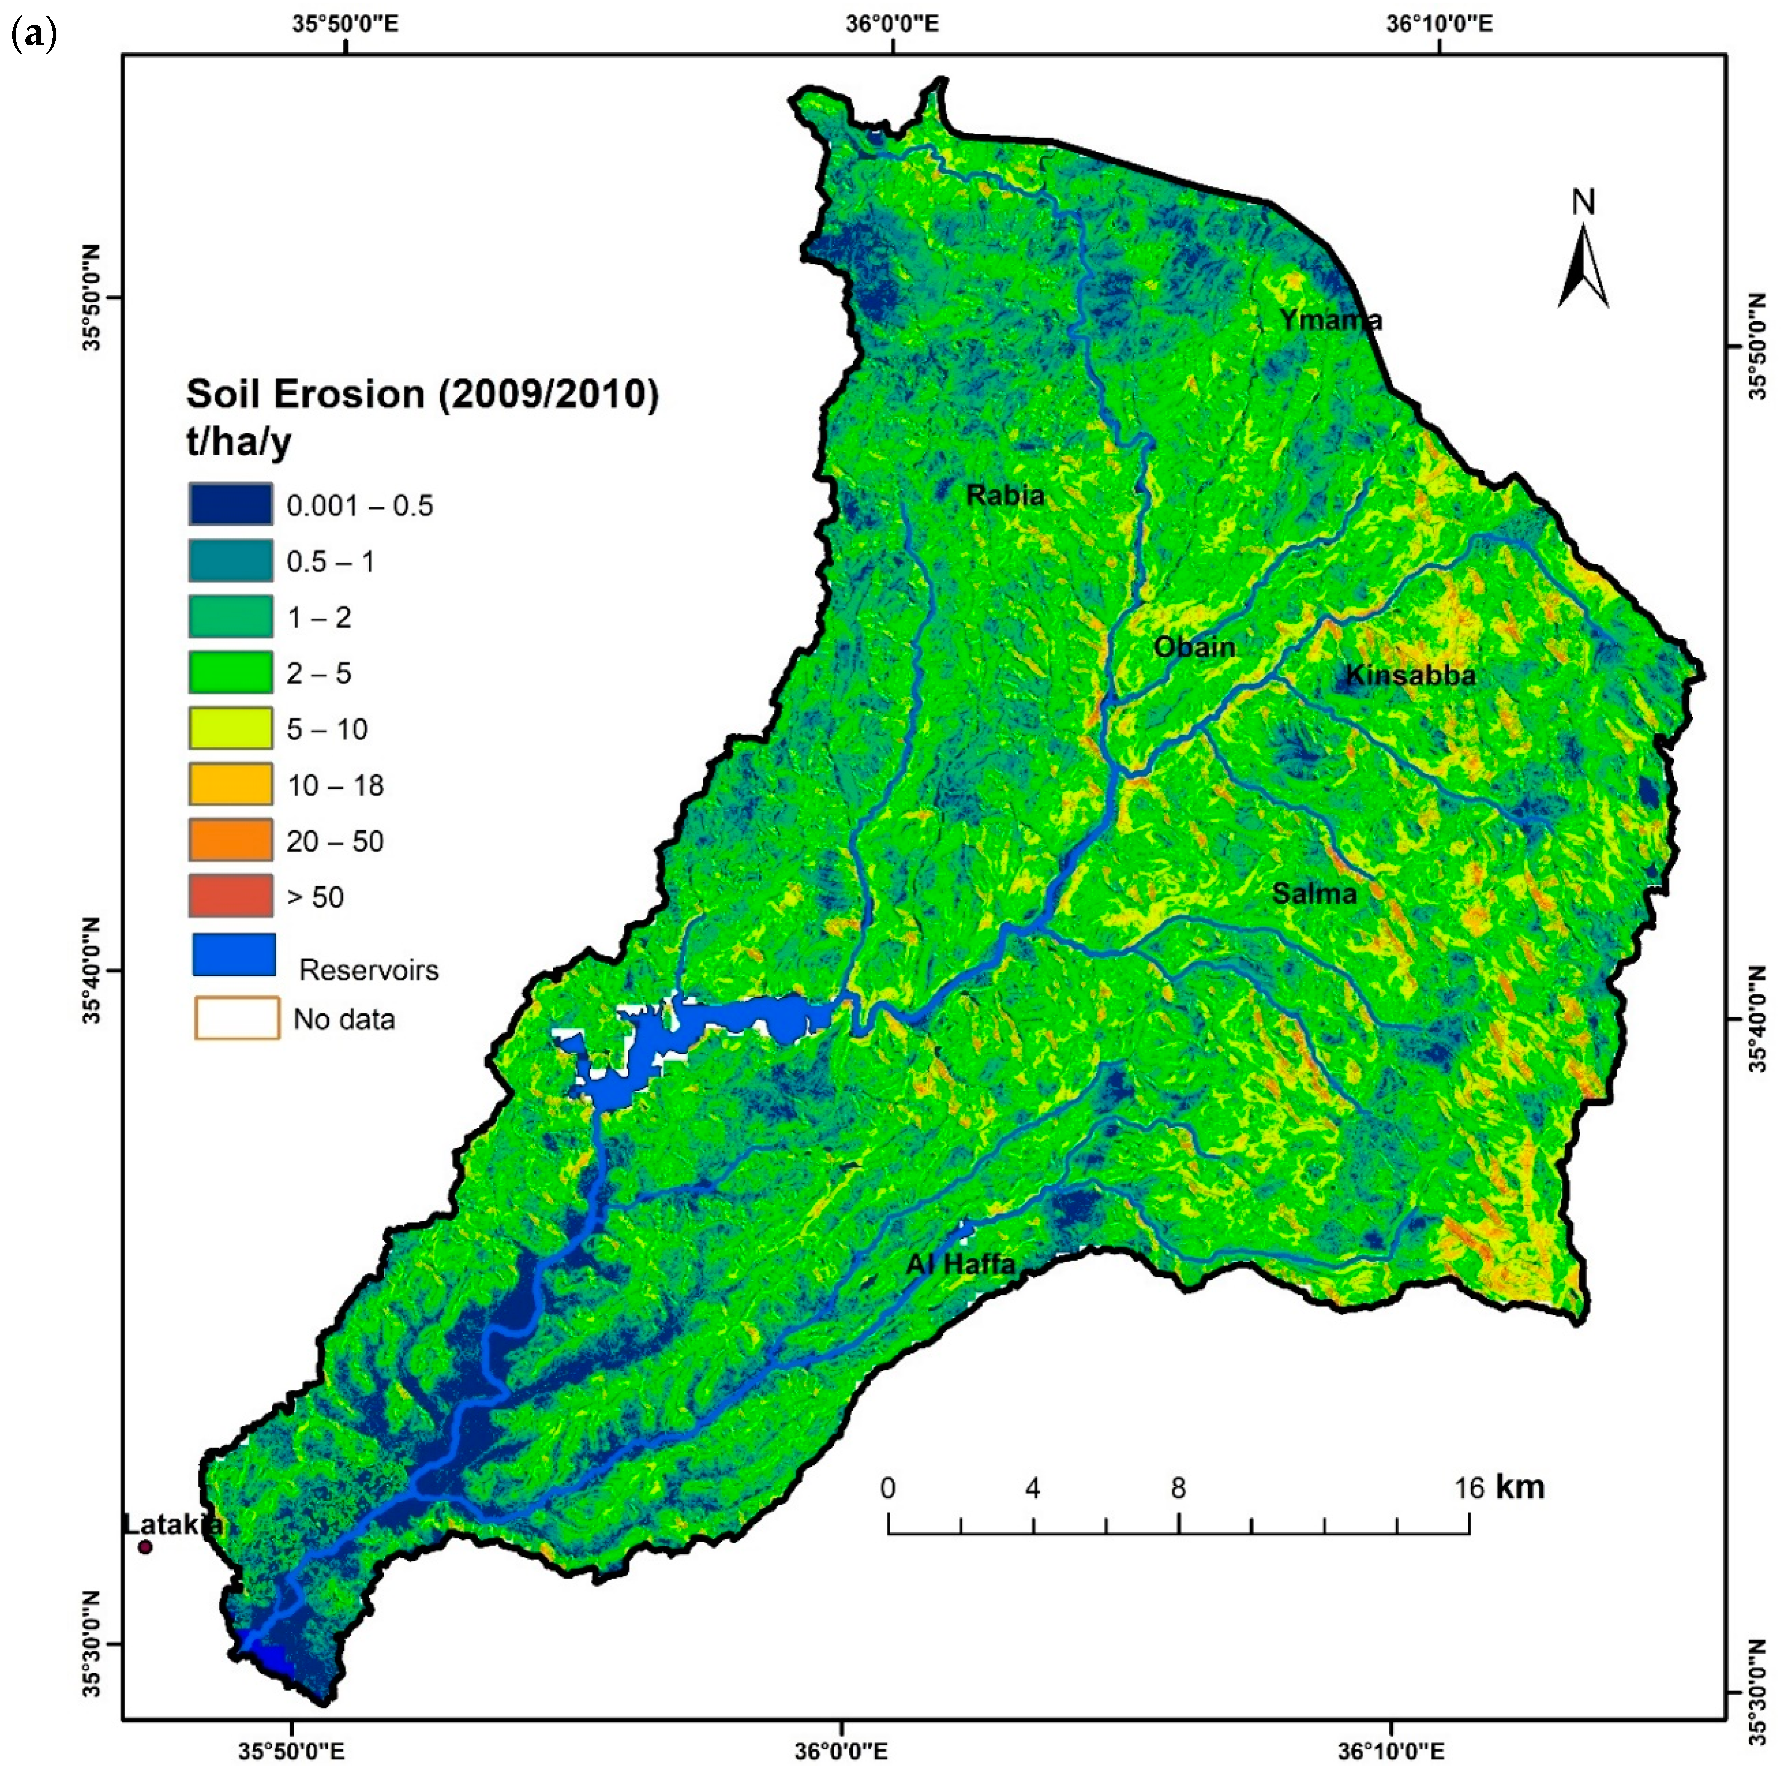
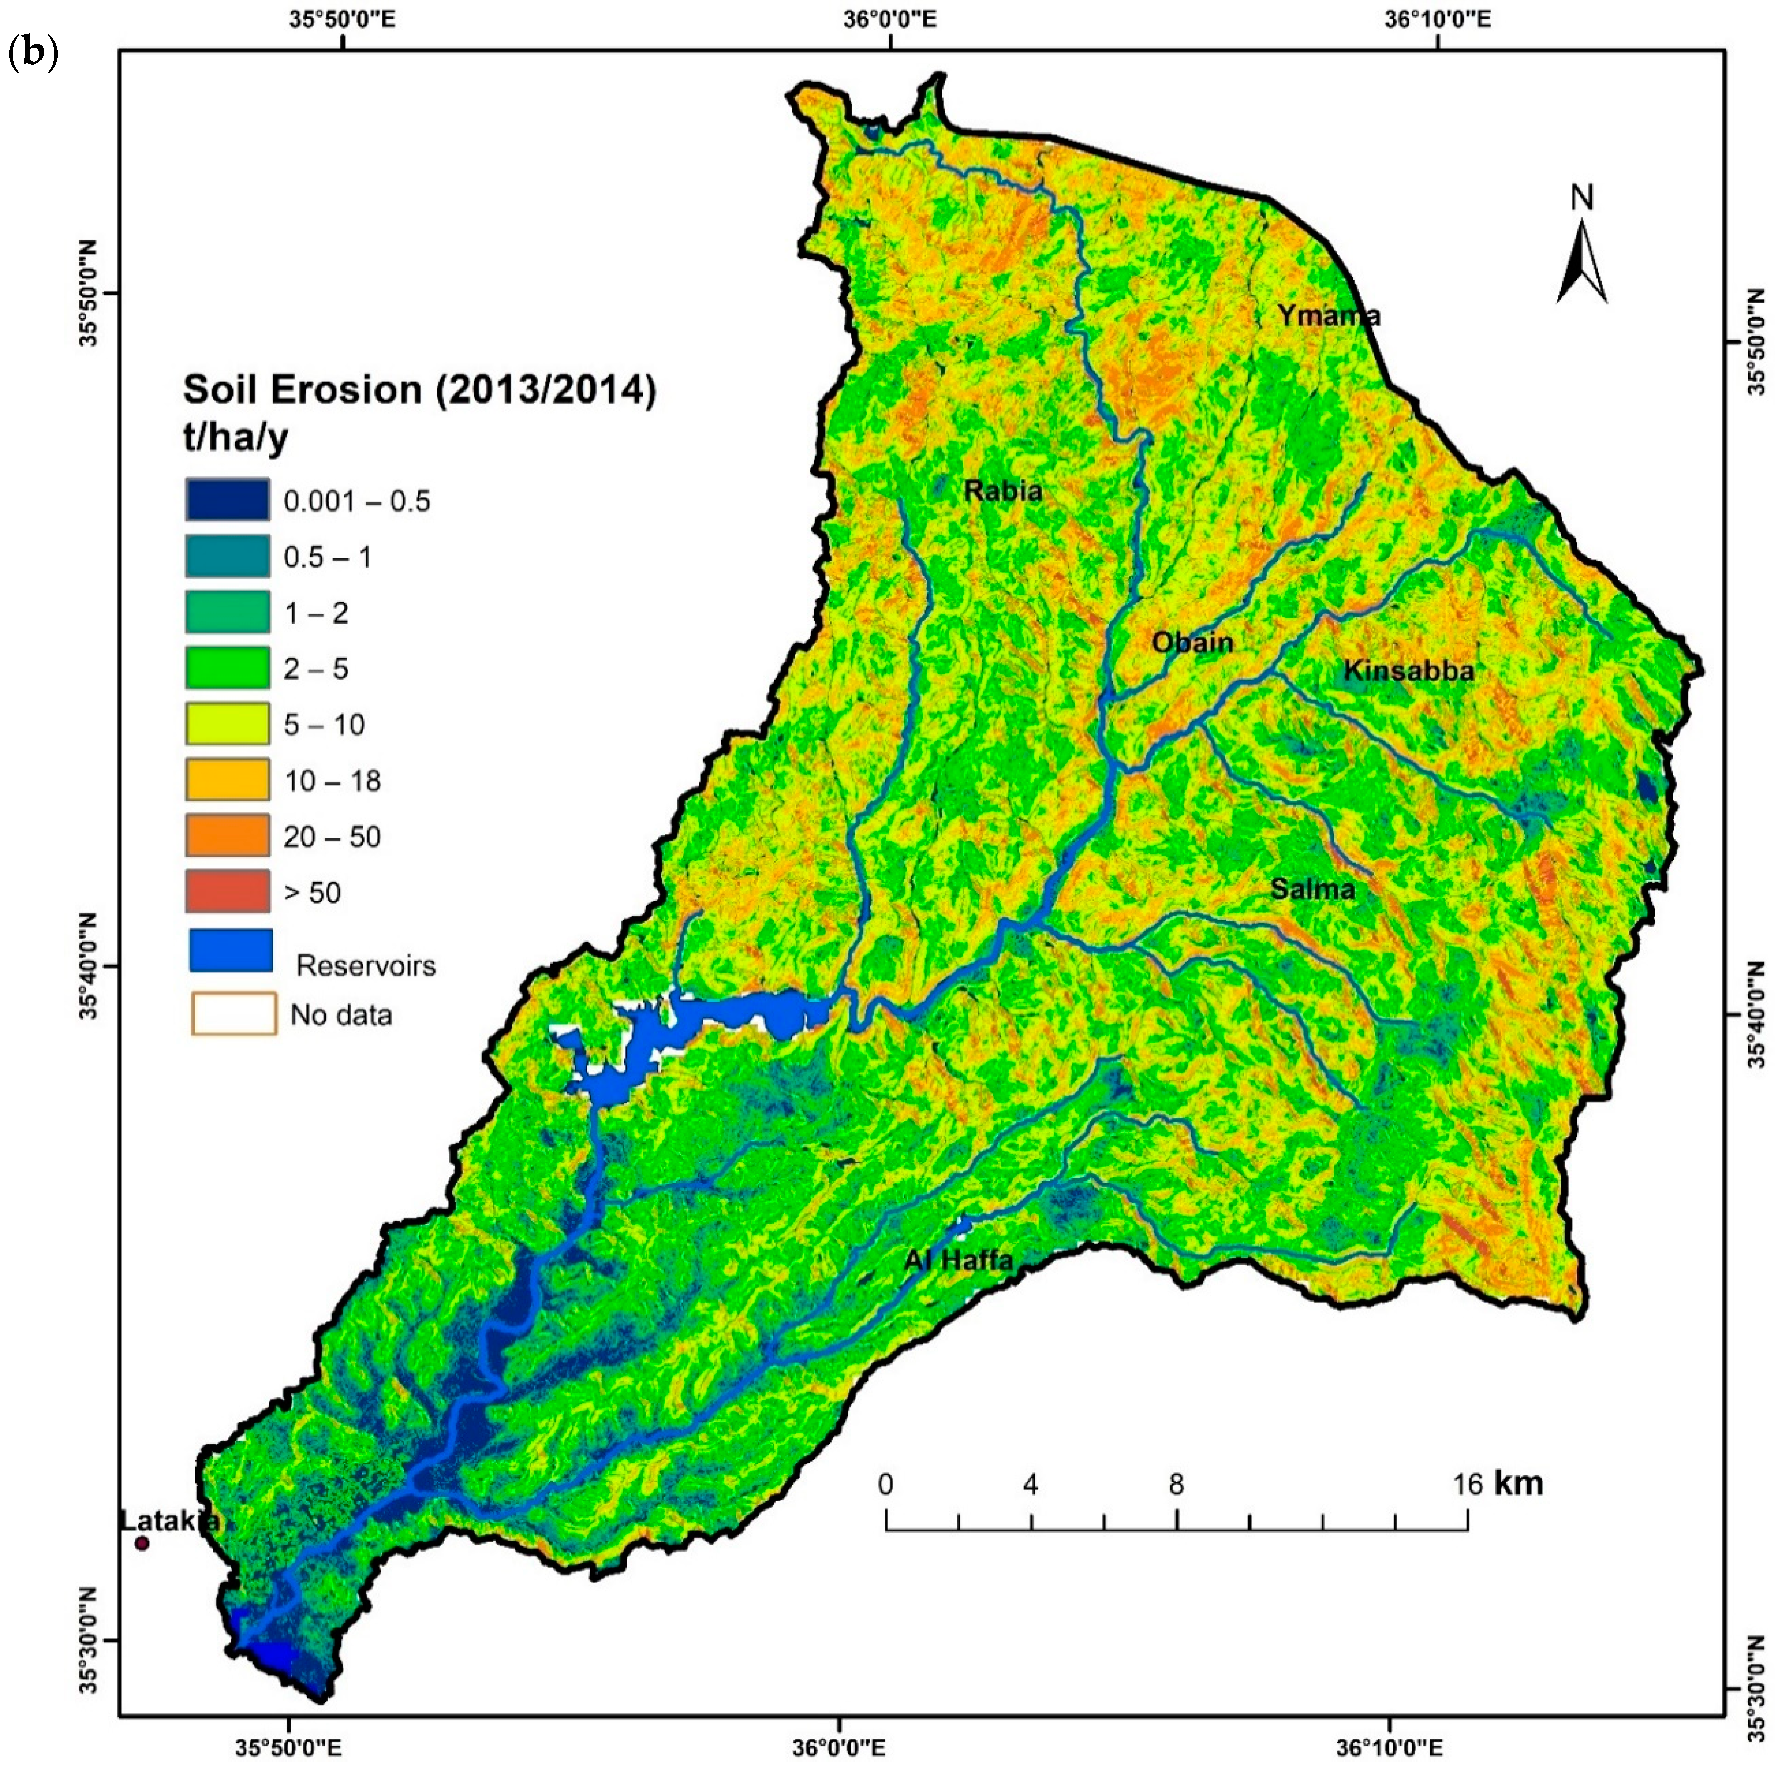
3.2. Estimation and Spatial Distribution of Soil Erosion Rates in the Northern Al-Kabeer River Basin

To facilitate the analysis of the spatial distribution of the soil erosion rates and to promote the visual comparison of the three maps, the basin’s soil loss was classified into eight categories [40,61,63] (Table 1). The distribution of soil erosion maps in 2009–210, 2013–2014 and 2018–2019 was produced in ArcGIS 10.7 (Figure 4; Table 1).
The average rate well exceeds the tolerance limit of 1 t ha−1 year−1 soil loss for the study areas. In Table 1, it is observed that the soil erosion intensity in most of the study area was classified as low medium to high medium (1–10 t ha−1 year−1), which is more than 66% of the river basin. About 24% of the watershed is under the tolerant erosion rate. On the contrary, the distribution of soil losses in the study area of over 10 t ha−1 year−1 (very high and extremely high soil classes) was lower and accounted for around 10% of the total area. However, the rate of soil erosion remains high compared to other basins in the Mediterranean region. The critically high watershed soil erosion is related to the upstream portion of the river. Removal or alteration of the vegetation, destruction of the forest, fires caused by human activities and shallow depth of the soil above the bedrock significantly increase soil erosion. Overall, the far east and southeast portions of the basin (upstream region and eastern portion of the downstream region of the Northern Al-Kabeer river) is characterized by soil loss, where a shallow depth of the inceptisols (xerofluvents) soil and built up areas are causing erosion (Figure 4). The very low erosion class was found mainly in the upstream region due to land cover by forest, and in the downstream region due to the flat terrain (Figure 4).
From 2009/2010 to 2013/2014, the average annual soil erosion module increased and decreased from 2013/2014 to 2018/2019 with an average of 3.6 t ha−1 year−1 and a standard deviation of 6.4 t ha−1 year−1 in 2009/2010; the average was 7.9 t ha−1 year−1 with a standard deviation of 12 t ha−1 year−1 in 2013/2014; and the average was 2.2 t ha−1 year−1 with a standard deviation of 4.3 t ha−1 year−1 in 2018/2019.
Table 2, Table 3 and Table 4 show the erosion change matrix between 2009/2010, 2013/2014 and 2018/2019. In the period of 2009/2010 to 2013/2014, the soil erosion area of regions with no changes was 30%. The region shows that the total area under very low erosion, low erosion, low medium erosion and medium erosion in 2009/2010 was nearly 9%, 11%, 24% and 38% of the total area, respectively. Different results were observed for the watershed, where the area under very low erosion, low erosion, low medium erosion and medium erosion was 5%, 4%, 10% and 28%, respectively, in the year 2013/2014. The region of elevated erosion can primarily be attributed to the change from low medium erosion to medium erosion, medium erosion to high medium erosion and high medium erosion to high erosion. The low medium erosion area decreased from 24% to 10%; this 14% transferred to medium erosion and high medium erosion.
From 2013/2014 to 2018/2019, the soil erosion area of the watershed with initially no change decreased to 10%. The areas of very low, low and low medium erosion classes increased, with amplitude reductions of 17%, 17% and 16%, respectively. The areas of medium, high medium, high, very high and extremely high erosion decreased, with amplitudes of 6%, 24%, 13%, 6% and 1%, respectively. The region with decreased erosion was primarily because 10%, 10% and 6% area under medium erosion class was classified as very low, low and low medium erosion classes, respectively. Additionally, 6%, 12%, and 11% transferred from high medium to low, low medium and medium erosion classes, respectively. It is noted that the erosion had decreased significantly in a short time.
From 2009/2010 to 2018/2019, the soil erosion area of the watershed with no alterations increased to 30%. Very low, low and low medium classes showed increasing trends during this time period, in contrast to a decrease in the change rate of high classes. This was due to vegetation regeneration after fires. The area with a decreased rate of change was largely caused by the transition from low medium to low erosion, medium to low medium and high medium to medium erosion classes. Approximately 8% and 14% and 8% of areas transferred from low medium erosion to low erosion, and medium erosion to low medium erosion and low erosion, respectively.

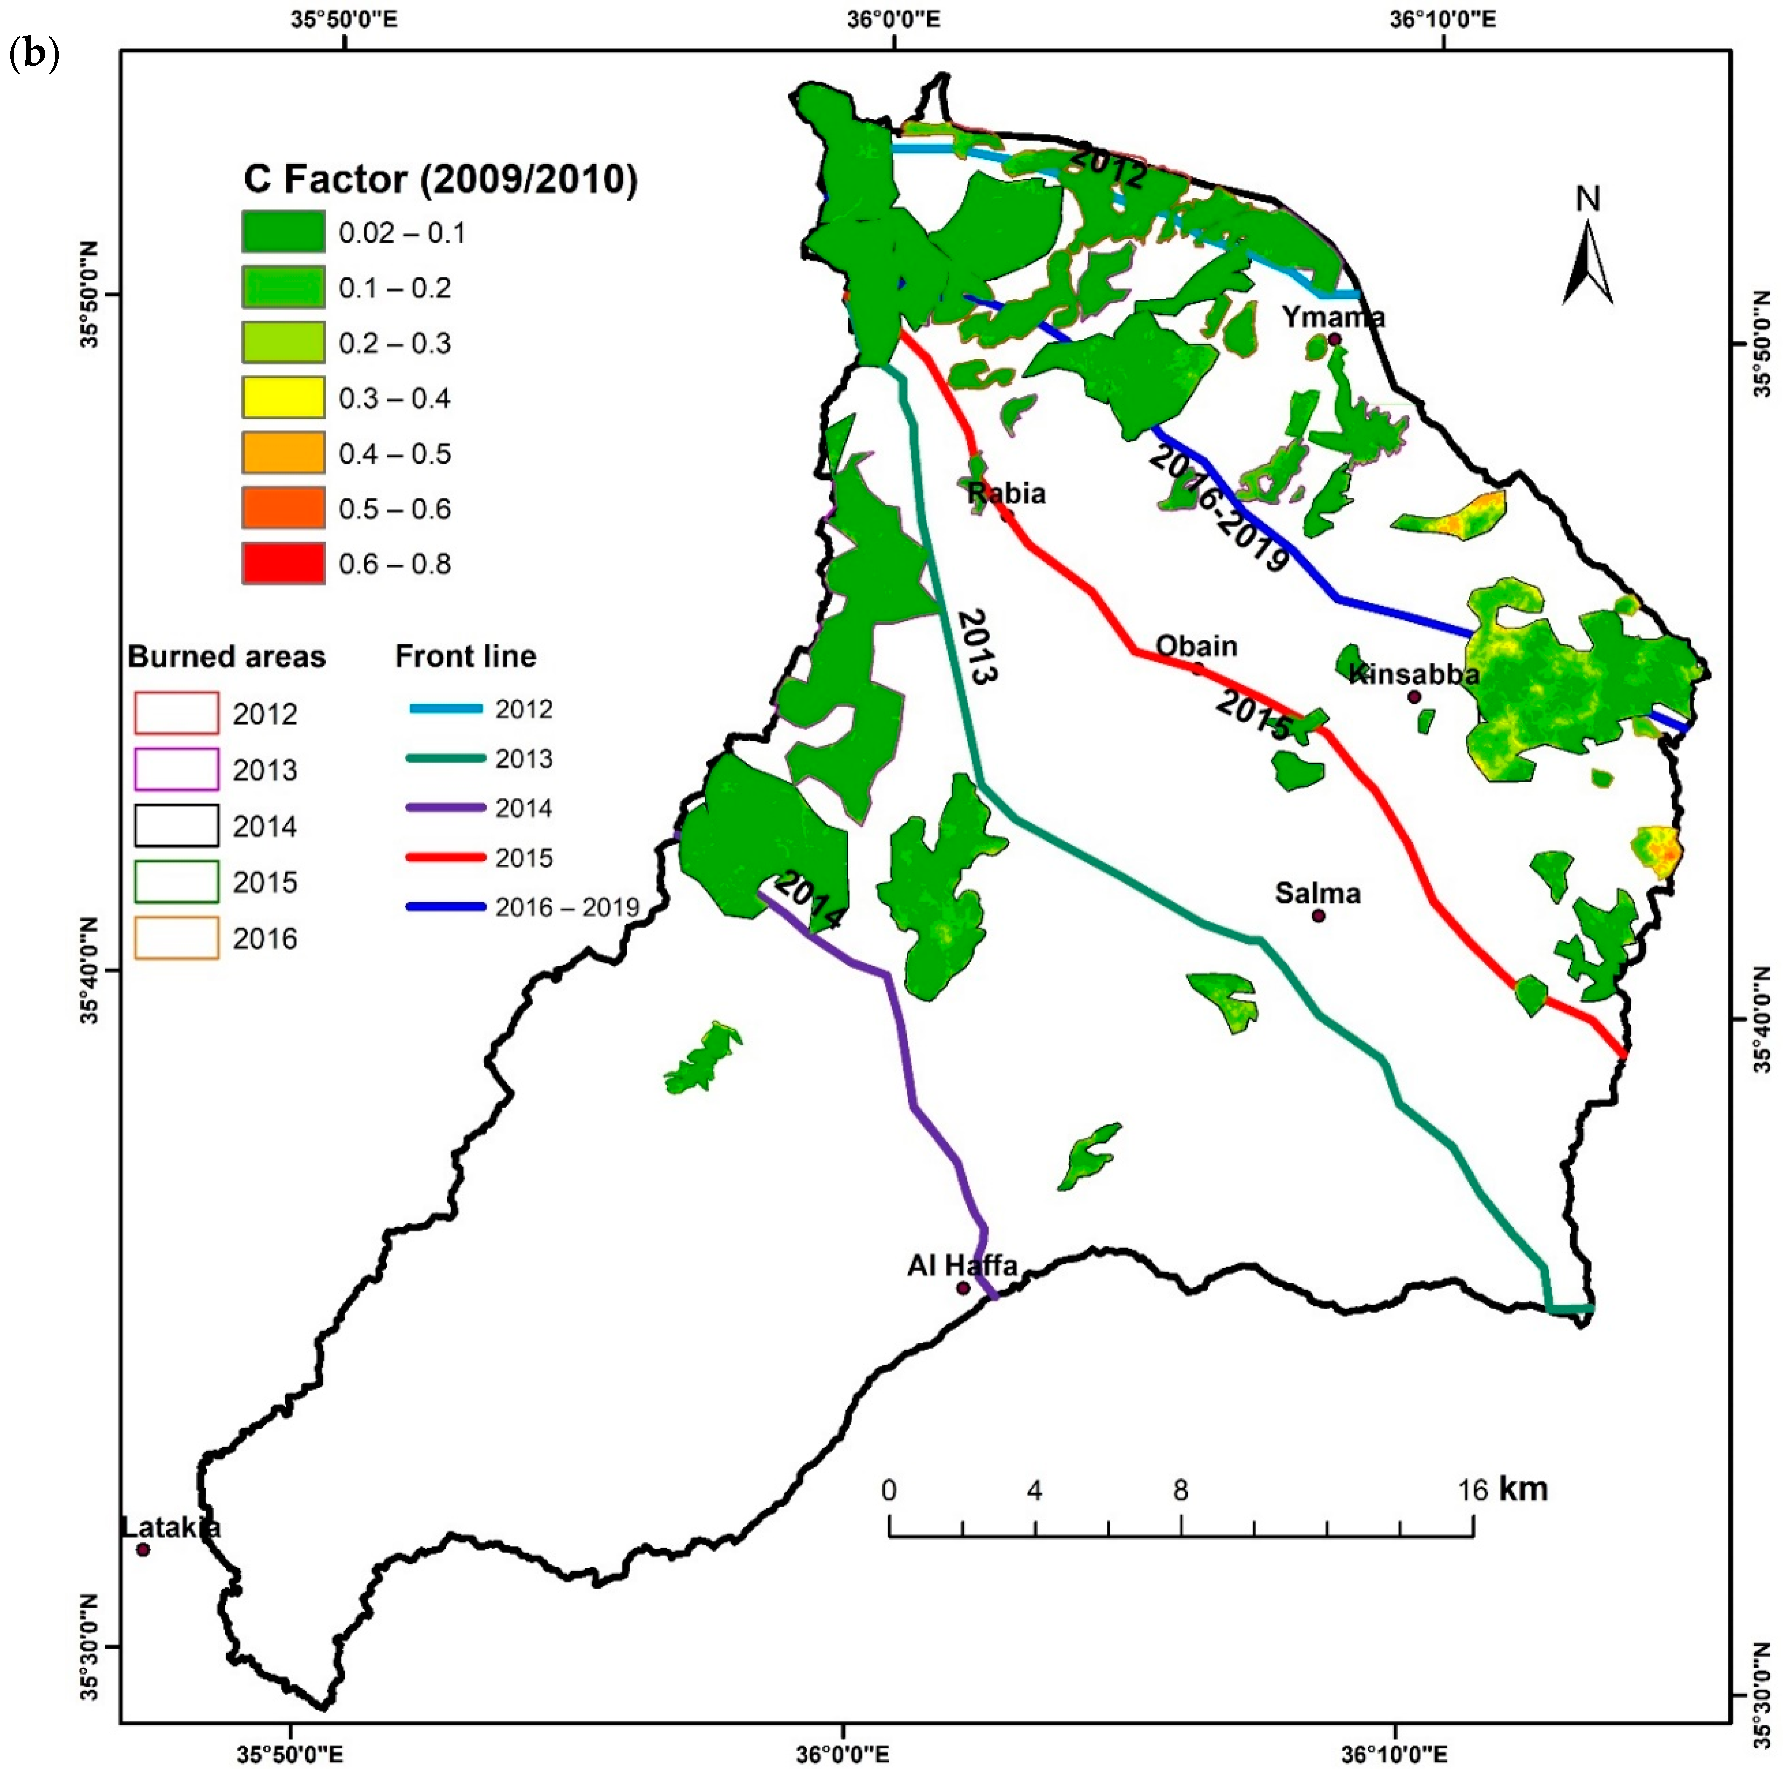
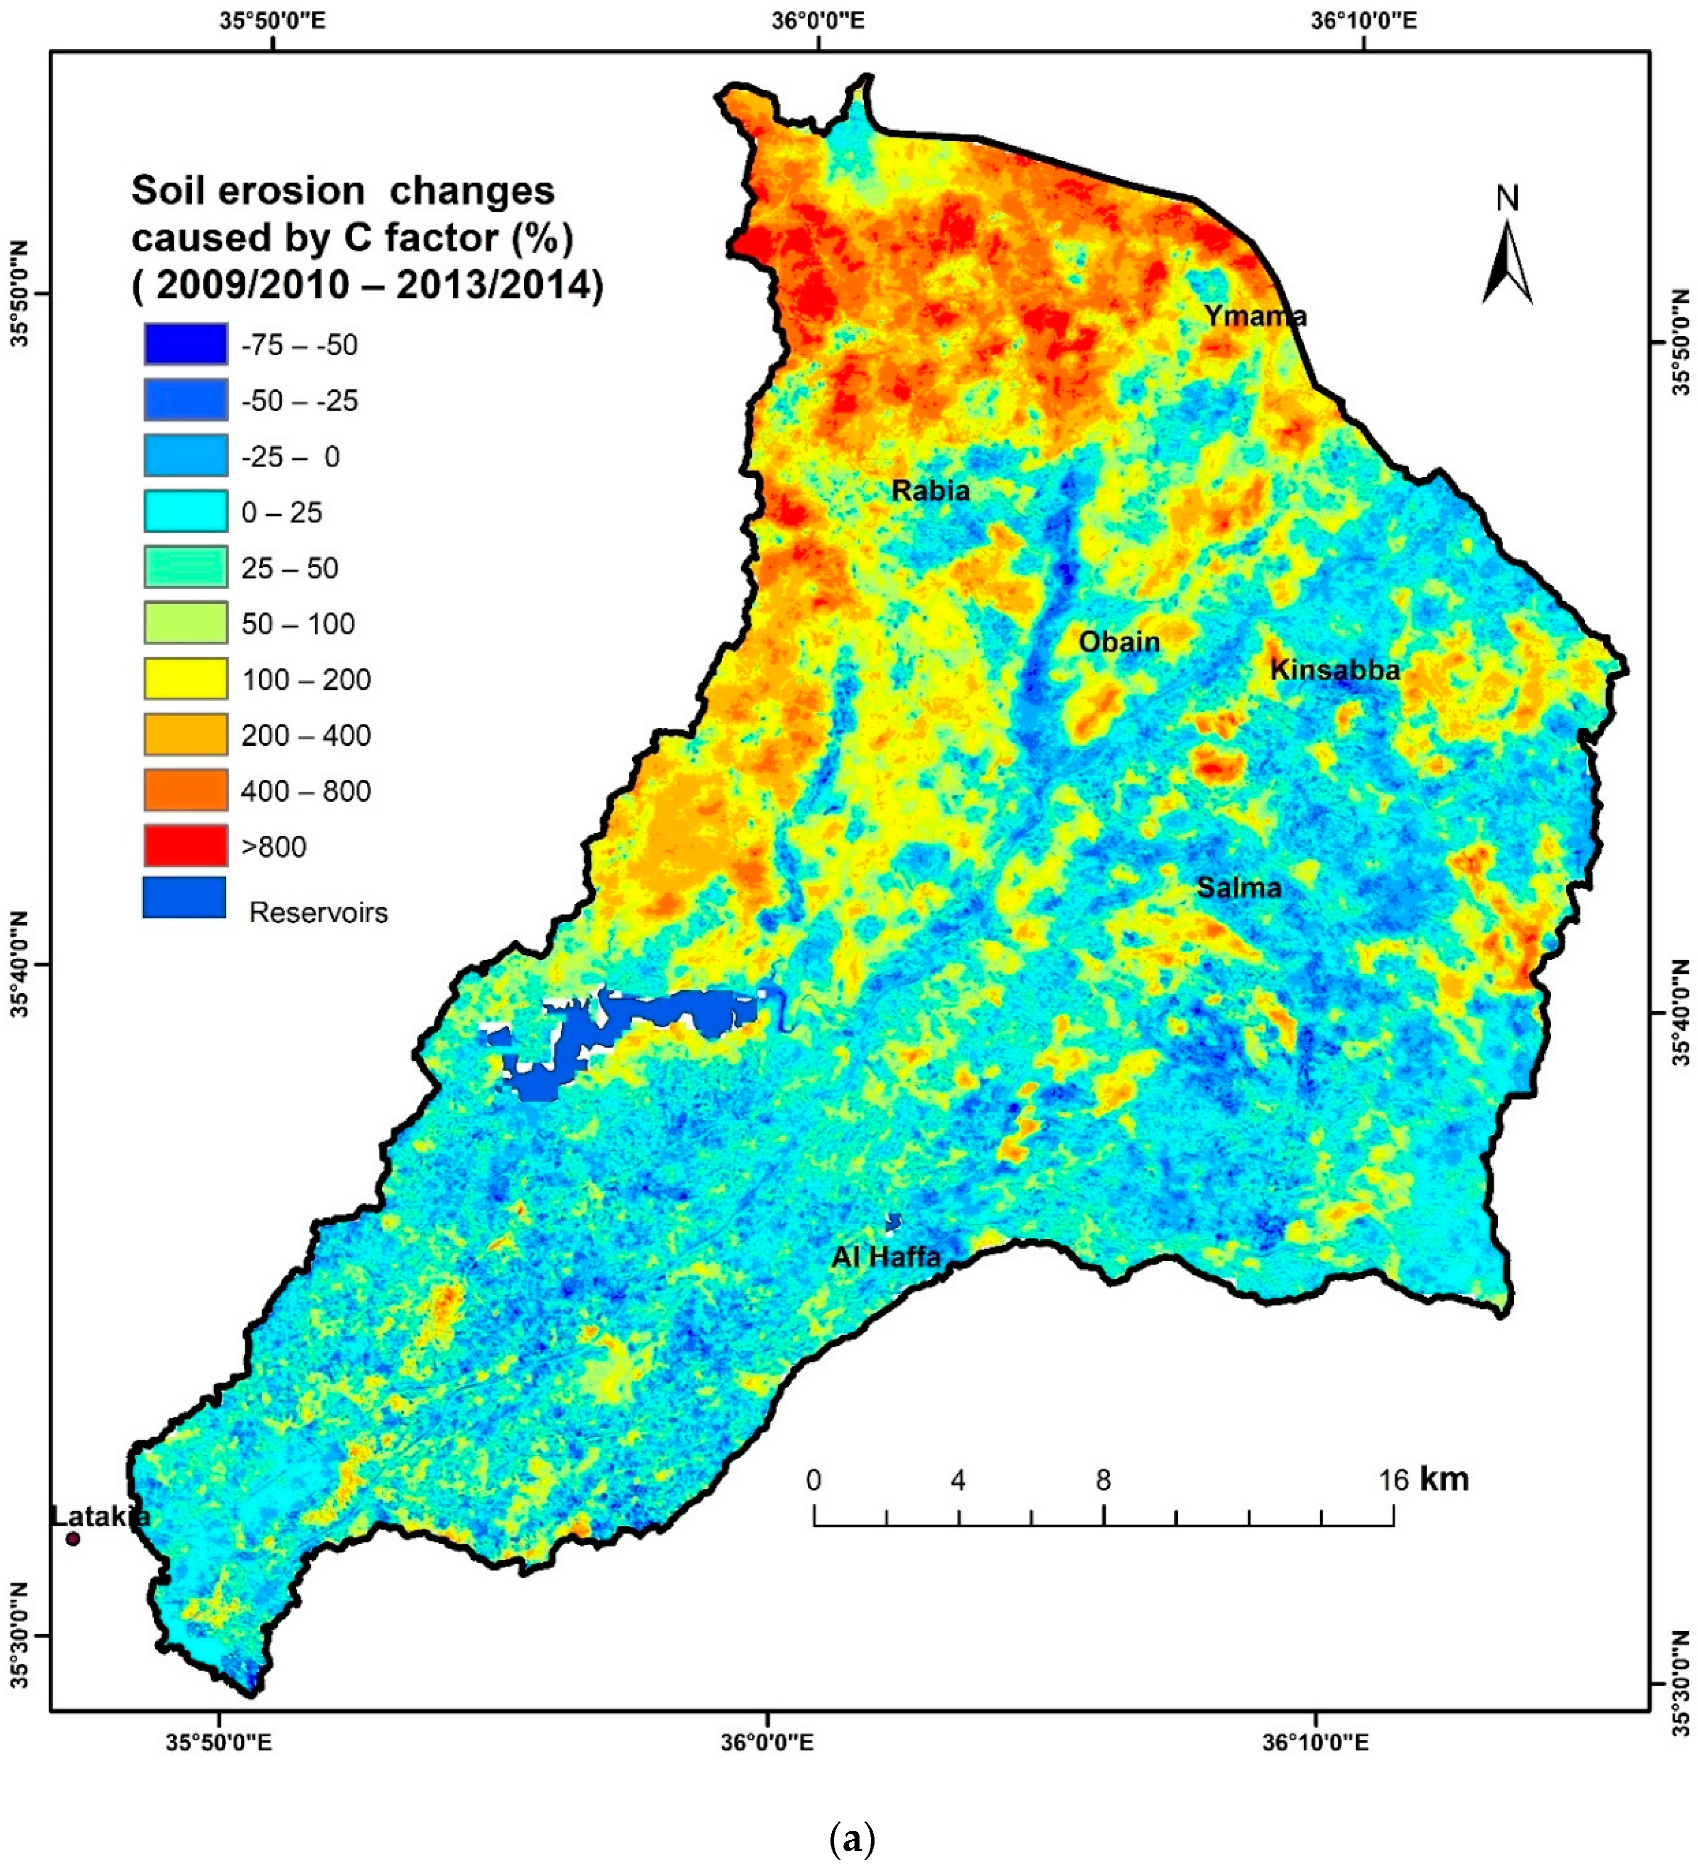
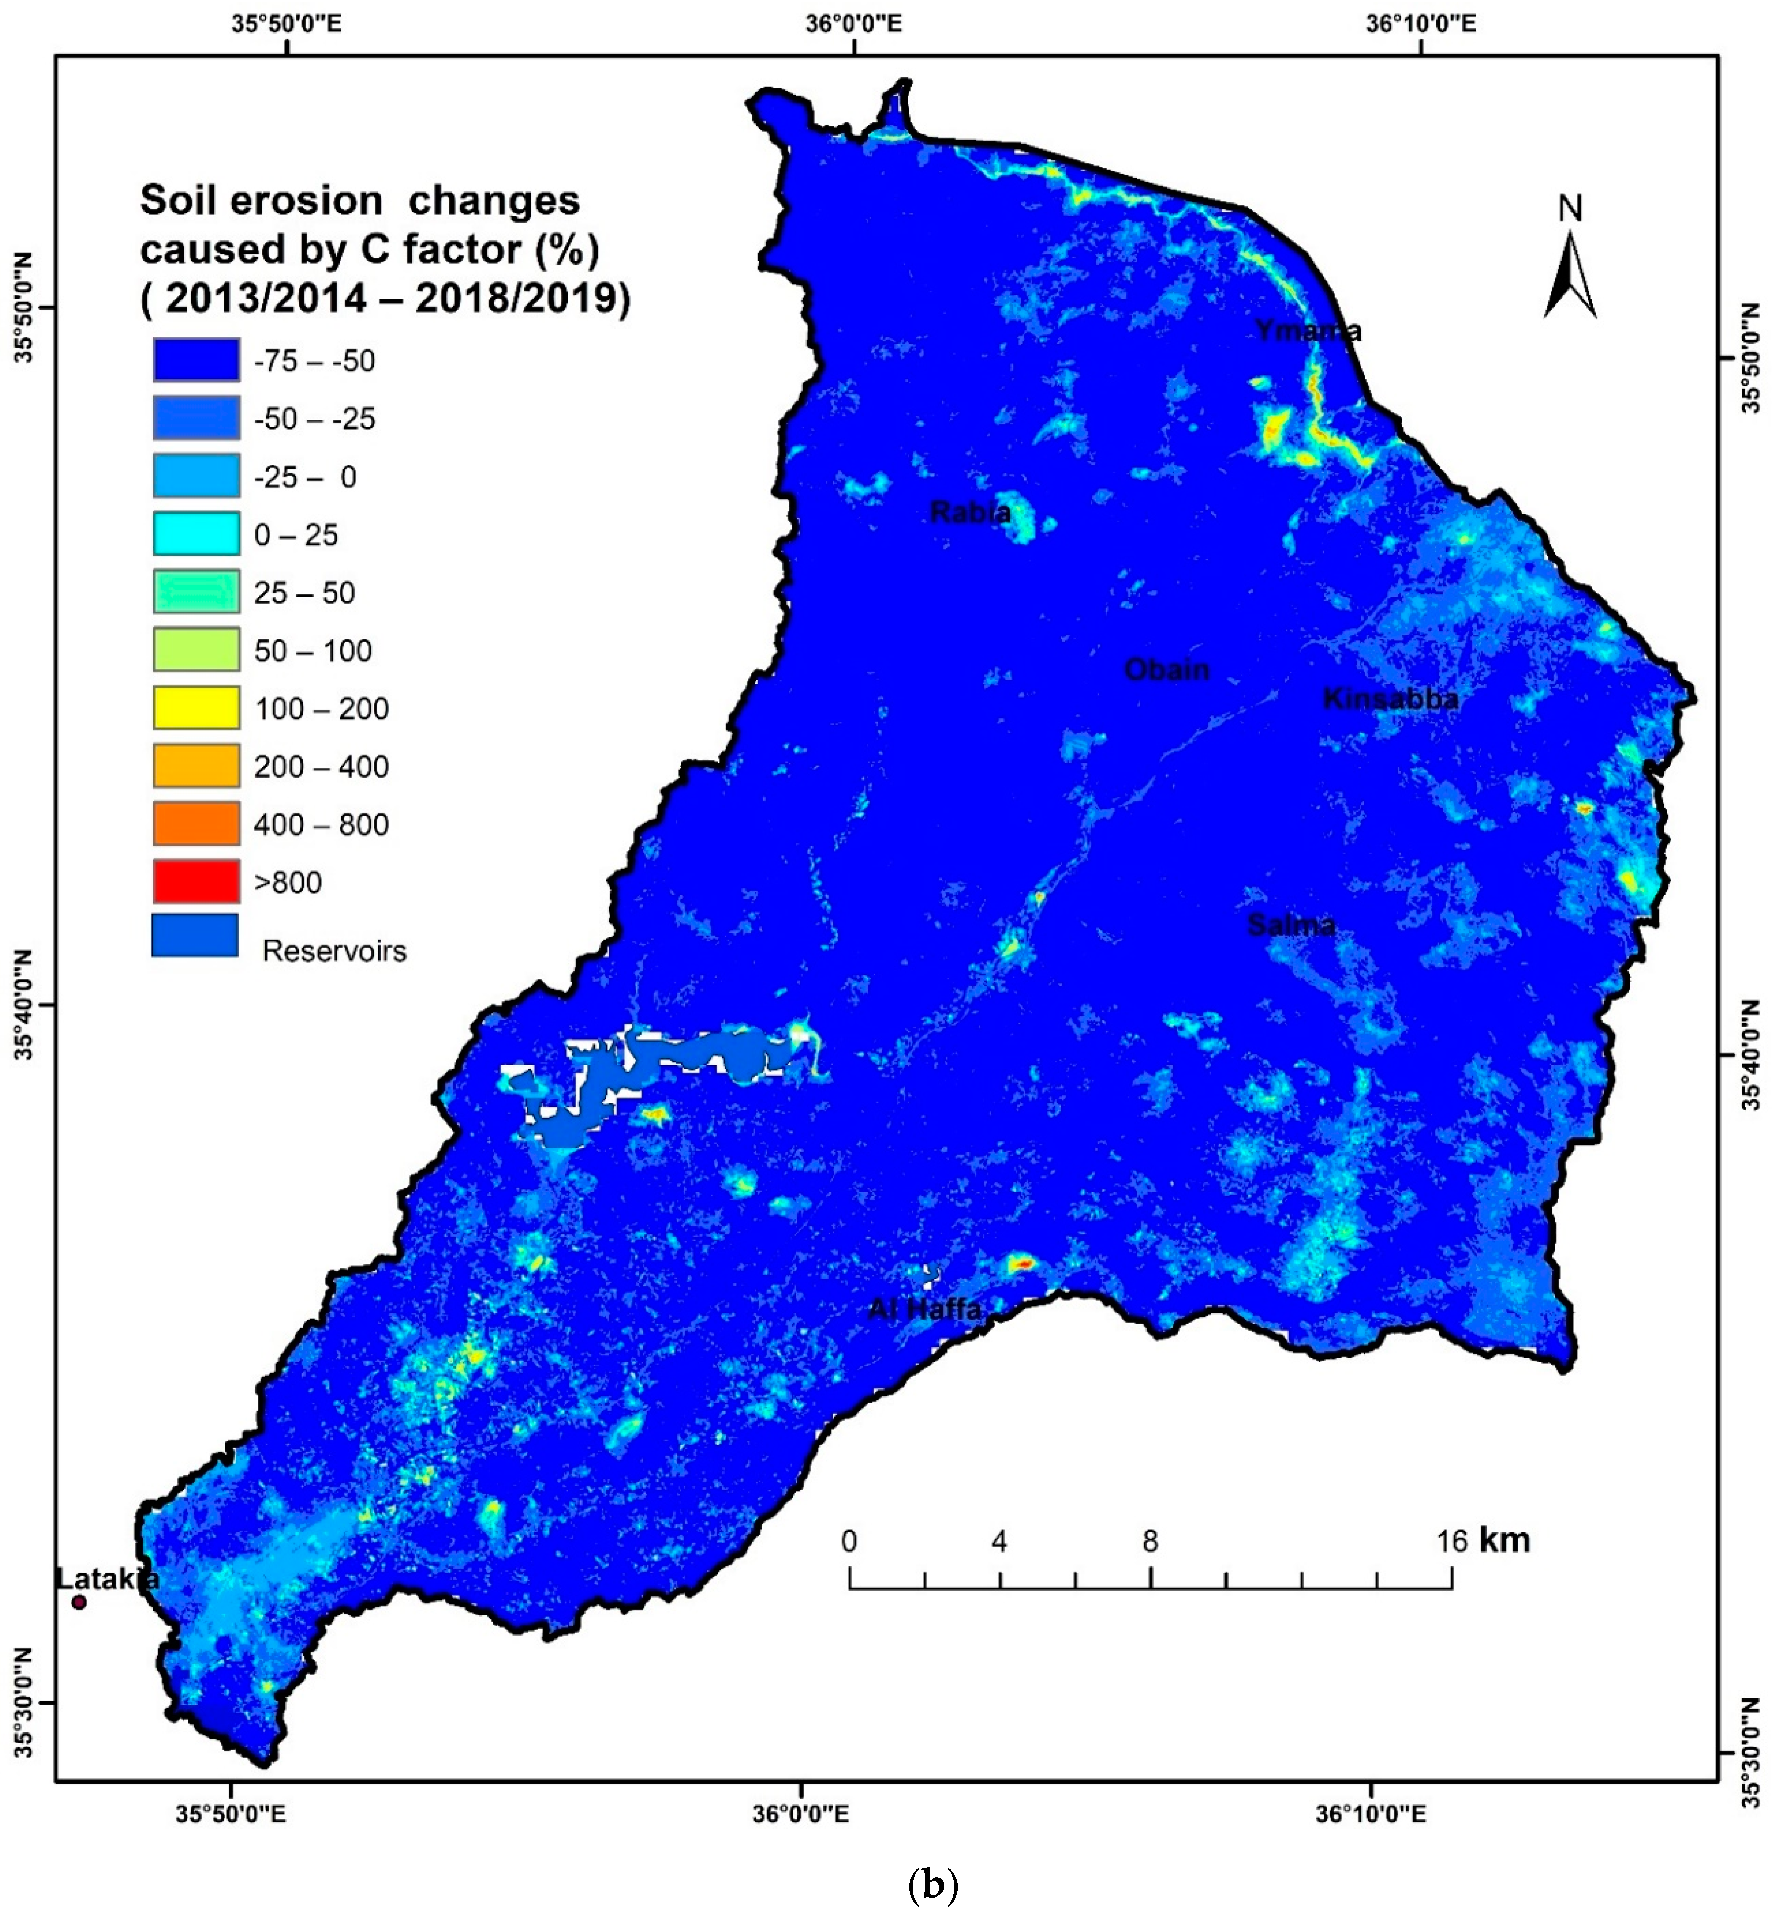
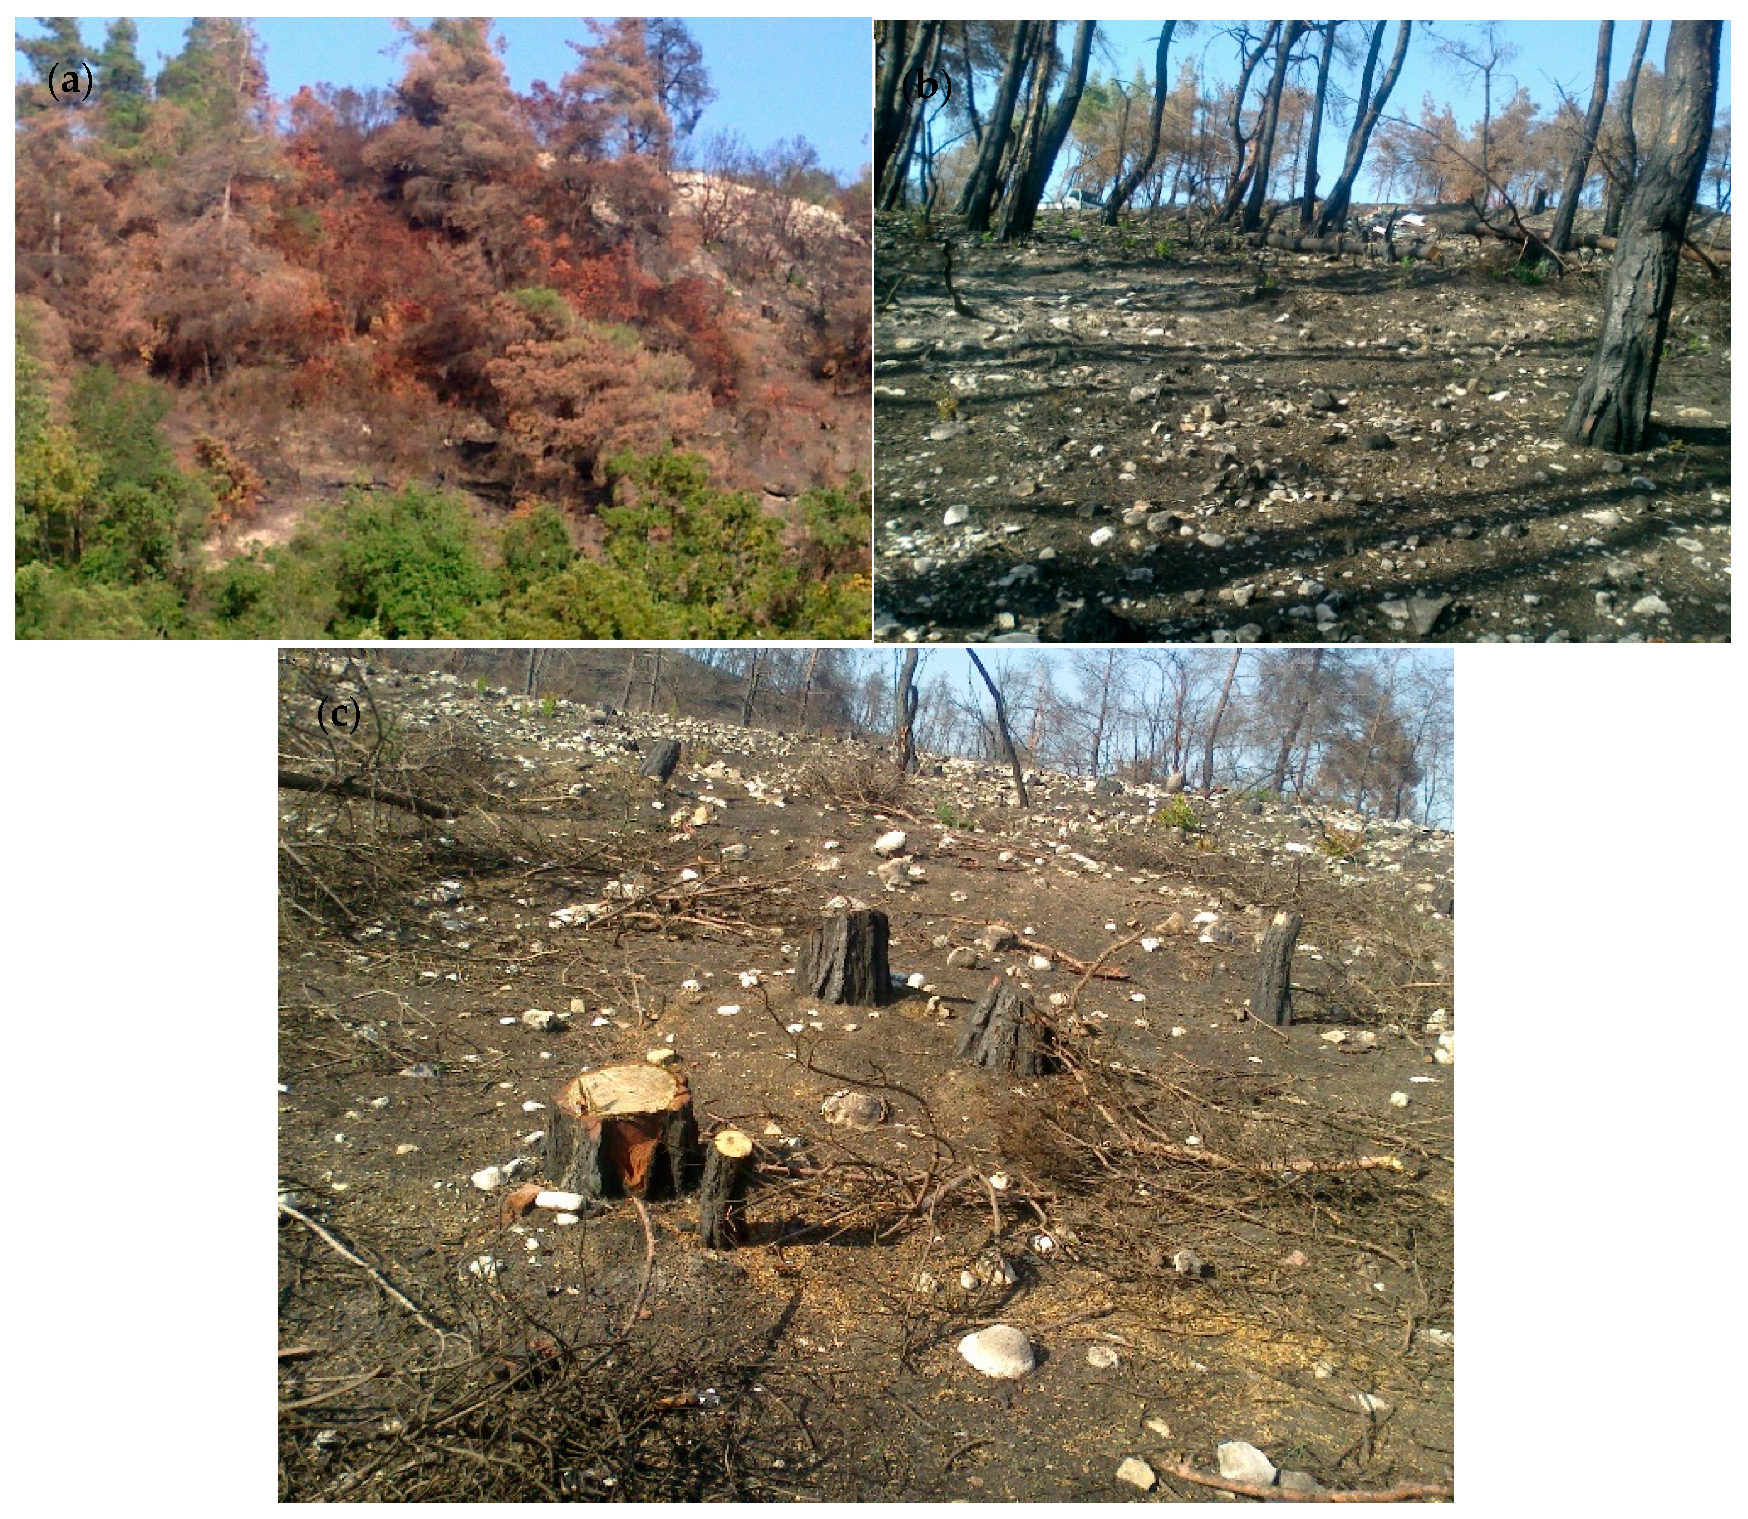
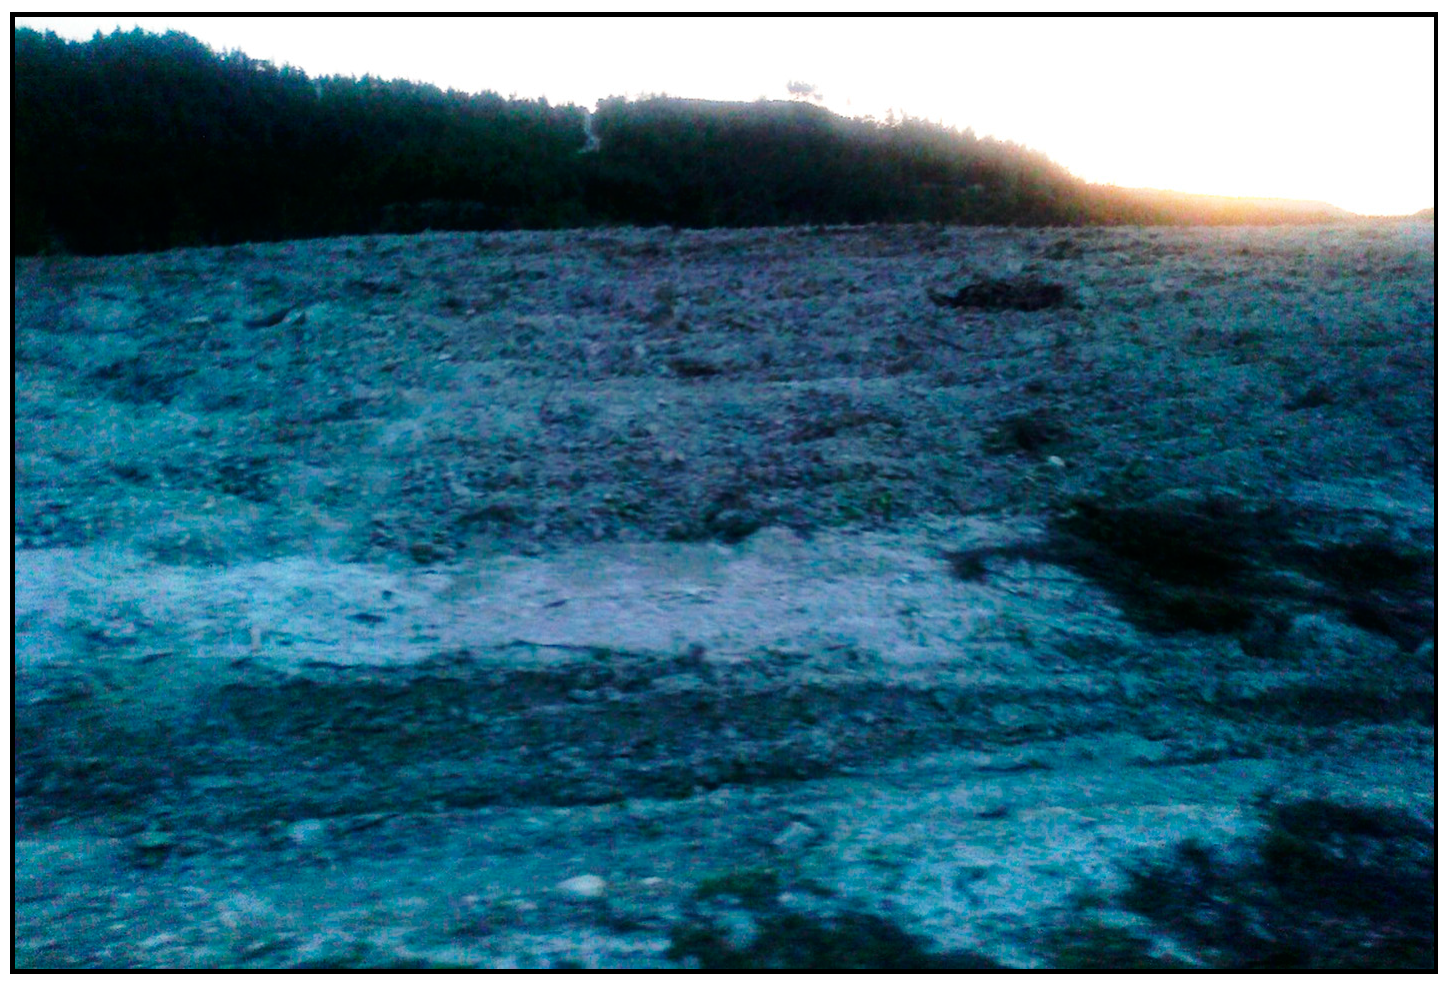
3.3. Impact of Vegetation for Soil Erosion Rates

Figure 5 illustrates spatial distribution of burned areas and front lines 2012–2019 and C factor in burned areas. Extremely high C factors were obtained in areas covered by coniferous forests, which were severely affected by the fire in 2013 and 2014 in southeast basin. These areas are located near the front line in 2014, while the other parts are located in the southeast basin with considerable distance. The main cause is exposed to artillery and missiles. In these areas, the average pre-fire C factor was estimated to be around 0.02–0.1, whereas after the fire this value was estimated at an extremely high value of 0.4–0.6. The cessation of fighting after 2016 contributed positively to the vegetation recovery in most parts of the region. Moreover, the C factor is a parameter critical for burned areas because the density of vegetation cover, which plays a role as a productive agent against soil erosion, is highly significant for the occurrence of wildfires, especially in forested areas.
Figure 6 shows the impact of factor (C) of the vegetation cover on soil erosion rates in different periods. It displays the 2009/2010 to 2013/2014 time period. Due to the change in vegetation coverage factors, the rate of soil erosion increased in most areas of the basin. The areas with the main increase of soil erosion rates are located in the central and eastern parts of the basin. Coniferous forests as well as transitional forests and scrublands are the dominant forms of land cover, for which the average post-fire soil loss values (by reason of C factor) are 200% to 800% higher than in pre-fire conditions.
The decline in vegetation due to forest fires in 2012, 2013 and 2014 were overall due to the civil war, during which hundreds of shells and bombs were fired in this area (Figure 5 and Figure 6). In addition, forest logging operations took place after these fires because of the high prices of oil derivatives, especially in the upper part of the basin near the border area between Syria and Turkey. In comparison, the areas with reduced soil erosion are located in small patches in the western and southwestern regions, where slow slopes and fruit trees dominate.
From 2013/2014 to 2018/2019, the C factor caused a decrease in the average soil erosion rate by 50–100% in most parts of the basin. This period was characterized by a humid climate, in addition to a ceasefire agreed upon after 2016, which enabled the growth and renewal of vegetation cover. The western portion, close to the river mouth, showed no significant change between the two years and is characterized by low precipitation, low slope and low fruit tree coverage.
By comparing 2009/2010 (before war) with 2018/2019 (at the end of the war stage), it can be concluded that the change in C factors slowed down the deterioration trend of soil erosion and reduced the average soil erosion rate in more than half of the basin by about 10–75%.
This area is located relatively far away from the centers of armed conflicts. In contrast, the areas with increased soil erosion by about 60–400% are situated in the northeast and east, with shorter distances to armed conflict centers. These findings can be explained by forest fires, after which the burned forests were turned into agricultural land or refugee camps and road areas.

4. Discussion

Processes of soil erosion and surface degradation have various impacts on the worldwide land use as well as on land condition. As a result, an increasing number of scientists and policy-makers need to deal effectively with soil erosion issues and recognize how to mitigate their impact [2]. The most commonly used soil erosion model, RUSLE, was adopted in the present study. In the most recent 10 years of this study, the average soil erosion of the Northern Al-Kabeer river basin was characterized as mild (1–10 t ha−1 year−1), which accounted for more than 66% of the total area. This basin is subject to a mean soil erosion rate of 3.6 t ha−1 year−1. Furthermore, only 10% of the area has a tolerable soil loss rate, based on the 1 t ha−1 year−1 soil tolerance limit for Mediterranean highlands. Many authors consider that the limit of 1 t ha−1 year−1 has been set as the acceptable soil loss tolerances for environmental protection in the Mediterranean area, when considering the balance between soil formation and erosion [61,64,65,66]. Mediterranean soils have a low degree of tolerance for soil loss, which is much lower than soils of the temperate humid zone [64,65].
Overall, the average soil loss rate determined by RUSLE over the entire study region (3.6 t ha−1 year−1) before the war, approaches the under-average soil erosion rate recorded in other studies for Mediterranean mountain forest areas. In northern Jordan, Alkharabsheh et al. (2013) and Farhan et al. projected an average soil loss rate of 9 t ha−1 year−1 [37] and 10 t ha−1 year−1 [38], respectively, whereas Karamesouti et al. (2016) reported an average soil loss rate of 16.9 t ha−1 year−1 in Athens using the RUSLE model [2]. The average soil loss rate was 7.9 t ha−1 year−1 during the Syrian civil war. During the period 2013–2014, several fires occurred due to indiscriminate shelling of the area (Figure 7a,b). The method of cutting trees after forest fires (Figure 7c) began to be used for heating and cooking in light of the rising oil prices. A large number of residents cultivated the burned forest land (Figure 8) and planted it with olive trees with the aim to acquire property later. The soil erosion rate decreased to 2.2 t ha−1 year−1 in 2018/2019, after the ceasefire agreement in 2016 and the transformation of the watershed into a semi-protected area. These changes allowed the vegetation cover to regenerate. The regeneration of vegetation in many watershed places has improved the vegetation cover, as shown in the C Factor map of the current investigation. Mousa et al. (2011) also found an adequate regeneration of most plant species that were in the protected area of west Syria before the fire. This regeneration was either by seed or vegetative propagation, which took place two years after the forest fire. For instance, Pinus brutia Ten., Quercus cerris L. subsp. pseudocerris (Boiss.) Chalabi, Quercus infectoria Oliv., Phillyrea media L., Pistacia palaestina (Boiss)., Rhus cotinus L. and Laurus nobilis L. forests/trees were regenerated after the occurrence of the forest fires [67]. Indeed, the majority of fires occurred in 2012, and we found that most plant species were regenerated, especially in areas that were exposed to light fires. This regeneration greatly reduced erosion compared to 2014. This indicates that the forest is able to regenerate within a short period of time if adequate protection from grazing and logging are put in place, resulting in reduced soil erosion. During the field tour, we found that that the Pistacia palaestina (Boiss) (Figure 9) and Pistacia atlantica regenerated by vegetative propagation three weeks after the fire. In addition, the vegetation cover and soil properties disturbances, such as the aggregate stability and water repellency, are closely linked to the intensity of the fires.
Most of the basin experienced a significant increase in soil erosion rates during the period of 2013/2014 compared to 2009/2010, with the exception of some fruit tree areas in the direction towards the mouth of the river. This area is not far from the battlefront and where farmers temporarily leave their farming operations and property for security purposes [68]. There was an enhancement in the vegetation cover, owing to the lack of soil tilling, growth of weeds and lack of pruning of fruit trees, as reflected in the NDVI images of the present investigation.
Although soil erosion decreased in almost the entire study area in 2018/2019, soil erosion remained high along the Syrian-Turkish border due to forest fires, the establishment of displacement camps, the construction of roads and the conversion of burned forests into farmland. Many studies (e.g., [69,70,71]) agreed that a key function for the government is to ensure ownership rights for soil users: lack of secure land tenure is a major impediment to taking erosion-control steps. For many soil conservation initiatives, the need for secure land tenure is particularly significant, as many do not have discernible short-term benefits. Stocking (2003) [71] noted that the greatest harm to the soil occurs where tenure, for example with migrants and refugees, is most unpredictable. Local knowledge is low in such conditions and soil mining is important for survival, at least in the short term.
During 2018/2019, vegetation cover increased by approximately 20–50% in the forest area that burned in 2012 (Figure 5), which led to a decline in soil erosion by about 10–75% (Figure 4). Gyssels et al. (2005) found sheet and rill erosion to be reduced by 75% in coverings of around 30 to 35%, and 90% in coverings of around 60% [34]. The rate of soil erosion decreased with an increase in vegetation cover and root biomass, whereas the soil erosion rate decreased with a rise in vegetation cover and root biomass. The rate of soil erosion further decreased due to forest cover, roots and litter components resulting in soil surface defense against raindrop effect, a decrease in flow velocity caused by roughness and improved infiltration capability [2,10,34,72].
These results reflect the observations made during the field investigation. Areas with extremely severe erosion (i.e., more than 10 t ha−1 year−1) experienced severe erosion in the field, as demonstrated by many gullies and low vegetation cover. The soil loss increased with a rise in slope in burned forests (Figure 10), which has also been recorded [23] for eight different slopes. This indicates that the cumulative soil loss after rainfall increases with the slope gradient due to precipitation intensities and is more pronounced due to higher slopes. Such areas have very steep slopes, showing the importance of using the slope percentage when examining soil erosion. This is consistent with the relationship between erosion and the square of the slope [73]. The variations in the erosion chart (Figure 4) are obviously seen to be identical to those of the LS (Figure 2b) and C factor maps (Figure 3e,f). The areas were presented in the upper part of the basin. In terms of the spatial patterns in China, Hui et al. (2010) also found that the LS and C measurements are highly correlated with those of erosion [73].
Although the forest loss has decreased in the last three years in most of the study area, it is possible that the forest area will recede again. This recurrence may be due to either renewed battles or an influx of people coming back to the forested areas after the conflict, resulting in unplanned development and settlement. Grime (2019) found that at the end of the armed conflicts in Sri Lanka, Nepal, Peru and the Ivory Coast, on average, there was a 68.08% increase of annual forest loss in the five years following the end of the conflicts. This average is based on analyses of forest-cover data gathered with remote-sensing methods, as compared to the worldwide 7.20% mean [40].
It is imperative, in the reconstruction phase, that environmental systems be given great importance in order to achieve sustainable development. This will require continued research to determine interdisciplinary dialogue of soil erosion science, as well as development and innovation. This could be a political will to create mechanisms that would aid the process of regeneration of war-torn areas, by encouraging the delivery of environmental services. This in turn will minimize the possibility that the region could become the target of potential socio-economic conflicts.

5. Conclusions

This study aimed to determine the impact of land cover change on soil erosion and its spatio-temporal variability in the Northern Al-Kabeer watershed over the past 10 years, using the RUSLE model and GIS. The impact of war on nature in the period of 2012–2014 was significantly negative, mainly as a result of forest fires, which led to a more than 10-fold increase of erosion in steep areas. It is observed that soil erosion increases as we move away from the center of the conflict towards the east and north-east as this region has been exposed to fires, and part of it has been turned into agricultural lands or refugee camps and roads near the Syrian-Turkish border. On the other hand, erosion decreases as we move away from the center of armed conflict towards the west, with this region being covered mostly with fruit trees in addition to some shrubs and forests that were abandoned because of the vicinity to the center of the armed conflict.
After the cease-fire decision in 2016, nature and wildlife benefited from the armed conflict in regions where human pressure decreased in contested areas and the area turned into a semi-nature reserve contaminated with landmines. Despite this improvement, battles may resume again and negatively affect the rest of the forests. Additionally, human interventions in forests usually increase with the end of the war, as happened in Sri Lanka and Colombia, owing to the return of the residents to their homes and their desire to improve their standard of living through the conversion of forests to agricultural lands or tourist facilities. It is apparent from the findings that, even though some inconsistencies and inaccuracies are present, the RUSLE model can be implemented effectively at the watershed scale with limited data requirements. The results of this study make a significant contribution to enhancing our understanding of the effect of forest fires and land cover change on soil erosion, and support the applicability of these models to forecast pre- and post-fire soil erosion rates. However, further research is required to quantitatively expose soil erosion and its influencing factors, and to validate the RUSLE model’s success in the field. Analyzed soil loss dynamics can encourage decision-makers and planners to take appropriate forest and soil conservation priority actions, thereby reducing Syria’s land loss and land degradation issues as a consequence of high annual fire rates and armed conflicts.

Funding

The article processing charge was funded by the Deanship of Scientific Research, Qassim University.

Acknowledgments

The author would like to thank the Deanship of Scientific Research, Qassim University for funding the publication of this project. I would like to express my sincere gratitude to Dr. Ibrahim Elton from Qassim University for his suggestions and comments. Additionally, the author is grateful to the editors and anonymous reviewers for their constructive comments and suggestions, which have considerably improved the quality of this manuscript.

Conflicts of Interest

The author declares no conflict of interest.

Appendix A. Description of RUSLE Model

  • Rainfall erosivity factor
Arnoldus (1977) proposed a modified version of the Fournier Index (F) to avoid pitfalls related to the monthly distribution of erosive precipitation over the year. Arnoldus used the F established in erosion-risk areas in North Africa and the Middle East for regions in the USA and Africa [56]. F is the summation of squares of monthly rain fall to its annual rainfall. F is calculated as:
F = i = 1 12 P i 2 P
where pi is the month’s average rainfall (mm) with the maximum rainfall and P is the mean annual rainfall (mm).
Arnoldus (1977) computed the equation as R = 0.264 × F 1.5 , which was used to develop an iso-erodent map for Morocco [74]. Similarly, the regression equations with R and F were obtained by Renard and Freimund (1994) [75] as:
R = 0.07397 × F 1.847
  • Soil Erodibility Factor (K)
The Equation (A3) was used to estimate the erodibility of soil, as suggested by [59]:
K = f c s a n d × f c l s i × f o r g c × f h i s a n d
where f c s a n d is a low soil erodibility factor for soil with coarse sand and a high amount of soil with a low sand content (Equation (A4)), f c l s i is a factor that provides low soil erodibility with high clay to silt ratios (Equation (A5)), f o r g c is a factor that decreases soil erodibility for soil with a high organic carbon content (Equation (A6)) and f h i s a n d is a factor that decreases soil erosion with an exceptionally high sand content (Equation (A7)).
f c s a n d = 0.2 + 0.3 × e x p [ 0.256 × m s × ( 1 m s i l t 100 ) ]
f c l s i = ( m s i l t m c + m s i l t ) 0.3
f o r g c = 1 0.0256 × o r g C o r g C + exp [ 3.72 ( 2.95 × o r g C ) ]
f h i s a n d = 1 0.7 × ( 1 m s 100 ) ( 1 m s 100 ) + exp [ 5.51 + 22.9 × ( 1 m s 100 ) ]
where, m s , m s i l t and m c are the percentage of sand, silt and clay, respectively, and o r g C is the organic carbon content of the layer (%).
  • Slope Length and Steepness Factors (LS)
The slope length factor (L) is provided by the Desmet and Govers (1996) [60], and is enhanced by the USLE estimation technique (Equation (A8)):
L i , j ( A i , j i n + D 2 ) m + 1 A i , j i n m + 1 D m + 2 × x i , j m x i , j × 22.13 m
where L i , j is slope length factor for the grid cell with coordinates (i.j); A i , j i n is the flow accumulation or contributing area at the inlet of a grid cell with coordinates measured in m 2 ; D is grid cell size (meters); x i , j is s i n a i , j + c o s a i , j ; a i , j is the aspect direction of the grid cell with coordinates; m is a function of the ratio β of the rill to inter-rill erosion. The m varies from 0 to 1 and reaches 0, while the ratio of rill to inter-rill erosion is similar to 0. The exponent m of the following equation was implemented according to the algorithm proposed by McCool et al. (1989) [76] (Equation (A9)):
m = β 1 + β
The β value is derived by the Equation (A10):
β = ( s i n θ 0.0896 ) / [ 3 ( s i n θ ) 0.8 + 0.56 ]
here, θ is the slope angle.
The estimation of the S-factor originally proposed by Wischmeier and Smith (1978) was proposed by McCool et al. (1987) in the RUSLE model to achieve an improved representation of the slope steepness factor, taking into account the ratio of rill and inter-rill erosion. McCool et al. (1987) found that soil erosion occurred more rapidly on slopes with a steepness of more than 9%. Therefore, he used one algorithm for slopes < 9% and another for slopes > 9% (Equations (A11) and (A12)):
S = 10.8 ×   S I N θ 0.03   where   slope   gradient   <   9 %
S = 16.8 ×   S I N θ 0.5   where   slope   gradient     9 %

References

  1. Diodato, N.; Bellocchi, G. MedREM, a rainfall erosivity model for the Mediterranean region. J. Hydrol. 2010, 387, 119–127. [Google Scholar] [CrossRef]
  2. Karamesouti, M.; Petropoulos, G.P.; Papanikolaou, I.D.; Kairis, O.; Kosmas, K. Erosion rate predictions from PESERA and RUSLE at a Mediterranean site before and after a wildfire: Comparison & implications. Geoderma 2016, 261, 44–58. [Google Scholar]
  3. Diodato, N. Estimating RUSLE’s rainfall factor in the part of Italy with a Mediterranean rainfall regime. Hydrol. Earth Syst. Sci. 2004, 8, 103–107. [Google Scholar] [CrossRef] [Green Version]
  4. Albergel, J.; Collinet, J.; Zante, P.; Hamrouni, H. Role of Mediterranean forest in soil and water conservation. In Water for Forests and People in the Mediterranean Region: A Challenging Balance. What Science Can Tell Us; European Forest Institute: Joensuu, Finland, 2011. [Google Scholar]
  5. Abdelwahab, O.M.M.; Ricci, G.F.; De Girolamo, A.M.; Gentile, F. Modelling soil erosion in a Mediterranean watershed: Comparison between SWAT and AnnAGNPS models. Environ. Res. 2018, 166, 363–376. [Google Scholar] [CrossRef] [PubMed]
  6. Polykretis, C.; Alexakis, D.D.; Grillakis, M.G.; Manoudakis, S. Assessment of Intra-Annual and Inter-Annual Variabilities of Soil Erosion in Crete Island (Greece) by Incorporating the Dynamic “Nature” of R and C-Factors in RUSLE Modeling. Remote Sens. 2020, 12, 2439. [Google Scholar] [CrossRef]
  7. Hategekimana, Y.; Allam, M.; Meng, Q.; Nie, Y.; Mohamed, E. Quantification of soil losses along the coastal protected areas in Kenya. Land 2020, 9, 137. [Google Scholar] [CrossRef]
  8. Woldemariam, G.; Iguala, A.; Tekalign, S.; Reddy, R. Spatial Modeling of Soil Erosion Risk and Its Implication for Conservation Planning: The Case of the Gobele Watershed, East Hararghe Zone, Ethiopia. Land 2018, 7, 25. [Google Scholar] [CrossRef] [Green Version]
  9. Eisenberg, J.; Muvundja, F.A. Quantification of Erosion in Selected Catchment Areas of the Ruzizi River (DRC) Using the (R)USLE Model. Land 2020, 9, 125. [Google Scholar] [CrossRef] [Green Version]
  10. Food and Agricultural Organization (FAO). Soil Erosion; FAO: Rome, Italy, 2019. [Google Scholar]
  11. Food and Agricultural Organization (FAO). Forests and Climate Change in the Near East Region; Forests and Climate Change Working Papers 9; FAO: Rome, Italy, 2010. [Google Scholar]
  12. Habib, L.; Ibrahim, W. STATUS OF SOIL RESOURCE IN SYRIA. In Proceedings of the Assessment of Existing Soil Information System, Damascus, 2007, Tunis, Tunisia, 26–31 May 2007. [Google Scholar]
  13. Mohammed, S.A.; Alkerdi, A.; Nagy, J.; Harsányi, E. Syrian crisis repercussions on the agricultural sector: Case study of wheat, cotton and olives. Reg. Sci. Policy Pract. 2020, 12, 519–537. [Google Scholar] [CrossRef] [Green Version]
  14. Selby, J.; Dahi, O.S.; Fröhlich, C.; Hulme, M. Climate change and the Syrian civil war revisited. Political Geogr. 2017, 60, 232–244. [Google Scholar] [CrossRef]
  15. Global Forest Watch Syria. Available online: https://www.globalforestwatch.org/dashboards/country/SYR/ (accessed on 7 June 2020).
  16. Nackoney, J.; Molinario, G.; Potapov, P.; Turubanova, S.; Hansen, M.C.; Furuichi, T. Impacts of civil conflict on primary forest habitat in northern Democratic Republic of the Congo, 1990–2010. Biol. Conserv. 2014, 170, 321–328. [Google Scholar] [CrossRef]
  17. Ordway, E.M. Political shifts and changing forests: Effects of armed conflict on forest conservation in Rwanda. Glob. Ecol. Conserv. 2015, 3, 448–460. [Google Scholar] [CrossRef] [Green Version]
  18. Machlis, G.E.; Hanson, T. Warfare Ecology. NATO Sci. Peace Secur. Ser. C Environ. Secur. 2011, 113, 33–40. [Google Scholar]
  19. Kim, K.C. Preserving biodiversity in Korea’s demilitarized zone. Science 1997, 278, 242–243. [Google Scholar] [CrossRef]
  20. Baumann, M.; Kuemmerle, T. The impacts of warfare and armed conflict on land systems. J. Land Use Sci. 2016, 11, 672–688. [Google Scholar] [CrossRef]
  21. Hecht, S.B.; Saatchi, S.S. Globalization and Forest Resurgence: Changes in Forest Cover in El Salvador. Bioscience 2007, 57, 663–672. [Google Scholar] [CrossRef] [Green Version]
  22. Al-Ali, Y.; Shater, Z.; Kheder, R. Studying the Effect of Forest Fire on Soil Erosion and Loss of Some Mineral Elements in the Forest of Ein Al-Jaouz/Tartous. Tishreen Univ. J. Res. Sci. Stud. Biol. Sci. Ser. 2014, 36, 277–290. [Google Scholar]
  23. Kabibo, I.A.-D.; Bou-Issa, A.; Ibrahim, J. Studying the Effect of Soil Erosion for Eight Different Systems with Different Slopes in the Coastal Area under Forests, Burned Forest and Planted Soil System. Tishreen Univ. J. Res. Sci. Stud. Biol. Sci. Ser. 2017, 1, 25–38. [Google Scholar]
  24. Mohammed, S.; Abdo, H.G.; Szabo, S.; Pham, Q.B.; Holb, I.J.; Linh, N.T.T.; Anh, D.T.; Alsafadi, K.; Mokhtar, A.; Kbibo, I.; et al. Estimating Human Impacts on Soil Erosion Considering Different Hillslope Inclinations and Land Uses in the Coastal Region of Syria. Water 2020, 12, 2786. [Google Scholar] [CrossRef]
  25. Mohammed, S.; Alsafadi, K.; Talukdar, S.; Kiwan, S.; Hennawi, S.; Alshihabi, O.; Sharaf, M.; Harsanyie, E. Estimation of soil erosion risk in southern part of Syria by using RUSLE integrating geo informatics approach. Remote Sens. Appl. Soc. Environ. 2020, 20, 100375. [Google Scholar] [CrossRef]
  26. Almohamad, H.; Knaack, A.L.; Habib, B.M. Assessing Spatial Equity and Accessibility of Public Green Spaces in Aleppo City, Syria. Forests 2018, 9, 706. [Google Scholar] [CrossRef] [Green Version]
  27. Almohamad, H.; Dittmann, A. Oil in Syria between Terrorism and Dictatorship. Soc. Sci. 2016, 5, 20. [Google Scholar] [CrossRef] [Green Version]
  28. Renard, B.K.G.; Foster, G.R.; Weesies, G.A.; Porter, J.I. Revised universal soil loss equation (Rusle). J. Soil Water Conserv. 1991, 46, 30–33. [Google Scholar]
  29. Marti, N.; Goci, M. Changes in Soil Erosion Intensity Caused by Land Use and Demographic Changes in the Jablanica River Basin, Serbia. Agriculture 2020, 10, 345. [Google Scholar]
  30. Licciardello, F.; Govers, G.; Cerdan, O.; Kirkby, M.J.; Vacca, A.; Kwaad, F.J.P.M. Evaluation of the PESERA model in two contrasting environments. Earth Surf. Process. Landf. 2009, 34, 629–640. [Google Scholar] [CrossRef]
  31. Kirkby, M.J.; Irvine, B.J.; Jones, R.J.A.; Govers, G.; Boer, M.; Cerdan, O.; Daroussin, J.; Gobin, A.; Grimm, M.; Le Bissonnais, Y.; et al. The PESERA coarse scale erosion model for Europe. I.—Model rationale and implementation. Eur. J. Soil Sci. 2008, 59, 1293–1306. [Google Scholar] [CrossRef]
  32. Baigorria, G.A.; Romero, C.C. Assessment of erosion hotspots in a watershed: Integrating the WEPP model and GIS in a case study in the Peruvian Andes. Environ. Model. Softw. 2007, 22, 1175–1183. [Google Scholar] [CrossRef]
  33. Laflen, J.M.; Lane, L.J.; Foster, G. WEPP: A new generation of erosion prediction technology. J. Soil Water Conserv. 1991, 46, 34–38. [Google Scholar]
  34. Gyssels, G.; Poesen, J.; Bochet, E.; Li, Y. Impact of plant roots on the resistance of soils to erosion by water: A review. Prog. Phys. Geogr. 2005, 29, 189–217. [Google Scholar] [CrossRef] [Green Version]
  35. Arabameri, A.; Cerda, A.; Tiefenbacher, J.P. Spatial pattern analysis and prediction of gully erosion using novel hybrid model of entropy-weight of evidence. Water 2019, 11, 1129. [Google Scholar] [CrossRef] [Green Version]
  36. Angulo-Martínez, M.; Beguería, S. Estimating rainfall erosivity from daily precipitation records: A comparison among methods using data from the Ebro Basin (NE Spain). J. Hydrol. 2009, 379, 111–121. [Google Scholar] [CrossRef] [Green Version]
  37. Farhan, Y.; Zregat, D.; Farhan, I. Spatial Estimation of Soil Erosion Risk Using RUSLE Approach, RS, and GIS Techniques: A Case Study of Kufranja Watershed, Northern Jordan. J. Water Resour. Prot. 2013, 5, 1247–1261. [Google Scholar] [CrossRef] [Green Version]
  38. Alkharabsheh, M.M.; Alexandridis, T.K.; Bilas, G.; Misopolinos, N.; Silleos, N. Impact of Land Cover Change on Soil Erosion Hazard in Northern Jordan Using Remote Sensing and GIS. Procedia Environ. Sci. 2013, 19, 912–921. [Google Scholar] [CrossRef] [Green Version]
  39. Vinson, J.A.; Barrett, S.M.; Aust, W.M.; Bolding, M.C. Suitability of soil erosion models for the evaluation of bladed skid trail BMPs in the Southern appalachians. Forests 2017, 8, 482. [Google Scholar] [CrossRef]
  40. Uddin, K.; Matin, M.A.; Maharjan, S. Assessment of land cover change and its impact on changes in soil erosion risk in Nepal. Sustainability 2018, 10, 4715. [Google Scholar] [CrossRef] [Green Version]
  41. Das, T. Estimation of Annual Average Soil Loss and Preparation of Spatially Distributed Soil Loss Map: A Case Study of Dhansiri River Basin; Indian Institute of Technology Guwahati: Guwahati, India, 2017; p. 38. [Google Scholar]
  42. Ferreira, V.; Panagopoulos, T. Seasonality of soil erosion under Mediterranean conditions at the Alqueva dam watershed. Environ. Manag. 2014, 54, 67–83. [Google Scholar] [CrossRef] [PubMed]
  43. Alewell, C.; Borrelli, P.; Meusburger, K.; Panagos, P. Using the USLE: Chances, challenges and limitations of soil erosion modelling. Int. Soil Water Conserv. Res. 2019, 7, 203–225. [Google Scholar] [CrossRef]
  44. Abu Hammad, A.; Lundekvam, H.; Børresen, T. Adaptation of RUSLE in the eastern part of the Mediterranean region. Environ. Manag. 2004, 34, 829–841. [Google Scholar] [CrossRef]
  45. Aiello, A.; Adamo, M.; Canora, F. Remote sensing and GIS to assess soil erosion with RUSLE3D and USPED at river basin scale in southern Italy. Catena 2015, 131, 174–185. [Google Scholar] [CrossRef]
  46. Hasan, I.A.; Hammad, M.; Ahmad, M.; Boubou, M.; Yazaji, Z. Studying of Sedimentation in Reservoir of 16 November Dam. Tishreen Univ. J. Res. Sci. Stud. Eng. Sci. Ser. 2019, 41, 23–43. [Google Scholar]
  47. Niu, L.; Shao, Q. Soil conservation service spatiotemporal variability and its driving mechanism on the Guizhou Plateau, China. Remote Sens. 2020, 12, 2187. [Google Scholar] [CrossRef]
  48. Aslam, B.; Maqsoom, A.; Shahzaib; Kazmi, Z.A.; Sodangi, M.; Anwar, F.; Bakri, M.H.; Faisal Tufail, R.; Farooq, D. Effects of Landscape Changes on Soil Erosion in the Built Environment: Application of Geospatial-Based RUSLE Technique. Sustainability 2020, 12, 5898. [Google Scholar] [CrossRef]
  49. Barakat, M.; Mahfoud, I.; Kwyes, A.A. Study of soil erosion risk in the basin of Northern Al-Kabeer river at Lattakia-Syria using remote sensing and GIS techniques. Mesop. J. 2014, 29, 29–44. [Google Scholar]
  50. Ghazal, A. Landscape Ecological, Phytosociological and Geobotanical Study of Eu-Mediterranean in West of Syria; University of Hohenheim: Stuttgart, Germany, 2008. [Google Scholar]
  51. Renard, K.G.; Foster, G.R.; Weesies, G.A.; McCool, D.K.; Yoder, D.C. Predicting Soil Erosion by Water: A Guide to Conservation Planning with the Revised Universal Soil Loss Equation (RUSLE); United States Government Printing: Washington, DC, USA, 1997.
  52. Biswas, S.S.; Pani, P. Estimation of soil erosion using RUSLE and GIS techniques: A case study of Barakar River basin, Jharkhand, India. Model. Earth Syst. Environ. 2015, 1, 42. [Google Scholar] [CrossRef] [Green Version]
  53. Karamage, F.; Shao, H.; Chen, X.; Ndayisaba, F.; Nahayo, L.; Kayiranga, A.; Omifolaji, J.K.; Liu, T.; Zhang, C. Deforestation effects on soil erosion in the Lake Kivu Basin, D.R. Congo-Rwanda. Forests 2016, 7, 281. [Google Scholar] [CrossRef] [Green Version]
  54. Koirala, P.; Thakuri, S.; Joshi, S.; Chauhan, R. Estimation of Soil Erosion in Nepal using a RUSLE modeling and geospatial tool. Geosciences 2019, 9, 147. [Google Scholar] [CrossRef] [Green Version]
  55. Barakat, M.; Ileen Mahfood, A.A.A.-K. Study of the soil water erosion in the basin of 16 Tishreen Dam in the province of Lattakia using Geographic Information System techniques (GIS). Tishreen Univ. J. Res. Sci. Stud. 2013, 35, 85–104. [Google Scholar]
  56. Sabri, E.; Boukdir, A.; Mabrouki, M.; Romaric, V.; Mbaki, E. Predicting Soil Erosion and Sediment Yield in Oued El Abid Watershed, Morocco; ATINER’s Conference Paper Series GEO2016–2091; Athens Institute for Education and Research ATINER: Athens, Greece, 2016; p. 23. [Google Scholar]
  57. Yavuz, M.; Tufekcioglu, M. Estimating Surface Soil Losses in the Mountainous Semi-Arid Watershed using RUSLE and Geospatial Technologies. Fresenius Environ. Bull. 2019, 28, 2589–2598. [Google Scholar]
  58. Irvem, A.; Topaloǧlu, F.; Uygur, V. Estimating spatial distribution of soil loss over Seyhan River Basin in Turkey. J. Hydrol. 2007, 336, 30–37. [Google Scholar] [CrossRef]
  59. Sharpley, A.N.; Williams, J.R. EPIC: The erosion-productivity impact calculator. U.S. Dep. Agric. Tech. Bull. 1990, 1768, 235. [Google Scholar]
  60. Desmet, P.J.J.; Govers, G. A GIS procedure for automatically calculating the USLE LS factor on topographically complex landscape units. J. Soil Water Conserv. 1996, 51, 427–433. [Google Scholar]
  61. Van der Knijff, J.M.F.; Jones, R.J.A.; Montanarella, L. Soil Erosion Risk Assessment Italy; European Soil Bureau, European Commission: Brussels, Belgium, 1999. [Google Scholar]
  62. Wang, Z.; Su, Y. Assessment of Soil Erosion in the Qinba Mountains of the Southern Shaanxi Province in China Using the RUSLE Model. Sustainability 2020, 12, 1733. [Google Scholar] [CrossRef] [Green Version]
  63. Panagos, P.; Borrelli, P.; Poesen, J.; Ballabio, C.; Lugato, E.; Meusburger, K.; Montanarella, L.; Alewell, C. The new assessment of soil loss by water erosion in Europe. Environ. Sci. Policy 2015, 54, 438–447. [Google Scholar] [CrossRef]
  64. Poesen, J.W.A.; Hooke, J.M. Erosion, flooding and channel management in Mediterranean environments of southern Europe. Prog. Phys. Geogr. 1997, 21, 157–199. [Google Scholar] [CrossRef]
  65. García-Ruiz, J.M.; Nadal-Romero, E.; Lana-Renault, N.; Beguería, S. Erosion in Mediterranean landscapes: Changes and future challenges. Geomorphology 2013, 198, 20–36. [Google Scholar] [CrossRef] [Green Version]
  66. Panagos, P.; Borrelli, P.; Meusburger, K. A new European slope length and steepness factor (LS-factor) for modeling soil erosion by water. Geosciences 2015, 5, 117–126. [Google Scholar] [CrossRef] [Green Version]
  67. Mousa, F.H.; Sarhan Laykah, M.A. Studying the Effect of Fire on Regeneration of Natural Vegetation in Kassab. Damascus Univ. J. Basic Sci. 2011, 27, 115–136. [Google Scholar]
  68. Jaafar, H.H.; Zurayk, R.; King, C.; Ahmad, F.; Al-Outa, R. Impact of the Syrian conflict on irrigated agriculture in the Orontes Basin. Int. J. Water Resour. Dev. 2015, 31, 436–449. [Google Scholar] [CrossRef]
  69. Juerges, N.; Hansjürgens, B. Soil governance in the transition towards a sustainable bioeconomy—A review. J. Clean. Prod. 2018, 170, 1628–1639. [Google Scholar] [CrossRef]
  70. Shiferaw, B.A.; Okello, J.; Reddy, R.V. Adoption and adaptation of natural resource management innovations in smallholder agriculture: Reflections on key lessons and best practices. Environ. Dev. Sustain. 2009, 11, 601–619. [Google Scholar] [CrossRef]
  71. Stocking, M.A. Tropical Soils and Food Security: The Next 50 Years. Science 2003, 302, 1356–1359. [Google Scholar] [CrossRef] [PubMed] [Green Version]
  72. Raclot, D.; Le Bissonnais, Y.; Annabi, M.; Sabir, M.; Smetanova, A. Main Issues for Preserving Mediterranean Soil Resources From Water Erosion Under Global Change. Land Degrad. Dev. 2018, 29, 789–799. [Google Scholar] [CrossRef]
  73. Hui, L.; Xiaoling, C.; Lim, K.J.; Xiaobin, C.; Sagong, M. Assessment of soil erosion and sediment yield in Liao watershed, Jiangxi Province, China, Using USLE, GIS, and RS. J. Earth Sci. 2010, 21, 941–953. [Google Scholar] [CrossRef]
  74. Arnoldus, H.M.J. Methodology Used to Determine the Maximum Potential Range Average Annual Soil Loss to Sheet and Rill Erosion in Morocco. Assessing Soil Degradation. FAO Soils Bull. 1977, 34, 39–48. [Google Scholar]
  75. Renard, K.G.; Freimund, J.R. Using monthly precipitation data to estimate the R-factor in the revised USLE. J. Hydrol. 1994, 157, 287–306. [Google Scholar] [CrossRef]
  76. Oliveira, J.A.; Dominguez, J.M.L.; Nearing, M.A.; Oliveira, P.T.S. A GIS-Based procedure for automatically calculating soil loss from the universal soil loss Equation: GISus-M. Appl. Eng. Agric. 2015, 31, 907–917. [Google Scholar]
Figure 1. Location and topography of the study area in Syria.
Water 12 03323 g001
Figure 2. Factor maps of soil erosion modeling of the Northern Al-Kabeer river basin. (a) Soil erodibility factor map; (b) slope length and slope steepness (LS) factor map.
Water 12 03323 g002aWater 12 03323 g002b
Figure 3. Factor maps of soil erosion modeling of the Northern Al-Kabeer river basin (ac) map of rainfall erosivity factor in 2009/2010, 2013/2014 and 2018/2019, respectively; (df) cover management factor map in 2009/2010, 2013/2014 and 2018/2019, respectively.
Water 12 03323 g003aWater 12 03323 g003bWater 12 03323 g003cWater 12 03323 g003dWater 12 03323 g003eWater 12 03323 g003f
Figure 4. Erosion classification map of the Northern Al-Kabeer watershed in (a) 2009/2010, (b) 2013/2014 and (c) 2018/2019.
Water 12 03323 g004aWater 12 03323 g004bWater 12 03323 g004c
Figure 5. (a) Spatial distribution of burned areas and front lines 2012–2019 and the C factor in burned areas in (b) 2009/2010, (c) 2013/2014 and (d) 2018/2019.
Water 12 03323 g005aWater 12 03323 g005bWater 12 03323 g005cWater 12 03323 g005d
Figure 6. The effect of the C factor on the rate of soil erosion over different periods. (a) 2009/2010–2013/2014 (b) 2013/2014–2018/2019 (c) 2009/2010–2018/2019.
Water 12 03323 g006aWater 12 03323 g006bWater 12 03323 g006c
Figure 7. Photos of burned forests of Pinus brutia Ten. in upstream river (a,b) burned forest by bombing and (c) wood Logging after the forest was burned.
Water 12 03323 g007
Figure 8. Photo of the burned forests changed into farmland in the Syrian-Turkish border area (Yamada), 22 October 2013.
Water 12 03323 g008
Figure 9. Vegetative regrowth of Pistacia palestina (Bioss) three weeks after a fire in Rabia (Autumn 2013).
Water 12 03323 g009
Figure 10. Photos of soil erosion in burned forests at steep slopes in (a) Yamada and (b) Rabia.
Water 12 03323 g010
Table 1. Soil erosion classes in 2009/2010, 2013/2014 and 2018/2019.
Erosion Classes (t ha−1 year−1)2009/20102013/20142018/2019
Area
(km2)
Percent
(%)
Area
(km2)
Percent
(%)
Area
(km2)
Percent
(%)
Very low—VL (0–0.5)74.58.842.35.0186.622.1
Low—L (0.5–1)95.911.436.24.3178.721.2
Low medium—LM (1–2)198.823.584.19.9217.125.7
Medium—M (2–5)316.537.5238.128.219122.6
High Medium—HM (5–10)113.513.4252.729.952.36.2
High—H (10–20)31.63.7126.214.913.51.6
Very high—VH (20–50)12.91.554.86.55.10.6
Extremely high—EH (>50)1.40.210.81.30.70.1
Table 2. Change the soil erosion matrix classes from 2009/2010 to 2013/2014 (%).
Soil Erosion ClassesSoil Erosion Classes 2013/2014Grand Total
VLLLMMHMHVHEH
Soil erosion classes 2009/2010VL4.231.801.251.030.360.080.040.028.81
L0.471.773.653.251.630.440.120.0311.35
LM0.190.574.0210.735.332.050.550.0723.52
M0.080.120.8911.9516.875.631.730.1937.45
HM0.020.020.100.915.025.461.680.2313.43
H0.010.010.020.210.501.071.690.233.74
VH0.010.000.010.060.160.190.650.431.53
EH0.010.000.000.020.020.020.020.080.17
Grand total5.024.309.9428.1729.8914.936.481.28100.00
Table 3. Change the soil erosion matrix classes from 2013/2014 to 2018/2019 (%).
Soil Erosion ClassesSoil Erosion Classes 2018/2019Grand Total
VLLLMMHMHVHEH
Soil erosion classes 2013/2014VL4.970.050.000.000.000.000.000.005.02
L3.710.540.040.000.000.000.000.004.30
LM5.343.690.870.060.000.000.000.009.95
M5.9410.089.552.480.100.010.000.0028.16
HM1.875.5911.1710.320.840.090.000.0029.89
H0.231.023.407.282.760.210.030.0014.93
VH0.020.180.652.312.170.930.200.016.47
EH0.000.000.020.140.320.360.370.071.28
Grand total22.0821.1525.7022.606.191.600.600.08100.00
Table 4. Change the soil erosion matrix classes from 2009/2010 to 2018/2019 (%).
Soil Erosion ClassesSoil Erosion Classes 2018/2019Grand Total
VLLLMMHMHVHEH
Soil erosion classes 2009/2010VL7.220.950.420.160.030.010.010.008.81
L5.763.101.560.750.120.040.010.0011.35
LM6.037.936.062.830.490.130.040.0123.52
M2.658.1314.2310.561.520.270.080.0237.45
HM0.280.822.896.752.280.300.090.0113.43
H0.080.160.411.221.320.440.090.013.74
VH0.040.050.110.300.400.380.240.011.52
EH0.020.010.010.030.020.020.050.020.17
Grand total22.0821.1525.7022.606.191.600.600.08100.00
Publisher’s Note: MDPI stays neutral with regard to jurisdictional claims in published maps and institutional affiliations.

