Article

Available Dissolved Organic Carbon Alters Uptake and Recycling of Phosphorus and Nitrogen from River Sediments

by
Marc Stutter
1,2,*,
Daniel Graeber
3 and
Gabriele Weigelhofer
4,5
1
Environmental and Biochemical Sciences Group, The James Hutton Institute, Craigiebuckler, Aberdeen AB15 8QH, UK
2
Lancaster Environment Centre, Lancaster University, Bailrigg LA1 4YX, UK
3
Aquatic Ecosystem Analysis, Helmholtz-Centre for Environmental Research–UFZ, Brückstr. 3a, 39114 Magdeburg, Germany
4
Institute of Hydrobiology and Aquatic Ecosystem Management, University of Natural Resource and Life Sciences, Gregor-Mendel-Str. 33/DG, 1180 Vienna, Austria
5
WasserCluster Lunz–Biological Station GmbH, Dr. Kupelwieser-Prom. 5, 3293 Lunz am See, Austria
*
Author to whom correspondence should be addressed.
Water 2020, 12(12), 3321; https://doi.org/10.3390/w12123321
Submission received: 28 September 2020 / Revised: 6 November 2020 / Accepted: 23 November 2020 / Published: 26 November 2020
(This article belongs to the Special Issue Transformation of Dissolved Organic Matter in Aquatic Landscapes)

Abstract

:
Concurrent with nutrient pollution, agriculture has significantly impacted the quantity, composition, and bioavailability of catchment-derived dissolved organic carbon (DOC) in stream ecosystems. Based on the stoichiometric theory, we tested the hypothesis that bioavailable DOC will stimulate the heterotrophic uptake of soluble reactive P (SRP) and inorganic nitrogen in stream sediments. In a simplified laboratory column flow-through study, we exposed stream sediments to additions of glucose, nitrate, and phosphate alone and in combination (+C, +NP, +CNP), and calculated gross and net changes in DOC and nutrients via a mass balance approach. Our results show that glucose-C increased nutrient uptake, but also that NP additions resulted in the enhanced consumption of both native and added organic C. The effects of C addition were stronger on N than P uptake, presumably because labile C stimulated both assimilation and denitrification, while part of the P uptake was due to adsorption. Internal cycling affected net nutrient uptake due to losses of dissolved organically-complexed P and N (DOP and DON). Overall, our study shows that increases in the stoichiometric availability of organic carbon can stimulate N and P sequestration in nutrient-polluted stream sediments. Future studies are required to assess the effects of complex organic carbon sources on nutrient uptake in stream sediments under different environmental conditions, and whether these stoichiometric relations are relevant for ecosystem management.

Graphical Abstract

1. Introduction

Pollution of surface waters by excess nitrogen and phosphorus has become globally recognised over the last few decades [1,2,3]. High reactive N and P loadings lead to nutrient saturation of streams [4,5,6] and increased losses of reactive N and P to downstream aquatic ecosystems. Concurrent with diffuse N and P pollution, agriculture has significantly impacted the quantity, composition, and bioavailability of catchment-derived dissolved organic carbon (DOC) in stream ecosystems [7,8,9]. There is also a widely understood change in aquatic DOC concentration and forms associated with DOC release from sources of humified soil C [10], effluents and urban areas [11,12]. This change in DOC sources could be of significant importance for the N and P losses as, based on the stoichiometric theory, the availability of DOC to microbiota is the primary driver controlling assimilative and dissimilative nutrient uptake [13,14,15,16]. The depleted nature of organic C, which is available to drive microbial processes, relative to anthropogenically-enriched N and P in some ecosystems has been previously shown [17]. Nutrient stoichiometric controls are particularly crucial for river benthic zone processes where a considerable potential for microbial processing exists [18] that may attenuate downstream nutrient enrichment. Further knowledge is required to understand how biogeochemical cycles of N and P respond to organic C additions (or relative depletion).
Appreciation of high reactive surface areas and long-residence times in some benthic zones, particularly of lower-order rivers, has been part of rethinking past suggestions that rivers were non-reactive conveyors for organic C [18,19]. Understanding of stoichiometric coupling in C:N processing in rivers has developed due to advanced research programs and methods for N transformations across soils and sediments, exploring mineralisation and denitrification driven by ecosystem carbon amount, concentration and quality [14,20,21]. In an empirical study in the USA, the DOC:nitrate concentration ratio strongly correlated with nitrate uptake in a large cross-biome study with 69 stream sites [22,23]. In experimental studies, simple DOC sources, such as acetate or glucose, have been shown to stimulate assimilatory N uptake by heterotrophs [16,24,25,26]. Simple C source molecules are most often used experimentally for reasons such as need to satisfy large addition masses, or ability to add C in isolation of associated N or P also present in natural organic matter. However, it should be recognized that the biogeochemical responses can differ to those from natural DOC enrichment by soil leachates or algal exudation. Despite this, the tight coupling of different DOC types and N has been shown for aquatic ecosystems which implies a clear potential for similarly tight coupling of DOC and P.
For P, the link between C:P and soluble reactive P (SRP) uptake is far less clear than for nitrogen, even for pure DOC compounds. Oviedo-Vargas et al. [27] observed no increase in P uptake during acetate additions, which they ascribed to increased competitiveness of heterotrophs compared to autotrophs and the use of alternative P sources in the sediments. In a large-scale study about the effects of agricultural land use, Bechtold et al. [28] found significant correlations of DOC uptake with background SRP concentrations, but none between SRP uptake and ambient DOC concentrations.
Moreover, biotic P availability may be influenced by geochemical sorption of P onto sediment surfaces, likely decoupling P uptake from microbial stoichiometric controls. Additionally, recent work has shown that microbes may invest added C in phosphatase enzymes which mediate mineralisation of complexed P [29] or in low-molecular weight organic acids that liberate P from exchange sites [30]. Together, these processes can alter the resource environment for benthic processing and alter the amount and form of P being in excess to or recycled in the microbial processing. While a holistic system of C, N and P is required for understanding, research must recognise and explore the different abiotic and biotic control interactions associated with C:N and C:P coupling.
Mechanistic studies have addressed the combined effects of labile C, N and P additions to aquatic environments [27,28,31,32] with often inconsistent results due to varying addition levels, ratios, and effects magnitude. Furthermore, stoichiometric studies should encompass both inorganic and organically-complexed forms of nutrients. Only then can more holistic macronutrient cycling frameworks be developed. These should describe not only the dynamics of reactive nutrient uptake but also net uptake/release effects involving N and P recycled through biogeochemical transformations. Column systems present suitable microcosms for simulating riverbed P processes due to the ability to control and test biotic and physico-chemical processes and, by measuring inflows and outflows, to evaluate mass balances whilst avoiding complex tracers (e.g., isotopically-labelled 33P or 14C).
Our study used laboratory column flow-through studies to simulate the river benthic zone and evaluate biotic nutrient cycling processes alongside abiotic context of the tested river sediment. We tested the hypothesis that introducing bioavailable DOC (as glucose) to a river sediment would influence the biological uptake rate of dissolved soluble reactive P and inorganic nitrogen relative to inorganic nutrient exposure without labile DOC. Furthermore, we proposed that nutrient recycling would occur, manifested in organically-complexed N and P release, that would alter the magnitude and timescale of the effect of labile DOC additions on the overall N and P fate. By combining these factors in simplified benthic microcosms, we hoped to show key C, N and P interactions, stimulating further experimental studies on combined C, N and P cycling. Using glucose allows us to construct simple C, N and P addition treatments without compounding N and P additions in natural organic matter. It remains important to increase knowledge on river N and P cycling building from fundamental laboratory investigations of responses to model C compounds, that will support subsequent in-situ understanding with natural C forms.

2. Materials and Methods

2.1. River Sediment and Column Flow Systems

We collected sediment in September 2018 from the bed of the River Dee, NE Scotland (Lat. 57.08, Long. −2.34), from a depth of 0–3 cm below the water-sediment interface, at a point of channel width ~20 m, altitude 20 m a.s.l. and catchment area 1844 km2. The catchment-land use comprises 6%, 8%, 66%, 16% and 0.3% for arable land, improved grassland, rough grass/moorland/montane areas, woodland and urban areas, respectively [33].
Sediments were kept fresh at 4 °C in the dark during storage and used within 24 h of collection. Sediments were wet-sieved between <2 mm and >63 µm to prevent column clogging and remove coarser particulate organic matter and left one hour to drain by gravity to a final moisture of 202 ± 6 g kg−1 (mean ± 1 s.e.). A subsample was taken at this point (termed sediment_t0) and the sediments were packed into five glass liquid chromatography columns (Merck Group, Darmstadt, Germany; 2.5 cm diameter, 10 cm length) to a depth of six cm (Figure 1). Columns had in-built filters (as bed support) at inflow and outflow ends (<20 µm) and flow was from bottom to top to remove air and ensure saturation. Column pore volumes (PV) were determined by the difference in the mass of the sediment-packed column prior to flow and when saturated on destructive sampling and all leaching volumes are hereby referred to in terms of the equivalent number of PV. Columns were covered on the outside by aluminium foil to exclude light. Column physical parameters are given in Table 1 alongside the tabulated concentrations of pre-treatment leachates. Column experiments took place in a temperature-controlled laboratory (20 °C) using a peristaltic pump to control flow rates (19.5 ± 0.2 mL h−1). The column experiments simulated interstitial flow in the sandy sediments of the turbulent, steep (1300 m altitude in 100 km) River Dee, where naturally we expect considerable exchange of solutes between bed and water column by mixed diffusive and advective flows. The mean water residence time (0.9–1.1 × 10³ s) was short compared to hyporheic water residence of 102–105 s [34], but was a compromise for flow rates required to gain sample volumes for analysis without time for P form conversion (degradation of SRP concentrations in samples).
The particle size distribution of the sediment used to pack the columns was determined by laser-diffraction (Malvern Panalytical, Malvern, UK). The sorption affinity of sediment amorphous surface complexes was determined by extraction with acid ammonium oxalate [35]. Oxalate extractable element concentrations (Pox, Alox, Feox) were analyzed in extracts by inductively coupled plasma optical emission spectroscopy (ICP-OES, Agilent 7500ce instrument, Agilent Technologies, Santa Clara, CA, USA). The P saturation was calculated as Psat = [Pox]/([Alox] + [Feox]), where [] denotes the element’s molar concentration.

2.2. Solute Treatments and Column Eluant Sampling

Columns were initially conditioned using 0.2 mM NaCl to simulate river water. The first stage was 48 h at reduced flow, designed to ensure saturation. Then the final constant flow rate (19.5 mL h−1) was applied and 7 PV equivalent of background electrolyte were used to establish background leaching concentrations and DOC, N, P release rates as a reference for characterising P sorption and C, N and P mineralisation prior to treatments. This was done instead of providing an additional control column throughout the experiment, since it provided a before-after reference leaching specific for each column.
Subsequently, three treatments were applied. As only five columns were available in total, one column had DOC solution only (Ctreat), duplicate columns had NP solution (NPtreat1, 2) and duplicate columns had DOC and NP solution (CNPtreat1, 2). These inflow solutions consisted of 0.69 mM DOC as glucose, 0.1 mM NaNO3 and 0.0065 mM KH2PO4 factorially (equivalent to 8.3, 1.4 and 0.2 mg L−1 of C, N and P and resulting in stoichiometric C:N:P molar ratios of 106.1:15.4:1, approximating the Redfield ratio). Small column experiments facilitate the additions of adequate solute volumes required to induce effects and scale-down longer-timescales of riverbed processes. Approximately 3.8 L of solution was applied to each column over eight days. Inflow solutions were exposed to the oxygen conditions of the laboratory. Generally, samples for chemical analyses were taken into bottles exposed to air (i.e., allowed to drip into an open bottle). However, after ~500 PV, one sample of each column was collected with a 30 mL syringe and flushed carefully through a flow cell with an incorporated dissolved oxygen sensor (DO) and pH sensor to facilitate these measurements at this timepoint without exposure to the atmosphere.

2.3. Analysis of Eluants

During the column experiments, DO was determined using a calibrated optical DO meter (Hach HQ40D (Loveland, CO, USA)) on the air-excluded eluant sample and compared to DO for inflow solution treatments (equilibrated with air) to compare O2 consumption rates. For chemical analyses, the samples (from the open bottles) were analyzed by automated colorimetry (Skalar San++, the Netherlands; analyzed <24 h following collection to maintain solute speciation). Nutrient concentrations were determined for NO3-N, NH4-N, then for total dissolved N (TDN), soluble reactive P (SRP; approximating to phosphate), total dissolved P (TDP) and DOC using an automated persulphate/UV digestion procedure. The colorimetric detection limits were 0.1, 0.01 and 0.001 mg L−1 for C, N and P species, respectively. Standards for DOC analyses used phthalate and accuracy of quantification for DOC, TDN and TDP was determined against in-house reference samples using sodium benzoate, glycine and sodium hexametaphosphate, respectively. Dissolved organic nitrogen (DON) was calculated from the difference between TDN and (NO3-N + NH4-N) and the difference TDP-SRP was used to determine molybdate unreactive P that we interpreted here as dissolved organic P (DOP).
We investigated the accuracy of the DON and DOP calculations. For DON, we found that in 47.5% of the samples, the DIN:TDN ratio was > 0.8, indicating a low accuracy of the calculated DON concentrations in these cases [36]. Due to high random error resulting from high DIN:TDN ratios and potentially due to systematic underestimation of TDN or overestimation of DIN, DON concentrations can be calculated as being negative [36]. We found negative DON concentrations in 31.3% of the cases. For DOP, we found SRP:TDP ratios >0.8 in 21.3% of the cases, and negative DOP concentrations in 2.5% of the cases, hence, the calculated DOP concentrations are likely more accurate than the calculated DON concentrations. We set the negative DON and DOP concentrations to zero, knowing that this is not necessarily true [36]. However, in the absence of a direct determination method [36,37] for DON and DOP during the experiment, this is still the best possible practice. In the discussion of the DON and DOP data, we will keep this in mind and will interpret especially our results on the development of DON variables during the experiment with caution.

2.4. Destructive Analysis of Column Sediment Samples

Immediately on destructive sampling, extracellular enzyme activities were determined using a microplate version of the p-nitrophenyl (pNP) linked substrate method for both pNP-phosphate and pNP-β-glucopyranoside. The former substrate assays the role of phosphatase activity in liberating inorganic phosphate from organo-phosphorus compounds, the latter substrate assays enzymes of cellulose conversion to glucose for microbial C acquisition. The method modified from Jackson et al. [38] comprises, briefly, exposure in separate tests of 2.5 mM of each substrate (in 50 mM acetate buffer) at a ratio 300 µL to 0.60 g dry mass (DM) sediment at 20 °C for two hours following manual stirring of each well. Tests were done in 96 deep-well plates with six replicates of all samples, standards and blanks. After incubation, the plate was centrifuged at 5000 g for five minutes and supernatant transferred onto a clean plate comprising 190 µL buffer and 10 µL 1 M NaOH to enhance colour formation per well prior to spectrophotometric analysis at 410 nm. Samples were assessed against a standard curve of pNP (range 0–2 mM; n = 6; R2 = 0.99) prepared in an identical matrix. Sample replicates (n = 6) had 7–14% and 10–27% relative standard deviation for the pNP-phosphate and pNP-β-glucopyranoside reactions, respectively.
Within 24 h, microbial biomass nutrients were determined on fresh sediments following the microbial biomass C method with chloroform fumigation (based on [39]). Briefly, this extracted two sets of sediments and blanks in triplicate with 4 mL 0.5 M KSO4 at 1 g DM sediment for 30 min. One set had been exposed to a saturated atmosphere of chloroform vapour under vacuum for 24 h with multiple degassing to remove chloroform residual, the other set of sediments were unfumigated. Sample filtrates (<0.45 µm) were stored at −15 °C prior to analysis for DOC by automated colorimetry (Skalar San++) and microbial biomass C (MBC) determined as the difference. As sediment masses were limited, the opportunity was taken to simultaneously analyse for microbial biomass P and N (respectively termed MBP, MBN) by difference in the same samples (colorimetric analysis), even though 0.5 M KSO4 would provide a weaker P extractant than conventional 0.5 M NaHCO3 matrix used in microbial biomass P extractions [40]; hence differences between treatments would be resolved, but absolute values not comparable with the literature. For this purpose, a 20 µg/mL phosphate spike was included to correct for the sorption of P released by cell lysis on the soil matrix, as common to the standard P protocols. The MBC was calculated as: MBC = EC/kEC, where EC = (DOCfumigated−DOCnon-fumigated) and kEC = 0.45 [41]. Similarly, MBN was calculated, but using kEN = 0.54 [42], and MBP using kEP = 0.4 and not correcting according to a spike of added dissolved phosphate [43].
For both enzyme activities and microbial biomass nutrients a reference sample was included (termed background) comprising the same sediment prepared as for column packing but then stored at 5 °C in the fridge for the experimental duration. This was not a true native condition for the in-situ river bed (altered by sieving), nor control for the columns (did not experience flow) but was considered to have been stored under biologically-slowed conditions allowing a reference state of microbial CNP stoichiometry compared to post-column treatments.
Carbon and nitrogen concentrations of the sediments for background and post-column experiments and their δ13C and δ15N (and additionally the nutrient source material glucose) were determined on 2 mg (glucose) and 10 mg (sediment) milled subsamples using a Flash EA 1112 Series Elemental Analyzer connected via a Conflo III to a DeltaPlus XP isotope ratio mass spectrometer (Thermo, Bremen, Germany). The δ13CVPDB and δ15NAir-N2 values were normalized to their respective scales using International Atomic Energy Agency (Vienna, Austria) reference materials USGS40 and USGS41a (both L-glutamic acid). It is known that glucose has a C4 plant signature that makes the addition of glucose a possible tracer for DOC incorporation against the background of C3 DOC signal from natural catchment sources. The end-member stable isotope value of glucose was δ13C −11.4 ± 0.0‰.

2.5. Data Handling and Statistics

All data were expressed relative to sediment dry mass determined by drying at 105°. Column flow volumes were converted to pore volume PV equivalents by dividing flow volumes by the PV. The column PV of 5.0 to 6.3 mL indicated average water residence times of 923 to 1163 s. Sample concentrations and calculated mass differences were plotted against the mid-point PV of that sampling period.
Differences in column concentrations were assessed as outflow minus inflow concentrations. The net release or uptake of C, N and P per column and time step was calculated via a mass balance approach, where the difference between output and input concentrations was divided by the exchanged water volume, respectively. To obtain the mean gross change of C, N and P for each treatment, the solute release from the reference leaching was extrapolated via linear regression to 600 PV and the change in C, N and P relative to this extrapolation of the reference leaching was calculated. Concentrations, stoichiometric ratios, and consumption rates are given in molar units. Net column retention or release was derived from summation of masses for individual sample times, then stated and plotted for an equivalent 600 PV leaching period across all columns.
We used Bayes factor statistics to test whether we find evidence of a significant effect of the DOC, CNP, or NP treatment on the difference of solute concentrations (DOC, NO3, NH4, SRP, DON, DOP) between in and outflow of the sediment columns. The Bayes factor statistics applied here use the same statistical hypothesis as frequentist p-value statistics (ANOVA, t-test etc), the null hypothesis is that the mean of the data is not different between the tested groups and the alternative hypothesis is that there is a difference; hence defining here that the treatment groups come from different populations of values. We chose Bayes factor statistics as they calculate how likely the alternative hypothesis is compared to the null hypothesis and, in contrast to p-value statistics, do not require an arbitrary significance level threshold [44]. Here a Bayes factor (BF) of 1 indicates the same odds for the alternative and null hypothesis; a BF > 1 indicates higher odds for the alternative hypothesis, and a BF < 1 indicates higher odds for the null hypothesis. For easy orientation, we consider a BF = 1 to 3 weak evidence for the alternative hypothesis, a BF > 3 positive evidence, a BF > 20 strong evidence, and a BF > 150 very strong evidence for the alternative hypothesis [45]. We apply the same interpretation for the null hypothesis and BF = 0.33 to 1 (weak evidence), <0.33 (evidence), < 0.05 (strong evidence), 0.0067 (very strong evidence). To test the treatment effects on the difference between column in- and outflow, we only used measurements after 100 h of experiment duration, as before that the differences between in- and outflow were highly unstable due to the still ongoing adaption to the enrichment. Since we sampled the columns repeatedly, we used a repeated-measures Bayes factor statistic (analogous to a repeated-measures analysis of variance) with sample occasion as a random factor and solute out-in concentration as the dependent variable. Using this procedure, we treated each sample occasion as the subject, able to independently react to the treatment and, hence, removing the effect of time on the development of the dependent variables. We did these statistics in R, version 3.6.1 [46] with the anovaBF function of the BayesFactor package [47]. The formula took the form y ~ treatment + time, with time as a random factor (using the parameter which Random = time), y being the dependent variable (solute out-in concentration), and treatment being the DOC, CNP or NP treatment. The full mathematical form of the Bayes factor is given in Kass and Raftery [48] where a fuller explanation of the methodology is also given. Further assumptions of the Bayes factor statistic applied here are normal distribution and variance homogeneity of the model residuals. Both assumptions were sufficiently given, and were not affecting the accuracy of the calculated BFs. In the results, we will present the BFs and their accuracy (as relative accuracy in %).

3. Results

3.1. Column and Sediment Conditions

Initial analysis of the sediment prepared for column packing showed particle size distribution of 0% clay (<2 µm; % by volume), 4.5% silt (2–60 µm), and 95.5% sand (60–2000 µm) with an idealised equivalent spherical diameter of 40.8 m2/kg DM. The mean (±1 s.e.) oxalate extractable Fe, Al, and P of 2000 ± 12, 399 ± 11, and 69 ± 3 mg kg−1 DM, respectively, suggested this was a poorly P saturated sediment with low sorption strength and molar Psat of 0.044 ± 0.002. Total organic C concentration was small at 1.53 gC kg−1 DM and total N below the detection limit of 0.015 gN kg−1 DM. Hence molar C:N of the t0 sediment exceeded 119.

3.2. Column Background Leaching Pre-Treatment Phase

Prior to treatments, the column background leaching (Table 1a) showed concentration means of 4.0 µM NO3-N, 9.4 µM NH4-N, 0.54 µM SRP, 9.6 µM DON, 0.35 µM DOP, and 193 µM DOC. These background leaching concentrations were smaller than those of the treatment phase inflow solutions by 23, 12, and 4 times for NO3-N, SRP and DOC, respectively. The pre-treatment leaching corresponded to release rates of 1.5, 3.4, 0.2, 70.2, 3.5 and 0.1 µmol h−1 kg−1 DM for NO3-N, NH4-N, SRP, DOC, DON and DOP, respectively, that can be compared with those during the treatment phase (Table 1). The stoichiometric ratios of the background leachates for C:N:P ranged between 162–265:19–36:1 when all nutrient forms were considered (Table 1).

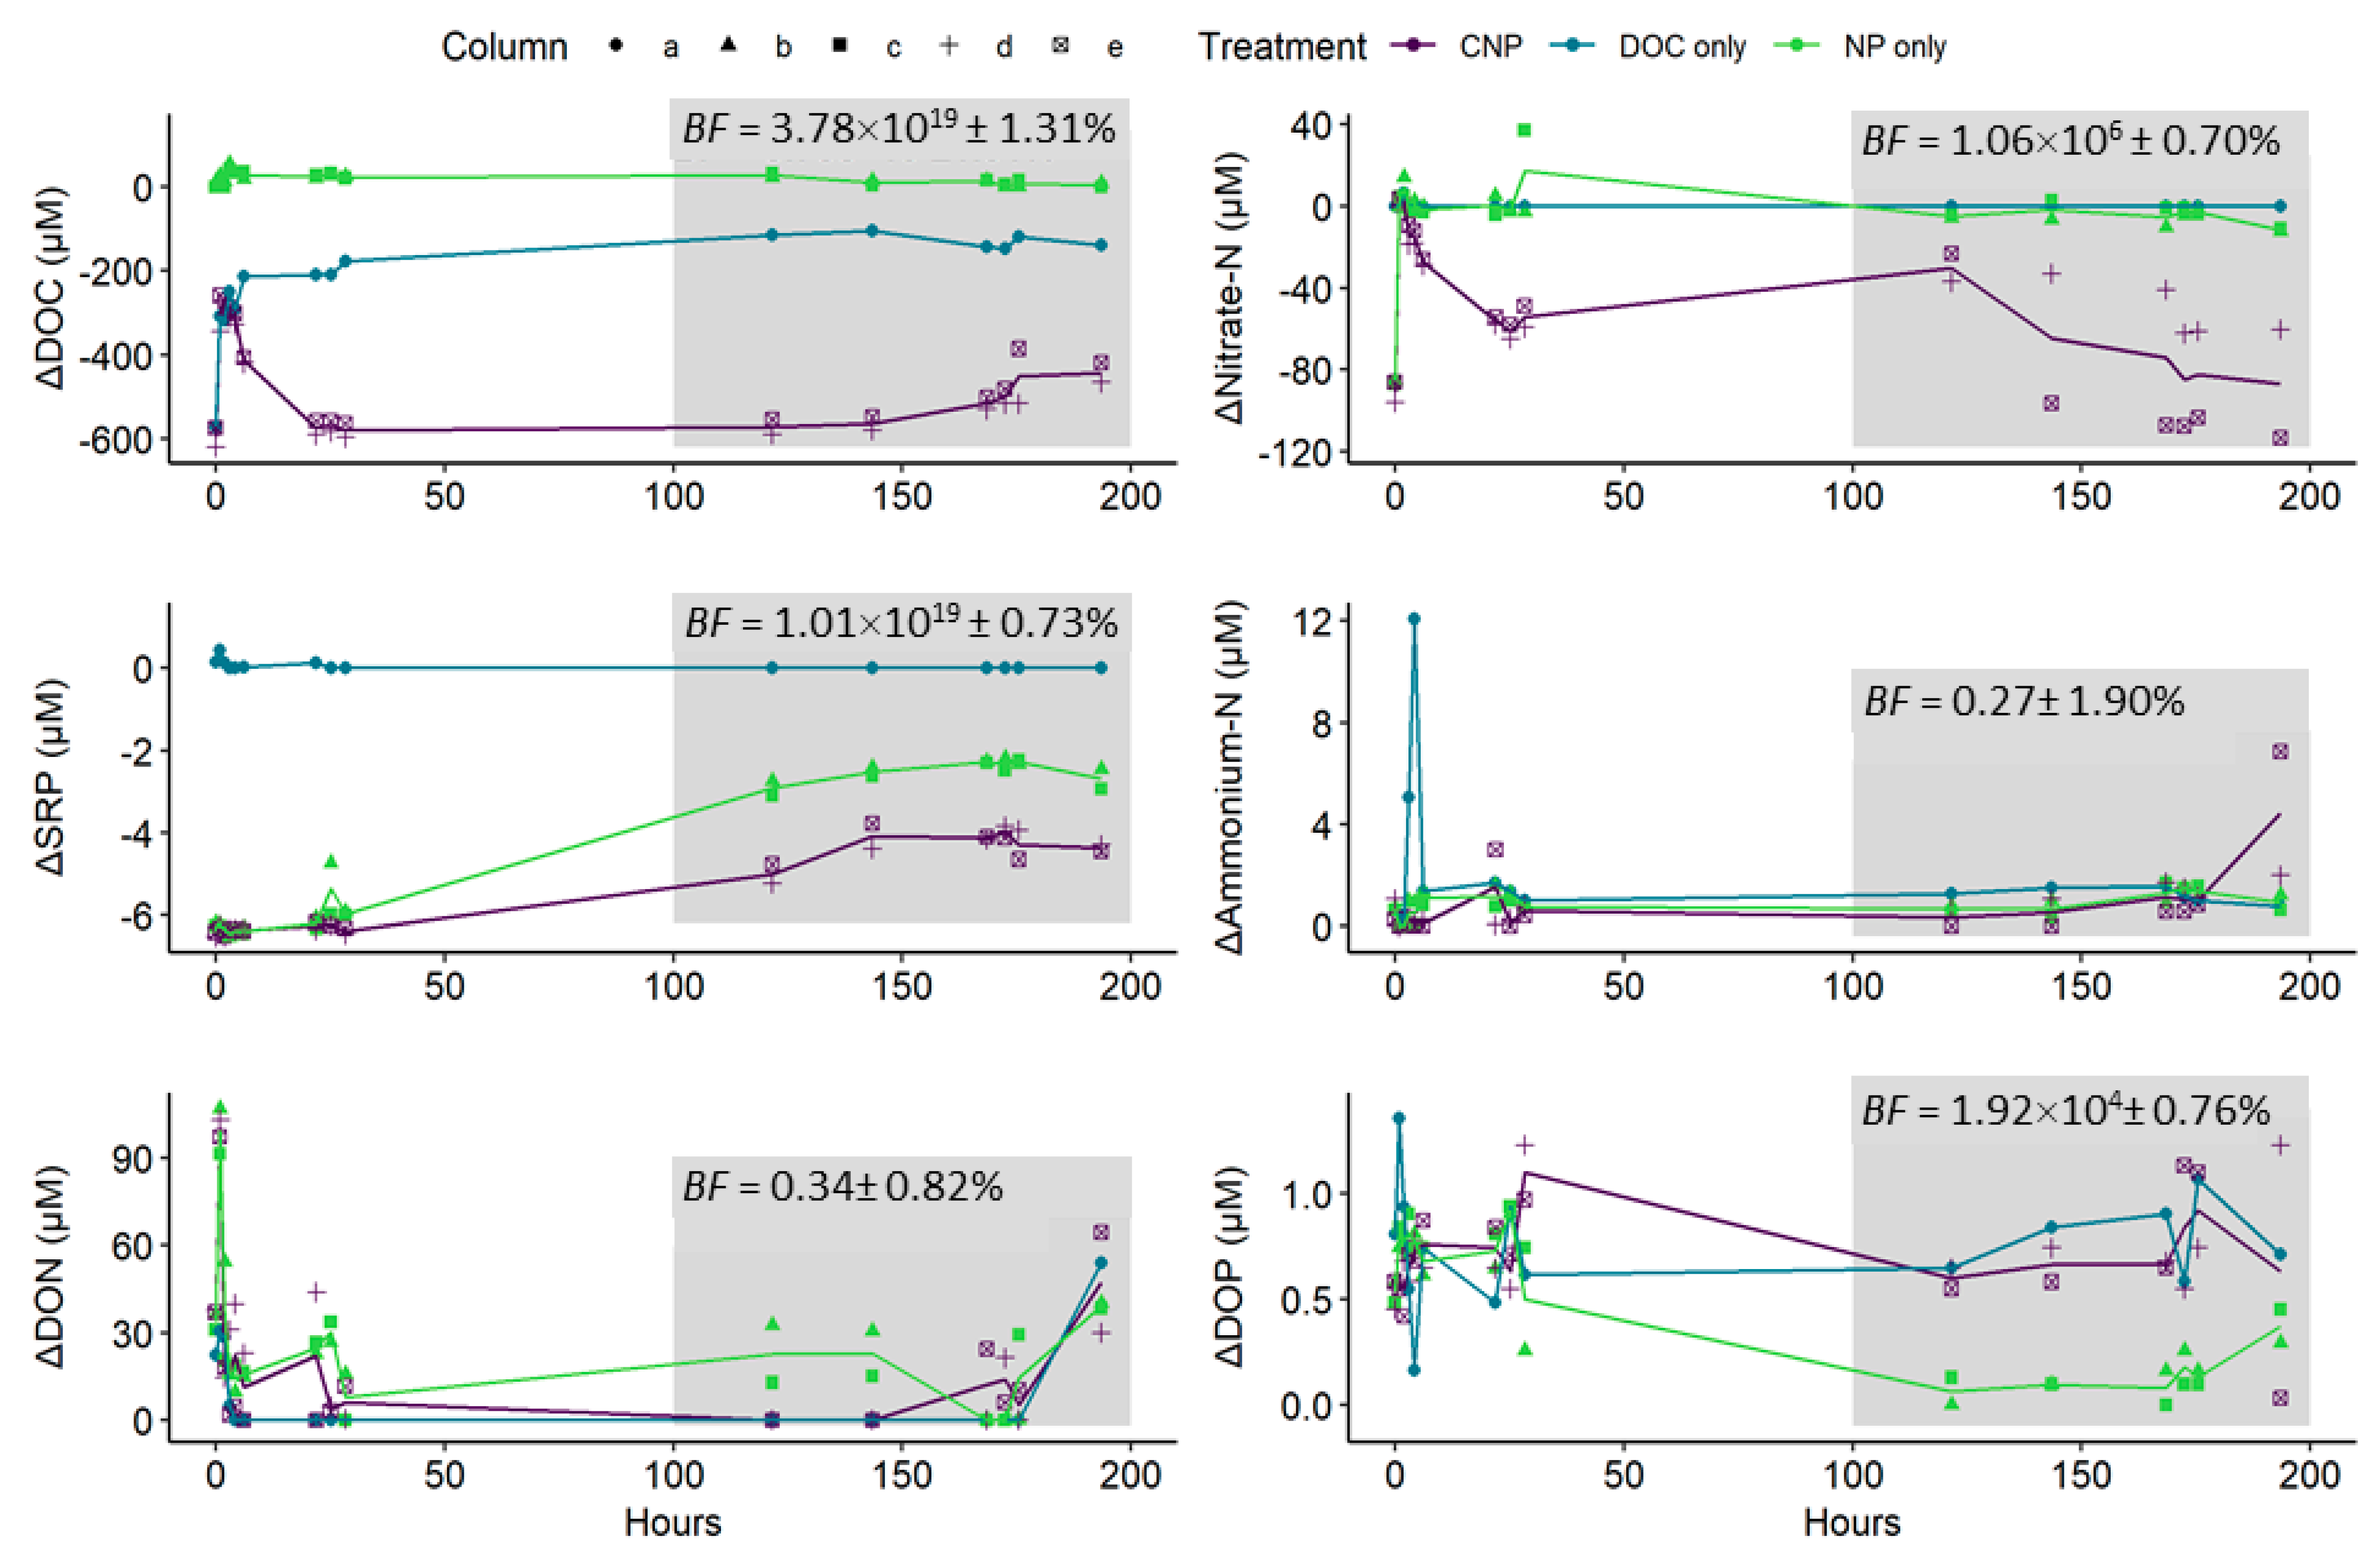
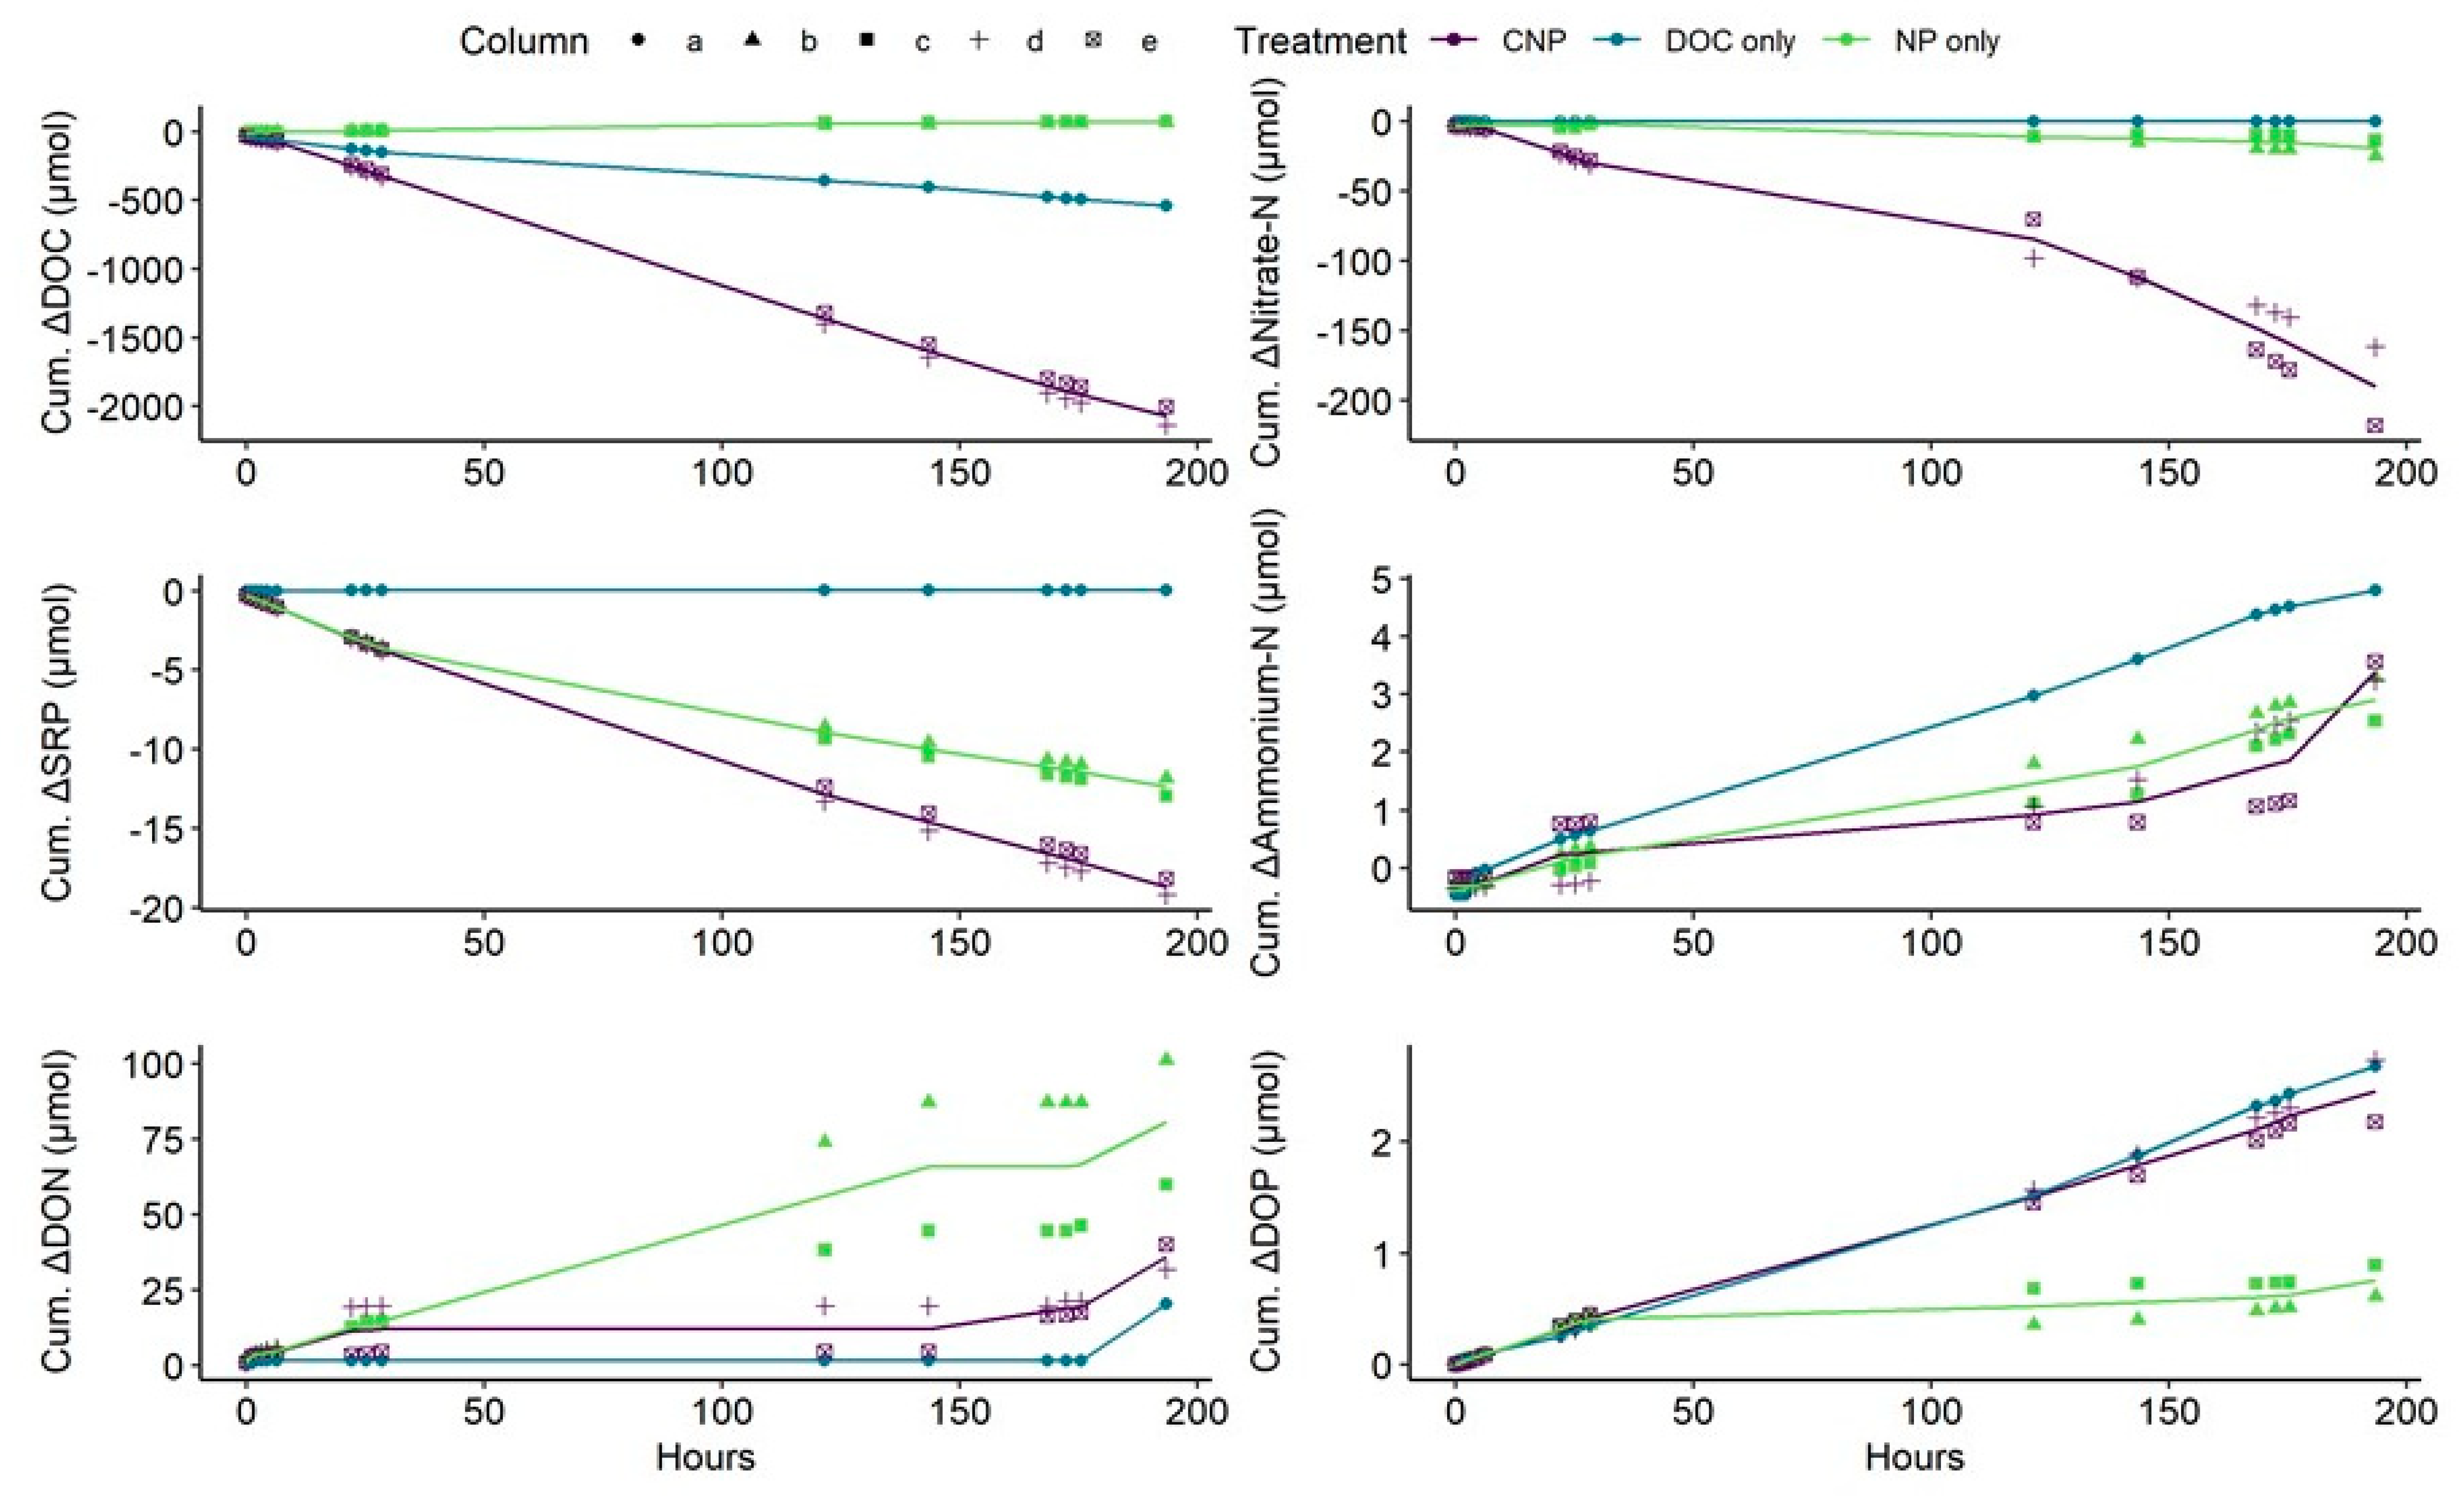
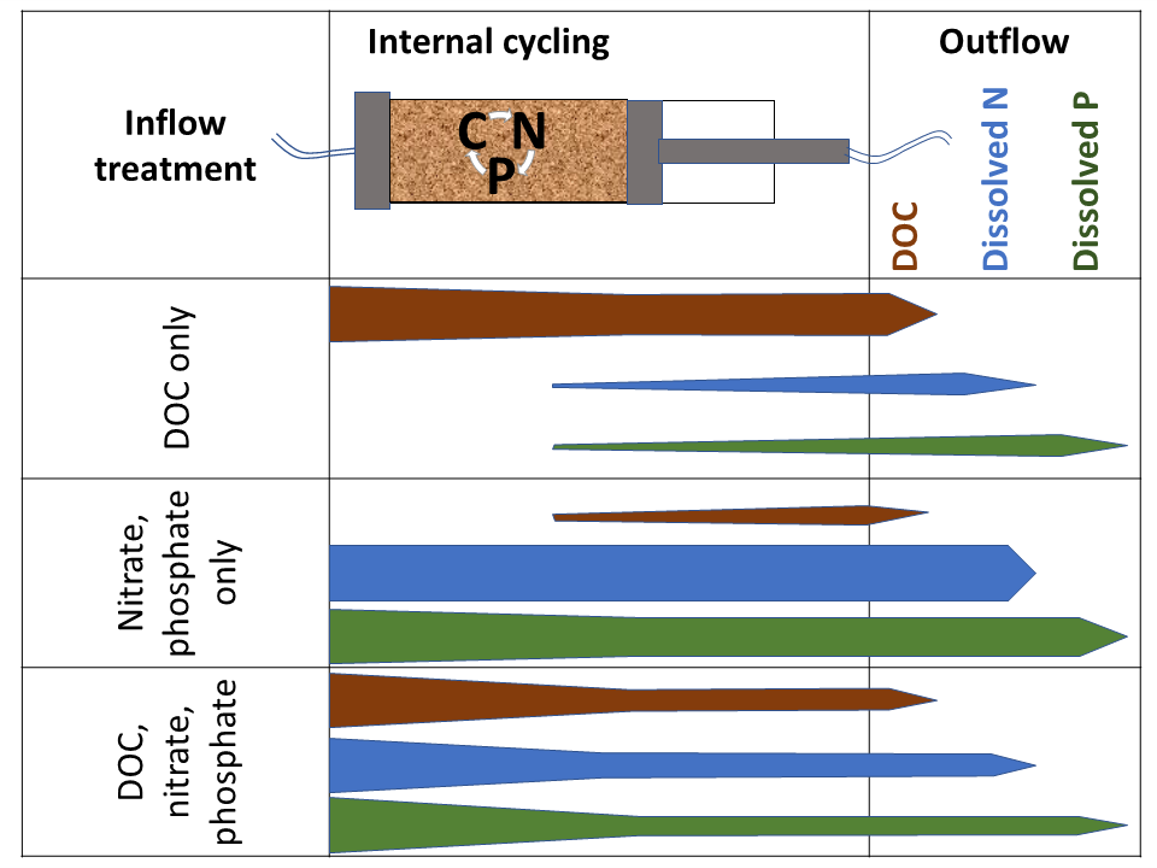
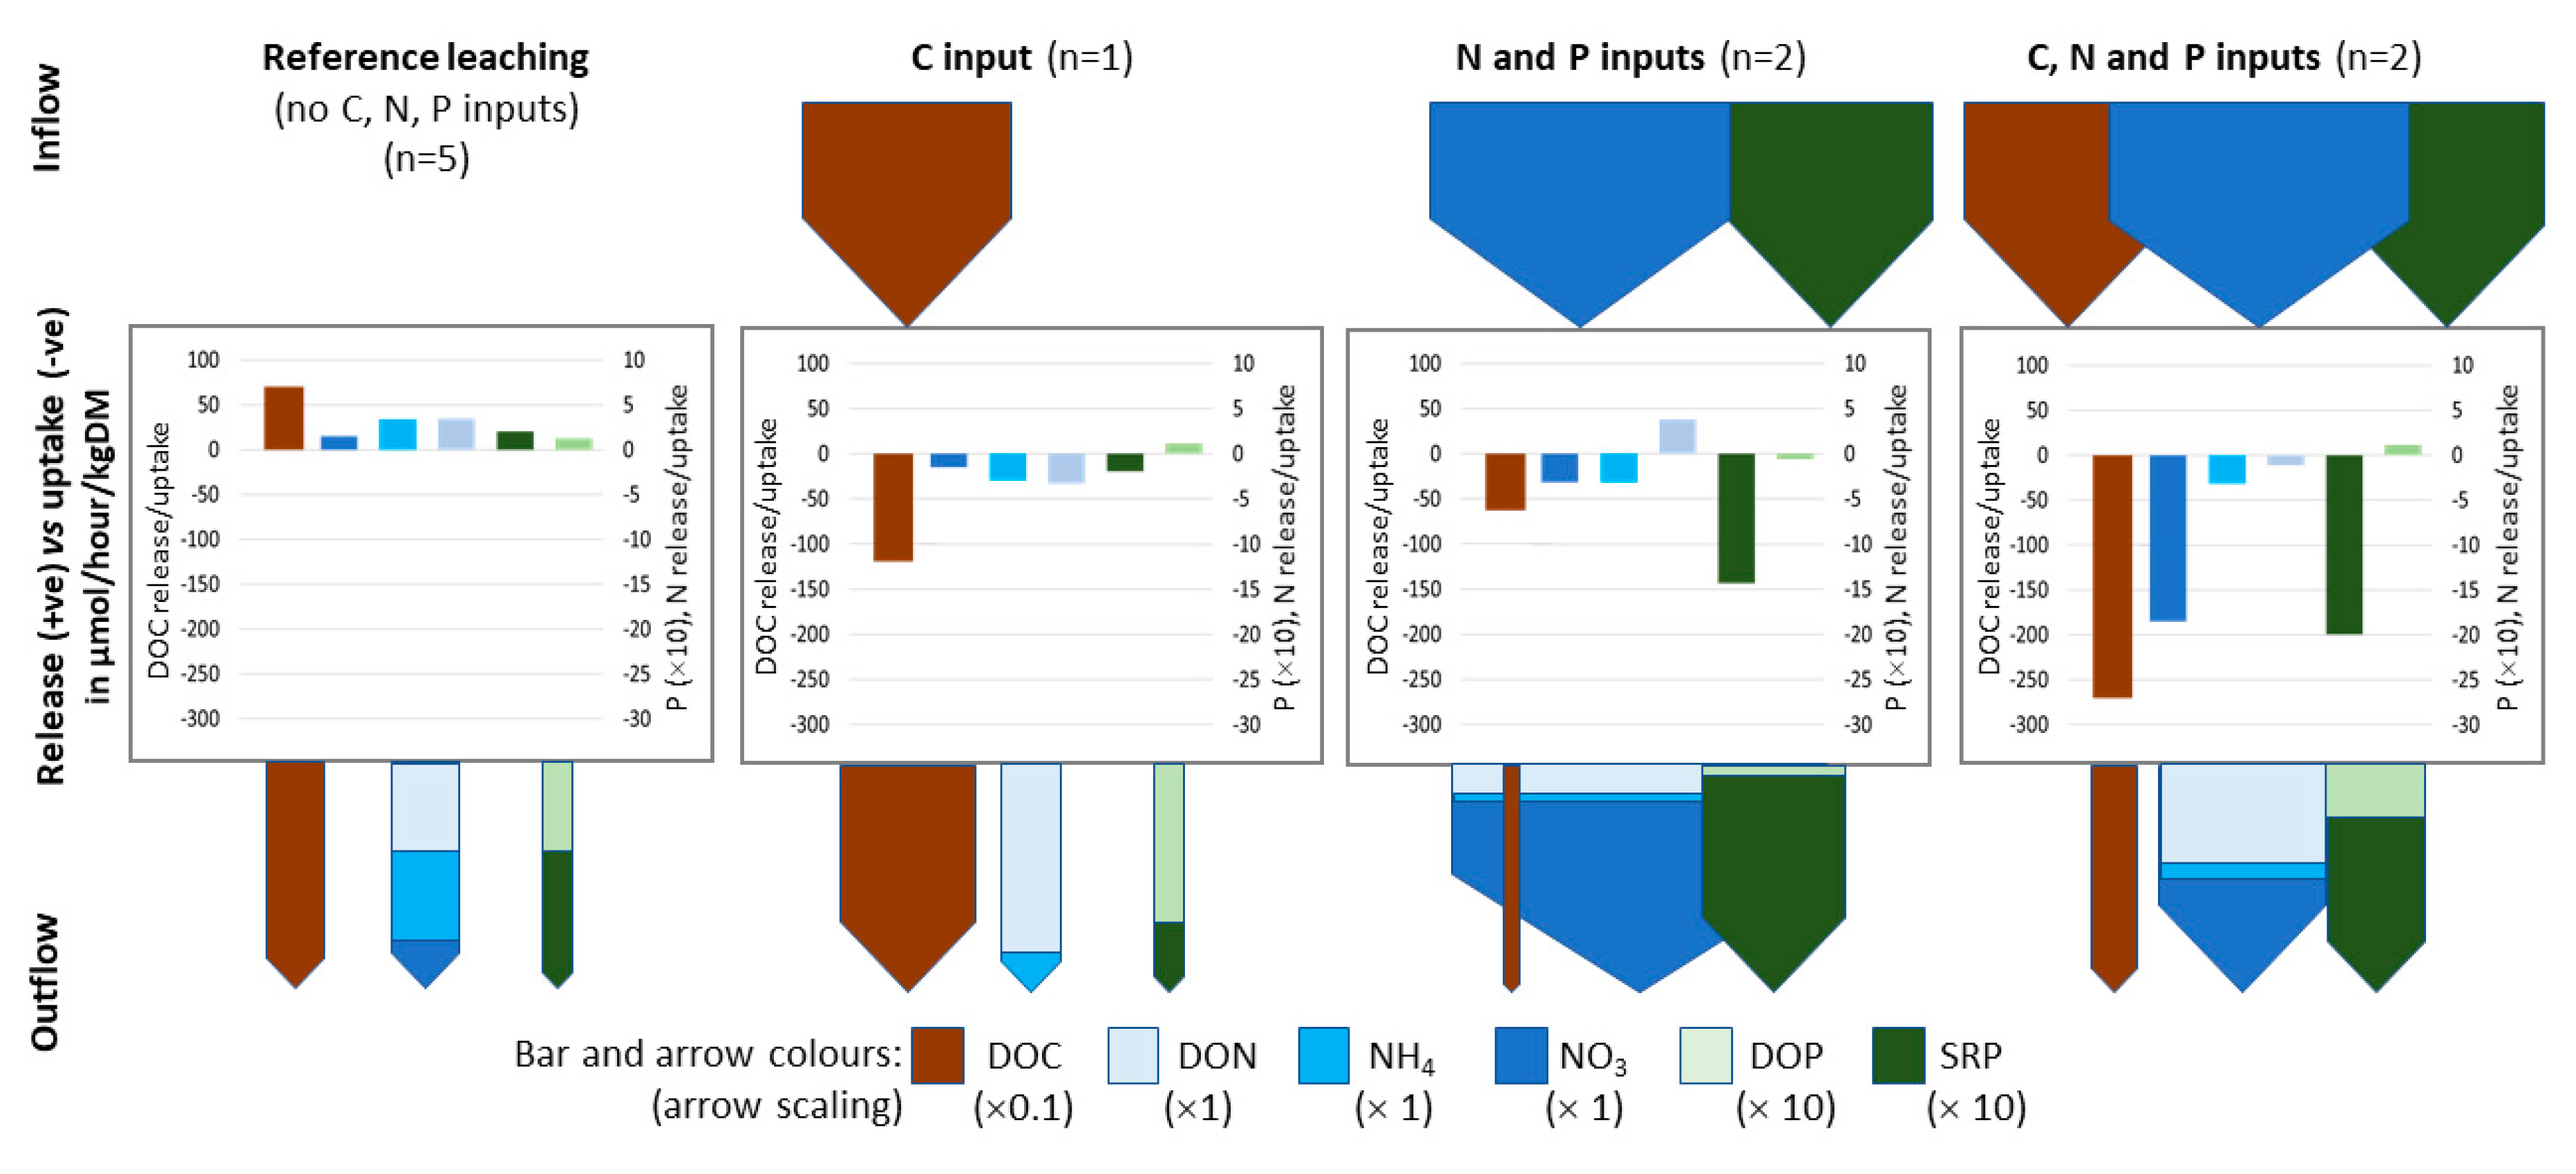
3.3. Column Eluant versus Treatment Inflow Concentrations and Nutrient Uptake Rates

Column data are described progressively in terms of outflow relative to inflow concentrations (Figure 2), then cumulative change in solute mass from a net uptake/release rate (Figure 3) and finally extrapolated gross uptake/release adjusting for the initial rate of background leaching. The outflow-inflow timeseries (Figure 2) showed unstable concentrations early in leaching (<50 h), then a relatively stable latter period (>100 h). Strongly negative values (inflow > outflow) were seen for DOC in the case of Ctreat and CNPtreat, for SRP in the case of NPtreat and CNPtreat and for NO3-N in the case of CNPtreat. Otherwise positive values for NH4-N, DON, and DOP for all treatments showed detectable concentrations despite no addition of that nutrient form. During the leaching period 100–200 h, Bayes factor analysis (BF) values >1 supported evidence of between-treatment differences in the outflow-inflow concentrations that were strong for DOP and NO3 and very strong for DOC and SRP. Conversely, BF<1 for DON and NH4 concentrations led to rejecting evidence for between-treatment differences.
During leaching, eluant pH (in air-excluded samples) was 5.80, 5.97, 6.03, 6.01 and 6.13 for columns Ctreat, NPtreat1, NPtreat2, CNPtreat1, CNPtreat2, respectively. The pH in the inflow was 5.80, 6.10, 6.08 for C, NP and CNP solutions, respectively. The mean DO measured in air-excluded outflow samples was between 6.5 and 6.9 mg L−1 for the C and NP treatments and around 4 mg L−1 for the CNP treatments (Table 1). Mean DO in the inflow was 8.72 ± 0.07 mg L−1. This amounted to O2 uptake rates of 20–24 µmol h−1 kg−1 DM for C and NP treatments, while CNPtreat columns showed double O2 consumption rates (Table 1).
The net solute uptake/release rates are given as cumulative mass plots in Figure 3. Mass of DOC showed minimal net leaching for NPtreat columns in the absence of DOC in the inflow. The CNPtreat columns showed linear net uptake of DOC up to ~2000 µmol C. In contrast, the net uptake of DOC in the Ctreat column, with identical inflow DOC concentration, only attained 500 µmol. Hence, the presence of NP in the treatment increased the net DOC uptake. The net uptake of SRP was zero for the Ctreat column, attained ~11 µmol for the NPtreat columns and 16–19 µmol for CNPtreat columns. Hence, the addition of labile DOC stimulated net SRP uptake for CNPtreat relative to NPtreat. Positive mass balances showed a net release of DOP in all columns.
For NO3-N, the Ctreat column showed zero net change in mass. In contrast to SRP (where NP alone stimulated SRP net uptake), there was only a small net NO3-N uptake in the NPtreat columns, while the CNPtreat columns showed considerable net uptake of NO3-N at a larger rate that increased latterly. No NH4-N was added and hence all concentrations measured in column outflows were net release. However, concentrations were frequently near to detection limits. The NH4-N release was smallest in the Ctreat columns and similar in the other treatments. Likewise, DON showed net release in all columns and this was greatest in NPtreat, moderate in CNPtreat and least in Ctreat. However, a series of samples at analytical detection limits for Ctreat and CNPtreat made the leaching graph ‘stepped’, and it is likely that detection limits and cumulative errors associated with the DON calculation added to the uncertainty in the DON data.
To obtain the mean gross change of C, N and P for each treatment, the solute release from the reference leaching was extrapolated via linear regression to 200 h (600 PV). Then, the change in C, N and P accounting for—and relative to—the extrapolated reference leaching was calculated as a gross change (Figure 4). This calculation of gross uptake allows to identify native sources of C in the sediments potentially able to stimulate NP cycling and similarly native N or P available to stimulate DOC cycling. This is important to consider in the assessment of an overall potential DOC, N or P limitation of the columns. Regarding DOC cycling, for example, the net zero DOC mass change in NPtreat becomes a gross uptake. Thus, added NP stimulated the uptake of native DOC previously leached, while Ctreat and CNPtreat enhanced DOC uptake further. Similarly, a small gross uptake of native NO3, NH4, DON and SRP was predicted for DOCtreat considering the net release in the background leaching. The gross release of DOP was lowest for the NPtreat columns, showing even lower DOP leaching than the background leaching, while DOP leaching in Ctreat and CNPtreat columns was enhanced.
In general, the addition of labile C reduced the leaching of most N and P forms from the sediments, resulting in a gross uptake of NO3-N and SRP when these nutrients were added. Labile C in the CNPtreat increased gross uptake of both native and added NO3-N by 6 times compared to the NPtreat, while gross uptake of SRP was enhanced only 1.5-fold. However, these C-induced effects were different when all inorganic and organic forms of N and P were considered. The enhanced leaching of DON in the NPtreat, for example, countered the uptake of NO3-N there, leading to even greater differences in gross uptake of total N between the NP and the CNP treatment (subject to our caveats regarding DON analytical uncertainties). In contrast to N, the relatively small gross release of DOP minimally changed the positive effects of labile C addition on total P uptake.

3.4. Destructive Sediment Sampling Post-Column Treatments

Although the number of treated column replicates was limited, the results of the destructive sampling are discussed generally in comparison to the background sediment that was not exposed to column treatments. Phosphatase activity was lowest in the background sediment (118 µmol h−1 kg−1), moderate in the NP treatments (~200 µmol h−1 kg−1) and highest in the Ctreat and the CNPtreat (~370 µmol h−1 kg−1; Table 2). Therefore, the addition of labile C stimulated phosphatase production indicative of a higher P demand even in the presence of C, N and P additions at the Redfield ratio. However, values for treated column and background sediment for β-glucosidase activity were in a tight range of 39–42 µmol h−1 kg−1 DM with no apparent patterns. Other enzymes that are required for processing of C in refractory organic matter were not determined so this lack of difference is not conclusive on overall C mineralisation.
For microbial biomass C (MBC) there were similar values for the Ctreat and CNPtreat columns, but nearly an order of magnitude lower for NPtreat (Table 2). The MBN values remained small in the two NPtreat columns and one CNPtreat column, but were two to three times greater in the Ctreat column and one of the CNPtreat columns. The MBP values were very small for the Ctreat column, but an order of magnitude greater for NPtreat and one CNPtreat column (reaching a maximum in one CNPtreat). The background reference suggested that column treatments had reduced MBC concentration by at least a half. The background sediment MBN concentrations were equivalent to those in Ctreat and one of the CNPtreat columns and higher than other columns. In contrast increased MBP concentrations for all but Ctreat relative to background sediment suggested P incorporation into microbial biomass in all columns exposed to P inflow solutions.
We examined the stoichiometry of the microbial biomass following treatments (Table 2) relative to that of the different compartments of column inflow and outflow solute concentrations, the microbial measures on the background sediment, and the total elemental mass of the bulk sediment. The Ctreat column had an extremely large value for MBC:MBP, exceeding also the background sediment ratio, and a moderate value of MBC:MBN, equivalent to one of the CNPtreat and half that of the other CNPtreat and the background sediment ratios. The NPtreat had the lowest ratios of both MBC:MBN and MBC:MBP, less than an order of magnitude smaller than background sediment ratios. The CNPtreat had moderate ratio values between those of Ctreat and NPtreat, but with considerable variability.
In general, the MBC:MBN ratios (1.1–12.3) were far smaller than C:N ratios of the initial sediment solid phase (>119), but within the range of the column solutes of the background leaching (Table 1a; 7–11) and final Ctreat, NPtreat and CNPtreat outflow concentrations (Table 1b; 23, ~0.5, 2 to 6, respectively). Hence, Ctreat with exposure to extreme high C:N inflow resulted in moderate microbial C:N and an outflow C:N three times higher than the background leaching. The NPtreat with exposure to extreme low C:N inflow resulted in low microbial C:N and C-limited outflow. Compared to the MBC:MBP ratios, the range of C:P ratios was much smaller for the background leaching (162–265) and the final Ctreat, NPtreat and CNPtreat outflow concentrations (408, 11–12 and 35–62, respectively). The Ctreat showed exposure to C-only in the inflow resulted in an approximately two times higher C:P ratio in the solute outflow and in increased microbial C:P ratios. The NPtreat with exposure to extremely low C:P inflow resulted in low C:P ratios in both the microbial biomass and the outflow.
In summary, the Ctreat, resulted in moderate (MBC:MBN) to high (MBC:MBP) microbial ratios, the NPtreat consistently low ratios and CNPtreat moderate but varied ratios. The cell ratio magnitudes were proportional to the effects on the outflow relative to inflow solute ratios. The reasons for high variability microbial biomass stoichiometry between the two CNPtreat columns are unclear since Table 1 shows that the O2 uptake was equivalent in CNPtreat1 and CNPtreat2 and Table 2 shows equivalent phosphatase activities.
The org C of the sediments after treatments ranged between 1.08 (CNPtreat) to 1.50 (Ctreat) gC/kg DM. The δ13C values for the post-treatment sediments were smaller than the CNPtreat (−23.96 ± 0.14‰) than for the NPtreat (−25.06 ± 0.26‰) and can be compared to the Ctreat and t = 0 sediment values of −24.15‰ and −24.74‰, respectively (no sample replication). Lowering of the δ13C values for the CNPtreat is a statistically weak indication of some incorporation of the δ13C signal of the glucose C source (−11.4‰).

4. Discussion

We tested the hypothesis that introducing bioavailable DOC to river sediment will increase the uptake rate of ortho-phosphate and inorganic nitrogen relative to exposure without labile DOC. The simple isolated column experiments here support this hypothesis. However, we found interesting differences in the effects on P versus N. One such aspect, as we additionally proposed, was the release of organically-complexed N and P due to nutrient recycling which influenced the overall N and P fate. Microbial attenuation of N associated with DOC presence in rivers is more widely reported than DOC stimulating heterotrophic P uptake [16,26,49]. Examining N, P and C simultaneously, with a stoichiometric viewpoint, is thus novel. The key aspects in interpreting these data were: the starting conditions of the columns concerning C, N or P existing limitations; the differences between N and P leaching versus retention in relation to assimilatory and dissimilatory processes; and confirmation of C, N and P uptake from destructive sampling considering stoichiometric changes.

4.1. Antecedent Sediment Conditions and Background Nutrient Leaching

Nutrient exposure in the columns can be compared to native concentrations for the sampled river in Stutter et al. [33] that may approximate in-situ sediment pore waters in permeable, sandy bed sediments. The native in-situ exposure to SRP in river water of <20 (summer baseflow) to ~100 (storm event) µgP/L can be compared to NP and CNP treatments of 201 µgSRP/L, where higher concentrations remained realistic to rivers subject to agriculture and urbanisation. The native exposure to NO3 of 0.3 to 4.2 mgN/L in river water was equivalent to the 1.4 mg NO3-N/L in NP and CNP treated columns. Whilst the native exposure to river water DOC of 1.4 to 10 mgC/L approximated the 8.3 mgC/L of glucose-C in the C and CNP treatments, it should be noted that a dominance of organic soils in the River Dee leads to native humic DOC (with likely 4–19% of C being ‘biovailable’ according to recent model synthesis; [17]). Accounting for the C-bioavailability scaling factor in [17], the molar C:P ratio of sampled river water at the sediment collection point was 102–124, so that the microbes were acclimatised to the stoichiometry of available nutrients in the CNP treatment inflow (106).
We consider that the sediment was naturally N-depleted (potentially microbially N-limited) at the start of the leaching experiments, with relatively larger potential P and C availability. Initial sediment analysis showed that 1.53 gC kg−1 DM compared to total N < 0.015 gN kg−1 DM gave a molar C:N of the t0 sediment >119. The relatively strong oxalate extractant characterized exchange P reserves as 69 mg kg−1 DM. However, despite the low N condition of the sediment the N leaching in the pre-treatment phase contradicted this by exceeding P leaching (Table 1), with C:N:P stoichiometric ratios of the background leachates being 162–265:19–36:1 considering all nutrient forms (equating to C:N of 7–11). Short, but high DOC peaks at the start of the background DOC leaching (Figure 2) indicated native C being available to drive NP changes in the NP treatment. Potentially the sediment background state favored mineralization of both N and P, but the difference in the fate of N and P may be explained by the native DOC being of low bioavailability to microbes such that N was leached as opposed to consumed, whereas P was potentially retained by sorption capacity remaining at that time.

4.2. The Differences Between N and P Retention and Recycling

The results showed that labile glucose-C reduced nutrient leaching, but also that NP additions resulted in the enhanced consumption of both native and added C, thus, limiting DOC leaching. Figure 2 shows increased DOC net uptake when glucose-C was introduced alongside inorganic N and P relative to glucose-C addition without N and P. Hence, available NP stimulated DOC uptake. However, the individual effects of N and P were not resolved in the current study design. The fate of added glucose-C in terms of Carbon Use Efficiency (CUE; the incorporation into biomass relative to respiration) was not resolved here as in studies that used radio-labelled C [30,50]. Still, the greater O2 consumption for CNPtreat versus Ctreat or NPtreat suggested C was respired. In sediments from a UK oligotrophic, upland river, Brailsford et al. [30] found that uptake of added glucose-C was enhanced particularly by available N addition and this suppressed respiration, suggesting that N regulated microbial C-storage. Their sediments appeared N limited since inorganic P uptake was decreased in the presence of glucose-C when compared to addition of CNP together. Similarly, Mutschlechner et al. [51] observed stimulating effects of P on natural DOC retention in a P-limited headwater stream.
Changes in stoichiometry can inform about the starting position relative to, and movement towards or away from, microbially-favorable macronutrient ratios. The C:N:P range for initial background leaching of 162–265C:19–36N:1P is our closest indication of the in-situ pore water condition, which may be compared to a typical aquatic microbial cellular composition showing ‘plasticity’ between C:P of 47–994 and C:N 2–11 [52]. However, when we added C:N:P simultaneously at the ratio of 106:15:1, the labile C became readily incorporated and outflow solutions attained 35–62C:11–20N:1P. This indicates that C:N:P ratios need to consider not only the quantity, but also the bioavailability of the DOC.
The fate of organic C in aquatic ecosystems across gradients of NP is topical to studies of global C-cycling. Glucose is a model C substrate compound often used in freshwater microbial metabolism studies [29,30] as it represents a naturally occurring C substrate of low molecular weight. However, natural dissolved organic carbon comprises a diverse array of complex simple- to macromolecules [17,53] and may play different roles to glucose-C due to strategies required by certain microbes to access it as an energy source. Hence, future studies should investigate microbial and geochemical interactions associated with mixtures or gradients of DOC forms.
Our primary results concern the importance of glucose-C for regulating P and N uptake. In terms of N, the labile C increased uptake of native and added N. For NPtreat, a very limited NO3 retention occurred that was greatly exceeded by the DON exports (Figure 3). Whilst no glucose-C was added in the NPtreat, a small amount of native C appeared to have driven N and P processing. Conversely, for CNPtreat, the glucose-C stimulated considerable NO3 retention and limited the exports of DON. It is likely that denitrification accounts for some of the NO3 retention in the presence of glucose-C, whereby NO3 concentrations were lowered in the second half of the leaching period (Figure 2), perhaps marking a switch from assimilation and mineralization of N towards denitrification due to decreased DO availability. In comparison, denitrification would have been C-limited in the NPtreat (where DO remained high). Further indications for denitrification are the similar values for microbial biomass N between NPtreat and CNPtreat, suggesting relatively similar N assimilation, compared to the much higher NO3 removal in CNPtreat columns.
In terms of P, the glucose-C increased SRP retention, but not to the same extent as for N. In contrast to N retention, a large amount of SRP retention occurred already for the NPtreat. Then, with the CNPtreat, the SRP retention was only stimulated a further ~50% (Figure 3). One mechanism for this different behaviour for P than N may be a significant proportion of SRP being immobilized via sorption in the NPtreat and, thus, independent of C-stimulated biotic processing. In the presence of C, however, P becomes subject to competition for sorption sites, limiting abiotic factors of P retention. We also cannot rule out an effect of native sediment C contributing to microbial P assimilation in the NPtreat. Already 13 µmol of SRP uptake occurred for NPtreat alongside a net DOC uptake of 620 µmol (Figure 3). Hence, ascribing the portion of abiotic (sorption) and biotic (assimilation) SRP retention by comparing NPtreat versus CNPtreat must be viewed as indicative.
Whilst glucose-C reduced overall N and P leaching, especially depleting inorganic N and P outputs relative to inputs, the presence of C stimulated appreciable losses of DOP, but only limited DON losses. To find the relevance of such experimental findings of altered DOC presence to responses of N and P cycling in real rivers with complex DOC sources and autotrophic-heterotrophic systems now requires further work, drawing on the coupled macronutrient cycling observed through such simulations with simple DOC sources, such as glucose. In a management context the mediation of river C supplies will be best brought about by progressive connection of human-impacted catchments with restored wetlands, riparian forests and other beneficial sources of appropriate organic C [17]. Environmental benefits of increasing river C for protecting aquatic ecosystems from eutrophication by stimulating N and P sequestration in sediments is dependent on (i) the extent to which inorganic N and P uptake is stimulated by C, (ii) the offsetting of the net N or P removal from release of DON or DOP, and (iii) the potential for DON and DOP to contribute to river eutrophication. Our results show that glucose-C addition increased net DOP release by 2 µmol that partially offset the net 7 µmol glucose-stimulated SRP uptake (for CNPtreat relative to NPtreat). However, for N, the glucose-C addition decreased net DON release by 45 µmol in addition to decreasing NO3 release by 160 µmol (for CNPtreat relative to NPtreat). Interactions of NH4 change in the overall N balance were minimal. Hence, there were fundamental differences between the way that C affected N retention and recycling compared to P.
Studies in the region of the sampled river and globally show that dissolved (molybdate-) unreactive P (surrogate of DOP) and DON are appreciable P and N forms in freshwaters [17,33]. Direct access of aquatic biota to organically complexed P has been reported for both heterotrophic [54] and autotrophic microbes [1]. However, these data should be used as an indication only due to (i) the non-specific nature of the analytical definition of non-molybdate reactive P as organically complexed P [55] and (ii) since we found that high dissolved inorganic N:TDN ratios may result in high uncertainty in DON data (see methods). Hence, future studies interpreting DON and DOP cycling in coupled macronutrient cycling studies should use specific analytical techniques to support pool distinctions by colorimetric methods. Examples of such methods include developing direct spectroscopic techniques and analysis following colloidal fractionations schemes isolated P bound to high molecular weight organic and organo-mineral colloids [56].

4.3. Support for Uptake Mechanisms Using Sediment Analyses and Stoichiometric Change

Leaching experiments integrate various, partly interacting processes of retention in a simple inflow-outflow mass balance approach. Our additional measures of enzyme activities, microbial biomass C, N and P, and change in stoichiometry of environmental compartments can support inferences of biotic uptake.
Enzyme activities suggested that microbes invested labile-C in phosphatase production in both the Ctreat and CNPtreat columns (Table 2), despite the stoichiometry of the CNP addition suggesting P was not limiting. Recent work has shown coupling of DOC availability and alkaline phosphatase production in freshwaters [29]. These authors found greater bacterial bound phosphatases in cultures from U.S. pond waters amended with glucose-C than in controls. However, concentration changes of P forms were not evaluated, and the authors noted that the interaction with organic P substrates and phosphate presence warranted investigation. Hence, results here support a further mechanistic C-interaction on C:P coupling in aquatic systems by aquatic microbes potentially utilizing labile C to provide additional ortho-phosphate for uptake even under non-limited conditions.
Where P was added, higher microbial biomass P was shown at the end of the experiment (Table 2), suggesting increased microbial P assimilation. In contrast, microbial biomass P was depleted in the Ctreat. Similarly, microbial biomass C was higher in treatments with C additions than without, although values never exceeded background data. In treatments without C, the MBC was strongly reduced. However, microbial biomass N showed the opposite pattern to P and C, with lowest values occurring in the NPtreat. Due to these inconsistencies among parameters, the partly high variability between duplicates, the high background values, and potentially interfering processes other than assimilation (i.e., adsorption and denitrification), microbial biomass data are hard to interpret. Although Heuck et al. [50] found for mineral forest soils that C-limited microbes in low nutrient soils incorporated greater amounts of glucose-C into microbial biomass with CN, CP and CNP treatments relative to C-alone, this was not apparent in our experiment. To disentangle the various interacting processes behind C stimulation of heterotrophic N and P uptake in sediments, further experimental studies are required using stable isotopes (C,N) and/or radio-labelled P techniques and including water, sediment, and gas analyses.

5. Conclusions

Agriculture has not only impacted streams through excess nutrient inputs, but has also changed the amounts and availability of river organic carbon. These changes led to imbalances in aquatic macronutrient stoichiometry and potential C-limitation of nutrient uptake. Our simplified column study tested the hypothesis that stoichiometric rebalancing may enhance heterotrophic N and P uptake in stream sediments through increasing the amount of bioavailable organic carbon. Despite the limited replication and the use of a model-substrate for carbon, our study demonstrates that additions of labile C can, in fact, stimulate heterotrophic uptake of both inorganic nitrogen and phosphorus under unconstrained hyporheic flow conditions. Similarly, nutrient additions enhanced the microbial consumption of both native and added C, providing evidence for the inter-relationship of macronutrient cycling in stream sediments. The effects of C addition were stronger on N than P uptake, presumably because labile C stimulated both nitrogen assimilation and denitrification, while part of the P uptake may have resulted from stoichiometrically independent abiotic adsorption. Further studies are needed on the effects of organic carbon additions on the various biotic and abiotic uptake pathways for N and P to increase the mechanistic understanding of interactions among these complex and partly competing transformation processes.
Our study also highlights the significance of internal nutrient recycling for net nutrient uptake through leaching of organically complexed forms of N and P. Thus, evaluating the potential of river organic C management to enhance N and P retention in nutrient-polluted systems needs to consider the extent of nutrient recycling and the potential of released DON and DOP to contribute to river eutrophication. Similarly, future mechanistic studies should focus on complex organic carbon sources as well as on more complicated systems, including the effects of, e.g., constrained flow conditions within clogged sediments or heterotrophic-autotrophic interactions on in-stream nutrient retention.
Balancing macronutrient stoichiometry through, e.g., reconnecting landscape beneficial OC sources, may provide river managers with a powerful tool to control diffuse nutrient pollution and alleviate eutrophication in agricultural streams. Our preliminary study gives valuable information on the mechanisms linking available DOC with N and P retention and recycling. The data presented contribute to an important growing body of literature on macronutrient cycling in river systems, where especially mechanistic results linking C and P cycling, and secondary effects on ecosystem status and eutrophication, remain weak. Future work should include complex organic C sources and seek to include solute and gaseous pathways for N and C cycling.

Author Contributions

Conceptualization, M.S. and D.G.; methodology, M.S.; formal analysis, M.S., D.G. and G.W.; writing—original draft preparation, M.S., D.G. and G.W.; writing—review and editing, M.S., D.G. and G.W.; project administration, M.S.; funding acquisition, M.S., D.G. and G.W. All authors have read and agreed to the published version of the manuscript.

Funding

The work by MS was funded The Scottish Government Rural and Environment Science and Analytical Services, under the 2016-21 Environment program. D.G. was supported by program-oriented funding under the research area Earth and Environment of the Helmholtz Association. G.W. was funded by University of Natural Resource and Life Sciences Vienna, Austria.

Acknowledgments

The authors thank H. Watson for chemical analysis of samples.

Conflicts of Interest

The authors declare no conflict of interest. The funders had no role in the design of the study; in the collection, analyses, or interpretation of data; in the writing of the manuscript, or in the decision to publish the results.

References

  1. Jarvie, H.P.; Smith, D.R.; Norton, L.R.; Edwards, F.K.; Bowes, M.J.; King, S.M.; Davies, S.S.; Dils, R.M.; Bachiller-Jarenoa, N. Phosphorus and nitrogen limitation and impairment of headwater streams relative to rivers in Great Britain: A national perspective on eutrophication. Sci. Total Environ. 2018, 621, 849–862. [Google Scholar] [CrossRef] [PubMed] [Green Version]
  2. Carpenter, S.R.; Bennet, E.M. Reconsideration of the planetary boundary for phosphorus. Environ. Res. Lett. 2011, 6, 014009. [Google Scholar] [CrossRef]
  3. Dodds, W.K.; Bouska, W.W.; Eitzmann, J.L.; Pilger, T.J.; Pitts, K.L.; Riley, A.J. Eutrophication of U.S. freshwaters: Analysis of potential economic damages. Envrion. Sci. Technol. 2009, 43, 12–19. [Google Scholar] [CrossRef] [PubMed] [Green Version]
  4. Kronvang, B.; Jeppesen, E.; Conley, D.J.; Sondergaard, M.; Larsen, S.E.; Ovesen, N.B.; Carstensen, J. Nutrient pressures and ecological responses to nutrient loading reductions in Danish streams, lakes and coastal waters. J. Hydrol. 2005, 304, 274–288. [Google Scholar] [CrossRef]
  5. Weigelhofer, G. The potential of agricultural headwater streams to retain soluble reactive phosphorus. Hydrobiologia 2017, 793, 149–160. [Google Scholar] [CrossRef] [Green Version]
  6. Weigelhofer, G.; Welti, N.; Hein, T. Limitations of stream restoration for nitrogen retention in agricultural headwater streams. Ecol. Eng. 2013, 60, 224–234. [Google Scholar]
  7. Graeber, D.; Gelbrecht, J.; Pusch, M.T.; Anlanger, C.; von Schiller, D. Agriculture has changed the amount and composition of dissolved organic matter in Central European headwater streams. Sci. Total Environ. 2012, 438, 435–446. [Google Scholar] [CrossRef]
  8. Graeber, D.; Boëchat, I.G.; Encina-Montoya, F.; Esse, C.; Gellbrecht, J.; Goyenola, G.; Gucker, B.; Heinz, M.; Kronvang, B.; Meerhoff, M.; et al. Global effects of agriculture on fluvial dissolved organic matter. Nature Sci. Rep. 2015, 5. [Google Scholar] [CrossRef] [Green Version]
  9. Heinz, M.; Graeber, D.; Zak, D.; Zwirnmann, E.; Gelbrecht, J.; Pusch, M. Comparison of organic matter composition in agricultural versus forest affected headwaters with special emphasis on organic nitrogen. Environ. Sci. Technol. 2015, 49, 2081–2090. [Google Scholar] [CrossRef]
  10. Kritzberg, E.; Hasselquist, E.M.; Škerlep, M.; Löfgren, S.; Olsson, O.; Stadmark, J.; Valinia, S.; Hansson, L.-A.; Laudon, H. Browning of freshwaters: Consequences to ecosystem services, underlying drivers, and potential mitigation measures. Ambio 2020, 49, 375–390. [Google Scholar] [CrossRef] [Green Version]
  11. Stanley, E.H.; Powers, S.M.; Lottig, N.R.; Buffam, I.; Crawford, J.T. Contemporary changes in dissolved organic carbon (DOC) in human-dominated rivers: Is there a role for DOC management? Freshw. Biol. 2012, 57 (Suppl. S1), 26–42. [Google Scholar] [CrossRef]
  12. Gücker, B.; Silva, R.C.S.; Graeber, D.; Monteiro, J.A.F.; Boechat, I.G. Urbanization and agriculture increase exports and differentially alter elemental stoichiometry of dissolved organic matter (DOM) from tropical catchments. Sci. Total Environ. 2016, 550, 785–792. [Google Scholar] [CrossRef] [PubMed]
  13. Sterner, R.W.; Elser, J.J. Ecological Stoichiometry: The Biology of Elements from Molecules to Biosphere; Princeton University Press: Princeton, NJ, USA, 2002. [Google Scholar]
  14. Dodds, W.K.; Marti, E.; Tank, J.L.; Pontius, J.; Hamilton, S.K.; Grimm, N.B. Carbon and nitrogen stoichiometry and nitrogen cycling rates in streams. Ecosyst. Ecol. 2004, 140, 458–467. [Google Scholar] [CrossRef] [PubMed]
  15. Cross, W.F.; Benstead, J.P.; Frost, P.C.; Thomas, S.A. Ecological stoichiometry in freshwater benthic systems: Recent progress and perspectives. Freshw. Biol. 2005, 50, 1895–1912. [Google Scholar] [CrossRef]
  16. Johnson, L.T.; Royer, T.V.; Edgerton, J.M.; Leff, L.G. Manipulation of the dissolved organic carbon pool in an agricultural stream: Responses in microbial community structure, denitrification, and assimilatory nitrogen uptake. Ecosystems 2012, 15, 1027–1038. [Google Scholar] [CrossRef]
  17. Stutter, M.I.; Graeber, D.; Evans, C.D.; Wade, A.J.; Whiters, P.J.A. Balancing macronutrient stoichiometry to alleviate eutrophication. Sci. Total Environ. 2018, 634, 439–447. [Google Scholar] [CrossRef]
  18. Battin, T.J.; Kaplan, L.A.; Findlay, S.; Hopkinson, C.S.; Marti, E.; Packman, A.I.; Newbold, J.D.; Sabater, F. Biophysical controls on organic carbon fluxes in fluvial networks. Nat. Geosci. 2008, 1, 95–100. [Google Scholar] [CrossRef]
  19. Gardner, J.R.; Doyle, M.W. Sediment-water surface area along rivers: Water column versus benthic. Ecosystems 2018, 21, 1505–1520. [Google Scholar] [CrossRef]
  20. Hansen, A.T.; Dolph, C.L.; Finlay, J.C. Do wetlands enhance downstream denitrification in agricultural landscapes? Ecosphere 2016, 7, e01516. [Google Scholar] [CrossRef]
  21. Taylor, P.G.; Townsend, A.R. Stoichiometric control of organic carbon-nitrate relationships from soils to the sea. Nature 2010, 464, 1178–1181. [Google Scholar] [CrossRef]
  22. Rodríguez-Cardona, B.; Wymore, A.S.; McDowell, W.H. DOC:NO3−ratios and NO3− uptake in forested headwater streams. J. Geophys. Res. Biogeosci. 2016, 121, 205–217. [Google Scholar] [CrossRef] [Green Version]
  23. Wymore, A.S.; Coble, A.A.; Rodríguez-Cardona, B.; McDowell, W.H. Nitrate uptake across biomes and the influence of elemental stoichiometry: A new look at LINX II. Glob. Biogeochem. Cycles 2016, 30, 2016GB005468. [Google Scholar] [CrossRef] [Green Version]
  24. Bernhardt, E.S.; Likens, G.E. Dissolved organic carbon enrichment alters nitrogen dynamics in a forest stream. Ecology 2002, 83, 1689–1700. [Google Scholar] [CrossRef]
  25. Sobczak, W.V.; Findlay, S.; Dye, S. Relationships between DOC bioavailability and nitrate removal in an upland stream: An experimental approach. Biogeochemistry 2003, 62, 309–327. [Google Scholar] [CrossRef]
  26. Ghosh, S.; Leff, L.G. Impacts of labile organic carbon concentration on organic and inorganic nitrogen utilization by a stream biofilm bacterial community. Appl. Environ. Microbiol. 2013, 79, 7130–7141. [Google Scholar] [CrossRef] [PubMed] [Green Version]
  27. Oviedo-Vargas, D.; Royer, T.V.; Johnson, L.T. Dissolved organic carbon manipulation reveals coupled cycling of carbon, nitrogen, and phosphorus in a nitrogen-rich stream. Limnol. Oceanogr. 2013, 58, 1196–1206. [Google Scholar] [CrossRef]
  28. Bechtold, H.A.; Marcarelli, A.M.; Baxter, C.V.; Inouye, R.S. Effects of N, P, and organic carbon on stream biofilm nutrient limitation and uptake in a semi-arid watershed. Limnol. Oceanogr. 2012, 57, 1544–1554. [Google Scholar] [CrossRef]
  29. Anderson, R.O. Evidence for coupling of the carbon and phosphorus biogeochemical cycles in freshwater microbial communities. Front. Mar. Sci. 2018, 5. [Google Scholar] [CrossRef] [Green Version]
  30. Brailsford, F.L.; Glanville, H.C.; Golyshin, P.N.; Marshall, M.R.; Lloyd, C.E.; Johnes, P.J.; Jones, D.L. Nutrient enrichment indices a shift in dissolved organic carbon (DOC) metabolism in oligotrophic freshwater sediments. Sci. Total Environ. 2019, 690, 1131–1139. [Google Scholar] [CrossRef] [Green Version]
  31. Stutter, M.; Wyness, A.; Watson, H.; Dodd, N. Coupled macronutrient cycling in stream biofilms: Effects of stoichiometry, light and temperature. Sci. Total Environ. 2020, 703. [Google Scholar] [CrossRef]
  32. Robbins, C.J.; Yeager, A.D.; Cook, S.C.; Doyle, R.D.; Maurer, J.R.; Walker, C.M.; Back, J.A.; Whigham, D.F.; King, R.D. Low-level dissolved organic carbon subsidies drive a tropic upsurge in a boreal stream. Freshw. Biol. 2020, 65, 920–934. [Google Scholar] [CrossRef]
  33. Stutter, M.I.; Langan, S.J.; Cooper, R.J. Spatial and temporal dynamics of stream water particulate and dissolved N, P and C forms along a catchment transect, NE Scotland. J. Hydrol. 2008, 350, 187–202. [Google Scholar] [CrossRef]
  34. Haggerty, R.; Wondzell, S.M.; Johnson, M.A. Power-law residence time distribution in the hyporheic zone of a 2nd-order mountain stream. Geophys. Res. Lett. 2002, 29, 18-1–18-4. [Google Scholar] [CrossRef] [Green Version]
  35. Farmer, V.C.; Russell, J.D.; Smith, B.F.L. Extraction of Inorganic Forms of translocated Al, Fe and Si from a podzol Bs horizon. J. Soil Sci. 1983, 34, 571–576. [Google Scholar] [CrossRef]
  36. Graeber, D.; Gelbrecht, J.; Kronvang, B.; Gücker, B.; Pusch, M.T.; Zwirnmann, E. Technical Note: Comparison between a direct and the standard, indirect method for dissolved organic nitrogen determination in freshwater environments with high dissolved inorganic nitrogen concentrations. Biogeosciences 2012, 9, 4873–4884. [Google Scholar] [CrossRef] [Green Version]
  37. Graeber, D.; Gücker, B.; Zwirnmann, E.; Kronvang, B.; Weih, C.; Gelbrecht, J. Dialysis is superior to anion exchange for removal of dissolved inorganic nitrogen from freshwater samples prior to dissolved organic nitrogen determination. Environ. Chem. 2012, 9, 529–536. [Google Scholar] [CrossRef]
  38. Jackson, C.R.; Tyler, H.L.; Millar, J.J. Determination of microbial extracellular enzyme activity in waters, soils and sediments using high throughput microplate assays. J. Vis. Exp. 2013. [Google Scholar] [CrossRef] [Green Version]
  39. Vance, E.D.; Brookes, P.C.; Jenkinson, D.S. An extraction method for measuring soil microbial biomass C. Soil Biol. Biochem. 1987, 19, 703–707. [Google Scholar] [CrossRef]
  40. Brookes, P.C.; Powlson, D.S.; Jenkinson, D.S. Measurement of soil microbial biomass phosphorus in soil. Soil Biol. Biochem. 1982, 14, 319–329. [Google Scholar] [CrossRef]
  41. Wu, J.; Joergensen, R.G.; Pommerening, B.; Chaussod, R.; Brookes, P.C. Measurement of soil microbial biomass C by fumigation-extraction—An automated procedure. Soil Biol. Biochem. 1990, 22, 1167–1169. [Google Scholar] [CrossRef]
  42. Brookes, P.C.; Landman, A.; Pruden, G. Chloroform fumigation and release of soil N: A rapid direct extraction method to measure microbial biomass N in soil. Soil Biol. Biochem. 1985, 17, 837–842. [Google Scholar] [CrossRef]
  43. Wu, J.; He, Z.-L.; Wei, W.-X.; O’Donell, A.G.; Syers, J.K. Quantifying microbial biomass phosphorus in acid soils. Biol. Fertil. Soils 2000, 32, 500–507. [Google Scholar] [CrossRef]
  44. Rouder, J.N.; Speckman, P.L.; Sun, D.; Morey, R.D.; Iverson, G. Bayesian t tests for accepting and rejecting the null hypothesis. Psychon. Bull. Rev. 2009, 16, 225–237. [Google Scholar] [CrossRef]
  45. Faulkenberry, T.J. A simple method for teaching bayesian hypothesis testing in the brain and behavioral sciences. J. Undergrad. Neurosci. Educ. 2018, 16, A126–A130. [Google Scholar] [PubMed]
  46. R Core Team. R: A Language and Environment for Statistical Computing; R Foundation for Statistical Computing: Vienna, Austria, 2019. [Google Scholar]
  47. Morey, R.D.; Rouder, J.N. BayesFactor: Computation of Bayes factors for Common Designs. R package version 0.9.12-4.2. 2018. Available online: https://cran.r-project.org/web/packages/BayesFactor/BayesFactor.pdf (accessed on 25 November 2020).
  48. Kass, R.E.; Raftery, A.E. Bayes factors. J. Am. Stat. Assoc. 1995, 90, 773–795. [Google Scholar] [CrossRef]
  49. Lansdown, K.; Heppell, C.M.; Trimmer, M.; Binley, A.; Heathwaite, A.L.; Bryne, P.; Zhang, H. The interplay between transport and reaction rates as controls on nitrate attenuation in permeable, streambed sediments. J. Geophys. Res. Biogeosci. 2015, 120, 1093–1109. [Google Scholar] [CrossRef] [Green Version]
  50. Hueck, C.; Weig, A.; Spohn, M. Soil microbial biomass C:N:P stoichiometry and microbial use of organic phosphorus. Soil Biol. Biochem. 2015, 85, 119–129. [Google Scholar] [CrossRef]
  51. Mutschlechner, A.E.; Guerard, J.J.; Jones, J.B.; Harms, T.K. Phosphorus enhances uptake of dissolved organic matter in boreal streams. Ecosystems 2018, 21, 675–688. [Google Scholar] [CrossRef]
  52. Godwin, C.M.; Cotner, J.B. Stoichiometric flexibility in diverse aquatic heterotrophic bacteria is coupled to differences in cellular phosphorus quotas. Front. Microbiol. 2015. [Google Scholar] [CrossRef] [Green Version]
  53. McLaughlin, C.; Kaplan, L.A. Biological lability of dissolved organic carbon in streamwater and contributing terrestrial sources. Freshw. Biol. 2013, 32, 1219–1230. [Google Scholar] [CrossRef]
  54. Tapia-Torres, Y.; Rodriguez-Torres, M.D.; Elser, J.L.; Islas, A.; Souza, V.; Garcia-Olivia, F.; Oleda-Almerez, G. How to live with phosphorus scarcity in soil and sediment: Lessons from bacteria. Appl. Environ. Microb. 2016, 82, 4652–4661. [Google Scholar] [CrossRef] [PubMed] [Green Version]
  55. Nagul, E. A The molybdenum blue reaction for the determination of orthophosphate revisited: Opening the black box. Anal. Chim. Acta 2015. [Google Scholar] [CrossRef] [PubMed] [Green Version]
  56. Pokrovsky, O.S.; Manasypov, R.M.; Loiko, S.V.; Shirikova, L.S. Organic and organo-mineral colloids of discontinuous permafrost zone. Geochim. Cosmochim. Acta 2016, 188, 1–20. [Google Scholar] [CrossRef]
Figure 1. Scematic of one of the column replicates used in the exposure of sediments to solute nutrient treatments simulating saturated benthic conditions.
Water 12 03321 g001
Figure 2. Outflow minus inflow concentrations of dissolved organic carbon (DOC), NO3-N, soluble reactive P (SRP), NH4-N, dissolved organic nitrogen (DON) and dissolved organic P (DOP) for the five columns (data points) and average lines for the three Table 200 h of leaching (~600 PV equivalents). The shaded area from 100 to 200 h represented the relatively stable period during which the Bayes factor statistic (BF; with relative % accuracy) was derived to denote evidence that concentrations during that period differed between treatments (insignificant evidence of difference for DON and NH4-N, whereas very strong evidence in all other cases). It should be noted that DON and DOP analytical data were characterized as susceptible to high random errors in 47% of samples with high DIN:TDN and 21% of samples with high SRP:TDN (Section 2.3).
Water 12 03321 g002
Figure 3. Cumulative net release and uptake mass (positive and negative values, respectively) of DOC, NO3-N, SRP, NH4-N, DON and DOP (total amounts in µmol) for the five columns (data points) and average lines for the three treatments (accounting for duplicated columns). Data show µmol cumulative change over ~200 h of leaching (~600 PV equivalents).
Water 12 03321 g003
Figure 4. Overall summary, showing (i) inflow relative concentrations (upper arrow widths; treatment concentrations), (ii) gross cycling rates in the column (central bar charts by bar height; average µmol h−1 kg−1 DM where positive and negative bars denote release and uptake, respectively) and (iii) outflow relative concentrations (lower arrow widths; averaging final three column outflow samples). The arrow widths denote the inflow and outflow DOC, total dissolved N and P molar concentrations (at scaling C × 0.1, N forms × 1, P forms × 10) and the N and P speciation in the outflow arrows is proportional to the total arrow length. The leftmost column chart is the reference leaching cycling rate (µmol h−1 kg−1 DM) then the three rightmost charts are the gross cycling rates for C, NP and CNP treated columns. The gross rate comprises the net rates adjusted by the reference leaching rate (the incorporation of an internal nutrient source extrapolated from the background leaching). As one example we consider value derivation for the Ctreat. The reduction in DOC concentration between column inflow (upper wider brown arrow) and outflow (lower, narrower brown arrow) equals −49 µmolC/h/kg DM net uptake (in the central bar chart), but considering the extrapolation of the background (sediment-derived) release of +70 µmolC/h/kg DM this becomes the −119 µmolC/h/kg DM gross uptake depicted here. The Ctreat inflow contains no N or P, yet SRP shows −2 µmolP/h/kg DM gross uptake. This is possible since all of the background +2 µmolP/h/kg DM SRP release is retained (even though no additional treatment P is added). A further example of this gross calculation effect is that the NPtreat has −63 µmolC/h/kg DM gross uptake indicative of the +70 µmolC/h/kg DM background (internal) DOC release, leaving a small DOC outflow concentration (approximating +7 µmolC/h/kg DM) when no C was added in the treatment. Values are derived from Table 1.
Water 12 03321 g004
Table 1. Column physico-chemical and leaching parameters showing (a) the concentrations (and molar ratios) of background leaching prior to treatments, and (b) the net uptake (negative values) vs. release (positive values) rates during exposure to treatment chemistry averaged over 600 PV equivalents.
ParametersReference LeachingColumns
CtreatNPtreat1NPtreat2CNPtreat1CNPtreat2
(a)
Sediment DMg 5553.852.452.453.7
Column PVmL 5.96.156.35.8
NO3-Nµmol/L 0.71.92.65.69.3
NH4-Nµmol/L 13.49.78.910.64.6
SRPµmol/L 0.480.520.550.480.65
DOCµmol/L 211151172196233
DONµmol/L 14.710.05.410.47.4
DOPµmol/L 0.350.420.350.260.39
C:N:P of background leachingMolar ratio 251:34:1162:23:1190:19:1265:36:1226:21:1
(b)
NO3-Nµmol h−1 kg−1 DM1.50.0−2.2−1.2−15.7−18.3
NH4-Nµmol h−1 kg−1 DM3.40.50.30.20.30.1
SRPµmol h−1 kg−1 DM0.20.0−1.1−1.3−1.9−1.7
DOCµmol h−1 kg−1 DM70.2−49.16.28.8−208.5−192.8
DONµmol h−1 kg−1 DM3.50.29.15.53.01.8
DOPµmol h−1 kg−1 DM0.130.20.10.10.30.2
C:N:P of outflow at ~600 PVMolar ratio 408:18:111:24:112:28:135:20:162:11:1
Eluant DO at ~500 PVmgO2/Lnd6.56 ± 0.036.95 ± 0.016.93 ± 0.024.12 ± 0.363.98 ± 0.29
O2 uptakeµmol h−1 kg−1 DMnd23.620.821.653.153.4
Legend: nd, not determined; DM, dry matter; PV, pore volume; O2 uptake was calculated from triplicate DO samples taken after ~500 PVs; Cycling rates show time-averaged rate during the treatment phase (0–600 PV of leaching), where for both the mass balance of output-input results in +ve and −ve values showing net release and net uptake, respectively. The net rates shown are those from column outflow-inflow concentrations without adjustment to the reference leaching.
Table 2. Sediment microbial biomass CNP and phosphatase enzyme activity determined on destructive sampling of the columns after the treatments. To show background microbial conditions, the prepared packing sediment was used after storage at 5 °C for the experimental duration.
Column TreatmentMBCMBNMBPMBC:MBNMBC:MBPPhosphatase Activity
(µmol/kg DM)(µmol/kg DM)(µmol/kg DM)Molar RatioMolar Ratio(µmol h−1 kg−1 DM)
Background41703703.211.31322118
Ctreat20673200.36.56644384
NPtreat11081024.81.122182
NPtreat23111506.52.148212
CNPtreat118001464.212.3429369
CNPtreat2220239510.75.6205362
Publisher’s Note: MDPI stays neutral with regard to jurisdictional claims in published maps and institutional affiliations.

