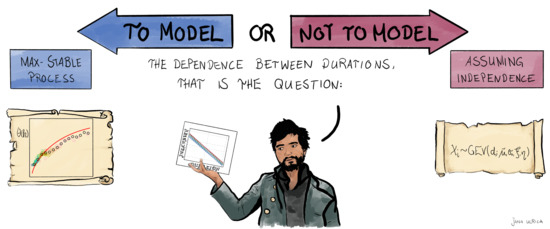
Evaluating the Performance of a Max-Stable Process for Estimating Intensity-Duration-Frequency Curves


Abstract
:
1. Introduction
2. Methods and Data
2.1. Estimation of IDF Curves
2.1.1. Using the Duration-Dependent GEV
2.1.2. Using a Max-Stable Process
2.2. Verification and Model Comparison
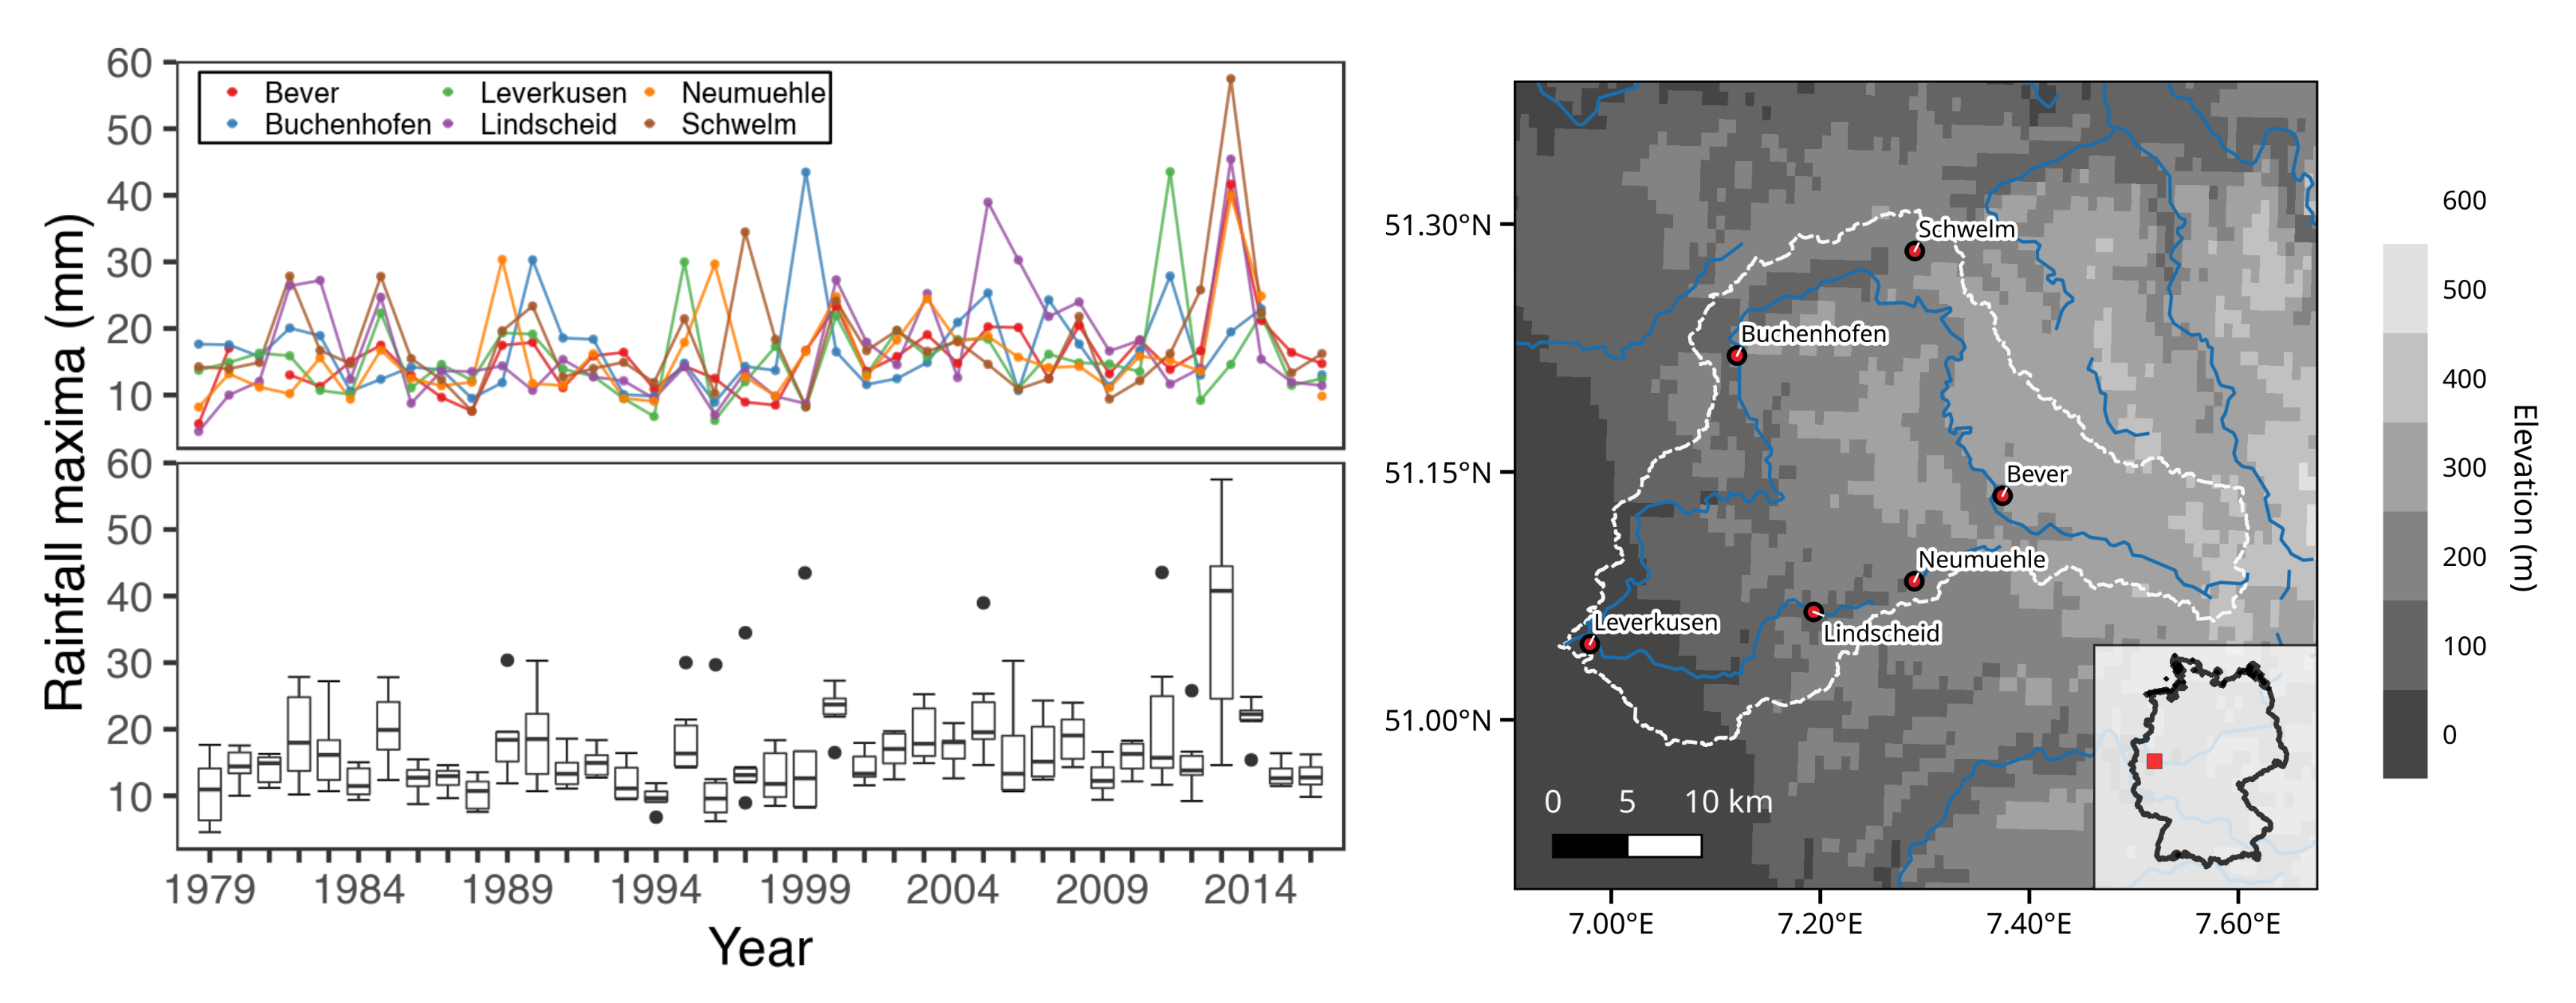
2.3. Data
2.3.1. Synthetic Data
2.3.2. Observations
3. Results
3.1. Case Study
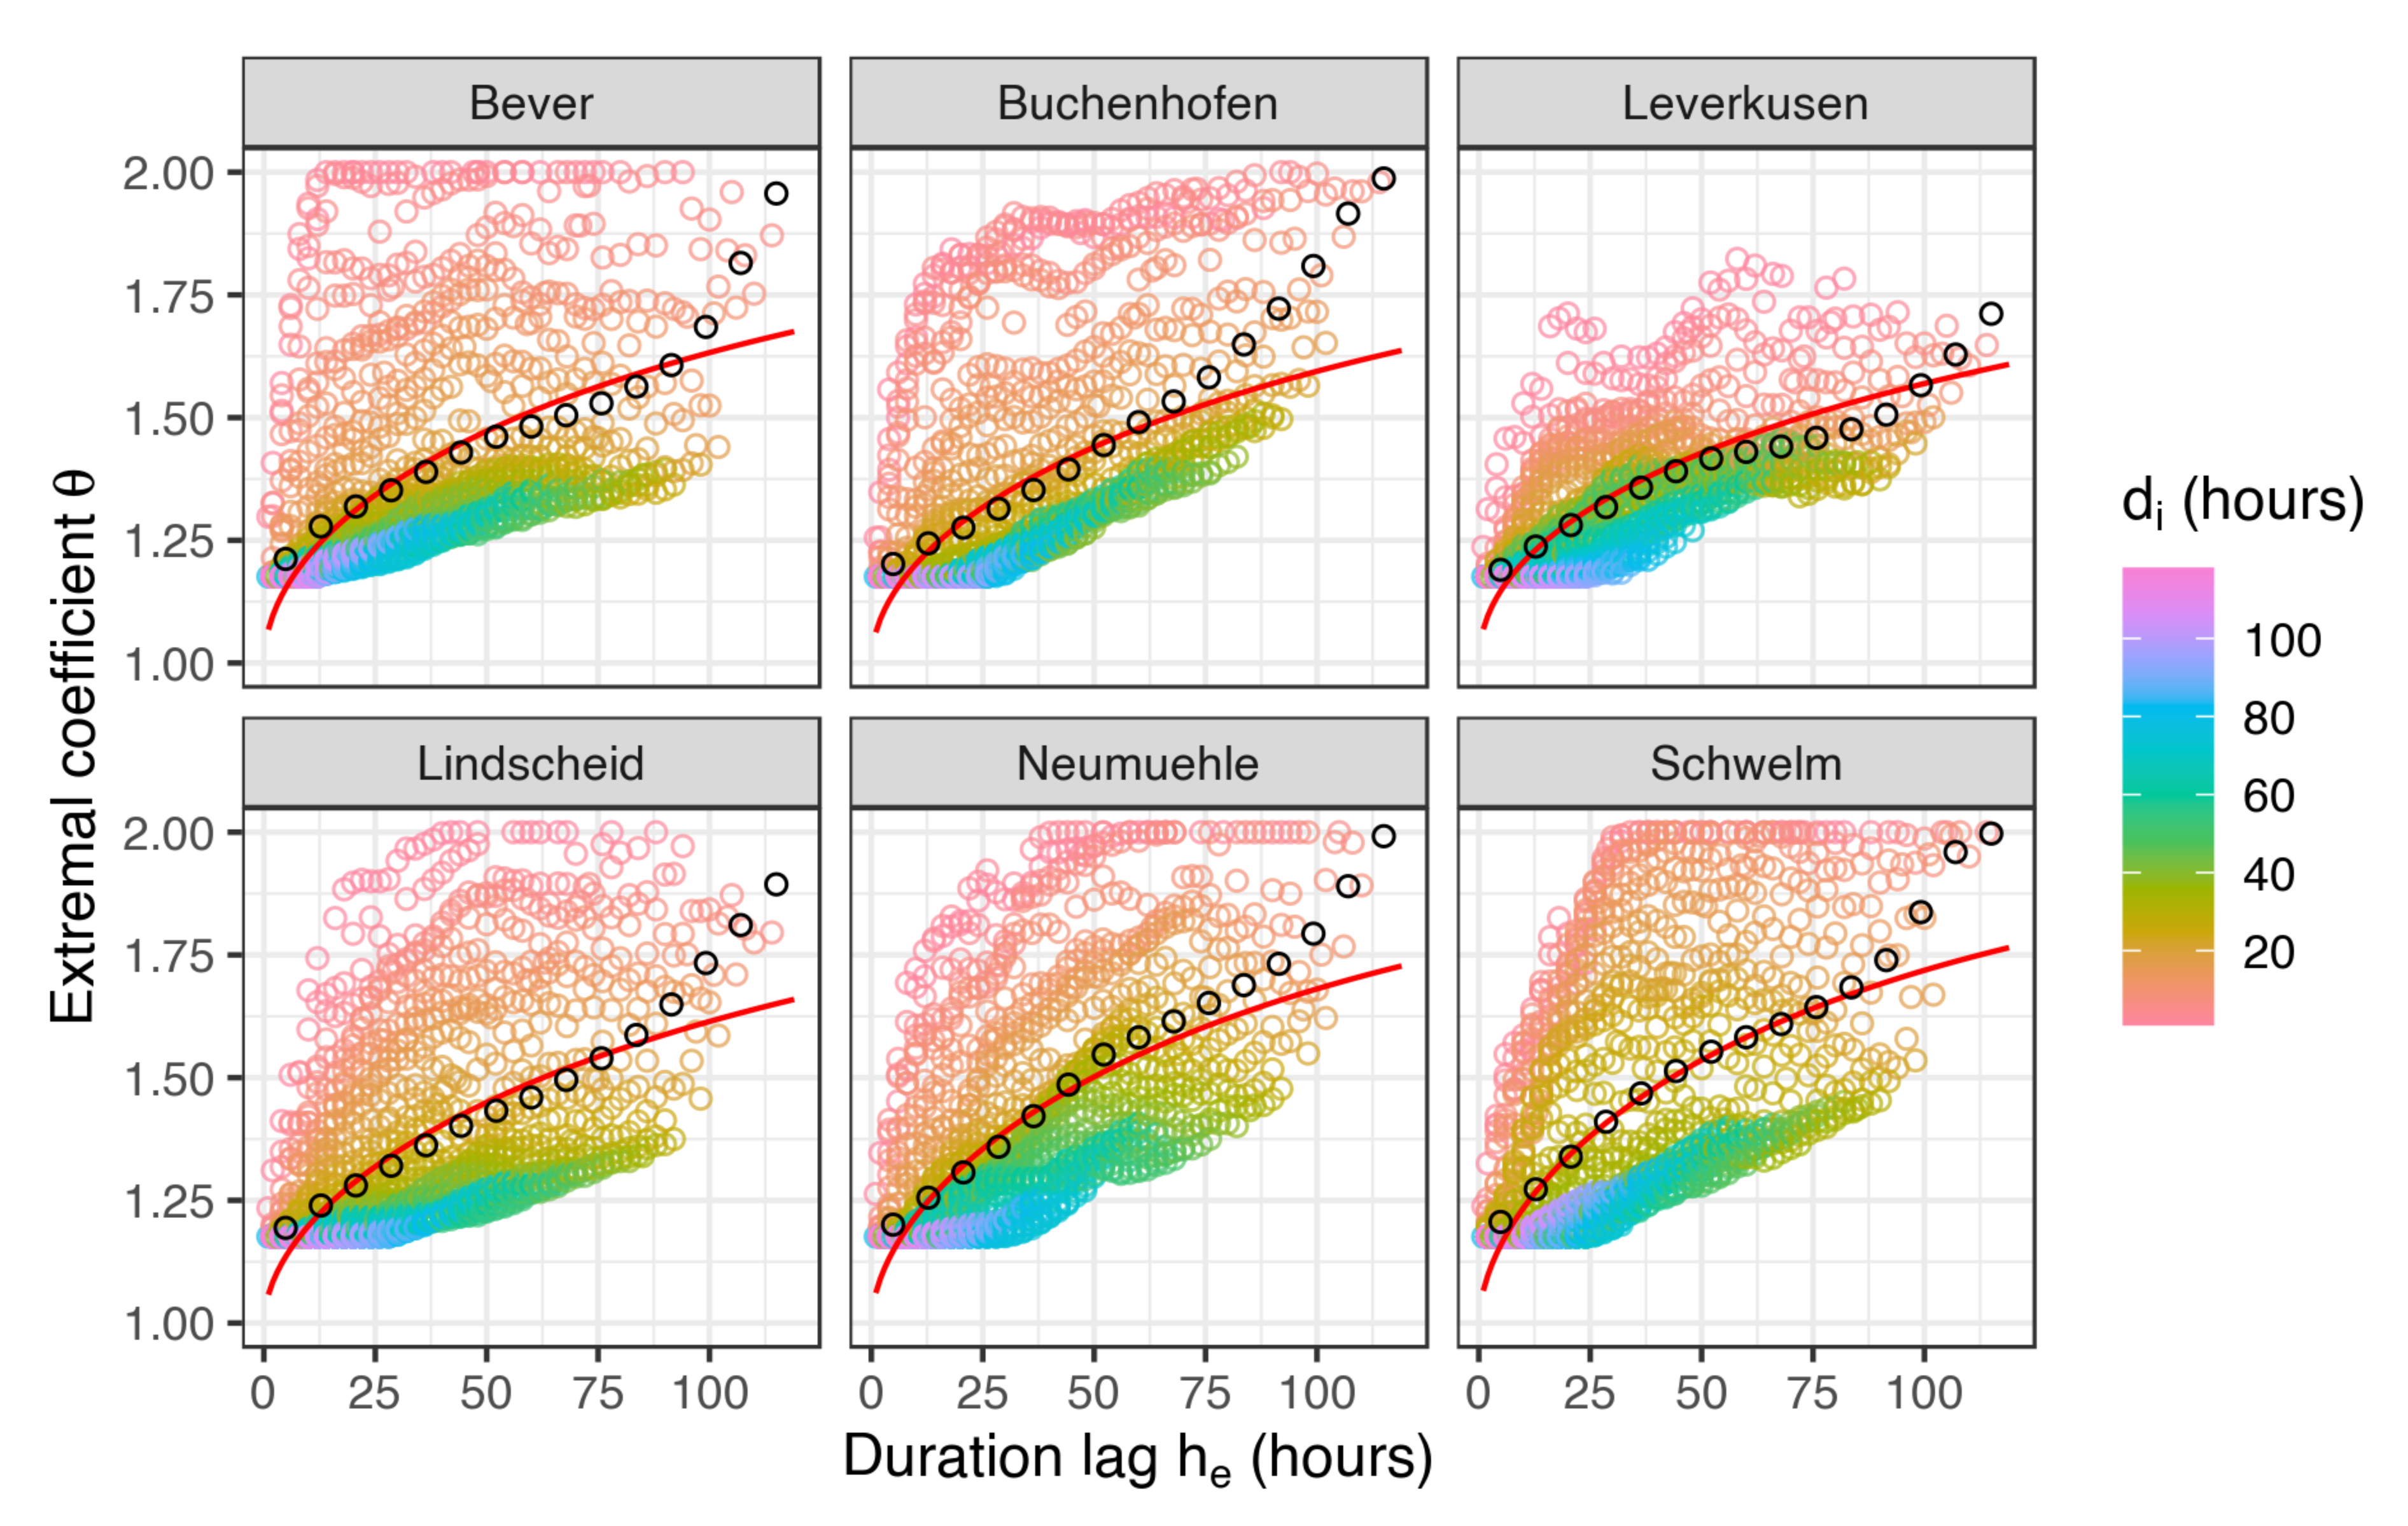
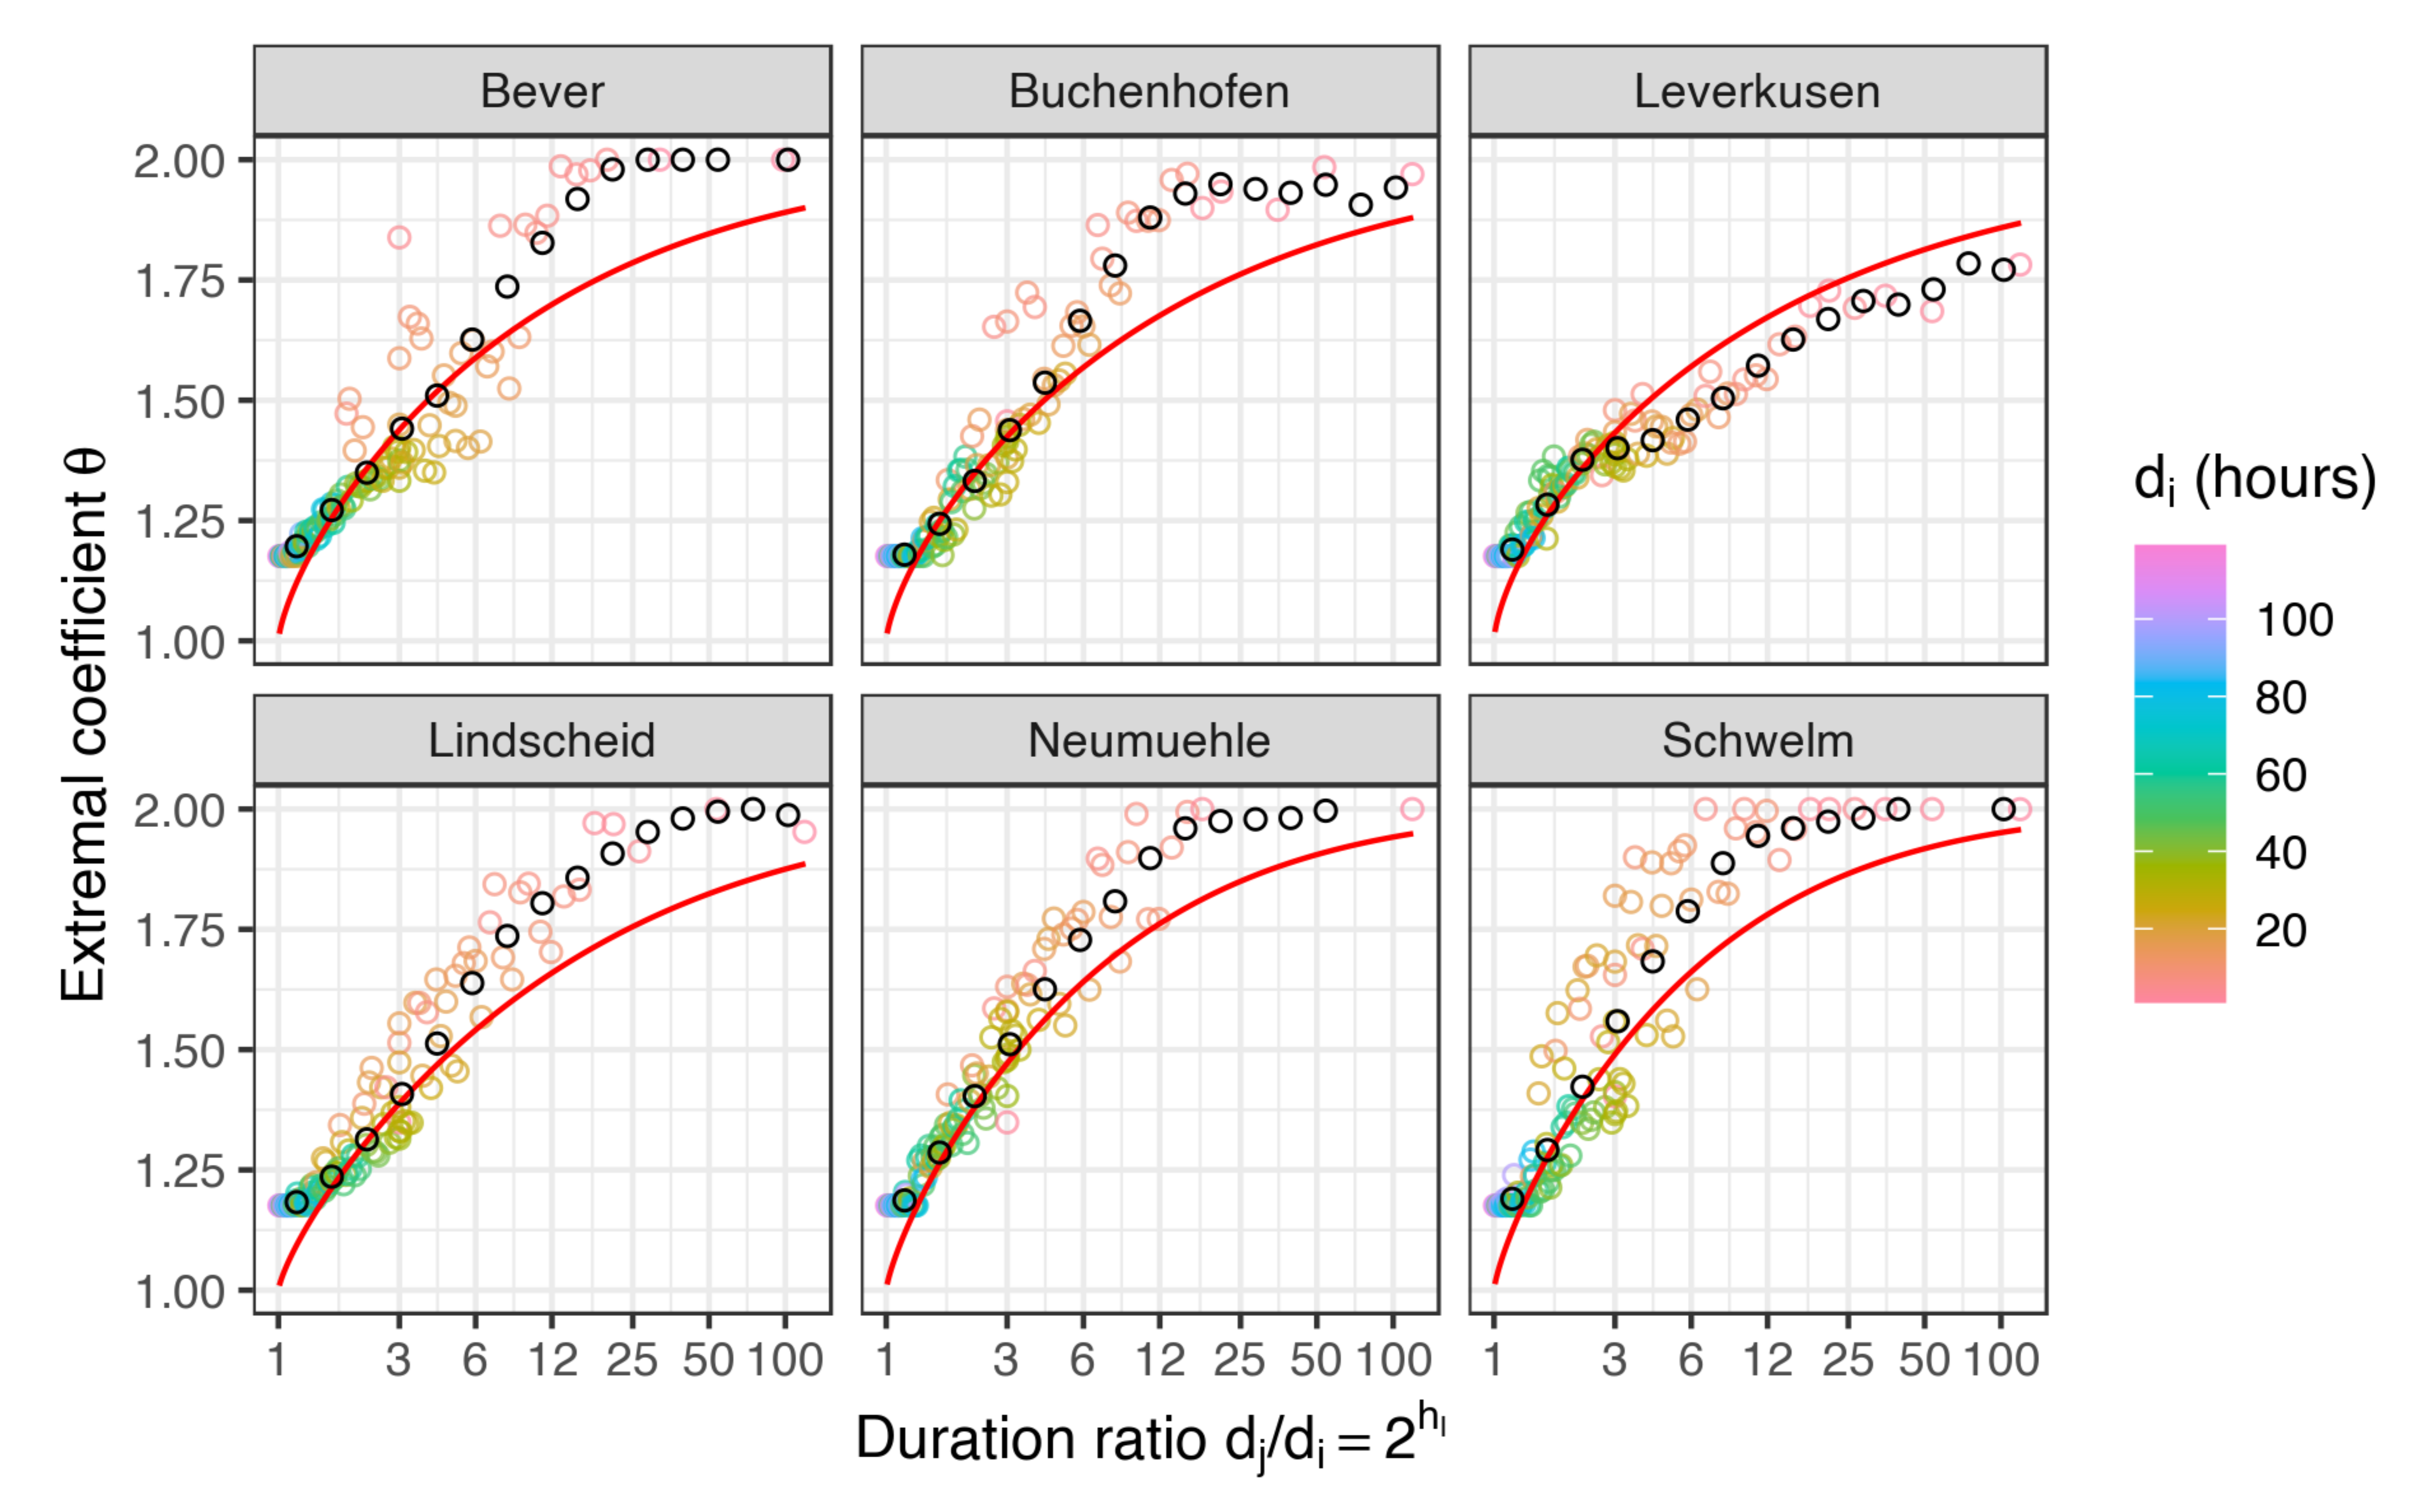
3.1.1. Structure of the Extremal Dependence
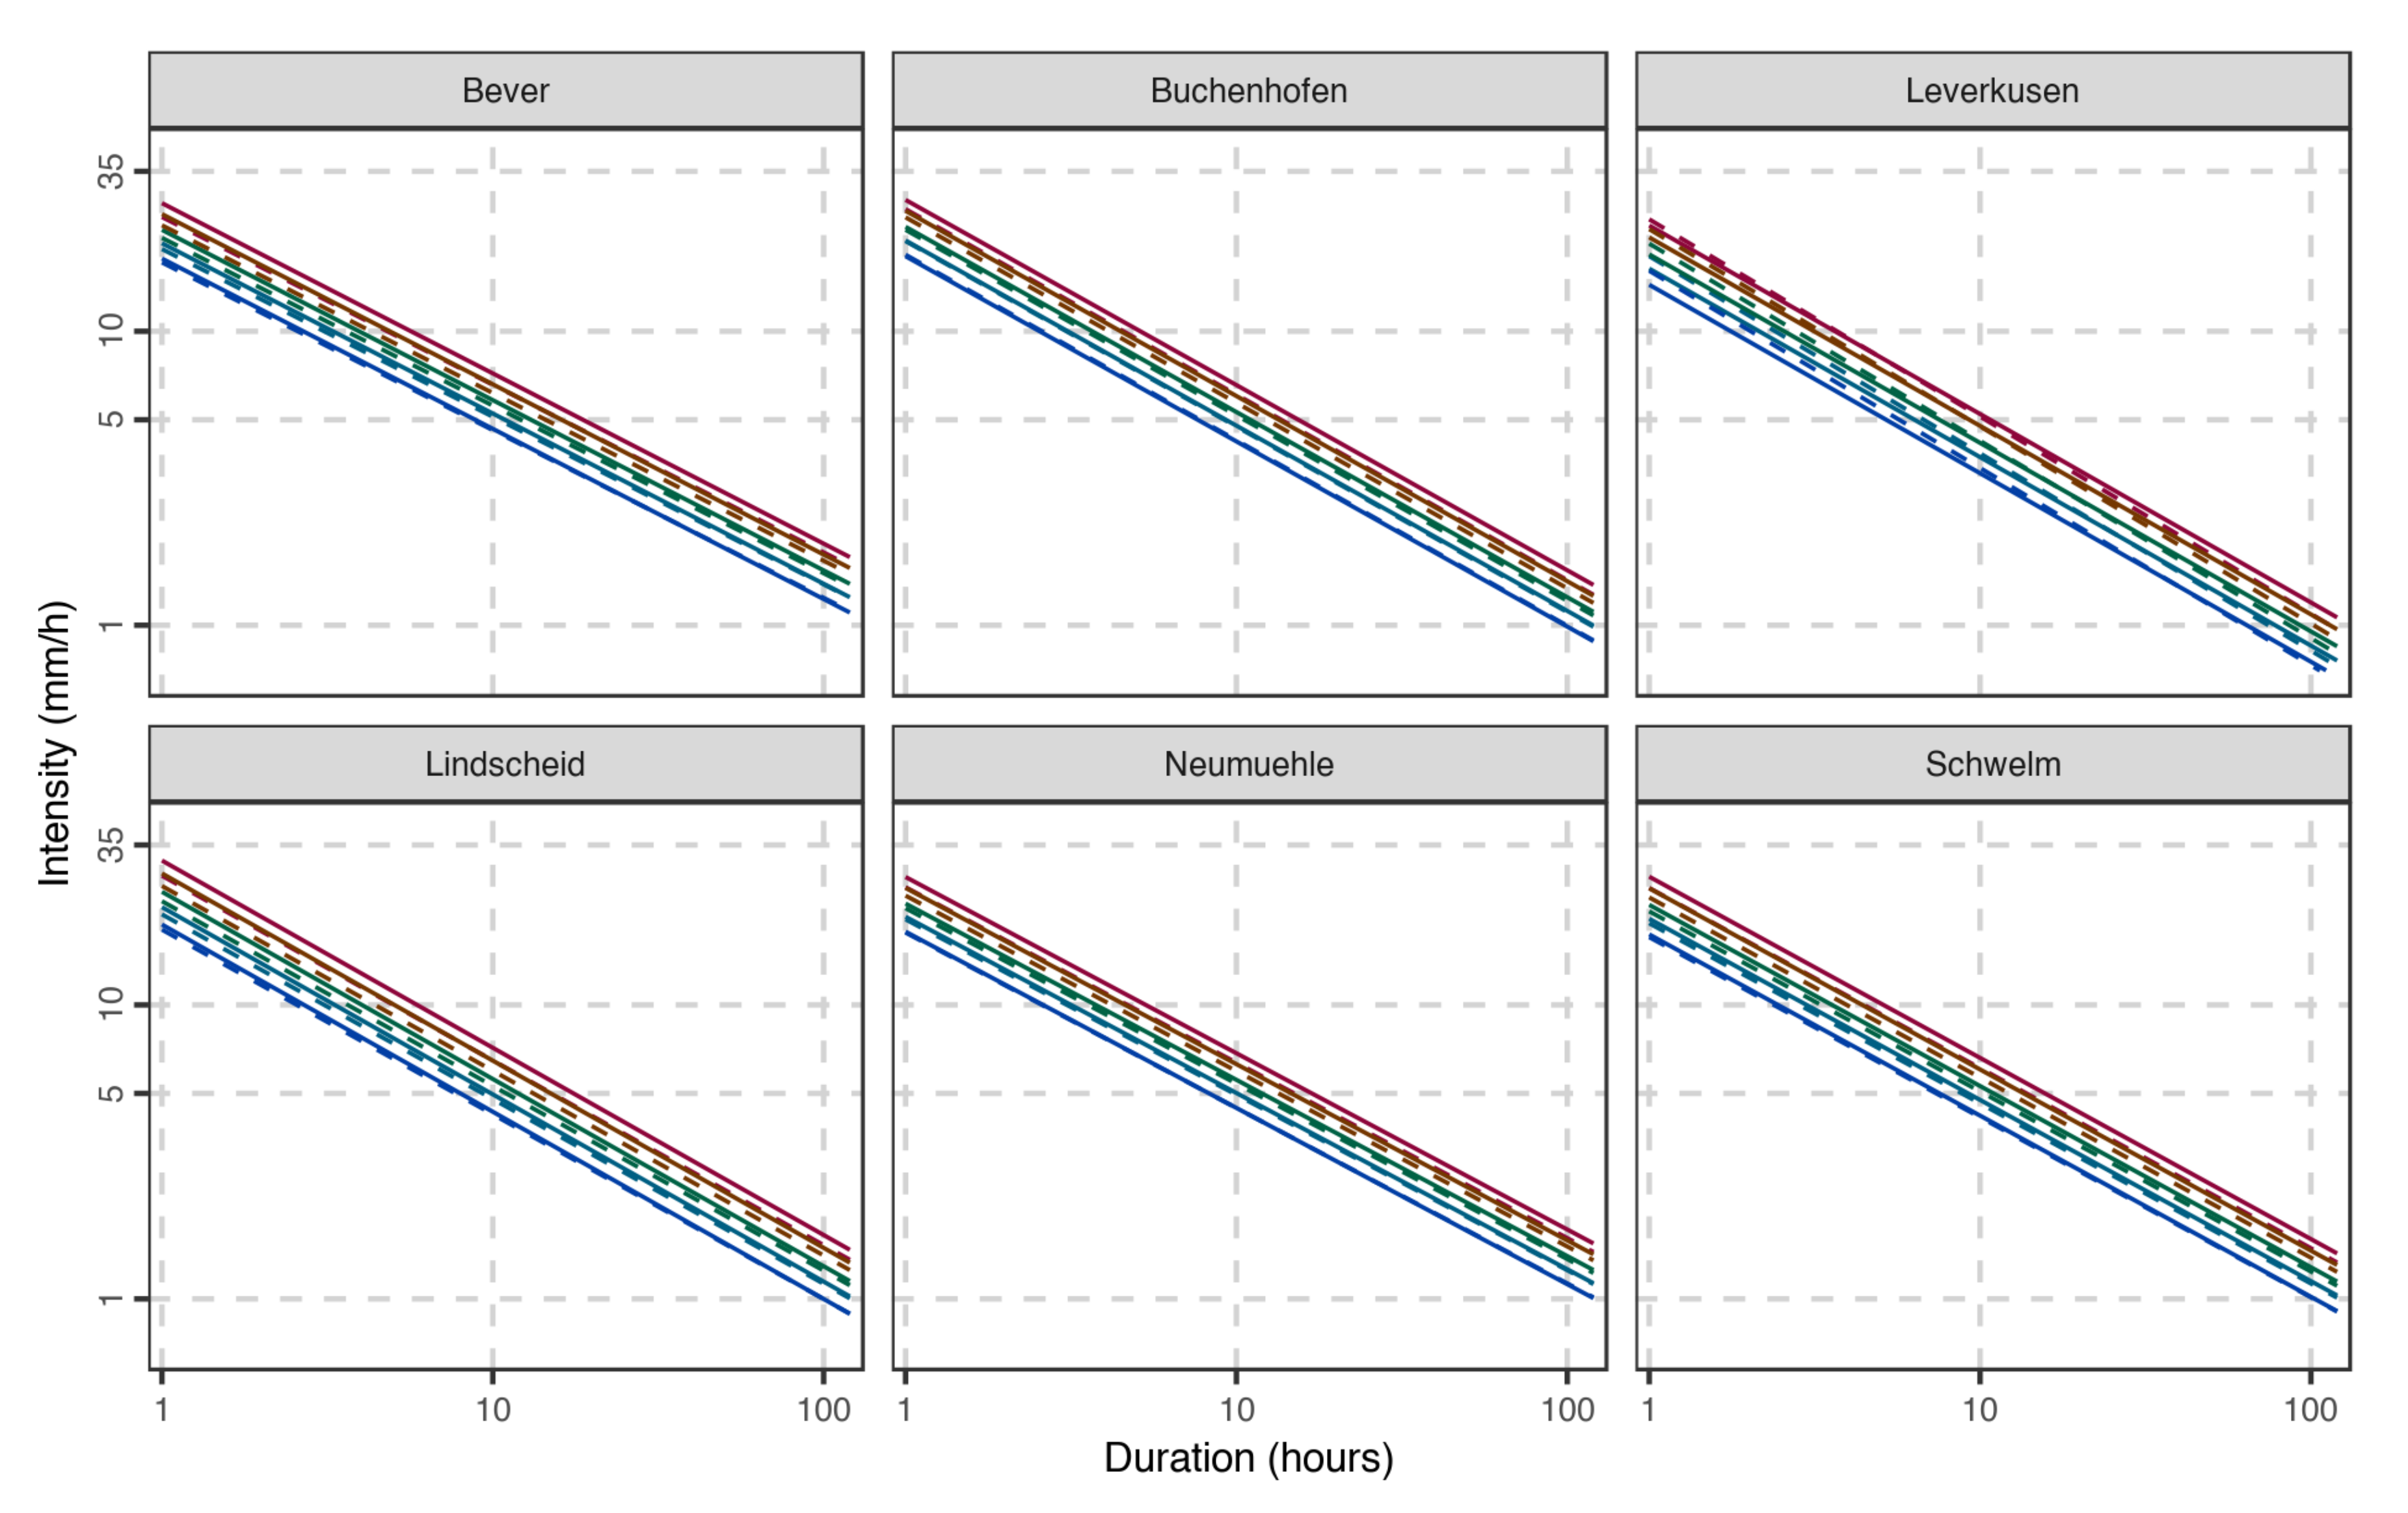
3.1.2. Estimation of IDF Curves
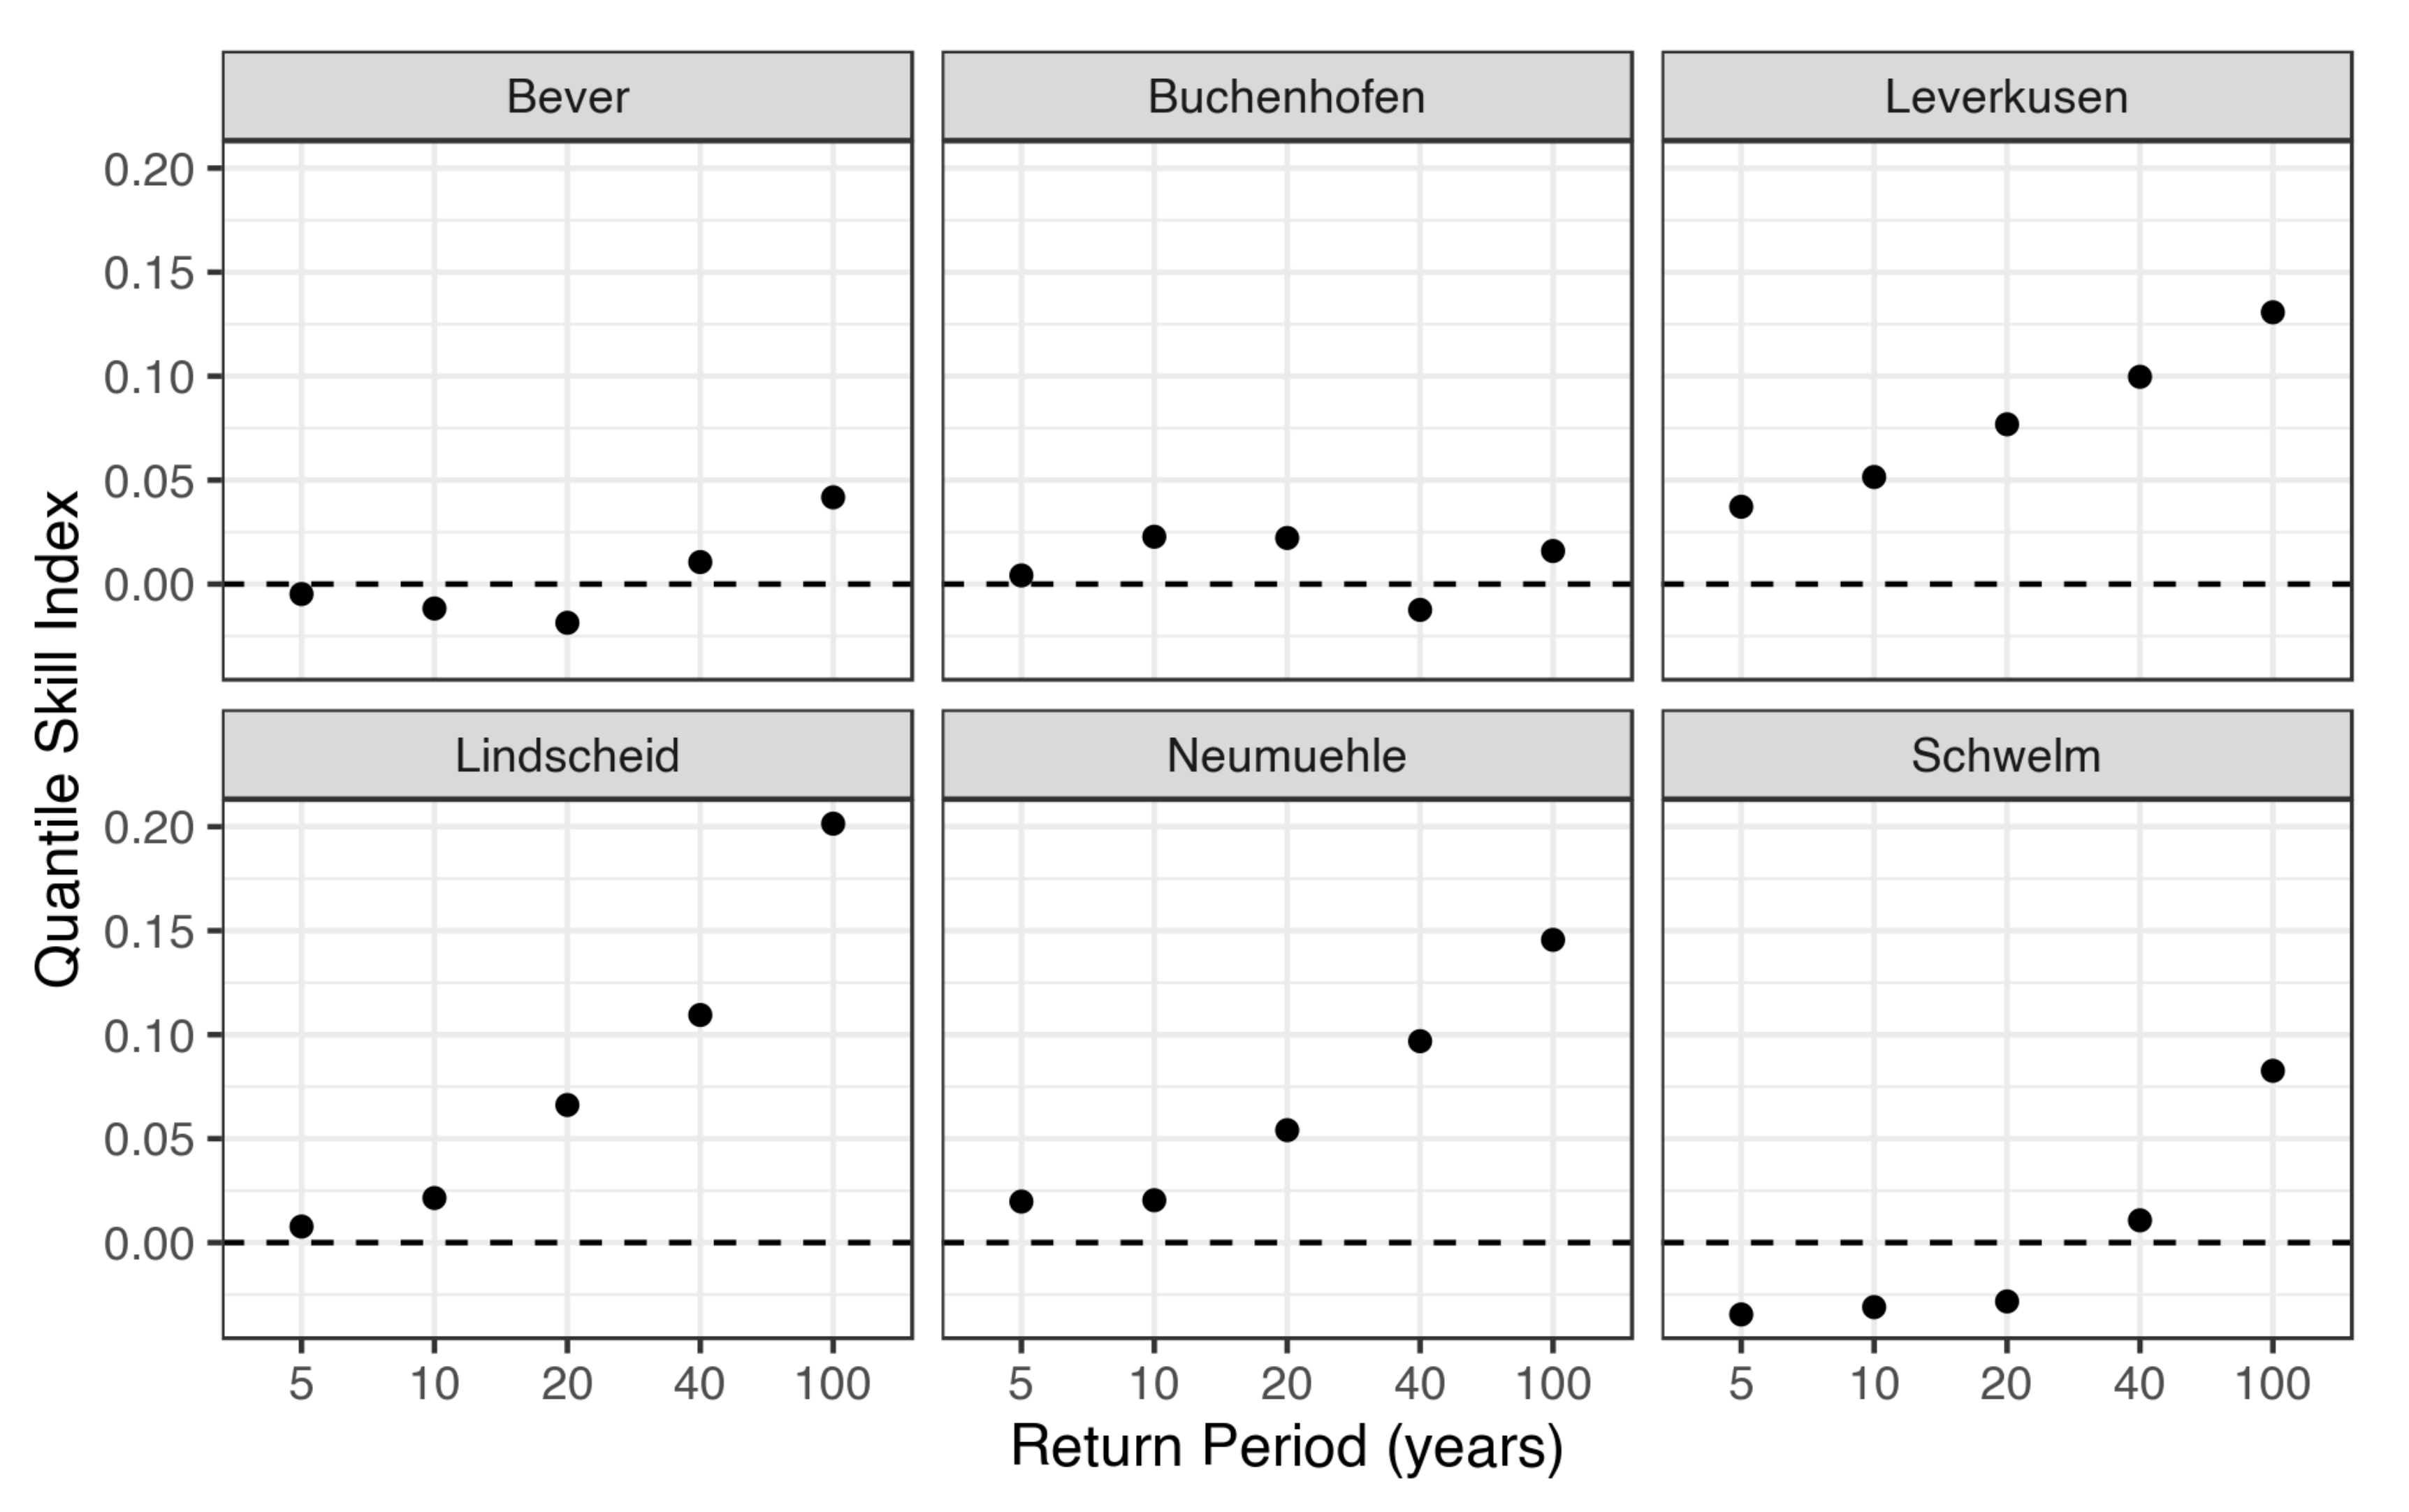
3.1.3. Performance Averaged over All Durations
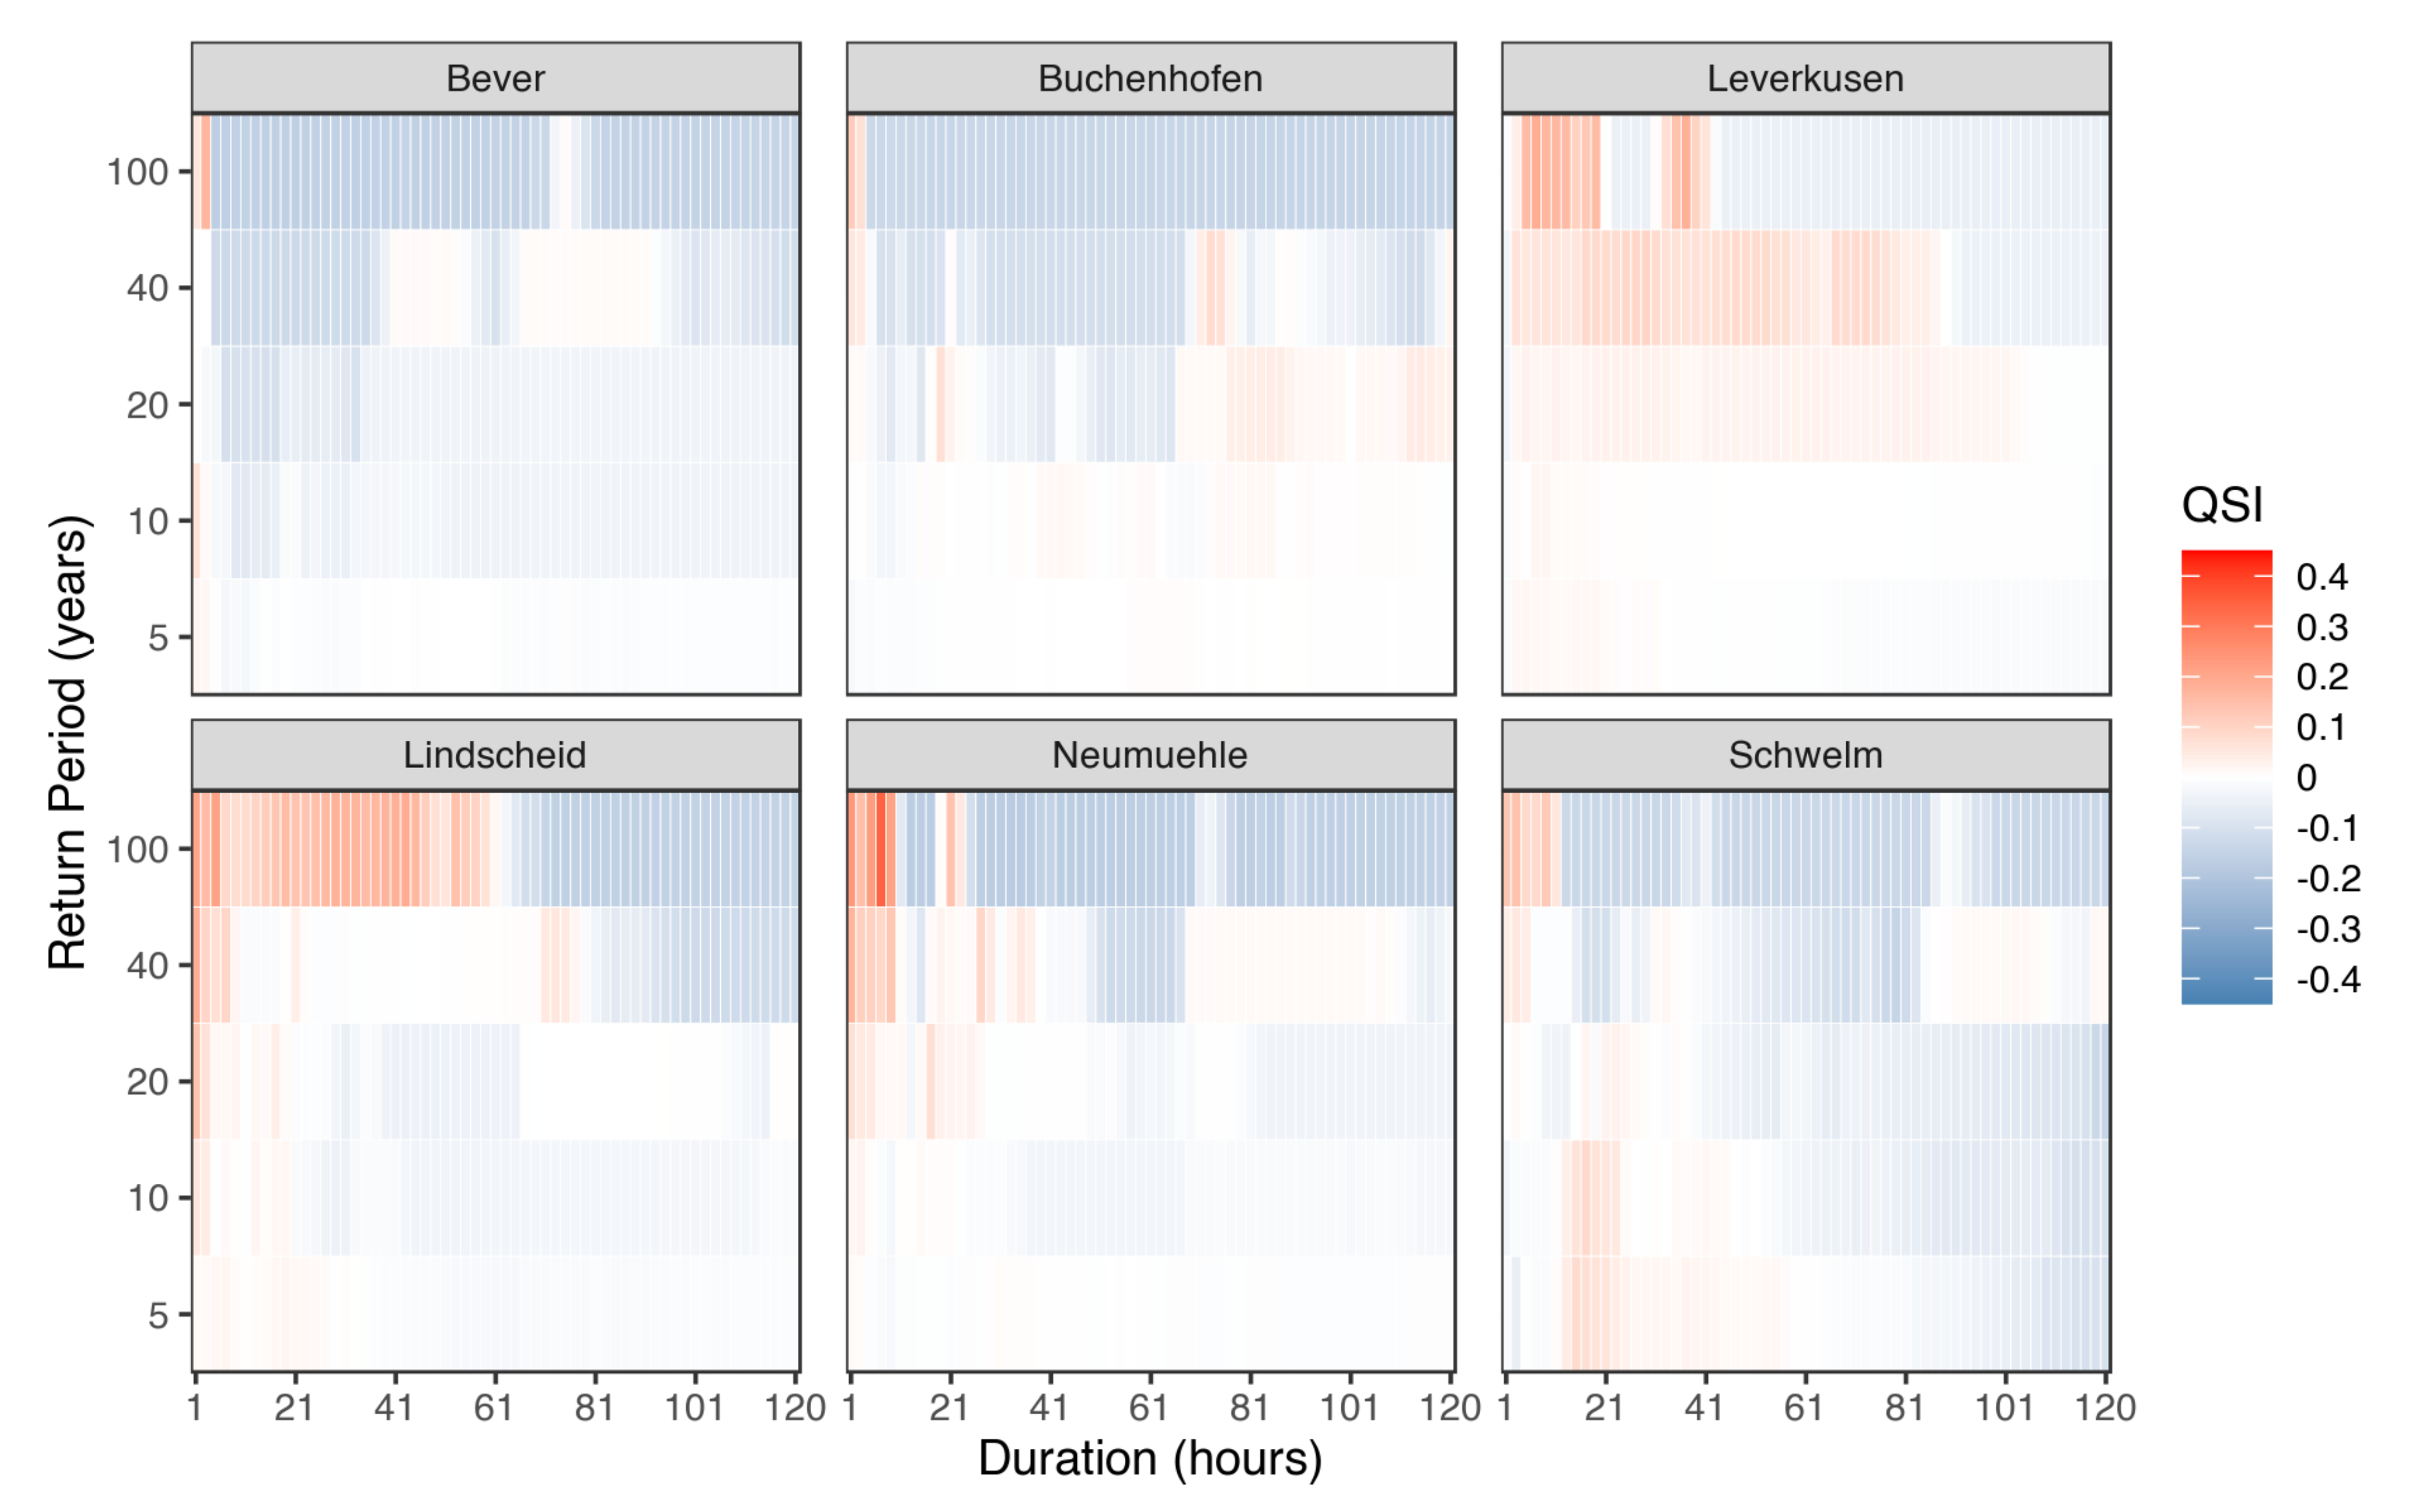
3.1.4. Performance for Individual Durations
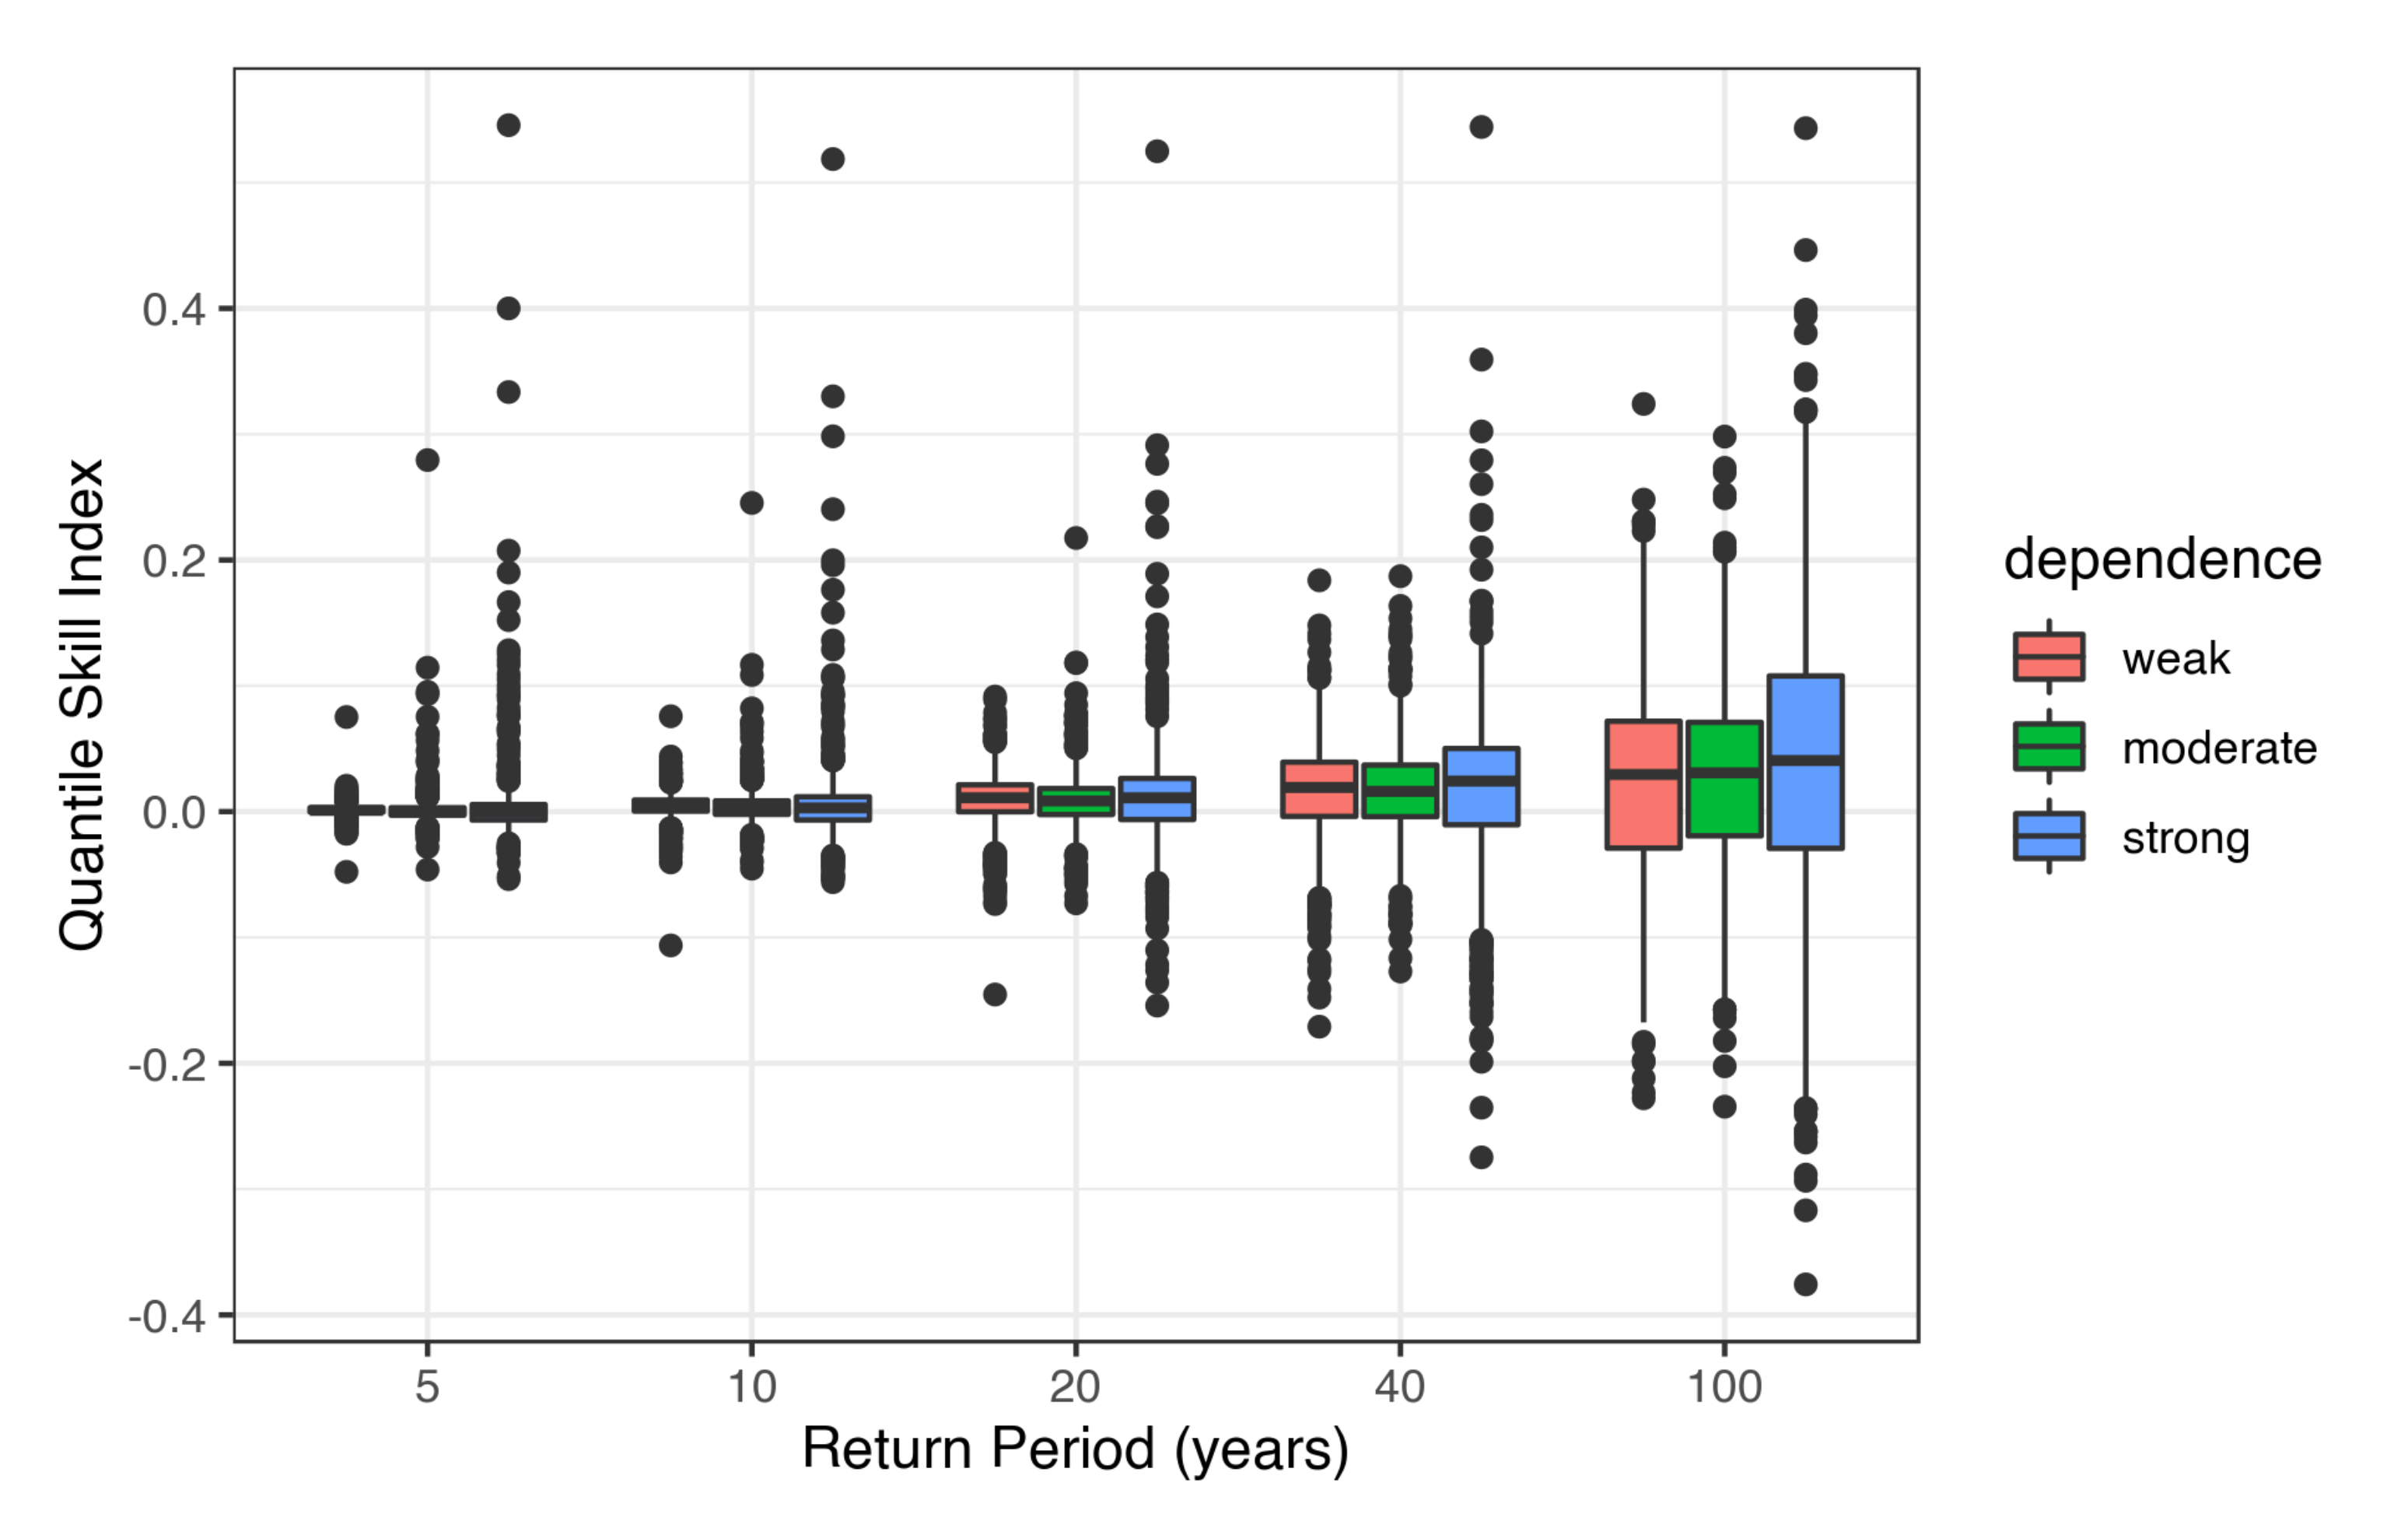
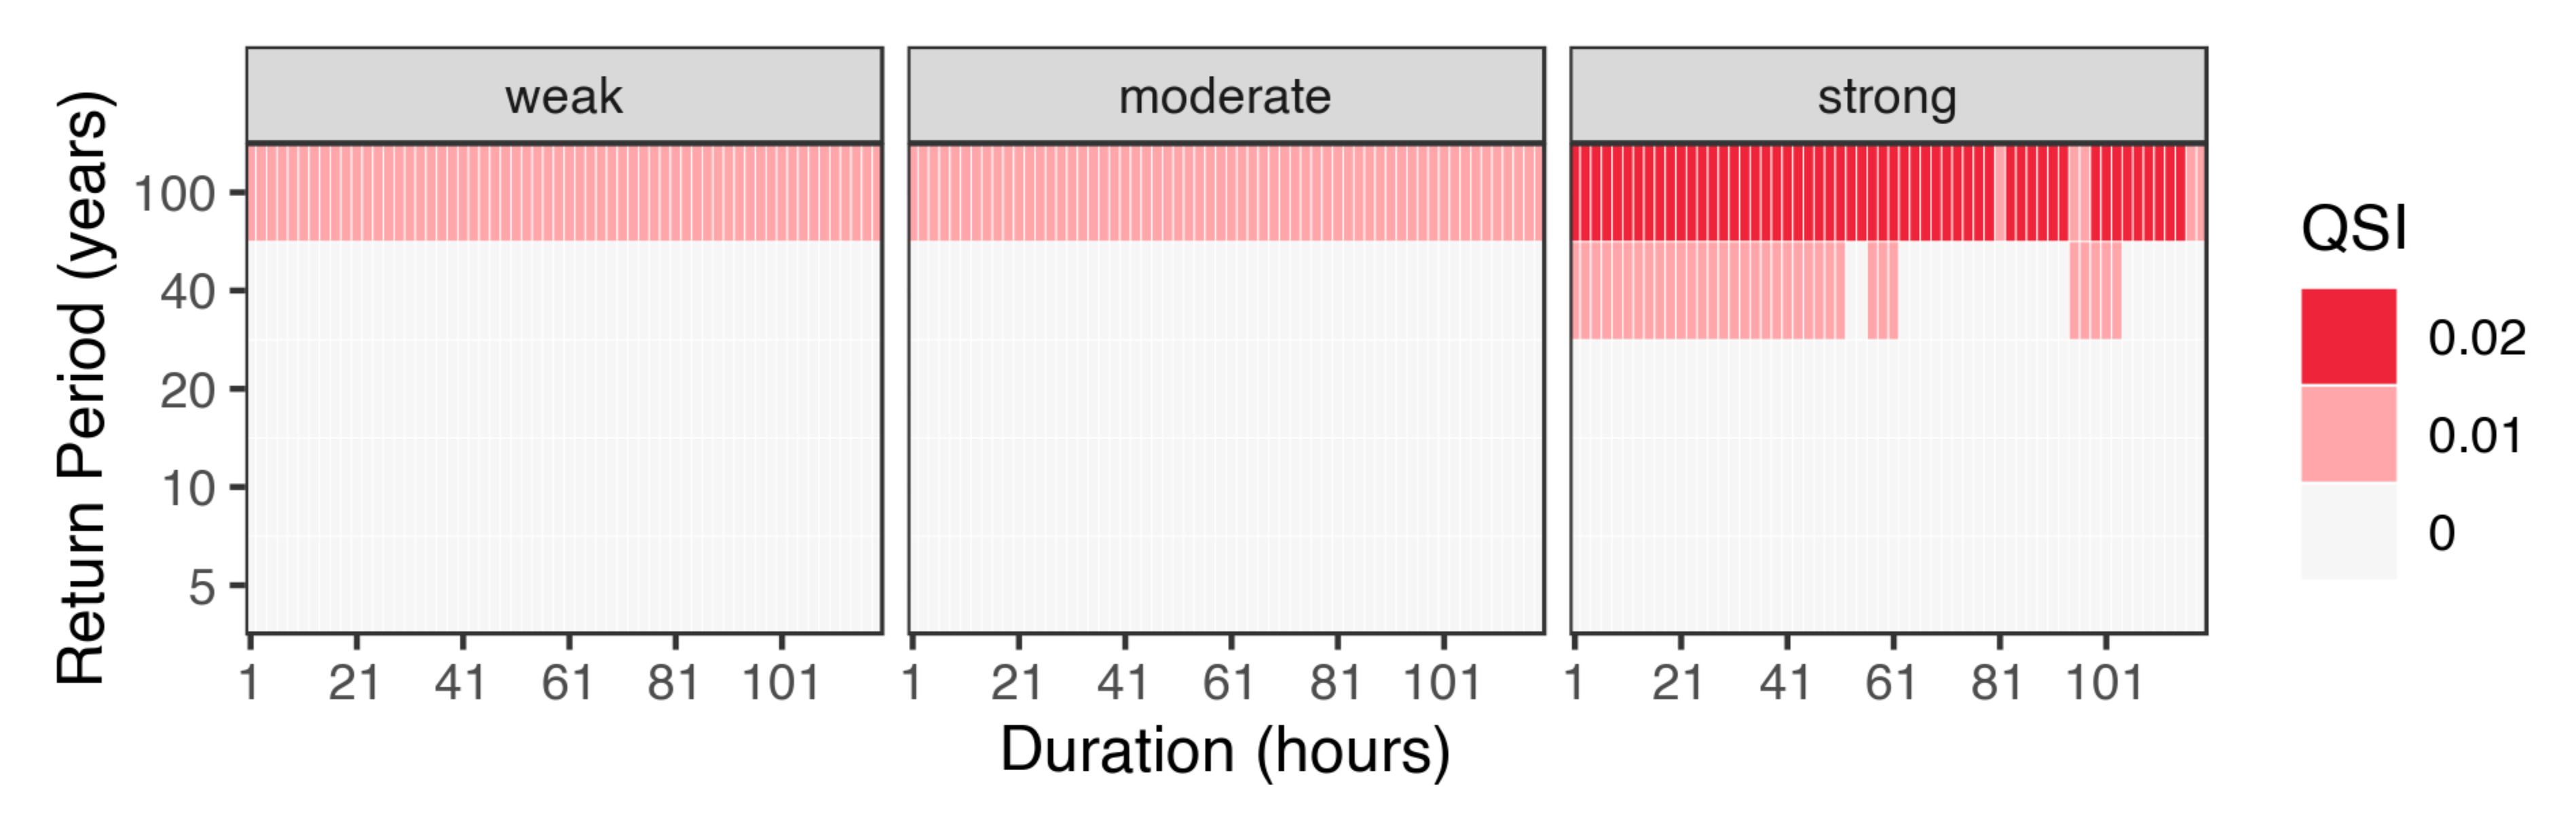
3.2. Simulation Study
4. Discussion
5. Conclusions
Author Contributions
Funding
Acknowledgments
Conflicts of Interest
Abbreviations
| IDF | Intensity-Duration-Frequency (curve) |
| GEV | Generalized Extreme Value distribution |
| d-GEV | Duration-dependent GEV |
| rd-GEV | Reduced d-GEV-based approach for modeling IDF curves |
| MS-GEV | Max-stable-based approach for modeling IDF curves |
| QS | Quantile Score |
| QSS | Quantile Skill Score |
| QSI | Quantile Skill Index |
Appendix A. Inference from the Brown-Resnick Max-Stable Process
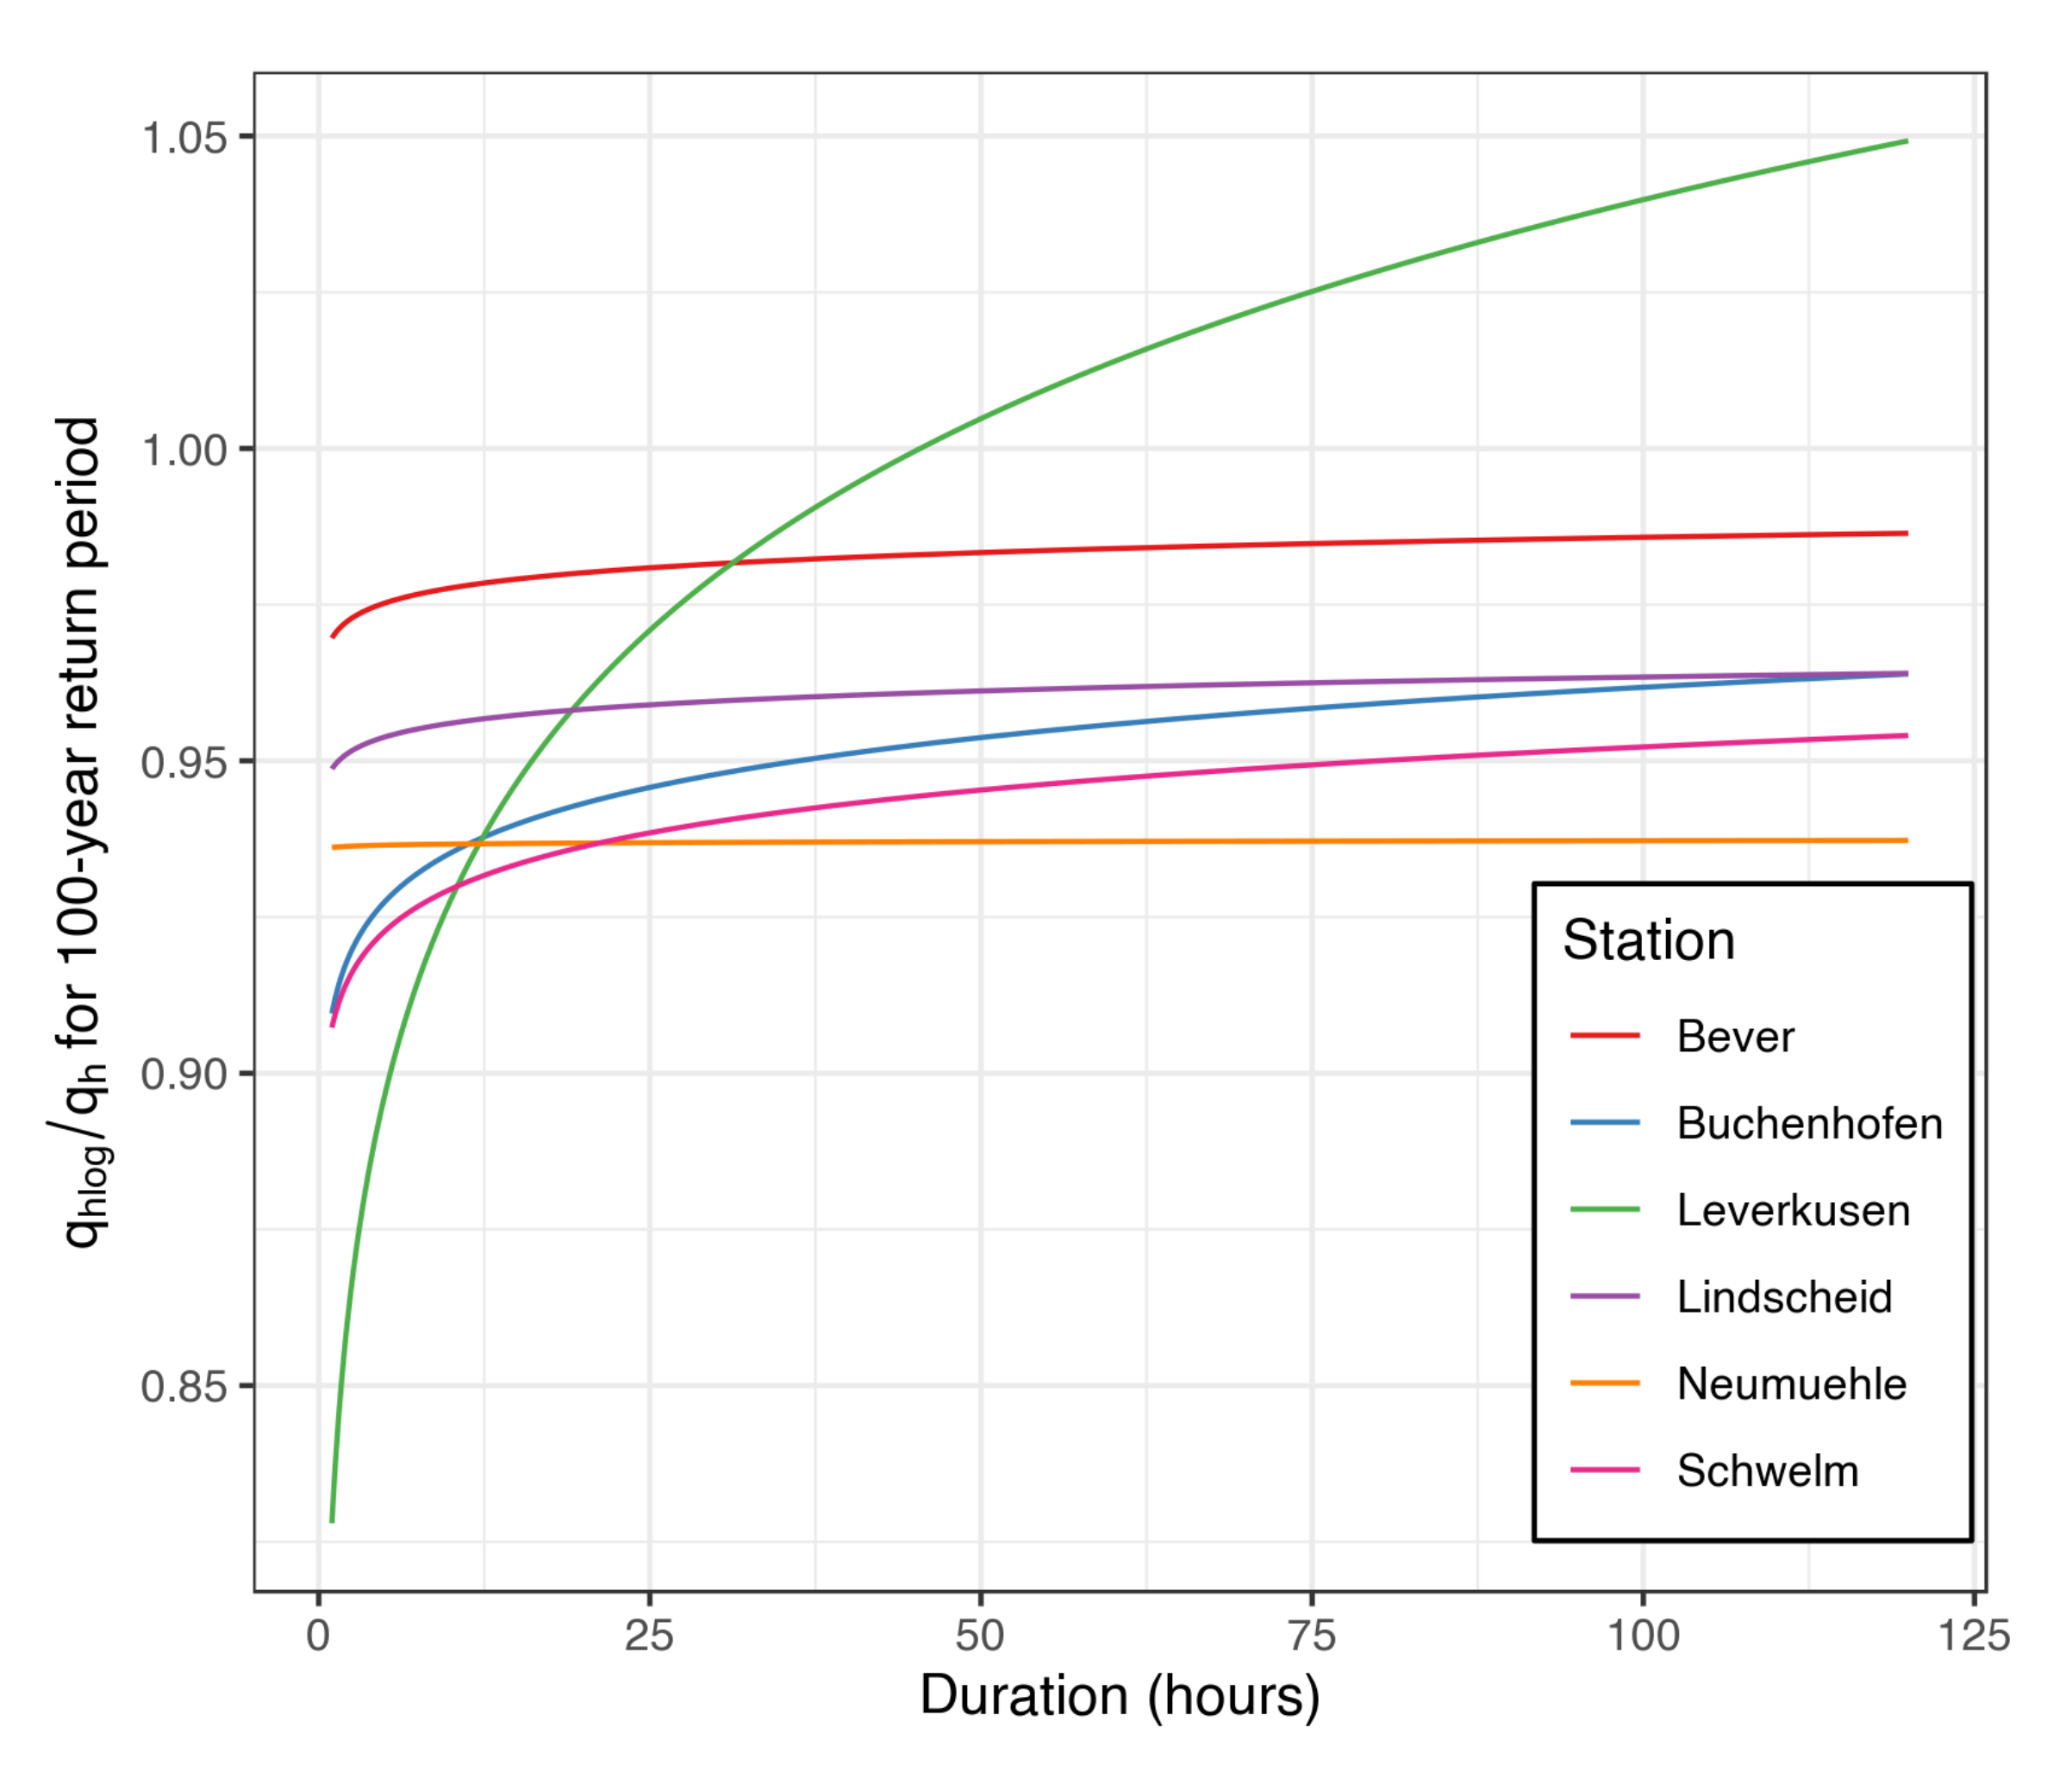
Appendix B. Comparison of 100-year Return Level between Euclidean and Log-Distance for MS-GEV Approach
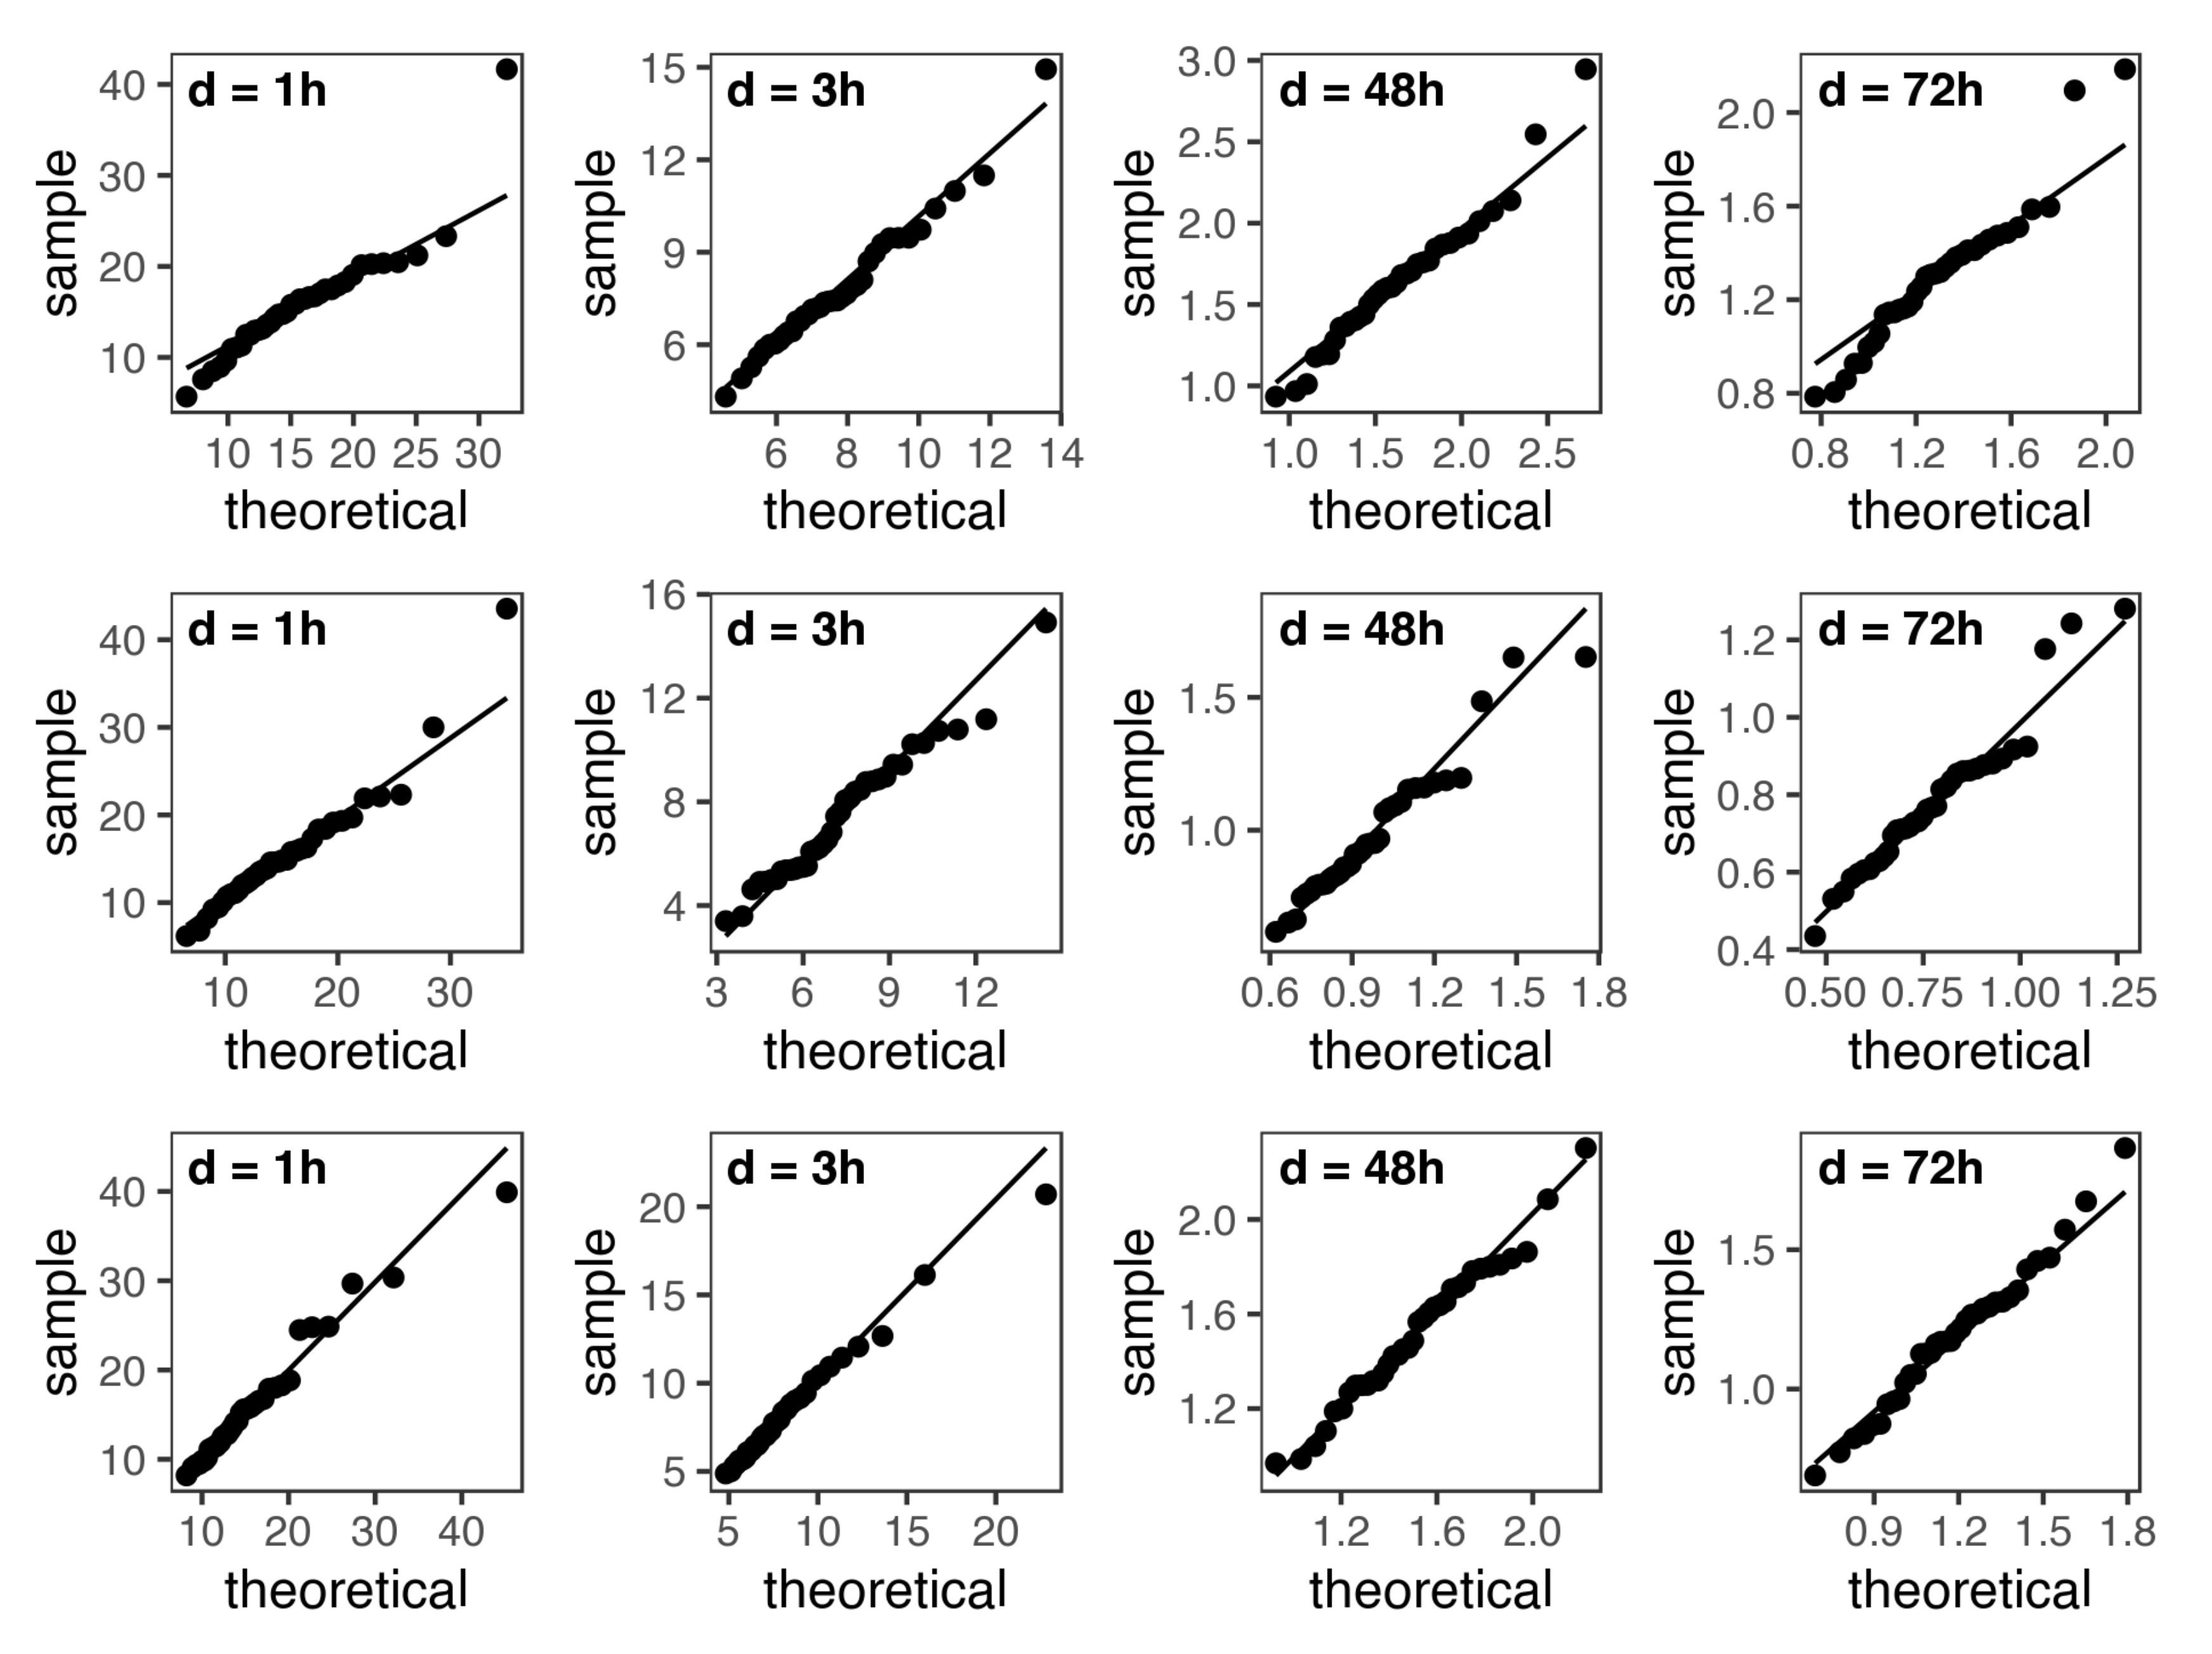
Appendix C. QQ-Plots for Selected Stations and Durations
References
- Chow, V.T. Frequency analysis of hydrologic data with special application to rainfall intensities. Univ. Ill. Bull. 1953, 50, 86. [Google Scholar]
- Aparicio, F. Fundamentos de Hidrología de Superficie Fundamentals of Surface Hydrology; Limusa: Balderas, Mexico, 1997; pp. 168–176. [Google Scholar]
- García-Bartual, R.; Schneider, M. Estimating Maximum Expected Short-Duration Convective Storms. Phys. Chem. Earth Part B 2001, 26, 675–681. [Google Scholar] [CrossRef]
- Monjo, R. Measure of rainfall time structure using the dimensionless n-index. Clim. Res. 2016, 67, 71–86. [Google Scholar] [CrossRef] [Green Version]
- Koutsoyiannis, D.; Kozonis, D.; Manetas, A. A mathematical framework for studying rainfall intensity-duration-frequency relationships. J. Hydrol. 1998, 206, 118–135. [Google Scholar] [CrossRef]
- Lehmann, E.A.; Phatak, A.; Stephenson, A.G.; Lau, R. Spatial modelling framework for the characterisation of rainfall extremes at different durations and under climate change. Environmetrics 2016, 27, 239–251. [Google Scholar] [CrossRef] [Green Version]
- Van de Vyver, H. A multiscaling-based intensity–duration–frequency model for extreme precipitation. Hydrol. Process. 2018, 32, 1635–1647. [Google Scholar] [CrossRef]
- Ritschel, C.; Ulbrich, U.; Nevir, P.; Rust, H.W. Precipitation extremes on multiple timescales—Bartlett-Lewis rectangular pulse model and intensity-duration-frequency curves. Hydrol. Earth Syst. Sci. 2017, 21, 6501–6517. [Google Scholar] [CrossRef] [Green Version]
- Ulrich, J.; Jurado, O.E.; Peter, M.; Scheibel, M.; Rust, H.W. Estimating IDF curves consistently over durations with spatial covariates. Water 2020, 12, 3119. [Google Scholar] [CrossRef]
- Fischer, M.; Rust, H.; Ulbrich, U. A spatial and seasonal climatology of extreme precipitation return-levels: A case study. Spat. Stat. 2019, 34. [Google Scholar] [CrossRef]
- Padulano, R.; Reder, A.; Rianna, G. An ensemble approach for the analysis of extreme rainfall under climate change in Naples (Italy). Hydrol. Process. 2019, 33, 2020–2036. [Google Scholar] [CrossRef]
- Ganguli, P.; Coulibaly, P. Does nonstationarity in rainfall require nonstationary intensity-duration-frequency curves? Hydrol. Earth Syst. Sci. 2017, 21, 6461–6483. [Google Scholar] [CrossRef] [Green Version]
- Ganguli, P.; Coulibaly, P. Assessment of future changes in intensity-duration-frequency curves for Southern Ontario using North American (NA)-CORDEX models with nonstationary methods. J. Hydrol.-Reg. Stud. 2019, 22. [Google Scholar] [CrossRef]
- Muller, A.; Bacro, J.N.; Lang, M. Bayesian comparison of different rainfall depth-duration-frequency relationships. Stoch. Environ. Res. Risk Assess. 2008, 22, 33–46. [Google Scholar] [CrossRef] [Green Version]
- Van de Vyver, H. Bayesian estimation of rainfall intensity-duration-frequency relationships. J. Hydrol. 2015, 529, 1451–1463. [Google Scholar] [CrossRef]
- Singh, V.P.; Zhang, L. IDF curves using the Frank Archimedean copula. J. Hydrol. Eng. 2007, 12, 651–662. [Google Scholar] [CrossRef]
- Davison, A.C.; Huser, R.; Thibaud, E. Geostatistics of Dependent and Asymptotically Independent Extremes. Math. Geosci. 2013, 45, 511–529. [Google Scholar] [CrossRef] [Green Version]
- Stephenson, A.G.; Lehmann, E.A.; Phatak, A. A max-stable process model for rainfall extremes at different accumulation durations. Weather Clim. Extrem. 2016, 13, 44–53. [Google Scholar] [CrossRef] [Green Version]
- Tyralis, H.; Langousis, A. Estimation of intensity–duration–frequency curves using max-stable processes. Stoch. Environ. Res. Risk Assess. 2019, 33, 239–252. [Google Scholar] [CrossRef]
- Nadarajah, S.; Anderson, C.W.; Tawn, J.A. Ordered multivariate extremes. J. R. Stat. Soc. Ser. B Stat. Methodol. 1998, 60, 473–496. [Google Scholar] [CrossRef]
- Coles, S. An Introduction to Statistical Modeling of Extreme Values; Springer: London, UK, 2001. [Google Scholar] [CrossRef]
- Ulrich, J.; Ritschel, C. IDF: Estimation and Plotting of IDF Curves; R Package Version 2.0.0; R Package: Madison, WI, USA, 2020. [Google Scholar]
- Ribatet, M. Spatial extremes: Max-stable processes at work. J. Société Française Stat. Rev. Stat. Appl. 2013, 154, 156–177. [Google Scholar]
- De Haan, L. A Spectral Representation for Max-Stable Processes. Ann. Probab. 1984, 12, 1194–1204. [Google Scholar]
- Zheng, F.; Thibaud, E.; Leonard, M.; Westra, S. Assessing the performance of the independence method in modeling spatial extreme rainfall. Water Resour. Res. 2015, 51, 7744–7758. [Google Scholar] [CrossRef]
- Dey, D.K.; Yan, J. Extreme Value Modeling and Risk Analysis: Methods and Applications; CRC: New York, NY, USA, 2016. [Google Scholar]
- Engelke, S.; Malinowski, A.; Kabluchko, Z.; Schlather, M. Estimation of Hüsler-Reiss distributions and Brown-Resnick processes. J. R. Stat. Soc. Ser. B Stat. Methodol. 2015, 77, 239–265. [Google Scholar] [CrossRef] [Green Version]
- Thibaud, E.; Aalto, J.; Cooley, D.S.; Davison, A.C.; Heikkinen, J. Bayesian inference for the brown-resnick process, with an application to extreme low temperatures. Ann. Appl. Stat. 2016, 10, 2303–2324. [Google Scholar] [CrossRef]
- Asadi, P.; Davison, A.C.; Engelke, S. Extremes on river networks. Ann. Appl. Stat. 2015, 9, 2023–2050. [Google Scholar] [CrossRef]
- Davison, A.C.; Padoan, S.A.; Ribatet, M. Statistical Modeling of Spatial Extremes. Stat. Sci. 2012, 27, 161–186. [Google Scholar] [CrossRef] [Green Version]
- Buhl, S.; Klüppelberg, C. Anisotropic Brown-Resnick space-time processes: Estimation and model assessment. Extremes 2016, 19, 627–660. [Google Scholar] [CrossRef] [Green Version]
- Cooley, D.; Cisewski, J.; Erhardt, R.J.; Jeon, S.; Mannshardt, E.; Omolo, B.O.; Sun, Y. A survey of spatial extremes: Measuring spatial dependence and modeling spatial effects. Revstat Stat. J. 2012, 10, 135–165. [Google Scholar]
- Kabluchko, Z.; Schlather, M.; de Haan, L. Stationary max-stable fields associated to negative definite functions. Ann. Probab. 2009, 37, 2042–2065. [Google Scholar] [CrossRef]
- Van de Vyver, H.; Van den Bergh, J. The Gaussian copula model for the joint deficit index for droughts. J. Hydrol. 2018, 561, 987–999. [Google Scholar] [CrossRef]
- Ribatet, M. SpatialExtremes: Modelling Spatial Extremes; R Package Version 2.0-8; R Package: Madison, WI, USA, 2020. [Google Scholar]
- Marcon, G.; Padoan, S.A.; Naveau, P.; Muliere, P.; Segers, J. Multivariate nonparametric estimation of the Pickands dependence function using Bernstein polynomials. J. Stat. Plan. Inference 2017, 183, 1–17. [Google Scholar] [CrossRef] [Green Version]
- Vettori, S.; Huser, R.; Genton, M.G. A comparison of dependence function estimators in multivariate extremes. Stat. Comput. 2018, 28, 525–538. [Google Scholar] [CrossRef] [Green Version]
- R Core Team. R: A Language and Environment for Statistical Computing; R Foundation for Statistical Computing: Vienna, Austria, 2020. [Google Scholar]
- Bentzien, S.; Friederichs, P. Decomposition and graphical portrayal of the quantile score. Q. J. R. Meteorol. Soc. 2014, 140, 1924–1934. [Google Scholar] [CrossRef]
- Wilks, D.S. Chapter 9—Forecast Verification. In Statistical Methods in the Atmospheric Sciences; Elsevier: Amsterdam, The Netherlands, 2019; pp. 369–483. [Google Scholar] [CrossRef]
- Hastie, T.; Tibshirani, R.; Friedman, J. Elements of Statistical Learning, 2nd ed.; Springer: Berlin, Germany, 2009. [Google Scholar] [CrossRef]
- Nadarajah, S.; Afuecheta, E.; Chan, S. Ordered random variables. Opsearch 2019, 56, 344–366. [Google Scholar] [CrossRef]
- Mélèse, V.; Blanchet, J.; Molinié, G. Uncertainty estimation of Intensity–Duration–Frequency relationships: A regional analysis. J. Hydrol. 2018, 558, 579–591. [Google Scholar] [CrossRef] [Green Version]
- Smith, R.L. Max-stable processes and spatial extremes. Unpublished Manuscripts. 1990. Available online: http://www.rls.sites.oasis.unc.edu/postscript/rs/spatex.pdf (accessed on 25 November 2020).
- Padoan, S.A.; Ribatet, M.; Sisson, S.A. Likelihood-based inference for max-stable processes. J. Am. Stat. Assoc. 2010, 105, 263–277. [Google Scholar] [CrossRef]


| Station | c | |||||
|---|---|---|---|---|---|---|
| Bever | 1.42 | 2.09 | 13.32 | 2.84 | 0.03 | −0.58 |
| Buchenhofen | 1.39 | 2.22 | 13.38 | 3.03 | 0.02 | −0.63 |
| Leverkusen | 1.32 | 2.19 | 10.74 | 2.34 | 0.05 | −0.64 |
| Lindscheid | 1.54 | 2.44 | 13.69 | 3.23 | 0.06 | −0.64 |
| Neumuehle | 1.54 | 1.84 | 13.52 | 2.74 | 0.04 | −0.60 |
| Schwelm | 1.53 | 1.74 | 13.07 | 2.77 | 0.05 | −0.62 |
Publisher’s Note: MDPI stays neutral with regard to jurisdictional claims in published maps and institutional affiliations. |
© 2020 by the authors. Licensee MDPI, Basel, Switzerland. This article is an open access article distributed under the terms and conditions of the Creative Commons Attribution (CC BY) license (http://creativecommons.org/licenses/by/4.0/).
Share and Cite
Jurado, O.E.; Ulrich, J.; Scheibel, M.; Rust, H.W. Evaluating the Performance of a Max-Stable Process for Estimating Intensity-Duration-Frequency Curves. Water 2020, 12, 3314. https://doi.org/10.3390/w12123314
Jurado OE, Ulrich J, Scheibel M, Rust HW. Evaluating the Performance of a Max-Stable Process for Estimating Intensity-Duration-Frequency Curves. Water. 2020; 12(12):3314. https://doi.org/10.3390/w12123314
Chicago/Turabian StyleJurado, Oscar E., Jana Ulrich, Marc Scheibel, and Henning W. Rust. 2020. "Evaluating the Performance of a Max-Stable Process for Estimating Intensity-Duration-Frequency Curves" Water 12, no. 12: 3314. https://doi.org/10.3390/w12123314
APA StyleJurado, O. E., Ulrich, J., Scheibel, M., & Rust, H. W. (2020). Evaluating the Performance of a Max-Stable Process for Estimating Intensity-Duration-Frequency Curves. Water, 12(12), 3314. https://doi.org/10.3390/w12123314