Article

Variations in Soil Erosion Resistance of Gully Head Along a 25-Year Revegetation Age on the Loess Plateau

1
State Key Laboratory of Soil Erosion and Dryland Farming on the Loess Plateau, Institute of Water and Soil Conservation, Northwest A&F University, Xianyang 712100, China
2
Key Laboratory of Mollisols Agroecology, Northeast Institute of Geography and Agroecology, Chinese Academy of Sciences, Harbin 150081, China
*
Author to whom correspondence should be addressed.
Water 2020, 12(12), 3301; https://doi.org/10.3390/w12123301
Submission received: 10 October 2020 / Revised: 17 November 2020 / Accepted: 19 November 2020 / Published: 24 November 2020
(This article belongs to the Special Issue Soil–Water Conservation, Erosion, and Landslide)

Abstract

:
The effects of vegetation restoration on soil erosion resistance of gully head, along a revegetation age gradient, remain poorly understood. Hence, we collected undisturbed soil samples from a slope farmland and four grasslands with different revegetation ages (3, 10, 18, 25 years) along gully heads. Then, these samples were used to obtain soil detachment rate of gully heads by the hydraulic flume experiment under five unit width flow discharges (2–6 m3 h). The results revealed that soil properties were significantly ameliorated and root density obviously increased in response to restoration age. Compared with farmland, soil detachment rate of revegetated gully heads decreased 35.5% to 66.5%, and the sensitivity of soil erosion of the gully heads to concentrated flow decreased with revegetation age. The soil detachment rate of gully heads was significantly related to the soil bulk density, soil disintegration rate, capillary porosity, saturated soil hydraulic conductivity, organic matter content and water stable aggregate. The roots of 0–0.5 and 0.5–1.0 mm had the highest benefit in reducing soil loss of gully head. After revegetation, soil erodibility of gully heads decreased 31.0% to 78.6%, and critical shear stress was improved by 1.2 to 4.0 times. The soil erodibility and critical shear stress would reach a stable state after an 18-years revegetation age. These results allow us to better evaluate soil vulnerability of gully heads to concentrated flow erosion and the efficiency of revegetation.

1. Introduction

Soil erosion is recognized as a global environmental problem, which severely damages infrastructure, causes land degradation and water pollution, and threatens the safety of human production and life [1,2,3]. In the past few decades, many scholars have made many efforts to study the process and mechanism of soil erosion, establish many soil erosion prediction models and try to control soil erosion [4,5,6,7]. At present, a set of soil erosion control measures system integrating engineering measures, agricultural measures, and biological measures has been formed [8,9,10], especially vegetation measures play an extremely important role in soil erosion control [11,12].
Previous studies have shown that revegetation can effectively reduce soil erosion. For example, Wang et al. [13] found that soil detachment capacity of abandoned farmland was 1.02 to 2.29 times greater than four restored lands. Li et al. [14] reported that the ratios of the soil detachment capacity of cropland to those of orchard, shrubland, woodland, grassland, and wasteland were 7.14, 12.29, 25.78, 28.45, and 46.43, respectively. The improvement of soil erosion resistance by revegetation is mainly controlled by the combination of soil properties and root traits [15,16,17,18]. In terms of soil properties, many studies have verified that the revegetation significantly affects soil erosion by changing the soil bulk density, organic matter content, and water-stable aggregate [19,20,21]. Furthermore, the vegetation root zone is the dynamic interface of soil–plant–atmosphere continuum in partitioning rain and irrigation water into evaporation, transpiration, runoff, and deep drainage [22,23], but is also the home of “green water” which is the source of plant nutrition [24]. Especially, the vegetation root systems also play a great role in protecting soil against flow scouring by affecting soil water movement [25,26]. Root-permeated soils exhibited lower erosion rates primarily through increasing the required shear stress before detachment [27]. Moreover, root growth can bind and bond soil particles and aggregate, thus, enhances soil resistance to erosion [28]. Some root parameters, for example root biomass, length density, and surface area density, were used to estimate the effect of root on soil detachment [21,28,29,30,31]. De Baets and Poesen [25] found that soil detachment rate reduced exponentially with increasing root biomass. Some studies also showed that soil detachment was related to root architecture and fibrous root was more effective than tap root in reducing soil loss [24,31]. However, the most of previous studies only focus on the impact of revegetation on soil erosion resistance of hillslopes. In the watershed dominated by gully erosion, the gully head is the main source of soil erosion, but the effect of revegetation on soil erosion resistance of gully heads remains unclear. Therefore, there is a strong need to understand the effect of revegetation on soil erosion of gully head by concentrated flow to develop a more reasonable vegetation model.
Notably, in the gully region of the Loess Plateau, about 63% of total runoff is generated from the loess tableland with a gentle slope of 1–5°, which can initiate gully headcut erosion and contribute 86.3% of total sediment [32]. The gully headcut erosion by concentrated flow became the main sediment resource. At present, the gully headcut erosion was controlled effectively due to the implementation of a series of control measures (e.g., the “Three Protection Belts” and the “Green for Grain” project), which, to some extent, was attributed to the fact that the revegetation improves the soil resistance of gully heads to concentrated flow [21,33]. Since some ecological restoration projects were conducted, land use has changed dramatically in the Loess Plateau [34]. Hence, the land use has changed, and the natural succession of vegetation was promoted [35]. With progression in natural restoration of grassland, soil physical and chemical properties and vegetation characteristics (e.g., coverage, community structure, species composition and diversity, and root diameter, density, and diameter distribution) varied greatly [36,37]. These changes would result in dynamic variations in soil erosion resistance. However, the response of soil erosion resistance to vegetation succession process mainly focused on the hillslope in the hilly-gully region of Loess Plateau [15,16], and few studies were conducted to explore the response of soil resistance of gully heads by concentrated flow to vegetation succession process.
Therefore, to evaluate the effect of revegetation process on soil erosion resistance of gully heads and optimize revegetation measures for controlling gully headcut erosion in the gully region of the Loess Plateau, we selected four grasslands with different revegetation ages (3, 10, 18, 25 years) along gully heads with the slope farmland as the control. This study aimed to (1) quantify the effect of revegetation age on soil detachment by concentrated flow, (2) clear the relationships between soil detachment rate and soil and root properties, and (3) confirm the dynamic variation in soil erosion resistance of gully head with revegetation age.

2. Material and Method
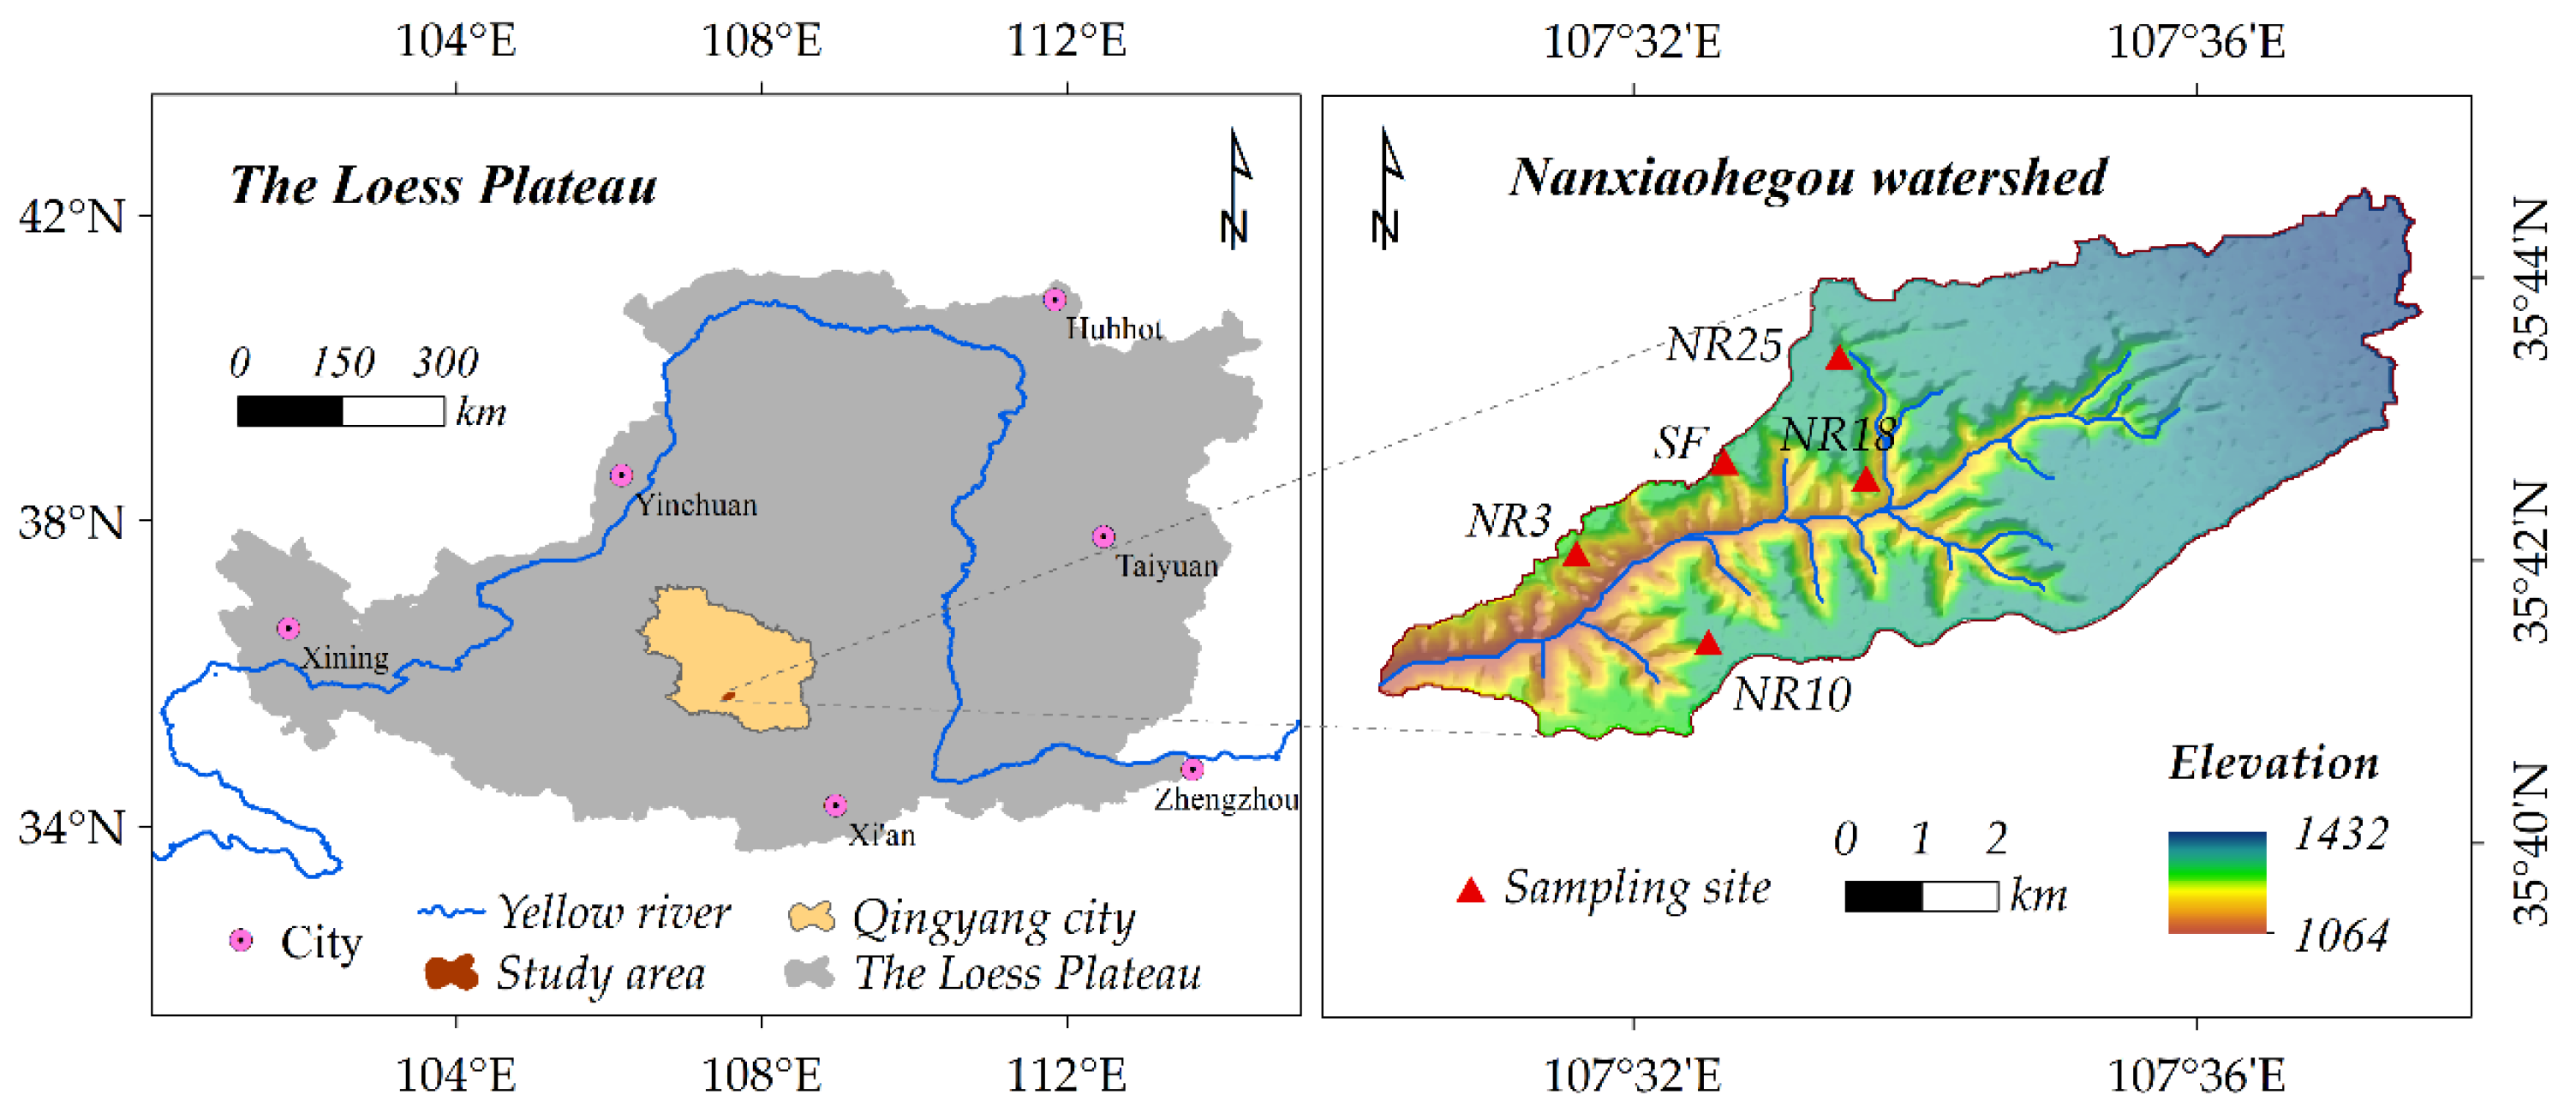
2.1. Study Area

The study was conducted in the Nanxiaohegou watershed in the Xifeng Research Station of Soil and Water Conservation (35°41′–35°44′ N, 107°30′–107°37′ E). The watershed has an area of 36.3 km2 and altitudes ranging from 1050 to 1423 m above mean sea level (Figure 1) in the typical gully region of the Loess Plateau. The climate is temperate continental semiarid. The mean temperature is 10 °C, and the frost-free period is 160–180 days. Annual precipitation is approximately 523 mm, which has the characteristic of annual variation and uneven distribution during the year. In the form of short heavy storms, 58.8% of the rainfall occurs from July to September. The soil type is yellow loamy soil. The original vegetation has disappeared due to human activities. Gully headcut erosion is the main resource of sediment yield in the watershed. Since the 1970s, some soil and water conservation projects, for example the “three protection belts” project and the “Green for Grain” project and so on, were implemented to control soil and water loss, and the vegetation cover of the Loess Plateau increased to 59.6% in 2013. Additionally, the land use has undergone tremendous changes [38]. These efforts also effectively stabilized the gully heads and thus contained the gully headcut erosion [33]. At present, the annual soil erosion module is effectively controlled at the level of 2440 t km−2 a−1 in the study area, and the vegetation communities comprise mainly planted forests and shrubs and native secondary herbaceous plants [21].

2.2. Sampling Sites Selection

During our investigation of gully heads, some cracks developed near gully heads. Kompani-Zare et al. [39] and Guo et al. [21] stated that soil samples from 0 to 30 cm depth near the gully heads (the distance was less than 5 m) can represent soil properties of the gully heads. Therefore, in consideration of collapsibility and vertical joints development of loess, the sampling plots were established about 1.0 m meters from gully heads to ensure safety. As a result, four natural restoration grasslands with different ages (3, 10, 18, 25 years) were selected (Figure 1). The natural restoration age was confirmed by consulting the village elders and scientists at the scientific experimental station. The slope aspect and gradient, elevation, soil type, and previous farming practices of the selected sites were similar to minimize the effects of these factors on the experimental results. For comparison, one corn-planted farmland site, with a topography similar to that of the grasslands, was selected as a control. The basic information of the five selected sites is listed in Table 1.

2.3. Sampling and Measurement of Soil and Root

In this study, seven soil and root property parameters including soil bulk density, capillary porosity, soil disintegration rate, soil water-stable aggregate, soil saturated hydraulic conductivity, organic matter content, and root mass density were measured. Firstly, three repeated sampling plots (5 m × 5 m) were established in each of gully head sampling sites with the litter layer removed, and topsoil samples (0–30 cm) were collected. Then, three cutting rings (200 cm3) were used to randomly collect soil samples in each plot, and a total of nine samples were oven-dried at 105 °C for 24 h to determine the soil bulk density of each gully head site. Similarly, the other 9 soil samples were also collected by cutting rings of 200 cm3 to determine the soil saturated hydraulic conductivity by applying the constant water head test method. Three cutting rings (100 cm3) were used to collect soil samples for the measurement of soil capillary porosity [33]. Three man-made steel cubical boxes (5 cm in length) were used to collect soil samples for measuring soil disintegration rate by using a disintegration box [14,40]. Lastly, the other three samples were randomly collected in each plot to form a mixed sample. A total of 45 mixed samples were obtained and used for laboratory analyses of organic matter content and water-stable aggregate and its stability. These mixed soil samples were air-dried at room temperature, with large roots and organic residues manually removed. Sieves with apertures (0.25, 0.5, 1.0, 2.5, and 5.0 mm) were used to test the water-stable aggregate. The potassium dichromate external heating method was used to measure the soil organic matter content.

2.4. Hydraulic Flume Experiments

A hydraulic flume experiment was conducted to determine the soil resistance to concentrated flow upstream gully heads (Figure 2). The size of the flume was 2.0 m long and 0.15 m wide similar to the one used by De Baets et al. [28,31], which was enough to make water flow along the slope soil. An opening (0.5 m length and 0.1 m wide) was set at the bottom of the flume, and a metal sample box with the same size was used to collect undisturbed soil samples so that the surface of the soil sample was at the same level of the flume surface. The space between sampling box and flume edge sealed with painter’s mastic to prevent boundary effects. According to the study of Guo et al. [40], the flume experiment was carried out under five different unit width flow discharges of 2, 3, 4, 5, 6 m3 s−1, and thus, a total of 100 samples (5 sites × 5 flow discharges × 4 replications) were collected to measure soil resistance of gully heads. To simulate real flow generation conditions, the soil should be saturated by using a watering pot before experiment. During the experiment, a portable flow meter instrument (LS300-A) with 1.5% accuracy was used to measure flow velocity which was regarded as the flow velocity scoring soil area. Runoff and sediment samples were collected with sampling tanks, and the sampling time was recorded. The measured flow velocity was modified according to flow regime [41]. Sampled sediment was oven-dried at 105 °C for 24 h to determine the soil loss amount (SLA, kg). Thus, the soil detachment rate (Dr, kg m−2 s−1) could be calculated as follows: please check font size, please check all reference citation
D r = S L A A T
where SLA is the oven-dry mass of every sediment sample (kg), T is the experimental period (s) and A is the soil sample area (m2). In addition, the relative soil detachment rate (RDr) was calculated as the ratio between Dr for the root-permeated soil samples and that for the farmland topsoil samples, tested at the same condition [28].
In addition, the flow depth (h, m) and shear stress (τ, Pa) were also calculated as follows:
h = q v w
τ = ρ g h S
where h is flow depth (m), q is the flow discharge (m3 s−1), w is the width of the flume (m), v is the mean flow velocity (m s−1). ρ is the water mass density (kg m−3), g is the gravity constant (m s−2), and S is the slope steepness (m m−1).
After each scouring test, a steel cubical box (10 cm in length) was used to take soil sample in the center of soil area of scouring flume, and the sample was soaked in tap water for about one hour to increase the dispersion of soil and then were placed on a 0.25 mm sieve and washed with tap water using low-pressure head. The living roots, plant debris and some pebbles were left on the sieve. Only the living roots were picked out carefully using tweezers one by one [15]. The washed roots were classified into 4 levels (0–0.5, 0.5–1.0, 1.0–2.0, and >2.0 mm) by vernier caliper and then were oven-dried for 24 h at 65 °C and weighed to calculate root mass density (RBD, kg m−3).

2.5. Parameter Calculation after the Experiments

Soil particle is detached when flow shear stress exceeds the critical shear stress [6]. Soil erodibility parameter (Kr) and critical shear stress (τc) were estimated for every natural restoration stage as the slope coefficient and intercept on the abscissa axis of the regression line between soil detachment rate and shear stress as described in the WEPP model as follow:
D r = K r ( τ τ c )
Generally, soil detachment rate can be considered as zero when root reached the infinity. To quantify the relationship between detachment rate and root mass density, the Hill curve was selected to simulate the relationship between them [21,31,42]. The Hill curve is expressed as follows [43]:
R D r = K X r a X r a + b ,   ( K > 0 ,   a < 0 ,   b > 0 )
where RDr is relative soil detachment rate; Xr is root mass density; K, a and b are constants. The parameter a determines the shape of the curve, b determines the steepness of the curve and K is the asymptote of Dr for infinitesimal Xr values. Additionally, the Hill curve can be used to evaluate the ability of roots to increase soil resistance against concentrated flow erosion. According to Li et al. [44], b^(1/a) is plant specific and can be used as an index to compare the effectiveness of different plant roots in reducing soil erosion rates: the lower b^(1/a), the more effective the plant root. When the value of Xr is b^(1/a), the soil detachment rates is reduced by 50%.

2.6. Statistical Analysis and Plotting

The analysis of one-way ANOVA followed by multiple comparisons with LSD was applied to assess the differences of soil properties (Soil bulk density, soil capillary porosity, soil disintegration rate, saturated hydraulic conductivity, organic matter content, and water-stable aggregate) and root mass density among the five revegetation ages. All soil and root variables of each revegetation ages were tested whether the data exhibited a normal distribution and variance homogeneity by Shapiro-Wilk test and Levene test, respectively. If the data failed to meet the two conditions, the Kruskal–Wallis test was performed for the above analysis. The interaction effect of flow discharge and revegetation age was detected using a two-way ANOVA. Pearson’s correlation analysis was used to determine linkages among soil properties, root mass density, and soil detachment rate. Relationships among soil detachment rate, soil properties, flow shear stress and restoration age were analyzed by the regression method. The data analyses were conducted in SPSS v. 16.0 statistical software (IBM Corp., Armonk, NY, USA). The figure plotting was conducted by Origin v. 2020 (OriginLab Corp., Northampton, MA, USA).

3. Results and Discussion

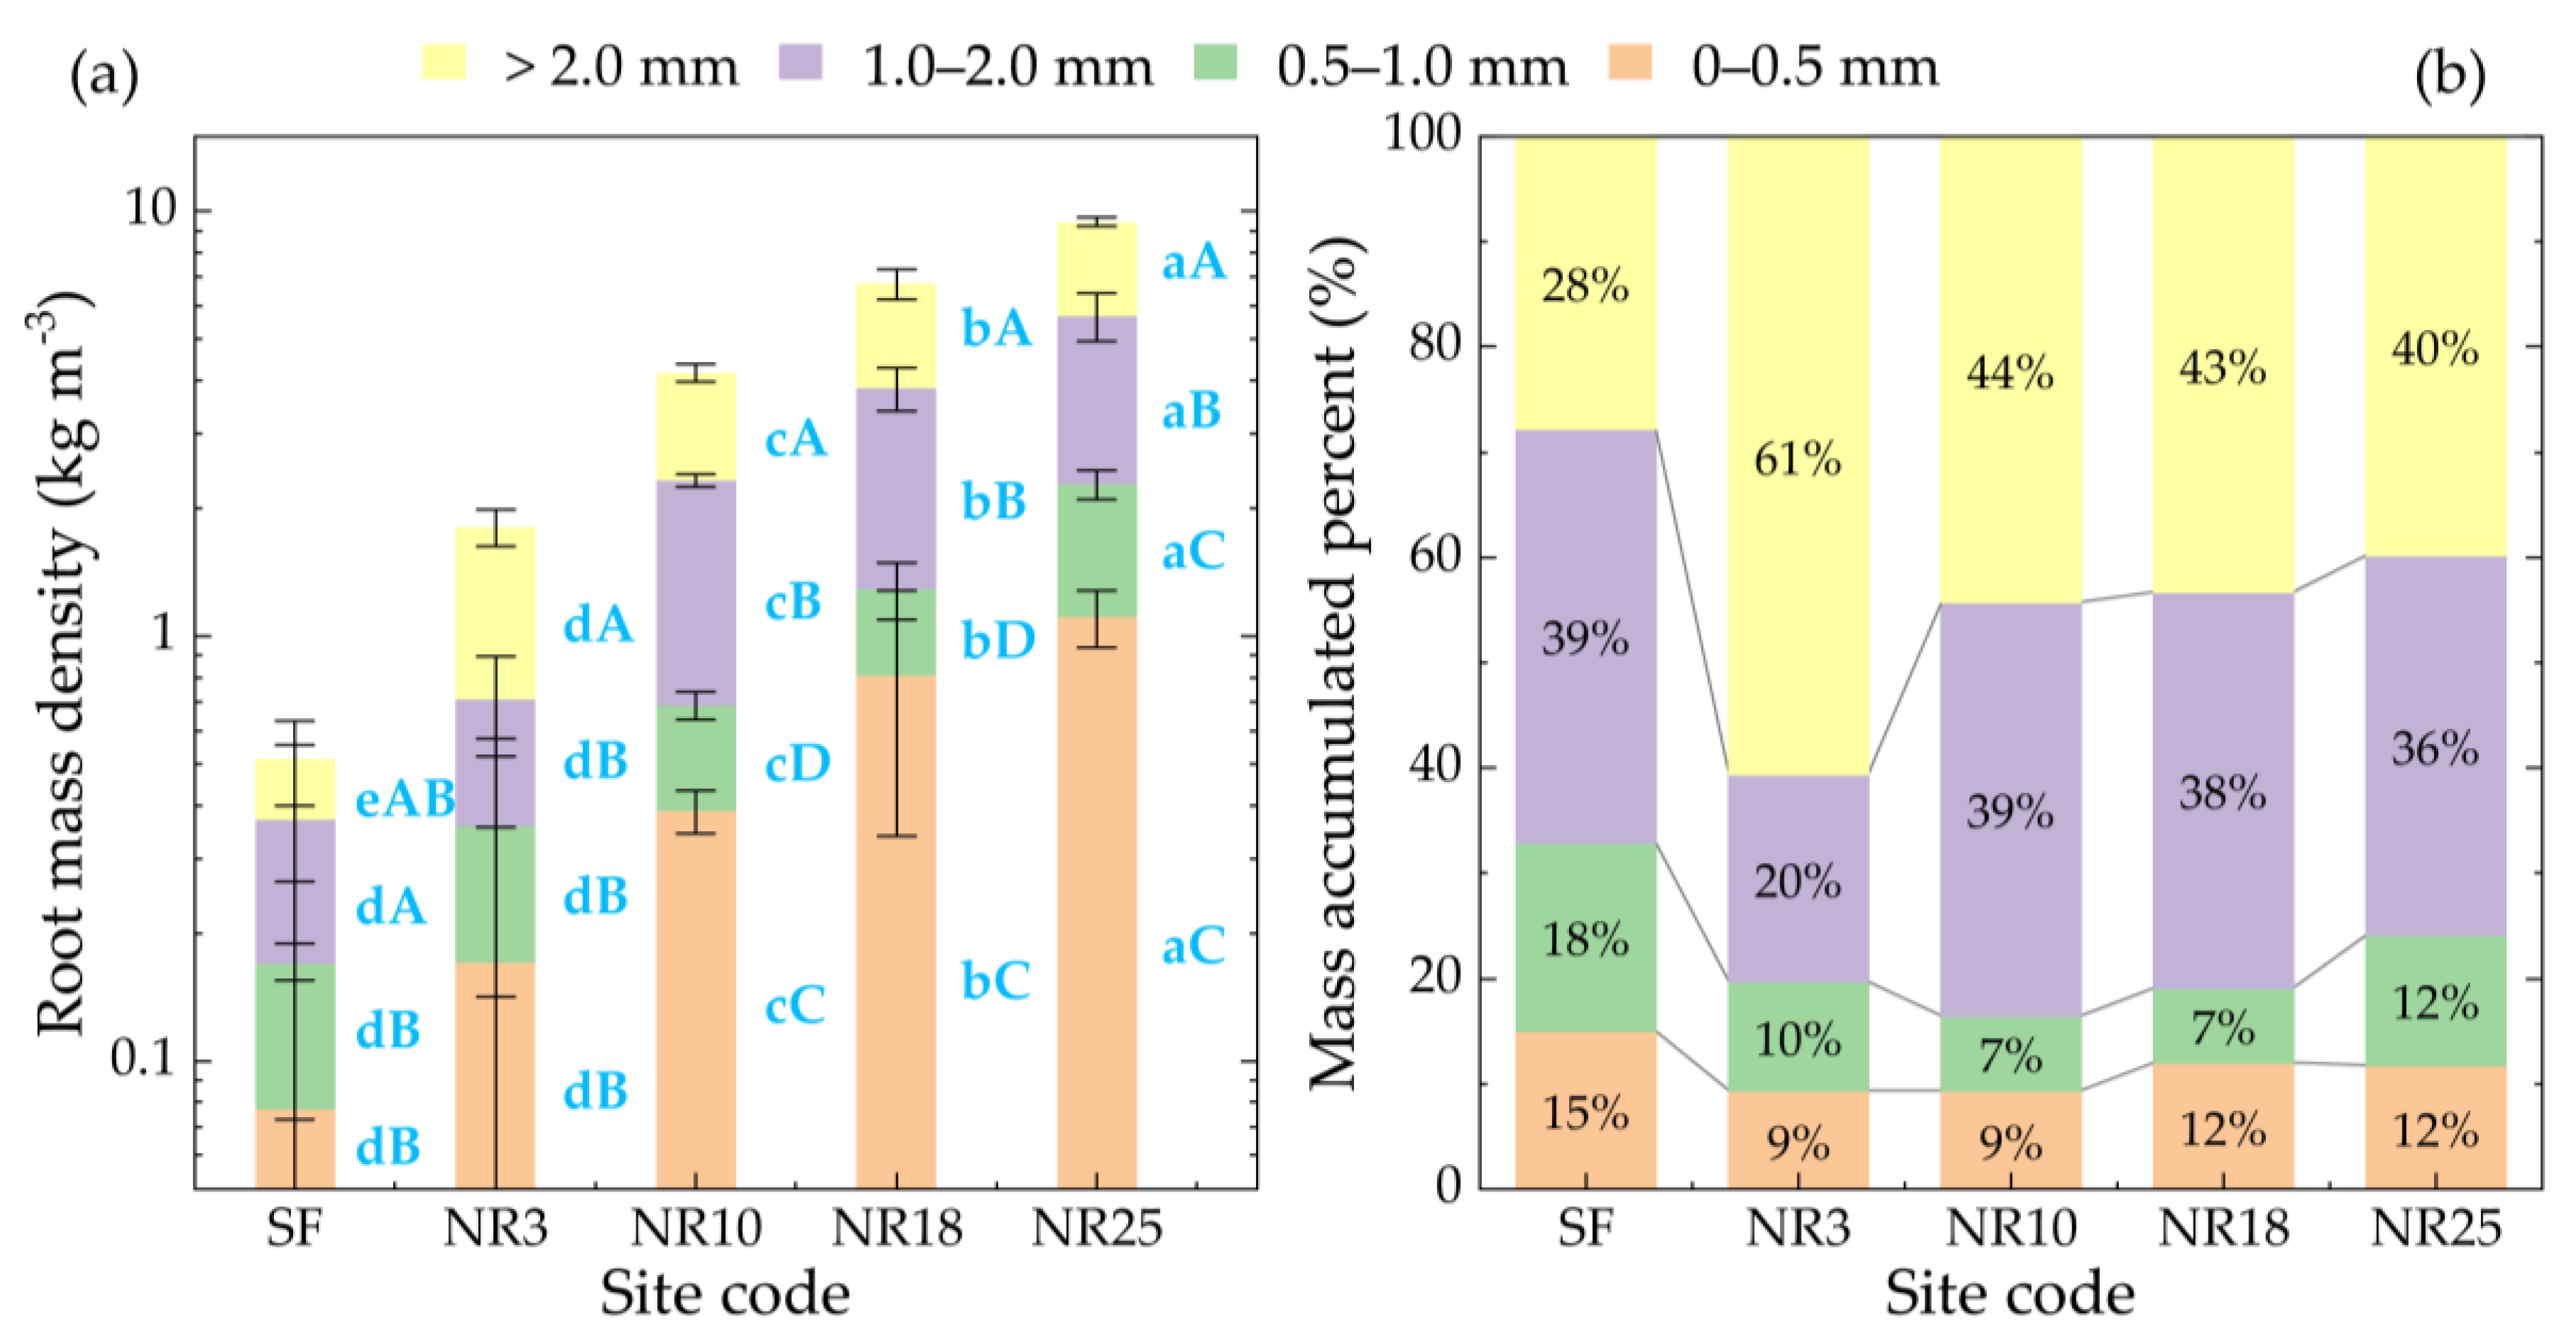
3.1. Effect of Revegetation on Soil and Root Properties of Gully Heads

Figure 3 illustrates that the six soil properties of gully heads exhibited a significant increase or decrease with revegetation age. Compared with slope farmland, the soil bulk density (SBD) and soil disintegration rate (SDR) of revegetated gully heads significantly decreased by 5.7–18.6% and 28.8–80.5%, respectively (p < 0.05, Figure 3a,c), while the soil capillary porosity (SCP), saturated soil hydraulic conductivity (SHC), organic matter content (OMC) and water-stable aggregate (WSA) significantly increased by 3.9–13.8%, 17.4–236.2%, 34.2–221.8%, and 27.7–64.4%, respectively (p < 0.05, Figure 3b,d–f). Figure 4 illustrates that the roots of 1–2 mm in slope farmland had the relatively higher root mass density (RMD, 0.20 kg m−3) and accounted for 39% of total RMD. Notably, after revegetation, the RMD of >2.0 mm was significantly greater than those of the other three root diameters, and it can account for 40–61% of total RMD. When revegetation age was greater than 3 years, there was a significant difference in RMD among four root diameter levels (p < 0.05). In addition, we found that the RMD of four root diameters (except for >2.0 mm) showed a non-significant increase in the first three-years and then significantly increased.
These results were similar to previous findings regarding the effects of revegetation on soil properties [45,46,47]. In fact, the improvement of soil properties of gully heads with revegetation age can be attributed to the accumulation of fresh plant residues in surface soil as well as roots and decomposed root residues in subsurface soil [48]. These materials can be directly transformed into soil organic matter and thus provide energy/carbon sources and nutrients for soil microorganisms [49,50], further promoting the development of soil aggregation and enhancing the cohesion of soil particles [51]. Hence, vegetation restoration would induce the formation of macroaggregates and increase the water stability of aggregates [19,52].

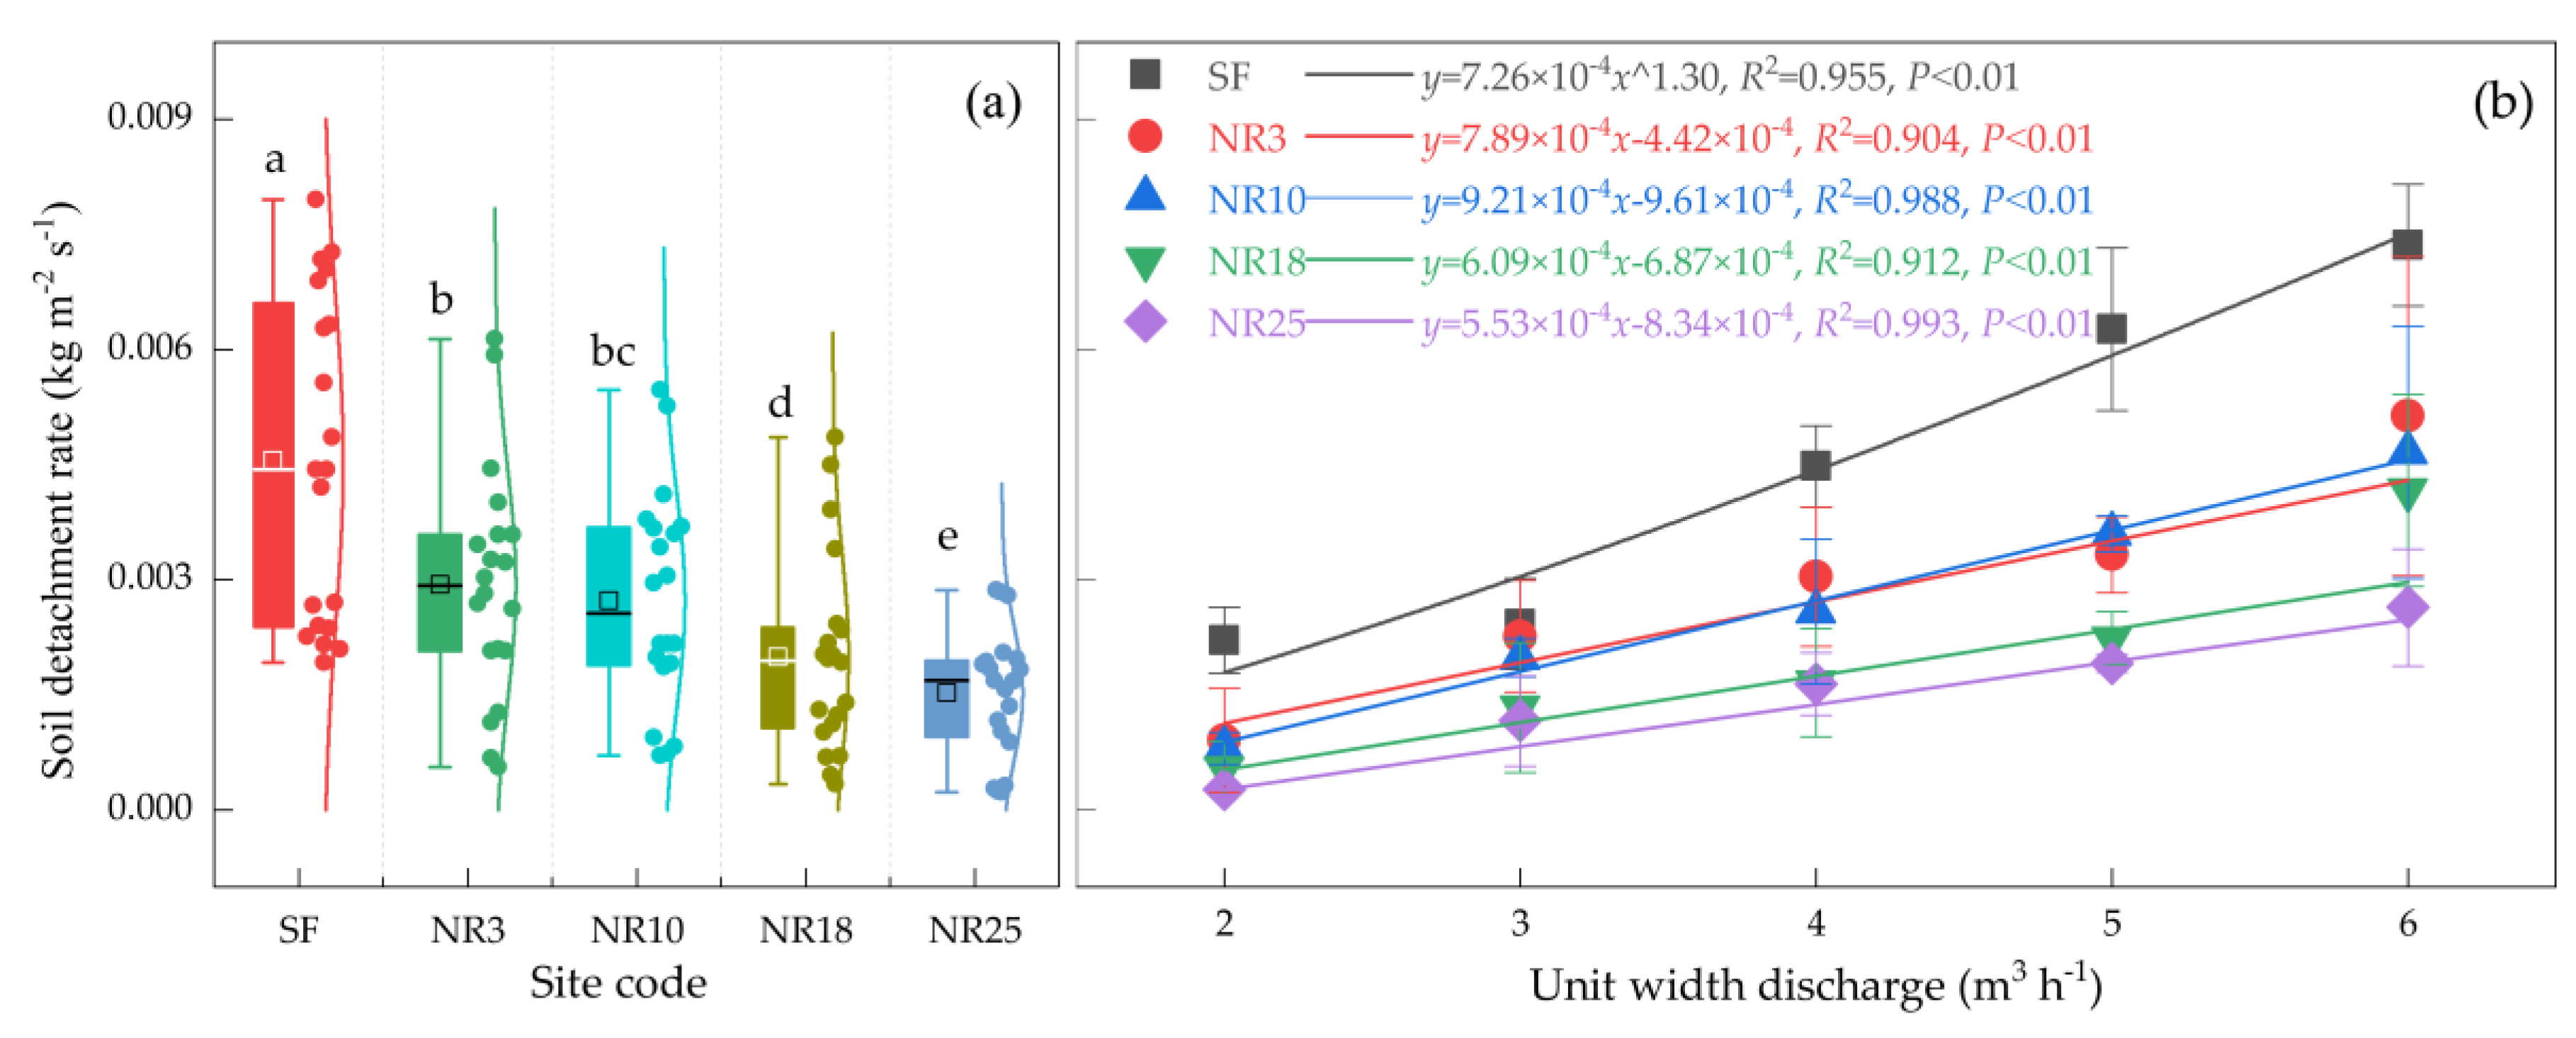
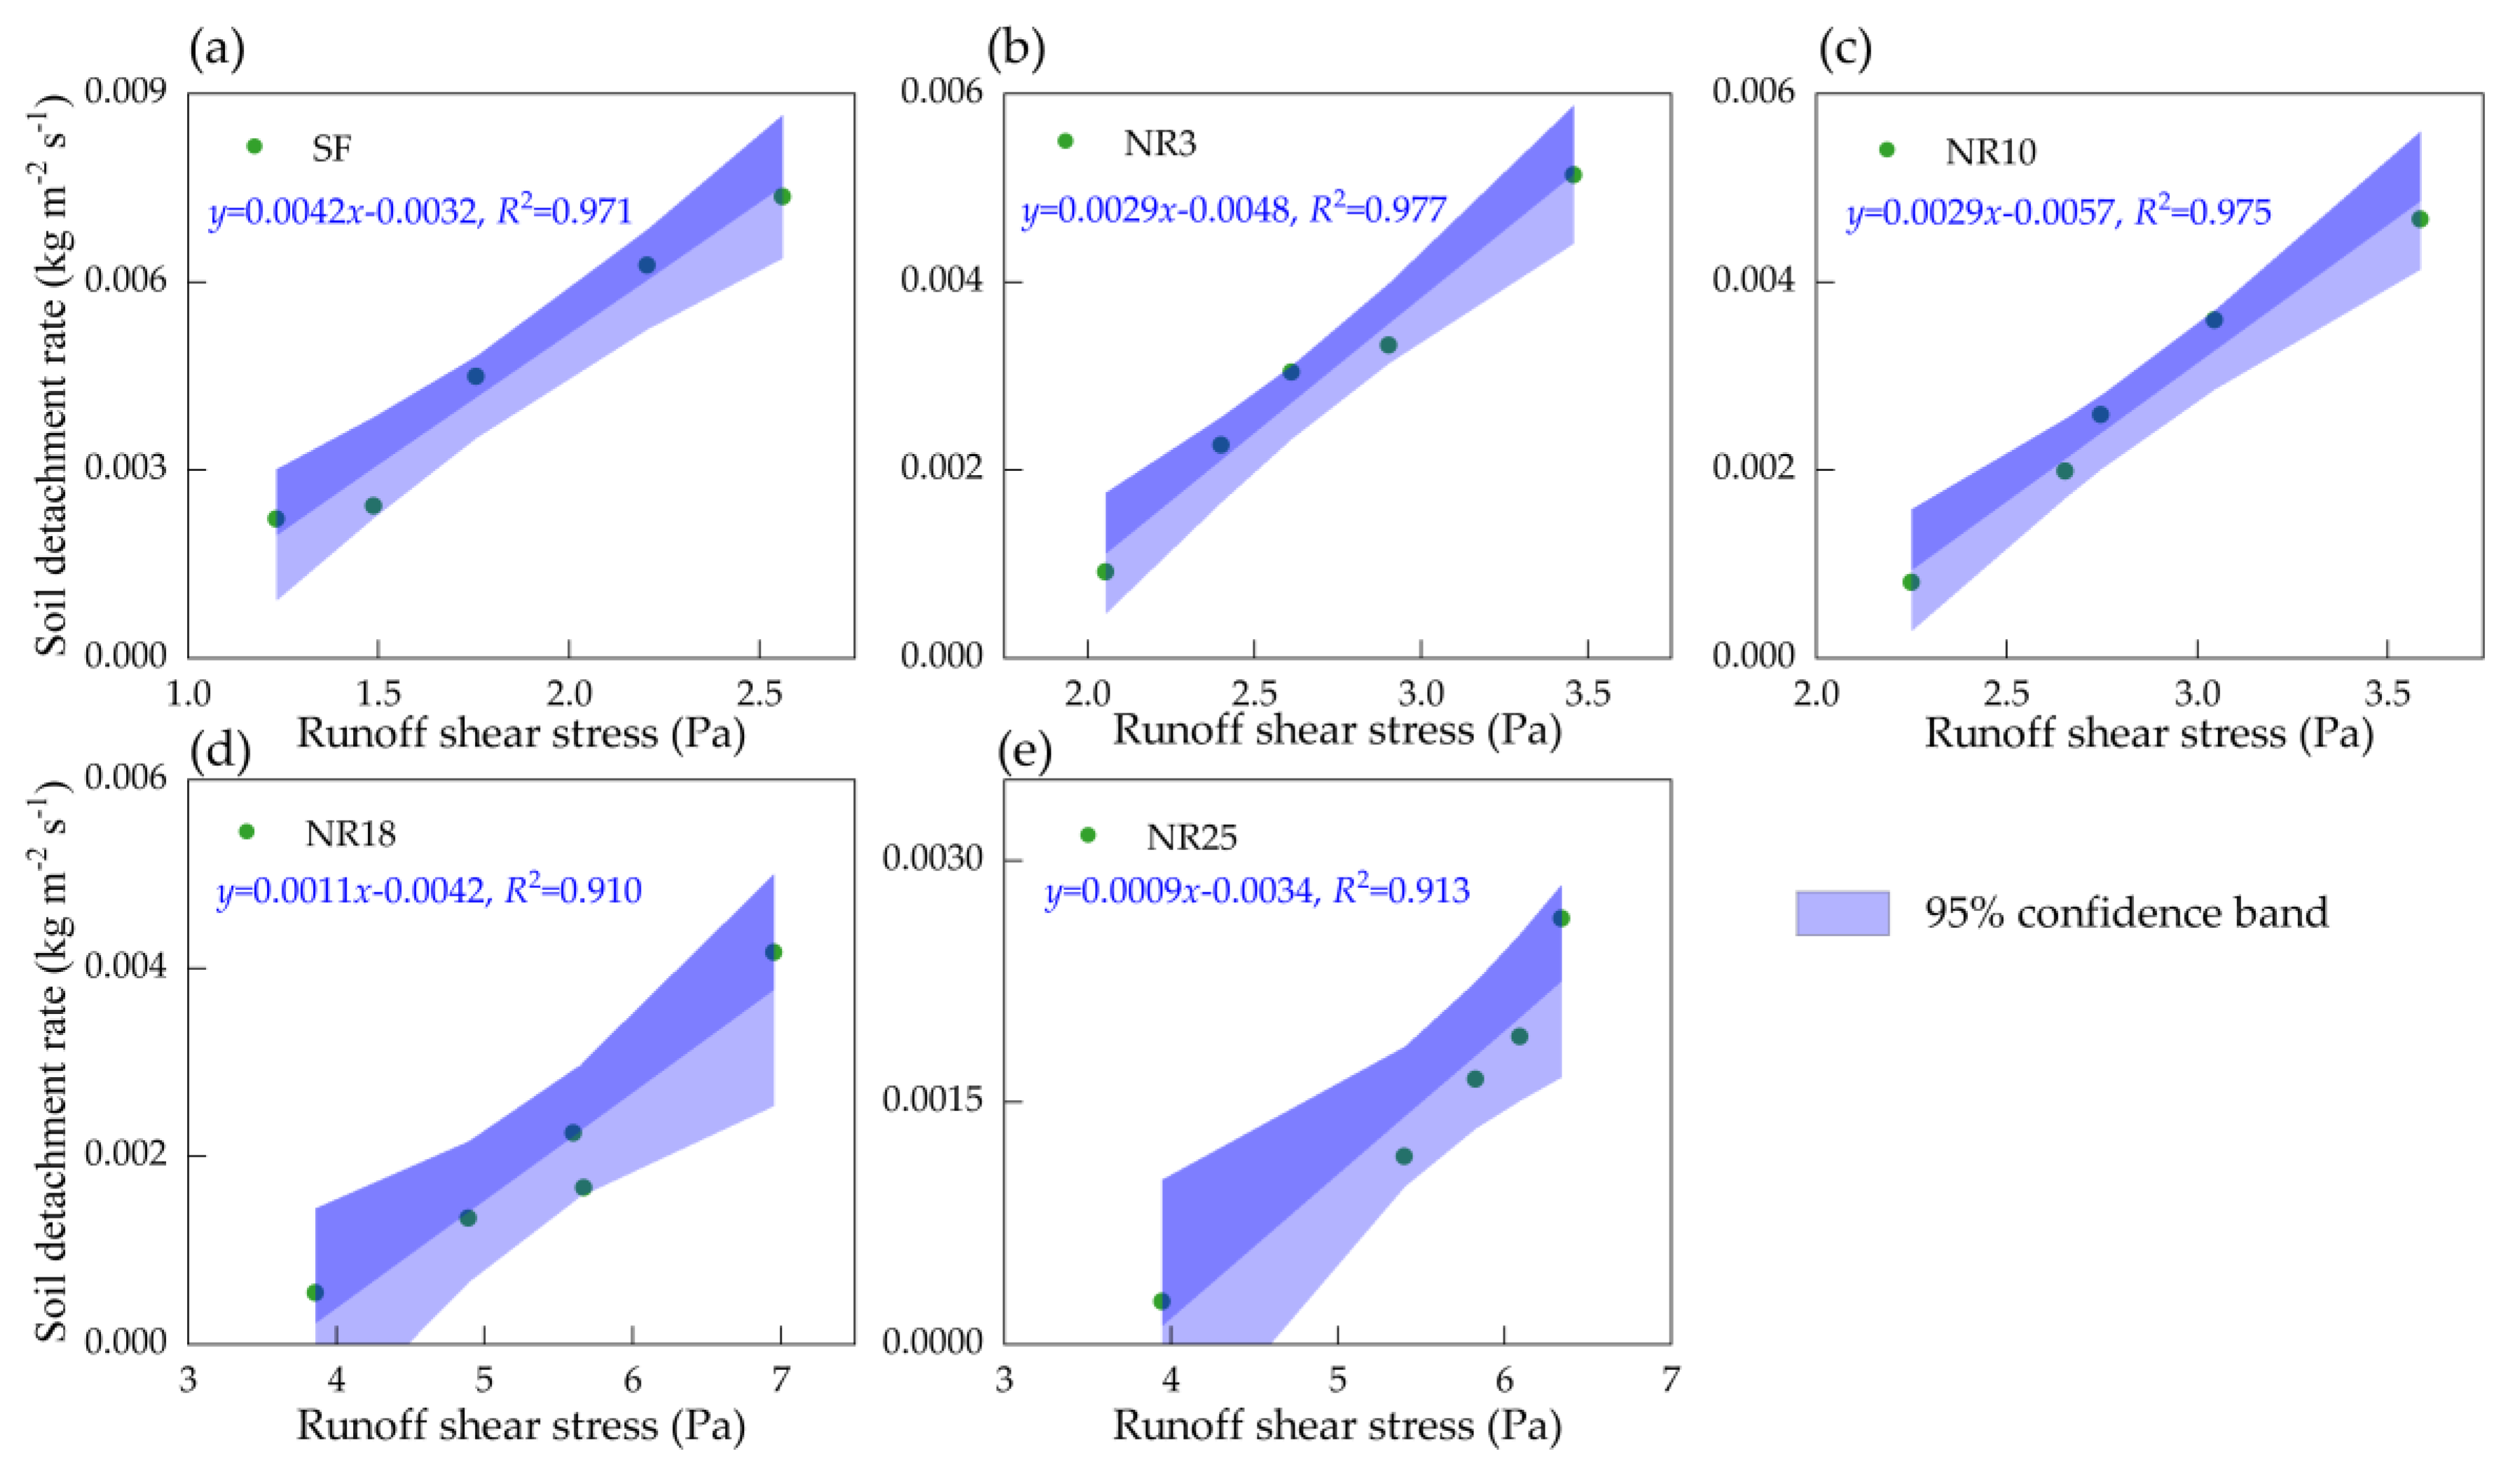
3.2. Effect of Revegetation Age on Soil Detachment of Gully Heads

As illustrated in Figure 5a, the Dr of gully heads showed a significant decrease during the 25-year revegetation. This result was not agreed with the conclusion of Wang et al. [16] who stated that soil detachment capacity of sloped lands fluctuated with abandonment time, and the soil detachment capacity of the slope farmland was significantly greater than those of the abandoned farmlands. The difference was mainly attributed to the great difference in erosion environment (e.g., plant type, geomorphological feature, climate) significantly affecting the succession process [36,47]. The mean Dr of slope farmland was 1.6 to 3.0 times greater than those of revegetated gully heads, which indicated that the revegetation played a role in enhancing the soil resistance of gully heads to concentrated flow erosion.
Figure 5b shows the Dr of gully heads of slope farmland and four restored grasslands varied with flow discharge. The optimal relationships between Dr and flow discharge were fitted, which can reflect the response of Dr of gully heads to concentrated flow induced by rainstorms of different recurrence intervals. It was found that the response of Dr of slope farmland to flow discharge could be expressed as a power function (y = m × xn), and the n-value was greater than 1, indicating the soil loss of gully heads increases at an increased speed with increasing flow. However, for the restored gully heads, the optimal relationships between Dr and flow discharge could be described by a series of linear functions (y = p × x + q), and the p-value decreased with revegetation age, indicating that the sensitivity of Dr of the gully heads to concentrated flow erosion gradually decreased with increasing restoration age. Besides, the interacted effect of revegetation age and unit width discharge significantly affected Dr (p < 0.001) (Table 2).

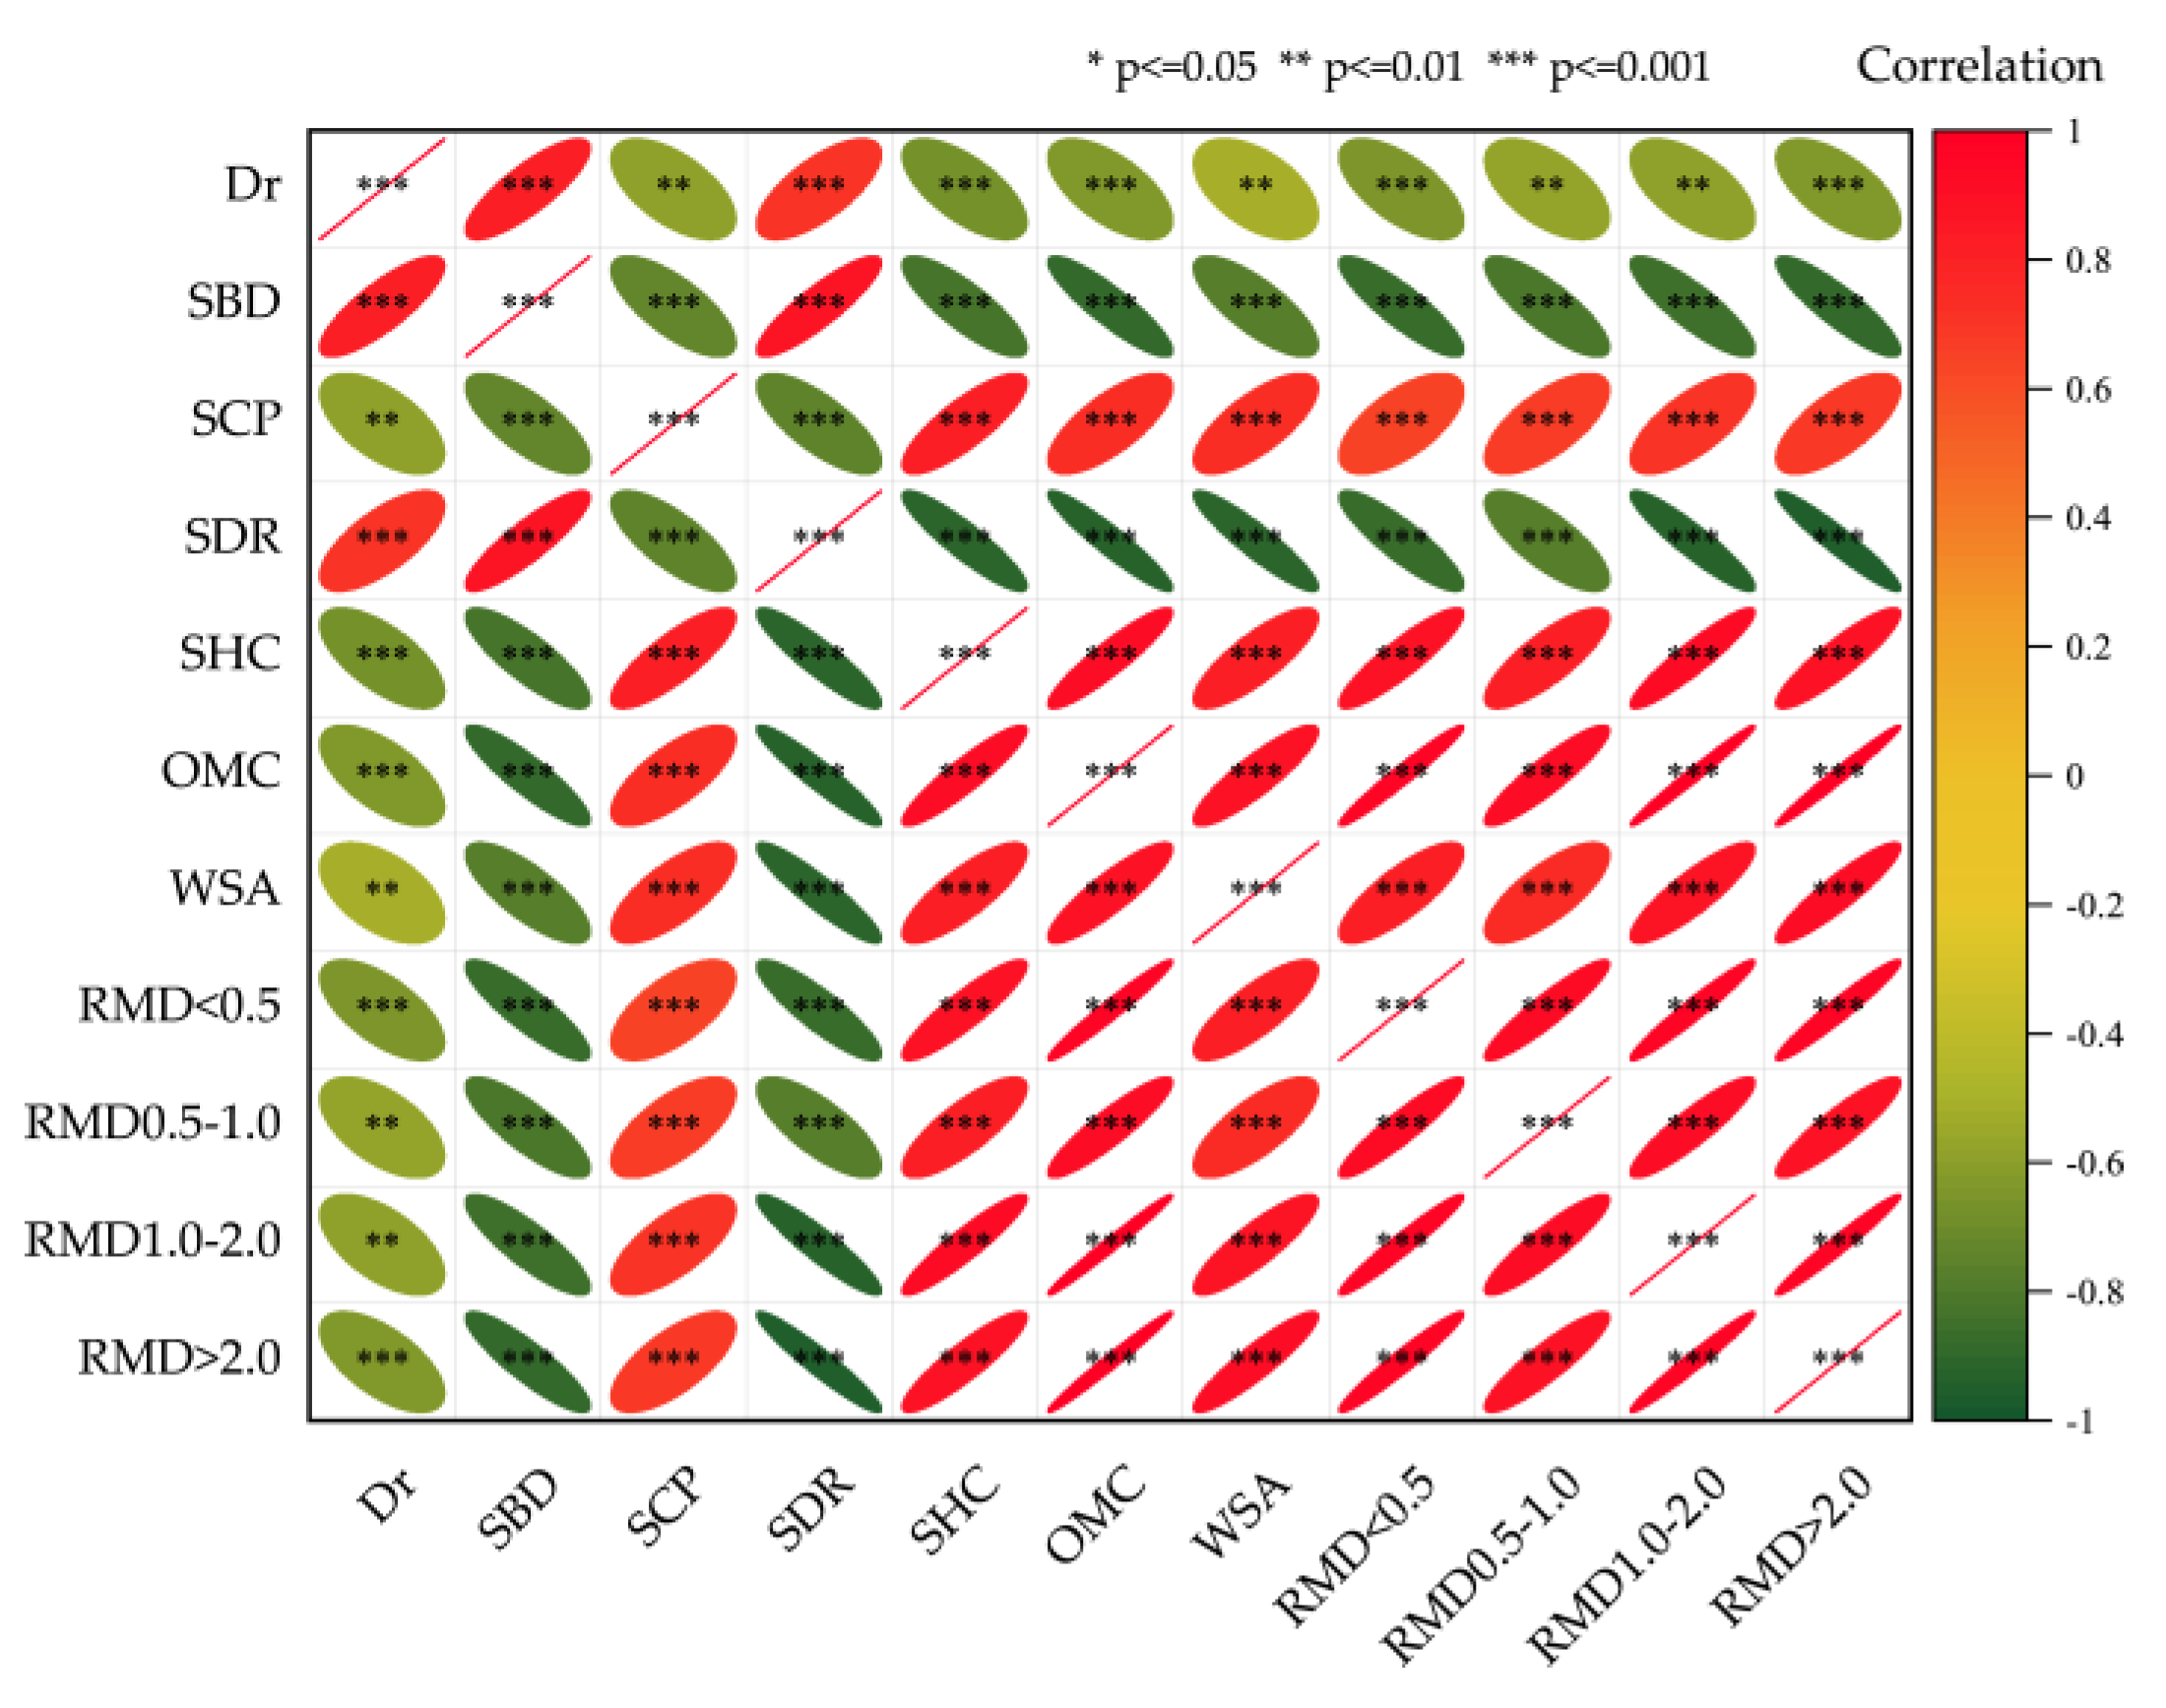
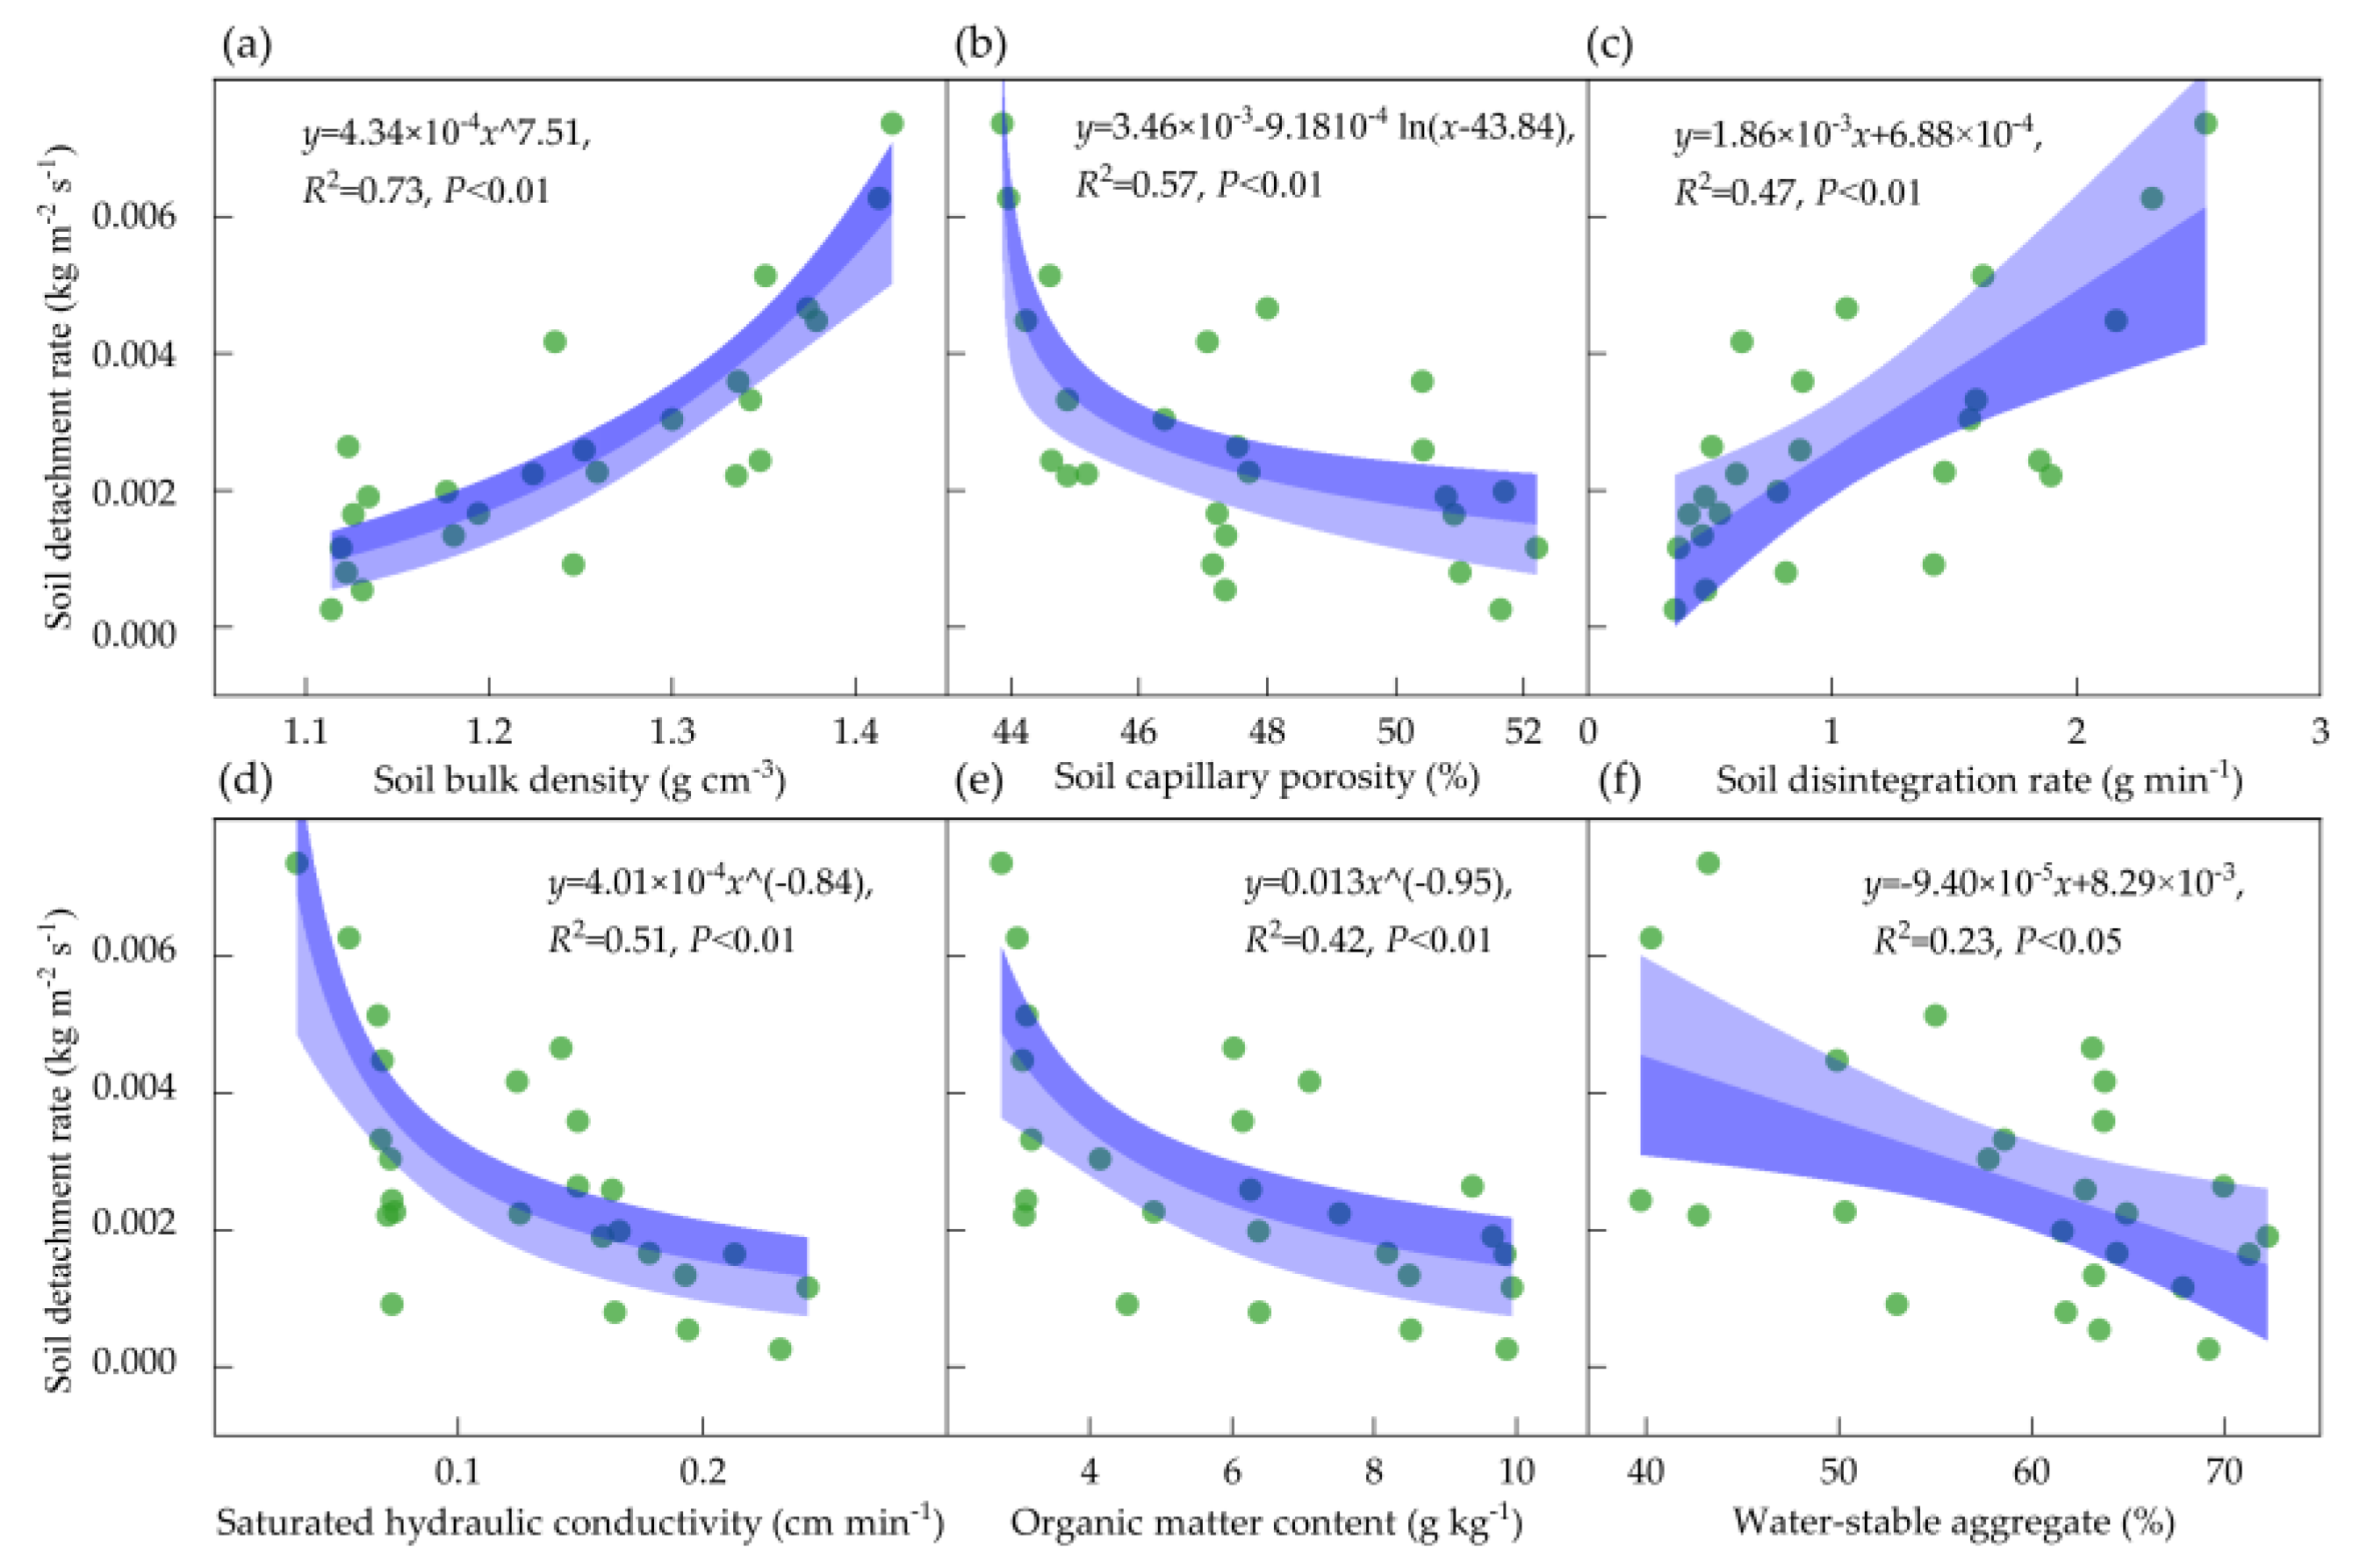
3.3. Response of Soil Detachment to Soil Properties

Figure 6 showed that Dr was positively correlated with soil bulk density and soil disintegration rate (p < 0.01), but negatively correlated with capillary porosity, saturated hydraulic conductivity, organic matter and water-stable aggregate of >0.25 mm (p < 0.01). Regression analysis showed that Dr increased with soil bulk density as a power function (Figure 7a), which showed an opposite trend with the Wang et al. [13] and Yu et al. [15]. Lower soil bulk density was caused by greater root physical and soil organisms’ activities, and thus a soil with lower bulk density was harder to be detached. Additionally, Dr decreased with capillary porosity as a logarithmic function (Figure 7b), which was caused by physically binding and chemically bonding effect of root improving soil structure and porosity and hence increasing soil resistance to erosion [28,53]. Soil disintegration rate referred to the dispersion speed of soil contacting with water, which is an important factor determining soil resistance to erosion [14]. In this study, the soil disintegration rate decreased with the revegetation time (Figure 3c) and Dr increased linearly with an increase in soil disintegration rate (Figure 7c). This is attributed to root wedging mechanism preventing soil from detaching that roots can bind soil and tie surface soil layer into strong and stable subsurface soil layer [14,54]. Saturated soil hydraulic conductivity is an integrating parameter for several physical characteristics such as bulk density, porosity, and mechanical composition. The conclusion that the Dr decreased with increasing soil hydraulic conductivity by a power function is reasonable (Figure 7d) because this study and previous research findings have also indicated that changes in soil bulk density and porosity influenced soil detachment and also were affected by revegetation (e.g., Neves et al. [55]; Zhang et al. [56]). A negative power function was found between Dr and soil organic matter content (Figure 7e). The accumulation of soil organic matter in soil could promote the formation of aggregate and enhance the cohesion of soil particles [57]. Hence, water-stable aggregate also was an indicator determining soil resistance to flow erosion [19]. The Dr decreased as a linear function of water-stable aggregate of >0.25 mm (Figure 7f). The results were in agreement with the findings of Li et al. [14]. However, in Wang et al. [13,16] studies, no significant relationships were found between Dr and organic matter and water-stable aggregate of >0.25 mm, probably caused by small variations of the two factors in their studies and difference in land use between their studies and this study (Podwojewski et al. [58]).

3.4. Response of Soil Loss of Gully-Head to Root Traits

Significant correlation was found between Dr and RMD of 0–0.5 mm, 0.5–1.0 mm, 1.0–2.0 mm and >2.0 mm (p < 0.01, Figure 6), of which the RMD of 0–0.5 mm had the highest correlation with Dr, indicating that roots of each diameter level had the significant impact on soil erosion of gully heads, especially the fibrous root of 0–0.5 mm. Furthermore, the Hill curve could well simulate the relationships between Dr and RMD of different root diameters with R2 varying from 0.42 to 0.57 (Figure 8). As illustrated in Figure 8, the Dr showed a rapid decrease when RMD of 0–0.5, 0.5–1.0, 1.0–2.0 and >2.0 mm ranged from 0 to 0.25 kg m−3, 0 to 0.3 kg m−3, 0 to 0.5 kg m−3, and 0 to 1.0 kg m−3, respectively, implying that soil erosion of gully heads could be controlled once vegetation restoration or root growth in soil. Although the roots were limited in density and flexible in early revegetation stage, whereas, roots can contribute to soil cohesion and additional strength, and be crucial in reduction of soil erosion [28,59]. Additionally, root system can bind soil and tie surface soil layer into strong and stable subsurface soil layer [54]. Well-developed root system had great physical binding and chemical bonding effect that could well bind soil particles and soil aggregates together and enhance soil resistance to erosion [16,28,42].
In addition, judged by fitted efficiency (R2), the optimal results were found in RMD of 0–0.5 mm (Figure 8a), indicating that fibrous root of 0–0.5 mm is the optimal root system reducing soil loss of gully heads. However, Li et al. [44] reported that the ability of plant roots to decrease soil erosion mainly depended on the number of fibrous roots <1.0 mm. Shangguan et al. [53] also found a similar result but recommended root surface area density as the root variable. The reason may be that plant species with contrasting root architectures have a different erosion reduction effect [25]. Additionally, Amezketa [60] and Gyssels et al. [61] reported that monocotyledonous plants are superior to dicotyledonous plants and grasses are better than cereals in stabilizing soil aggregates.
According to Li et al. [44], b^(1/a) can be used as an indicator to compare the effectiveness of different diameter roots in reducing soil erosion. The lower b^(1/a), the more effective the diameter root. The relatively lower b^(1/a) values (0.132 and 0.131 kg m−3) were found in the roots of 0–0.5 mm and 0.5–1.0 mm than 1.0–2.0 mm and >2.0 mm (Figure 8), indicating that the 0–0.5 mm and 0.5–1.0 mm are the most effective roots in reducing soil erosion of gully heads. However, De Baets et al. [25] study the effect of the mixed community of four grasses [Lolium perenne (variety: tove), L. perenne (variety: starlet), Festuca rubra (variety: echo), and F. arundinacea (variety: starlet)] on SDR and found the b^(1/a) value is 0.79 kg m−3 that is greater than that of our study. The result fully indicated that the different plant communities had the markedly different influences on reducing soil erosion. The result also suggested us reasonably choosing plant species with different root architectures and root diameters for revegetation at gully heads.

3.5. Effect of Revegetation Age on Soil Erosion Resistance of Gully Head

Rill soil erodibility parameter (Kr) and critical shear stress (τc) were employed to characterize the soil erosion resistance of gully heads [13,21], and were determined by the WEPP model (Equation (4)). The fitted linear function between Dr and shear stress was illustrated in Figure 9. The slope of the fitted line is equal to the Kr, and the Kr of the restored grasslands were 31% to 78.6% less than that of slope farmland. In addition, we found that the soil erodibility of 3-year restored grassland rapidly declined by 31% compared with the slope farmland, indicating the short-term revegetation can rapidly reduce soil erodibility of gully heads. The Kr of grasslands in this study ranged from 0.0009 to 0.0029 s m−1, which were less than those reported by Li et al. [14]. Wang et al. [13] found that averaged Kr of restored lands of abandoned farmland was 0.0024 s m−1 that was close to those of this study. The difference was mainly caused by differences in land use, plant species and restoration time. The soil samples were taken from different vegetation restoration models (korshinsk peashrub, black locust, Chinese pine and mixed forest of amorpha and Chinese pine) in the study of Wang et al. [13], and the restoration age (37 years) was greater than that of this study (3 to 25 years). Regression analysis found that the Kr decreased with restoration time in an exponential function and showed a slight change when restored age was greater than 18 years (Figure 10).
In addition, the τc increased with restoration age by a power function (Figure 10). However, the result was inconsistent with the finding of Wang et al. [16] that critical shear stress varied with restoration age in a nonlinear pattern, reaching the minimum at the restored age of 18. The difference in the temporal change of critical shear stress between Wang et al. [13] and this study was caused probably by differences in soil properties and vegetation characteristics of the sampling sites. Compared with slope farmland, the τc of the grasslands was improved by 1.2 to 4.0 times, while τc of restored land had a little decrease when restored time was more than 18 years (Figure 10). The result further indicated that revegetation can effectively improve the soil erosion resistance of gully head to concentrated flow, and the critical shear stress would reach a stable state after a 18-year revegetation.

4. Conclusions

This study was carried out to explore the effect of revegetation age on soil erosion resistance of gully heads in the gully region of the Loess Plateau. The results showed that revegetation significantly improved soil properties and promoted root accumulation of gully heads. The mean Dr of slope farmland was 1.6 to 3.0 times greater than those of revegetated gully heads. The revegetation can effectively weaken the sensitivity of soil erosion of the gully heads to concentrated flow. The Dr of gully heads was positively related to bulk density and disintegration rate and negatively related to soil capillary porosity, saturated soil hydraulic conductivity, organic matter content, and water-stable aggregate. Roots of 0–0.5 mm and 0.5–1.0 mm were the most effective roots in reducing soil erosion of gully head, and the native plant species with rich root of 0.5–1.0 mm and 0–0.5 mm were recommended as the first choice for revegetation to restrain gully headcut erosion. Revegetation can reduce soil erodibility of gully heads by 31% to 78.6% and improve the critical shear stress by 1.2 to 4.0 times. This study allows us to better evaluate soil vulnerability of gully head to concentrated flow erosion during revegetation. Further studies are needed to quantify the effect of the different combinations of vegetation types with different root architecture types on soil erosion resistance of gully heads.

Author Contributions

Conceptualization, Z.C. and M.G.; data curation, Z.C.; formal analysis, Z.C. and M.G.; funding acquisition, W.W.; investigation Z.C. and M.G.; methodology, Z.C.; project administration, W.W.; resources, W.W.; software, Z.C.; supervision, W.W.; validation, W.W.; writing—original draft, Z.C.; writing—review and editing, M.G. and W.W. All authors have read and agreed to the published version of the manuscript.

Funding

This work was supported by the National Natural Science Foundation of China (42077079; 41571275).

Acknowledgments

All authors thank anonymous reviewers for insightful comments on the original manuscript.

Conflicts of Interest

The authors declare no conflict of interest.

References

  1. Mohammed, S.; Al-Ebraheem, A.; Holb, I.J.; Alsafadi, K.; Dikkeh, M.; Pham, Q.B.; Linh, N.T.T.; Szabo, S. Soil management effects on soil water erosion and runoff in central Syria—A comparative evaluation of general linear model and random forest regression. Water 2020, 12, 2529. [Google Scholar] [CrossRef]
  2. Hao, H.X.; Cheng, L.; Guo, Z.L.; Wang, L.; Shi, Z.H. Plant community characteristics and functional traits as drivers of soil erodibility mitigation along a land degradation gradient. Land Degrad. Dev. 2020, 31, 1851–1863. [Google Scholar] [CrossRef]
  3. Zarris, D.; Lykoudi, E.; Panagoulia, D. Assessing the impacts of sediment yield on the sustainability of major hydraulic systems. In Proceedings of the International Conference “Protection and Restoration of the Environment VIII”, Chania, Greece, 3–7 July 2006. [Google Scholar]
  4. Brazier, R.E.; Beven, K.J.; Freer, J.; Rowan, J.S. Equifinality and uncertainty in physically based soil erosion models: Application of the GLUE methodology to WEPP–the water erosion prediction project–for sites in the UK and USA. Earth Surf. Process. Landf. 2000, 25, 825–845. [Google Scholar] [CrossRef]
  5. Kinnell, P.; Risse, L.M. USLE-M: Empirical modeling rainfall erosion through runoff and sediment concentration. Soil Sci. Soc. Am. J. 1998, 62, 1667–1672. [Google Scholar] [CrossRef]
  6. Nearing, M.A.; Foster, G.R.; Lane, L.J.; Finkner, S.C. A process-based soil erosion model for USDA-water erosion prediction project technology. Trans. ASAE 1989, 32, 1587–1593. [Google Scholar] [CrossRef]
  7. Efthimiou, N.; Lykoudi, E.; Panagoulia, D.; Karavitis, C. Assessment of soil susceptibility to erosion using the EPM and RUSLE models: The case of Venetikos river catchment. Glob. Nest. J. 2016, 18, 164–179. [Google Scholar]
  8. Guo, W.Z.; Kang, H.L.; Wang, W.L.; Guo, M.M.; Chen, Z.X. Erosion-reducing effects of revegetation and fish-scale pits on steep spoil heaps under concentrated runoff on the Chinese Loess Plateau. Land Degrad. Dev. 2020. [Google Scholar] [CrossRef]
  9. Gramlich, A.; Stoll, S.; Stamm, C.; Walter, T.; Prasuhn, V. Effects of artificial land drainage on hydrology, nutrient and pesticide fluxes from agricultural fields—A review. Agric. Ecosyst. Environ. 2018, 266, 84–99. [Google Scholar] [CrossRef]
  10. Kervroëdan, L.; Armand, R.; Saunier, M.; Ouvry, J.; Faucon, M. Plant functional trait effects on runoff to design herbaceous hedges for soil erosion control. Ecol. Eng. 2018, 118, 143–151. [Google Scholar] [CrossRef] [Green Version]
  11. Sun, L.; Zhang, G.H.; Luan, L.L.; Liu, F. Temporal variation in soil resistance to flowing water erosion for soil incorporated with plant litters in the Loess Plateau of China. Catena 2016, 145, 239–245. [Google Scholar] [CrossRef]
  12. Chang, E.; Li, P.; Li, Z.; Su, Y.; Zhang, Y.; Zhang, J.; Liu, Z.; Li, Z. The impact of vegetation successional status on slope runoff erosion in the Loess Plateau of China. Water 2019, 11, 2614. [Google Scholar] [CrossRef] [Green Version]
  13. Wang, B.; Zhang, G.H.; Shi, Y.Y.; Zhang, X.C. Soil detachment by overland flow under different vegetation restoration models in the Loess Plateau of China. Catena 2014, 116, 51–59. [Google Scholar] [CrossRef]
  14. Li, Z.W.; Zhang, G.H.; Geng, R.; Wang, H.; Zhang, X.C. Land use impacts on soil detachment capacity by overland flow in the Loess Plateau, China. Catena 2015, 124, 9–17. [Google Scholar] [CrossRef]
  15. Yu, Y.C.; Zhang, G.H.; Geng, R.; Sun, L. Temporal variation in soil detachment capacity by overland flow under four typical crops in the Loess Plateau of China. Biosyst. Eng. 2014, 122, 139–148. [Google Scholar] [CrossRef]
  16. Wang, B.; Zhang, G.H.; Shi, Y.Y.; Zhang, X.C.; Ren, Z.P.; Zhu, L.J. Effect of natural restoration time of abandoned farmland on soil detachment by overland flow in the Loess Plateau of China. Earth Surf. Process. Landf. 2013, 38, 1725–1734. [Google Scholar] [CrossRef]
  17. Scherer, U.; Zehe, E.; Tr Bing, K.; Kai, G. Prediction of soil detachment in agricultural loess catchments: Model development and parameterisation. Catena 2012, 90, 63–75. [Google Scholar] [CrossRef]
  18. Zhang, G.H.; Tang, M.K.; Zhang, X.C. Temporal variation in soil detachment under different land uses in the Loess Plateau of China. Earth Surf. Process. Landf. 2010, 34, 1302–1309. [Google Scholar] [CrossRef]
  19. Bernard, B.; Roose, E. Aggregate stability as an indicator of soil susceptibility to runoff and erosion; validation at several levels. Catena 2002, 47, 133–149. [Google Scholar]
  20. Knapen, A.; Poesen, J.; Govers, G.; Baets, S.D. The effect of conservation tillage on runoff erosivity and soil erodibility during concentrated flow. Hydrol. Process. 2008, 22, 1497–1508. [Google Scholar] [CrossRef]
  21. Guo, M.M.; Wang, W.L.; Wang, T.C.; Wang, W.X.; Kang, H.L. Impacts of different vegetation restoration options on gully head soil resistance and soil erosion in loess tablelands. Earth Surf. Process. Landf. 2020, 45, 1038–1050. [Google Scholar] [CrossRef]
  22. Lazarovitch, N.; Vanderborght, J.; Jin, Y.; van Genuchten, M.T. The root zone: Soil physics and beyond. Vadose Zone J. 2018, 17, 1–6. [Google Scholar] [CrossRef] [Green Version]
  23. Panagoulia, D. Hydrological modelling of a medium-size mountainous catchment from incomplete meteorological data. J. Hydrol. 1992, 137, 279–310. [Google Scholar] [CrossRef]
  24. Falkenmark, M. Land and water integration and river basin management. FAO Land Water Bull. 1995, 1, 15–16. [Google Scholar]
  25. Baets, S.D.; Poesen, J. Empirical models for predicting the erosion-reducing effects of plant roots during concentrated flow erosion. Geomorphology 2010, 118, 425–432. [Google Scholar] [CrossRef]
  26. Guo, M.M.; Wang, W.L.; Shi, Q.H.; Chen, T.D.; Kang, H.L.; Li, J.M. An experimental study on the effects of grass root density on gully headcut erosion in the gully region of China’s Loess Plateau. Land Degrad. Dev. 2019, 30, 2107–2125. [Google Scholar] [CrossRef]
  27. Khanal, A.; Fox, G.A. Detachment characteristics of root-permeated soils from laboratory jet erosion tests. Ecol. Eng. 2017, 100, 335–343. [Google Scholar] [CrossRef] [Green Version]
  28. De Baets, S.; Poesen, J.; Gyssels, G.; Knapen, A.; Adili, A.A. Effects of grass roots on the erodibility of topsoils during concentrated flow. Geomorphology 2006, 76, 54–67. [Google Scholar] [CrossRef]
  29. Mamo, M.; Bubenzer, G.D. Detachment rate, soil erodibility, and soil strength as influenced by living plant roots part II: Field study. Trans. ASAE 2001, 5, 1175–1181. [Google Scholar] [CrossRef]
  30. Mamo, M.; Bubenzer, G.D. Detachment rate, soil erodibility, and soil strength as influenced by living plant roots part I: Laboratory study. Trans. ASAE 2001, 5, 1167–1174. [Google Scholar] [CrossRef]
  31. Baets, S.D.; Poesen, J.; Knapen, A.; Galindo, P. Impact of root architecture on the erosion-reducing potential of roots during concentrated flow. Earth Surf. Process. Landf. 2007, 32, 1323–1345. [Google Scholar] [CrossRef]
  32. Shi, Q.; Wang, W.; Guo, M.; Chen, Z.; Feng, L.; Zhao, M.; Xiao, H. The impact of flow discharge on the hydraulic characteristics of headcut erosion processes in the gully region of the Loess Plateau. Hydrol. Process. 2019, 34, 718–729. [Google Scholar] [CrossRef]
  33. Guo, M.M.; Wang, W.L.; Kang, H.L.; Yang, B. Changes in soil properties and erodibility of gully heads induced by vegetation restoration on the Loess Plateau, China. J. Arid Land 2018, 10, 712–725. [Google Scholar] [CrossRef] [Green Version]
  34. Fu, B.; Chen, L.; Ma, K.; Zhou, H.; Wang, J. The relationships between land use and soil conditions in the hilly area of the loess plateau in northern Shaanxi, China. Catena 2000, 39, 69–78. [Google Scholar] [CrossRef]
  35. Xiong, Y.; Zhou, J.Z.; Chen, L.; Jia, B.J.; Sun, N.; Tian, M.Q.; Hu, G.H. Land use pattern and vegetation cover dynamics in the three Gorges Reservoir (TGR) intervening Basin. Water 2020, 12, 2036. [Google Scholar] [CrossRef]
  36. Jiao, J.Y.; Tzanopoulos, J.; Xofis, P.; Bai, W.J.; Ma, X.H.; Mitchley, J. Can the study of natural vegetation succession assist in the control of soil erosion on abandoned croplands on the Loess Plateau, China? Restor. Ecol. 2007, 15, 391–399. [Google Scholar] [CrossRef]
  37. Wang, B.; Liu, G.B.; Xue, S.; Zhu, B.B. Changes in soil physico-chemical and microbiological properties during natural succession on abandoned farmland in the Loess Plateau. Environ. Earth Sci. 2011, 62, 915–925. [Google Scholar] [CrossRef]
  38. Chen, Y.P.; Wang, K.B.; Lin, Y.S.; Shi, W.Y.; Song, Y.; He, X.H. Balancing green and grain trade. Nat. Geosci. 2015, 8, 739–741. [Google Scholar] [CrossRef]
  39. Kompani-Zare, M.; Soufi, M.; Hamzehzarghani, H.; Dehghani, M. The effect of some watershed, soil characteristics and morphometric factors on the relationship between the gully volume and length in Fars Province, Iran. Catena 2011, 86, 150–159. [Google Scholar] [CrossRef]
  40. Guo, M.M.; Wang, W.L.; Kang, H.L.; Yang, B.; Li, J.M. Changes in soil properties and resistance to concentrated flow across a 25-year passive restoration chronosequence of grasslands on the Chinese Loess Plateau. Restor. Ecol. 2020, 28, 104–114. [Google Scholar] [CrossRef]
  41. Luk, S.H.; Merz, W. Use of the salt tracing technique to determine the velocity of overland flow. Sci. Total Environ. 1992, 5, 289–301. [Google Scholar]
  42. Li, Y.; Xu, X.Q.; Zhu, X.M.; Tian, J.Y. Effectiveness of plant roots on increasing the soil permeability on the Loess Plateau. Chin. Sci. Bull. 1992, 37, 1735–1738. [Google Scholar]
  43. Hill, A.V. The possible effects of the aggregation of the molecules of haemoglobin on its dissociation curves. J. Physiol. 1910, 40, 4–7. [Google Scholar]
  44. Li, Y.; Zhu, X.M.; Tian, J.Y.; Al-Ebraheem, A. Effectiveness of plant roots to increase the anti-scouribility of soil on the Loess Plateau. Chin. Sci. Bull. 1991, 36, 2077–2082. [Google Scholar]
  45. Gros, R.; Jocteur Monrozier, L.; Bartoli, F.; Chotte, J.L.; Faivre, P. Relationships between soil physico-chemical properties and microbial activity along a restoration chronosequence of alpine grasslands following ski run construction. Appl. Soil Ecol. 2004, 27, 7–22. [Google Scholar] [CrossRef]
  46. Li, Y.Y.; Shao, M.A. Change of soil physical properties under long-term natural vegetation restoration in the Loess Plateau of China. J. Arid. Environ. 2006, 64, 77–96. [Google Scholar] [CrossRef]
  47. Jiao, F.; Wen, Z.M.; An, S.S. Changes in soil properties across a chronosequence of vegetation restoration on the Loess Plateau of China. Catena 2011, 86, 110–116. [Google Scholar] [CrossRef]
  48. Zhao, Y.G.; Wu, P.T.; Zhao, S.W.; Feng, H. Variation of soil infiltrability across a 79-year chronosequence of naturally restored grassland on the Loess Plateau, China. J. Hydrol. 2013, 504, 94–103. [Google Scholar] [CrossRef]
  49. Six, J.; Elliott, E.T. Aggregation and soil organic matter accumulation in cultivated and native grassland soils. Soil Sci. Soc. Am. J. 1998, 62, 1367–1377. [Google Scholar] [CrossRef] [Green Version]
  50. Six, J.; Bossuyt, H.; Degryze, S.; Denef, K. A history of research on the link between (micro)aggregates, soil biota, and soil organic matter dynamics. Soil Tillage Res. 2004, 79, 7–31. [Google Scholar] [CrossRef]
  51. Six, J.; Paustian, K.; Elliott, E.T.; Combrink, C. Soil structure and organic matter I. distribution of aggregate-size classes and aggregate-associated carbon. Soil Sci. Soc. Am. J. 2000, 64, 681–689. [Google Scholar] [CrossRef]
  52. Kong, A.Y.Y.; Six, J.; Bryant, D.C.; Denison, R.F.; Kessel, C.V. The relationship between carbon input, aggregation, and soil organic carbon stabilization in sustainable cropping systems. Soil Sci. Soc. Am. J. 2005, 69. [Google Scholar] [CrossRef]
  53. Shangguan, Z.P.; Zheng, C.Z. Soil anti-scouribility enhanced by plant roots. J. Integr. Plant Biol. 2005, 47, 676–682. [Google Scholar]
  54. Adili, A.A.; Azzam, R.; GiovanniSpagnoli, S.J. Strength of soil reinforced with fiber materials (Papyrus). Soil Mech. Found. Eng. 2012, 48, 241–247. [Google Scholar] [CrossRef]
  55. Neves, C.S.V.J.; Feller, C.; Guimarães, M.F.; Medina, C.C.; Tavares Filho, J.; Fortier, M. Soil bulk density and porosity of homogeneous morphological units identified by the cropping profile method in clayey oxisols in Brazil. Soil Tillage Res. 2003, 71, 109–119. [Google Scholar] [CrossRef]
  56. Zhang, B.J.; Zhang, G.H.; Yang, H.Y.; Wang, H. Soil resistance to flowing water erosion of seven typical plant communities on steep gully slopes on the Loess Plateau of China. Catena 2019, 173, 375–383. [Google Scholar] [CrossRef]
  57. Fattet, M.; Fu, Y.; Ghestem, M.; Ma, W.; Foulonneau, M.; Nespoulous, J.; Le Bissonnais, Y.; Stokes, A. Effects of vegetation type on soil resistance to erosion: Relationship between aggregate stability and shear strength. Catena 2011, 87, 60–69. [Google Scholar] [CrossRef]
  58. Podwojewski, P.; Orange, D.; Jouquet, P.; Valentin, C.; Nguyen, V.T.; Janeau, J.L.; Tran, D.T. Land-use impacts on surface runoff and soil detachment within agricultural sloping lands in Northern Vietnam. Catena 2008, 74, 109–118. [Google Scholar] [CrossRef]
  59. Gyssels, G.; Poesen, J. The importance of plant root characteristics in controlling concentrated flow erosion rates. Earth Surf. Process. Landf. 2003, 28, 371–384. [Google Scholar] [CrossRef]
  60. Amézketa, E. Soil aggregate stability: A review. J. Integr. Plant Biol. 1999, 14, 83–151. [Google Scholar] [CrossRef]
  61. Gyssels, G.; Poesen, J.; Bochet, E.; Li, Y. Impact of plant roots on the resistance of soils to erosion by water: A review. Prog. Phys. Geogr. 2005, 29, 189–217. [Google Scholar] [CrossRef] [Green Version]
Figure 1. Location of the study area on the Loess Plateau and the location of sampling sites in the Nanxiaohegou watershed.
Water 12 03301 g001
Figure 2. Skitch of scouring flume for determining soil erosion resistance of gully heads.
Water 12 03301 g002
Figure 3. Variation in soil properties with revegetation age. Note: Bar means the 95% confidence interval (95% CI). Different lowercase letters indicate significant difference among different revegetation ages (p < 0.05). (a) Soil bulk density (SBD); (b) Soil capillary porosity (SCP); (c) Soil disintegration rate (SDR); (d) Saturated soil hydraulic conductivity (SHC); (e) Organic matter content (OMC); (f) Water-stable aggregate (WSA).
Water 12 03301 g003
Figure 4. Changes in root mass density (a) and its proportion (b) of different root diameters with revegetation age. Note: Bar means the 95% confidence interval (95% CI). SF refers to the slope farmland. NR3, NR10, NR18, NR25 represents the 3, 10, 18, and 25 years of natural restoration time, respectively. Different capital letters for the same restoration age indicate a significant difference among different root diameters (p < 0.05), and different lowercase letters for the same root diameter level indicate a significant difference among different revegetation ages (p < 0.05). (a) Root mass density; (b) Mass accumulated percent.
Water 12 03301 g004
Figure 5. Change in soil detachment rate of gully heads with restoration age (a), and its relationships with flow discharge (b). Note: Bar means the 95% confidence interval (95% CI). SF refers to the slope farmland. NR3, NR10, NR18, NR25 represents the 3, 10, 18 and 25 years of revegetation age, respectively. The different lowercase letters indicate a significant difference among different revegetation ages (p < 0.05). (a) Site code; (b) Unit width discharge.
Water 12 03301 g005
Figure 6. Correlation matrix among soil detachment rate, soil properties, and root mass density. Note: Dr, SBD, SCP, SDR, SHC, OMC, WAS, RMD < 0.5, RMD 0.5–1.0, RMD 1.0–2.0, and RMD > 2.0 refers to the soil detachment rate, soil bulk density, soil capillary porosity, soil disintegration rate, saturated soil hydraulic conductivity, organic matter content, water-stable aggregate, root mass density of <0.5 mm, root mass density of 0.5–1.0 mm, root mass density of 1.0–2.0 mm, and root mass density of >2.0 mm, respectively.
Water 12 03301 g006
Figure 7. Relationships between soil detachment rate and soil properties. (a) Soil bulk density (SBD); (b) Soil capillary porosity (SCP); (c) Soil disintegration rate (SDR); (d) Saturated soil hydraulic conductivity (SHC); (e) Organic matter content (OMC); (f) Water-stable aggregate (WSA).
Water 12 03301 g007
Figure 8. Relationships between relative soil detachment rate and root mass density of different root diameters. (a) Root of 0–0.5 mm; (b) Root of 0.5–1.0 mm; (c) Root of 1.0–2.0 mm; (d) Root > 2.0 mm.
Water 12 03301 g008
Figure 9. Relationship between soil detachment rate and shear stress under different revegetation ages. (a) SF; (b) NR3; (c) NR10; (d) NR18; (e) NR25.
Water 12 03301 g009
Figure 10. Relationships between soil erodibility and critical shear stress and revegetation age.
Water 12 03301 g010
Table 1. Basic information of the selected five sampling sites.
Site CodeRestoration Age (yr)Slope (°)Coverage (%)Altitude (m)Dominant CommunitiesMain Companion Species
SF02.41420Zea maysSetaria viridis
NR332.972.31405Artemisia capillarisArtemisia sacrorum
NR10102.480.81401Artemisia sacrorumArtemisia capillaris
NR18183.293.41390Artemisia sacrorumArtemisia capillaris
NR25253.191.21380Bothriochloa ischaemumArtemisia sacrorum + Lespedeza daurica
Table 2. Summary of two-way ANOVAs tests.
SourceSSDfMSFp-Value
Revegetation age1.08 × 10−442.69 × 10−5151.44<0.001
Unit width discharge1.75 × 10−444.38 × 10−5246.48<0.001
Revegetation age × Unit width discharge2.29 × 10−5161.43 × 10−68.07<0.001
Error1.33 × 10−5751.78 × 10−7
Total0.0011100
Publisher’s Note: MDPI stays neutral with regard to jurisdictional claims in published maps and institutional affiliations.

