Response and Modeling of Hybrid Maize Seed Vigor to Water Deficit at Different Growth Stages


Abstract
:1. Introduction
2. Materials and Methods
2.1. Experimental Site
2.2. Crop Management
2.3. Experimental Design
2.4. Sampling and Measurements
2.4.1. Yield and Yield Components
2.4.2. Evapotranspiration
2.4.3. Germination Test
2.4.4. Seedling Growth Test
2.4.5. Germination Index (GI)
2.4.6. Leachate EC
2.4.7. Enzyme Activity Assay
2.5. Assessment Methods
2.6. Water–Seed Vigor Models
2.7. Data Analysis
3. Results and Discussion
3.1. Soil Water Content, Evapotranspiration, Yield, Kernel Weight, and Seed Protein Content
3.2. Seed Vigor
3.3. Water–Seed Vigor Model
4. Conclusions
Author Contributions
Funding
Acknowledgments
Conflicts of Interest
References
- Denis, T.; Gales, D.; Chiriac, G.; Răus, L.; Jităreanu, G. Impact of plowing on some soil physical properties under hybrid seed corn production. ProEnvironment/ProMediu 2013, 6, 183–186. [Google Scholar]
- Venkatesh, T.V.; Breeze, M.L.; Liu, K.; Harrigan, G.G.; Culler, A.H. Compositional analysis of grain and forage from MON 87427, an inducible male sterile and tissue selective glyphosate-tolerant maize product for hybrid seed production. J. Agric. Food Chem. 2014, 62, 1964–1973. [Google Scholar]
- Benke, Z. The Corn Seed Production in Hungary in the Last 60 Years. In 60 Years of Hungarian Hybrid Maize 1953-2013, Proceedings of the Hybrid Maize Conference, Martonvasar, Hungary, 14 November 2013; Marton, L.C., Spitko, T., Eds.; Pannonian Plant Biotechnology Association: Martonvasar, Hungary, 2013. [Google Scholar]
- Arisnabarreta, S.; Solari, F. Hybrid maize seed production yield associations with inbred line performance in multienvironment trials. Crop Sci. 2017, 57, 3203–3216. [Google Scholar]
- Perry, D.A. Report of the vigour test committee 1974–1977. Seed Sci. Technol. 1978, 6, 159–181. [Google Scholar]
- Dalil, B.; Ghassemi-Golezani, K.; Moghaddam, M.; Raey, Y. Effects of seed viability and water supply on leaf chlorophyll content and grain yield of maize (Zea mays). J. Food Agric. Environ. 2010, 8, 399–402. [Google Scholar]
- Woodstock, L.W. Physiological and biochemical tests for seed vigor. Seed Sci. Technol. 1973, 1, 127–157. [Google Scholar]
- ISTA. International rules for seed testing. Proc. Int. Seed Test. Assoc. 1985, 31, 1–152. [Google Scholar]
- Noli, E.; Casarini, E.; Urso, G.; Conti, S. Suitability of three vigour test procedures to predict field performance of early sown maize seed. Seed Sci. Technol. 2008, 36, 168–176. [Google Scholar]
- Basu, S.; Sharma, S.P.; Dadlani, M. Storability studies on maize (Zea mays L.) parental line seeds under natural and accelerated ageing conditions. Seed Sci. Technol. 2004, 32, 239–245. [Google Scholar]
- Lovato, A.; Noli, E.; Lovato, A.F.S. The relationship between three cold test temperatures, accelerated ageing test and field emergence of maize seed. Seed Sci. Technol. 2005, 33, 249–253. [Google Scholar]
- Chen, Y.; Burris, J.S. Role of carbohydrates in desiccation tolerance and membrane behavior in maturing maize seed. Crop Sci. 1990, 30, 971–975. [Google Scholar]
- Bailly, C.; Benamar, A.; Corbineau, F.; Côme, D. Changes in malondialdehyde content and in superoxide dismutase, catalase and glutathione reductase activities in sunflower seeds as related to deterioration during accelerated aging. Physiol. Plant. 1996, 97, 104–110. [Google Scholar]
- Zhao, G.W.; Sun, Q.; Wang, J.H. Improving seed vigour assessment of super sweet and sugar-enhanced sweet corn (Zea mays saccharata). New Zeal. J. Crop Hortic. Sci. 2007, 35, 349–356. [Google Scholar]
- Usha, T.N.; Malavika, D. Evaluation of seed vigour in onion. Seed Res. 2009, 37, 106–114. [Google Scholar]
- Mao, J.; Chen, H.; Gu, X.; Yu, Y.; Hu, J. Comprehensive evaluation of seed vigor in sweet corn germplasm. J. Agric. 2016, 6, 6–11, (In Chinese with English abstract). [Google Scholar]
- Dornbos, D.L.; Mullen, R.E.; Shibles, R.E. Drought stress effects during seed fill on soybean seed germination and vigor. Crop Sci. 1989, 29, 476–480. [Google Scholar]
- Smiciklas, K.D.; Mullen, R.E.; Carlson, R.E.; Knapp, A.D. Soybean seed quality response to drought stress and pod position. Agron. J. 1992, 84, 166–170. [Google Scholar]
- Vieira, R.D.; TeKrony, D.M.; Egli, D.B. Effect of drought and defoliation stress in the field on soybean seed germination and vigor. Crop Sci. 1992, 32, 471–475. [Google Scholar]
- Heatherly, L.G. Drought stress and irrigation effects on germination of harvested soybean seed. Crop Sci. 1993, 33, 777–781. [Google Scholar]
- Samarah, N.H.; Mullen, R.E.; Anderson, I. Soluble sugar contents, germination, and vigor of soybean seeds in response to drought stress. J. New Seeds 2009, 10, 63–73. [Google Scholar]
- Eskandari, H.; Alizadeh-Amraie, A.; Kazemi, K. Effect of planting pattern and irrigation system on germination performance of maize seeds harvested at different times of maturation. Seed Sci. Technol. 2018, 46, 371–375. [Google Scholar]
- Zhang, J.; Cheng, Z.; Zhang, R. Regulated deficit drip irrigation influences on seed maize growth and yield under film. Procedia Eng. 2012, 28, 464–468. [Google Scholar]
- Wang, J.; Tong, L.; Kang, S.; Li, F.; Zhang, X.; Ding, R.; Du, T.; Li, S. Flowering characteristics and yield of maize inbreds grown for hybrid seed production under deficit irrigation. Crop Sci. 2017, 57, 2238–2250. [Google Scholar]
- Ran, H.; Kang, S.; Li, F.; Du, T.; Ding, R.; Li, S.; Tong, L. Responses of water productivity to irrigation and N supply for hybrid maize seed production in an arid region of Northwest China. J. Arid Land. 2017, 9, 504–514. [Google Scholar]
- Yuan, C.; Feng, S.; Huo, Z.; Ji, Q. Effects of deficit irrigation with saline water on soil water-salt distribution and water use efficiency of maize for seed production in arid Northwest China. Agric. Water Manag. 2019, 212, 424–432. [Google Scholar]
- Ghassemi-Golezani, K.; Soltani, A.A. The effect of water limitation in the field on seed quality of maize and sorghum. Seed Sci. Technol. 1997, 25, 321–323. [Google Scholar]
- Takele, A.; Farrant, J. Seed germination and storage reserves of maize and sorghum after exposure to and recovery from pre- and post-flowering dehydration. Acta Agron. Hungarica. 2010, 58, 133–142. [Google Scholar]
- Ghassemi-golezani, K.; Heydari, S.; Hassannejad, S. Seed vigor of maize (Zea mays) cultivars affected by position on ear and water stress. Azarian J. Agric. 2015, 2, 40–45. [Google Scholar]
- Baber, S.A.; Waseem, B.; Loangove, M.A. Influence of different irrigation scheduling practices on the growth and yield performance of maize (Zea mays L.) variety Agaiti-2002. J. Biol. Agric. Healthc. 2015, 5, 168–174. [Google Scholar]
- Wang, C.; Gu, F.; Chen, J.; Yang, H.; Jiang, J.; Du, T.; Zhang, J. Assessing the response of yield and comprehensive fruit quality of tomato grown in greenhouse to deficit irrigation and nitrogen application strategies. Agric. Water Manag. 2015, 161, 9–19. [Google Scholar]
- Wei, Z.; Du, T.; Li, X.; Fang, L.; Liu, F. Interactive effects of elevated CO2 and N fertilization on yield and quality of tomato grown under reduced irrigation regimes. Front. Plant Sci. 2018, 9, 1–10. [Google Scholar]
- Wang, F. Response of Greenhouse Tomato Yield and Quality to Water Stress and the Irrigation Index for Water Saving & Fruit Quality Improving. Ph.D. Thesis, China Agricultural University, Beijing, China, 2011. [Google Scholar]
- Ding, X.; Chong, X.; Bao, Z.; Xue, Y.; Zhang, S. Fuzzy comprehensive assessment method based on the entropy weight method and its application in the water environmental safety evaluation of the Heshangshan drinking water source area, three gorges reservoir area, China. Water 2017, 9, 329. [Google Scholar]
- Wang, J.; Kang, S.; Zhang, X.; Du, T.; Tong, L.; Ding, R.; Li, S. Simulating kernel number under different water regimes using the Water-Flowering Model in hybrid maize seed production. Agric. Water Manag. 2018, 209, 188–196. [Google Scholar]
- Jiang, X.; Zhao, Y.; Tong, L.; Wang, R.; Zhao, S. Quantitative analysis of tomato yield and comprehensive fruit quality in response to deficit irrigation at different growth stages. HortScience 2019, 54, 1409–1417. [Google Scholar]
- Guo, S.; Wang, J.; Zhang, F.; Wang, Y.; Guo, P. An integrated water-saving and quality-guarantee uncertain programming approach for the optimal irrigation scheduling of seed maize in arid regions. Water 2018, 10, 908. [Google Scholar]
- Paredes, P.; Rodrigues, G.C.; Alves, I.; Pereira, L.S. Partitioning evapotranspiration, yield prediction and economic returns of maize under various irrigation management strategies. Agric. Water Manag. 2014, 135, 27–39. [Google Scholar]
- Li, X.; Zhang, X.; Niu, J.; Tong, L.; Kang, S.; Du, T.; Li, S.; Ding, R. Irrigation water productivity is more influenced by agronomic practice factors than by climatic factors in Hexi Corridor, Northwest China. Sci. Rep. 2016, 6, 1–10. [Google Scholar]
- Allen, R.G.; Pereira, L.S.; Raes, D.; Smith, M. Crop Evapotranspiration: Guidelines for Computing Crop Water Requirements: FAO Irrigation and Drainage Paper 56; FAO-Food and Agriculture Organization of the United Nations: Rome, Italy, 1998; p. 300. [Google Scholar]
- Jiang, X.; Kang, S.; Tong, L.; Li, F.; Li, D.; Ding, R.; Qiu, R. Crop coefficient and evapotranspiration of grain maize modified by planting density in an arid region of northwest China. Agric. Water Manag. 2014, 142, 135–143. [Google Scholar]
- Simonne, A.H.; Simonne, E.H.; Eitenmiller, R.R.; Mills, H.A.; Cresman, C.P., III. Could the Dumas method replace the Kjeldahl digestion for nitrogen and crude protein. J. Sci. Food Agric. 1997, 73, 39–45. [Google Scholar]
- Madhava Rao, K.V.; Sresty, T.V.S. Antioxidative parameters in the seedlings of pigeonpea (Cajanus cajan (L.) Millspaugh) in response to Zn and Ni stresses. Plant Sci. 2000, 157, 113–128. [Google Scholar]
- Shannon, L.M.; Kay, E.; Lew, J.Y. Peroxidase isozymes from horseradish roots. I. Isolation and physical properties. J. Biol. Chem. 1966, 241, 2166–2172. [Google Scholar]
- Sedmak, J.J.; Grossberg, S.E. A rapid, sensitive, and versatile assay for protein using Coomassie brilliant blue G250. Anal. Biochem. 1977, 79, 544–552. [Google Scholar]
- Blank, H.G. Optimal irrigation decisions with limited water. Ph.D. Thesis, Colorado State University, Fort Collins, CO, USA, 1975. [Google Scholar]
- Stewart, J.I.; Misra, R.D.; Puritt, W.O.; Hagan, R.M. Irrigating corn and grain sorghum with a deficient water supply. Trans. Am. Soc. Agric. Eng. 1975, 18, 270–280. [Google Scholar]
- Rao, N.H.; Sarma, P.B.S.; Chander, S. A simple dated water-production function for use in irrigated agriculture. Agric. Water Manag. 1988, 13, 25–32. [Google Scholar]
- Jensen, M.E. Water Consumption by Agricultural Plants; Kozlowski, T.T., Ed.; Academic Press: New York, NY, USA, 1968; pp. 1–22. [Google Scholar]
- Minhas, B.S.; Parikh, K.S.; Srinivasan, T.N. Toward the structure of production function for wheat yields with dated inputs of irrigation water. Water Resour. Res. 1974, 10, 383–393. [Google Scholar]
- Nesmith, D.S.; Ritchie, J.T. Effects of soil water-deficits during tassel emergence on development and yield component of maize (Zea mays). Field Crops Res. 1992, 28, 251–256. [Google Scholar]
- NeSmith, D.S.; Ritchie, J.T. Short- and long-term responses of corn to a pre-anthesis soil water deficit. Agron. J. 1992, 84, 699–704. [Google Scholar]
- Setter, T.L.; Flannigan, B.A.; Melkonian, J. Loss of kernel set due to water deficit and shade in maize: Carbohydrate supplies, abscisic acid, and cytokinins. Crop Sci. 2001, 41, 1530–1540. [Google Scholar]
- Hammad, H.M.; Ahmad, A.; Abbas, F.; Farhad, W.; Cordoba, B.C.; Hoogenboom, G. Water and nitrogen productivity of maize under semiarid environments. Crop Sci. 2015, 55, 877–888. [Google Scholar]
- Pandey, R.K.; Maranville, J.W.; Admou, A. Deficit irrigation and nitrogen effects on maize in a Sahelian environment I. Grain yield and yield components. Agric. Water Manag. 2000, 46, 1–13. [Google Scholar]
- Çakir, R. Effect of water stress at different development stages on vegetative and reproductive growth of corn. Field Crops Res. 2004, 89, 1–16. [Google Scholar]
- Lu, D.; Cai, X.; Zhao, J.; Shen, X.; Lu, W. Effects of drought after pollination on grain yield and quality of fresh waxy maize. J. Sci. Food Agric. 2015, 95, 210–215. [Google Scholar] [PubMed]
- Oktem, A. Effect of water shortage on yield, and protein and mineral compositions of drip-irrigated sweet corn in sustainable agricultural systems. Agric. Water Manag. 2008, 95, 1003–1010. [Google Scholar]
- Ertek, A.; Kara, B. Yield and quality of sweet corn under deficit irrigation. Agric. Water Manag. 2013, 129, 138–144. [Google Scholar]
- Harder, H.J.; Carlson, R.E.; Shaw, R.H. Leaf photosynthetic response to foliar fertilizer applied to corn plants during grain fill. Agron. J. 1982, 74, 759–761. [Google Scholar]
- Aydinsakir, K.; Erdal, S.; Buyuktas, D.; Bastug, R.; Toker, R. The influence of regular deficit irrigation applications on water use, yield, and quality components of two corn (Zea mays L.) genotypes. Agric. Water Manag. 2013, 128, 65–71. [Google Scholar]
- Koca, Y.O.; Canavar, O.; Yorulmaz, A.; Erekul, O. Influence of nitrogen level and water scarcity during seed filling period on seed yield and fatty acid compositions of corn. Crop Sci. 2015, 40, 90–97. [Google Scholar]
- Anwar, S.; Iqbal, M.; Akram, H.M.; Niaz, M.; Rasheed, R. Influence of drought applied at different growth stages on kernel yield and quality in maize (Zea Mays L.). Commun. Soil Sci. Plant Anal. 2016, 47, 2225–2232. [Google Scholar]
- Borrás, L.; Curá, J.A.; Otegui, M.E. Maize kernel composition and post-flowering source-sink ratio. Crop Sci. 2002, 42, 781–790. [Google Scholar]
- Seebauer, J.R.; Singletary, G.W.; Krumpelman, P.M.; Ruffo, M.L.; Below, F.E. Relationship of source and sink in determining kernel composition of maize. J. Exp. Bot. 2010, 61, 511–519. [Google Scholar]
- Jumrani, K.; Bhatia, V.S. Combined effect of high temperature and water-deficit stress imposed at vegetative and reproductive stages on seed quality in soybean. Indian J. Plant Physiol. 2018, 23, 227–244. [Google Scholar]
- Lieffering, M.; Andrews, M.; McKenzie, B.A. Nitrate stimulation of mobilization of seed reserves in temperate cereals: Importance of water uptake. Ann. Bot. 1996, 78, 695–701. [Google Scholar]
- Hara, Y.; Toriyama, K. Seed nitrogen accelerates the rates of germination, emergence, and establishment of rice plants. Soil Sci. Plant Nutr. 1998, 44, 359–366. [Google Scholar]
- Bulisani, E.A.; Warner, R.L. Seed protein and nitrogen effects upon seedling vigor in wheat. Agron. J. 1980, 72, 657–662. [Google Scholar]
- Ries, S.K.; Everson, E.H. Protein content and seed size relationships with seedling vigor of wheat cultivars. Agron. J. 1973, 65, 884–886. [Google Scholar]
- Wen, D.; Hou, H.; Meng, A.; Meng, J.; Xie, L.; Zhang, C. Rapid evaluation of seed vigor by the absolute content of protein in seed within the same crop. Sci. Rep. 2018, 8, 1–8. [Google Scholar]
- Ambika, S.; Manonmani, V.; Somasundaram, G. Review on effect of seed size on seedling vigour and seed yield. Res. J. Seed Sci. 2014, 7, 31–38. [Google Scholar]
- Al-Karaki, G.N. Seed size and water potential effects on water uptake, germination and growth of lentil. J. Agron. Crop Sci. 1998, 181, 237–242. [Google Scholar]
- Roy, S.K.S.; Hamid, A.; Giashuddin Miah, M.; Hashem, A. Seed size variation and its effects on germination and seedling vigour in rice. J. Agron. Crop Sci. 1996, 176, 79–82. [Google Scholar]
- da Silva, R.T.; de Oliveira, A.B.; Lopes, M.F.Q.; Guimarães, A.; Dutra, A.S. Physiological quality of sesame seeds produced from plants subjected to water stress. Rev. Cienc. Agron. 2016, 47, 643–648. [Google Scholar]
- Ghooshchi, F.; Reza, H.; Moghaddam, T. Evaluation of germination and emergence behaviors of rapeseed (Brassica napus L.) cultivars under limited irrigation. Am. J. Agric. Environ. Sci. 2013, 13, 174–184. [Google Scholar]
- Pedrinho, A.; Mariano, E.; Merloti, L.F.; de Sa, M.E. Common bean seed quality as affected by cover crop mixtures and nitrogen fertilization. Aust. J. Crop Sci. 2019, 13, 300–308. [Google Scholar]
- Eisvand, H.R.; Moori, S.; Ismaili, A.; Sasani, S. Effects of late-season drought stress on physiology of wheat seed deterioration: Changes in antioxidant enzymes and compounds. Seed Sci. Technol. 2016, 44, 327–341. [Google Scholar]
 Irrigation of V2F2G2;
  rainfall;
  field water capacity;
  wilting point;
  lower limit of readily available water, and here considered as 0.20 cm−3 cm−3 [40].
Irrigation of V2F2G2; rainfall; field water capacity; wilting point; lower limit of readily available water, and here considered as 0.20 cm−3 cm−3 [40].
lower limit of readily available water, and here considered as 0.20 cm−3 cm−3 [40].
Irrigation of V2F2G2; rainfall; field water capacity; wilting point; lower limit of readily available water, and here considered as 0.20 cm−3 cm−3 [40].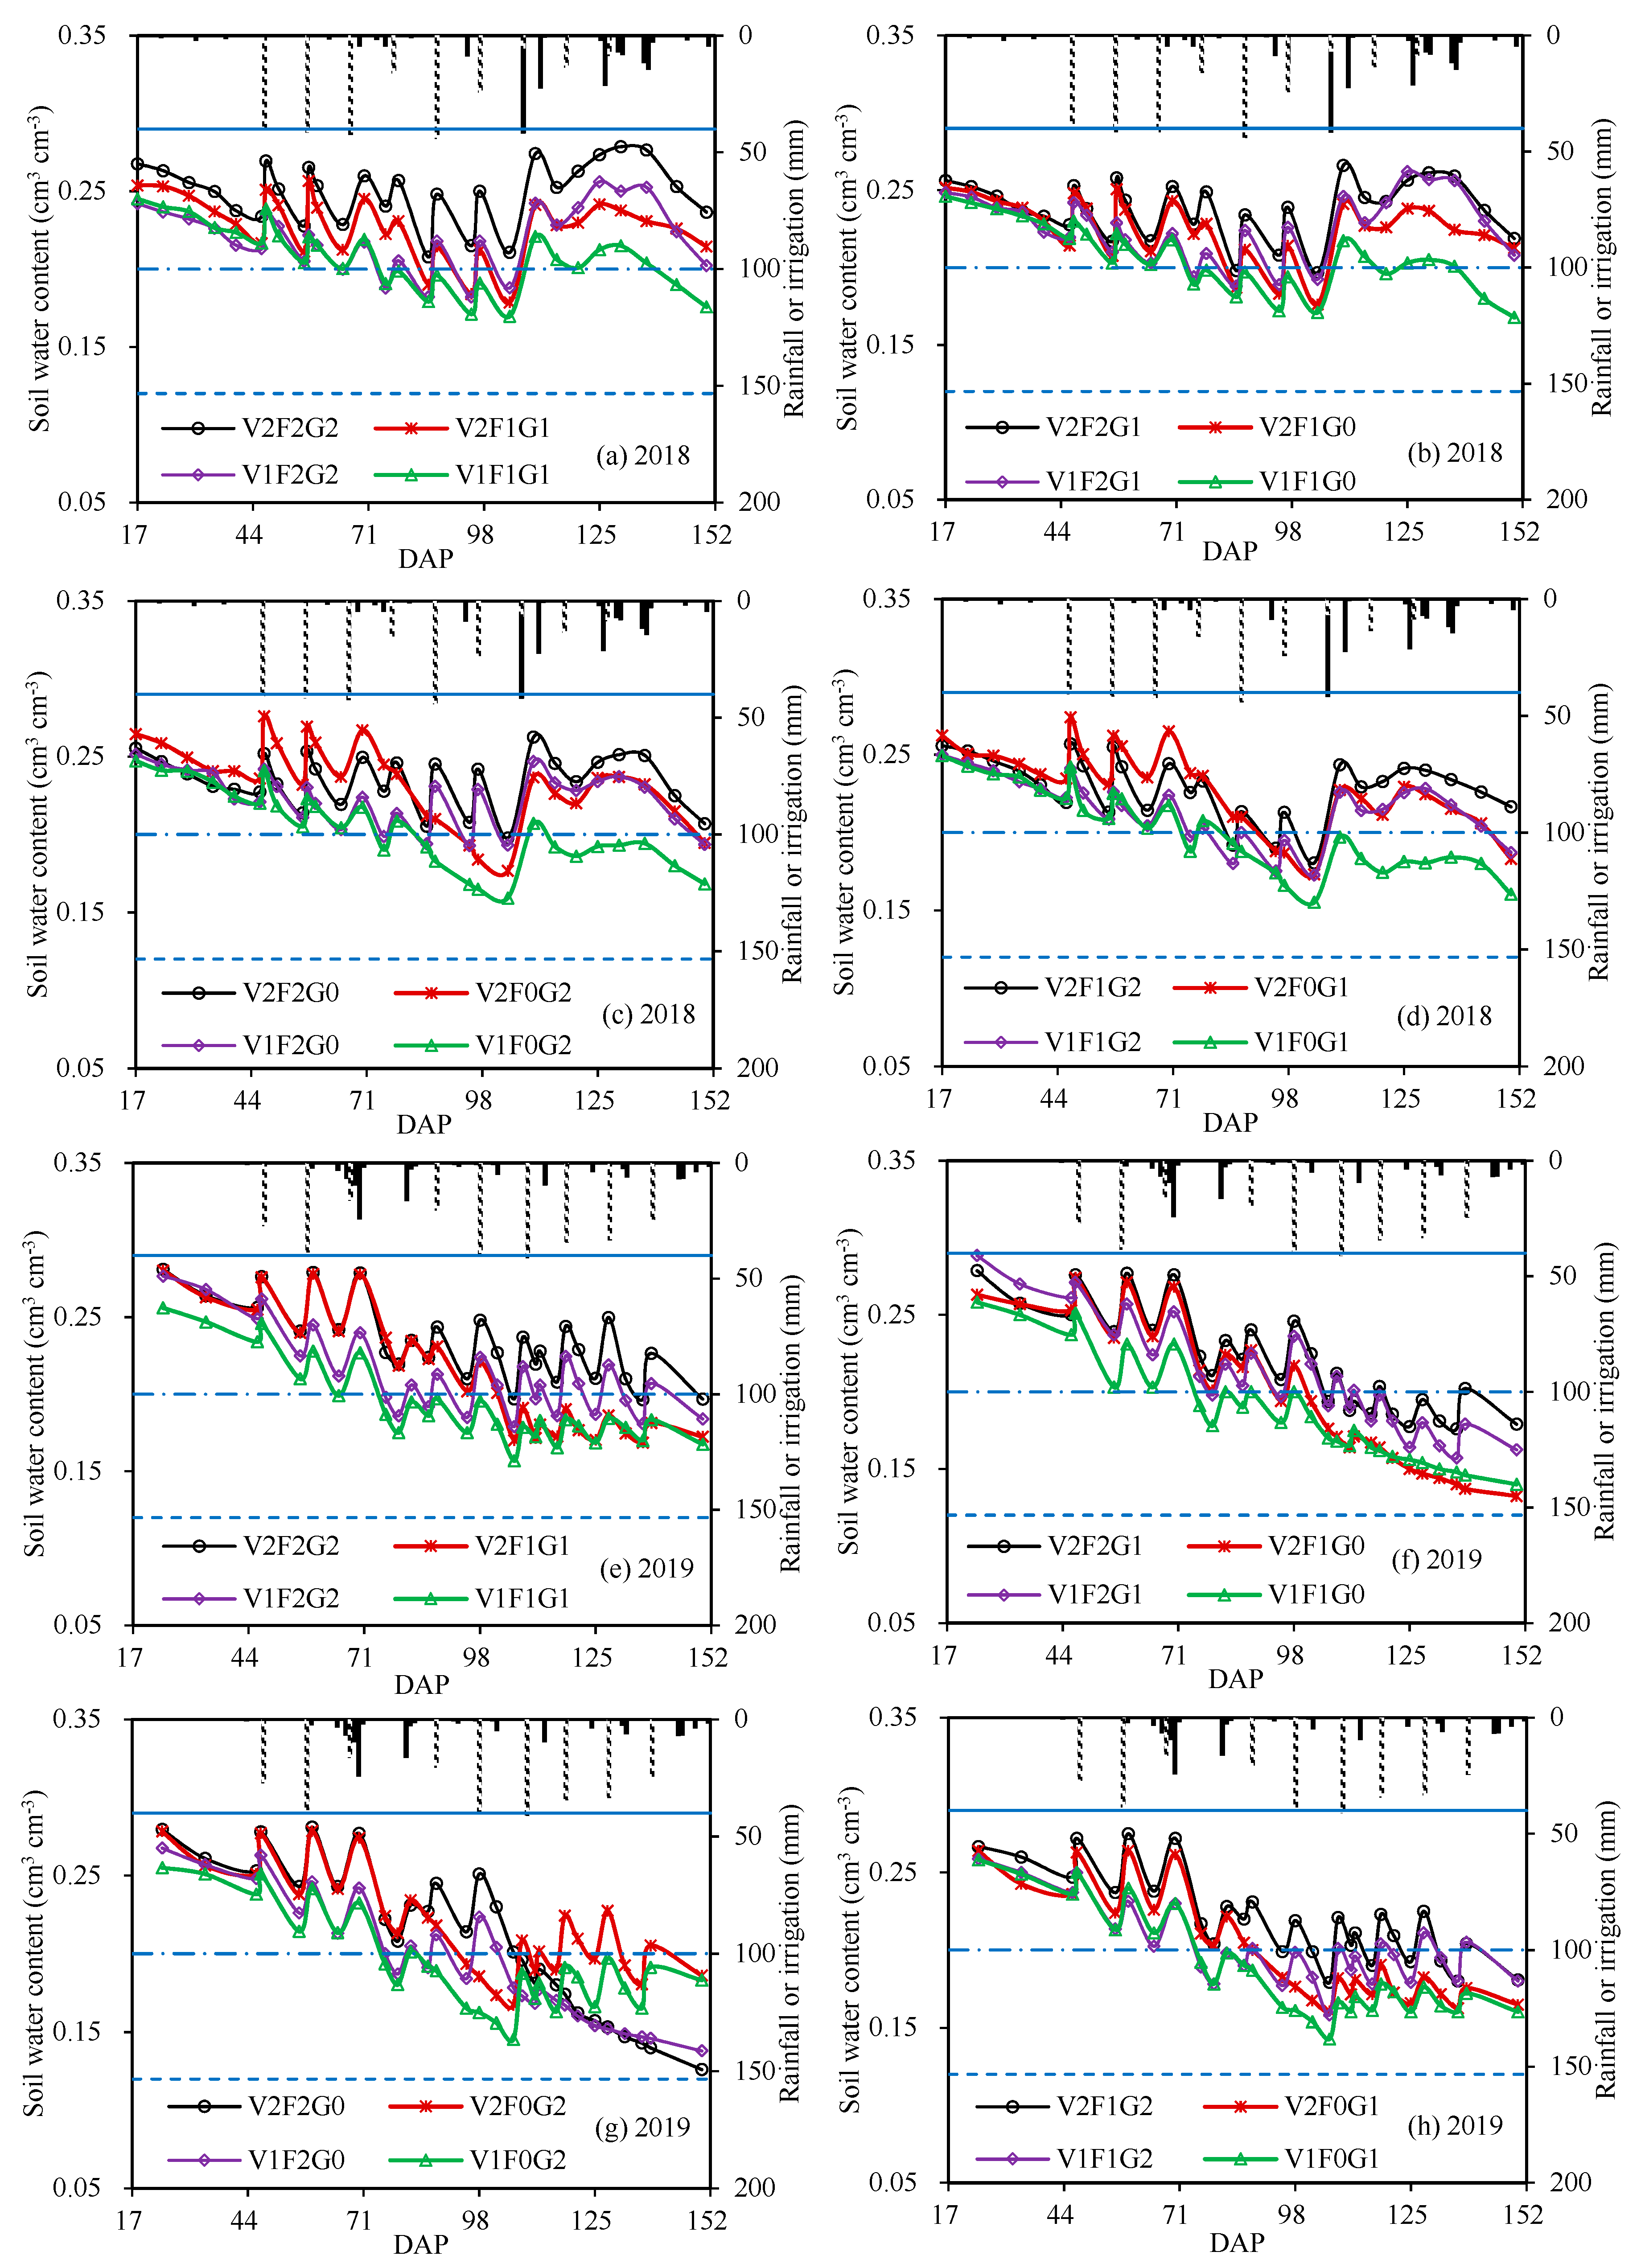

| Year | Cultivar | Planting Date | Planting Proportion | Harvesting Date | |||
|---|---|---|---|---|---|---|---|
| FP | MP1 | MP2 | MP:FP 1 | MP1:MP2 2 | |||
| 2018 | TRF2018 | 18 April | 26 April | 2 May | 1:6 | 6:6 | 17 September |
| 2019 | JDD1903 | 17 April | 1 May | 8 May | 1:5 | 6:6 | 17 September |
| Treatment | 2018 | 2019 | ||||
|---|---|---|---|---|---|---|
| V | F | G | V | F | G | |
| V2F2G2 1 | 125 (3) 2 | 85 (3) | 29 (3) | 82 (3) | 60 (2) | 134 (4) |
| V2F2G1 | 125 (3) | 85 (3) | 15 (3) | 82 (3) | 60 (2) | 67 (4) |
| V2F2G0 | 125 (3) | 85 (3) | 0 | 82 (3) | 60 (2) | 0 |
| V2F1G2 | 125 (3) | 43 (3) | 29 (3) | 82 (3) | 30 (2) | 134 (4) |
| V2F1G1 | 125 (3) | 43 (3) | 15 (3) | 82 (3) | 30 (2) | 67 (4) |
| V2F1G0 | 125 (3) | 43 (3) | 0 | 82 (3) | 30 (2) | 0 |
| V2F0G2 | 125 (3) | 0 | 29 (3) | 82 (3) | 0 | 134 (4) |
| V2F0G1 | 125 (3) | 0 | 15 (3) | 82 (3) | 0 | 67 (4) |
| V1F2G2 | 63 (3) | 85 (3) | 29 (3) | 41 (3) | 60 (2) | 134 (4) |
| V1F2G1 | 63 (3) | 85 (3) | 15 (3) | 41 (3) | 60 (2) | 67 (4) |
| V1F2G0 | 63 (3) | 85 (3) | 0 | 41 (3) | 60 (2) | 0 |
| V1F1G2 | 63 (3) | 43 (3) | 29 (3) | 41 (3) | 30 (2) | 134 (4) |
| V1F1G1 | 63 (3) | 43 (3) | 15 (3) | 41 (3) | 30 (2) | 67 (4) |
| V1F1G0 | 63 (3) | 43 (3) | 0 | 41 (3) | 30 (2) | 0 |
| V1F0G2 | 63 (3) | 0 | 29 (3) | 41 (3) | 0 | 134 (4) |
| V1F0G1 | 63 (3) | 0 | 15 (3) | 41 (3) | 0 | 67 (4) |
| Year | Stage | Period | Rs | Ta | VPD | RH | Sw | Ptot | ET0 |
|---|---|---|---|---|---|---|---|---|---|
| W m−2 | °C | k Pa | % | m s−1 | mm | mm d−1 | |||
| 2018 | Seedling | 5 May to 4 June | 241.1 | 17.9 | 1.66 | 41.0 | 0.79 | 5 | 4.14 |
| Vegetative | 5 June to 4 July | 232.2 | 21.6 | 1.56 | 53.5 | 0.62 | 14 | 4.17 | |
| Flowering | 5 to 30 July | 234.9 | 23.0 | 1.58 | 61.3 | 0.53 | 23 | 4.25 | |
| Grain-filling | 31 July to 1 September | 176.3 | 21.1 | 0.96 | 73.3 | 0.46 | 134 | 3.14 | |
| Maturity | 2 to 16 September | 165.6 | 15.4 | 0.87 | 67.1 | 0.36 | 8 | 2.46 | |
| 2019 | Seedling | 4 May to 3 June | 243.8 | 15.9 | 1.34 | 48.3 | 1.03 | 15 | 4.07 |
| Vegetative | 4 June to 13 July | 232.8 | 20.3 | 1.26 | 62.4 | 0.47 | 72 | 3.95 | |
| Flowering | 14 June to 2 August | 238.3 | 22.0 | 1.61 | 59.3 | 0.27 | 9 | 3.94 | |
| Grain-filling | 3 August to 2 September | 231.1 | 21.3 | 1.62 | 51.8 | 0.32 | 25 | 3.69 | |
| Maturity | 3 to 16 September | 175.5 | 18.3 | 0.95 | 70.4 | 0.25 | 20 | 2.63 |
| Treatment | 2018 | 2019 | ||||||
|---|---|---|---|---|---|---|---|---|
| ET | Yield | KW | SPC | ET | Yield | KW | SPC | |
| mm | t ha−1 | mg | % | mm | t ha−1 | mg | % | |
| V2F2G2 1 | 437 a,2 | 5.04 a | 385.3 b | 10.76 c | 531 a | 4.42 a | 345.7 b | 11.11 a |
| V2F2G1 | 432 a | 4.95 a | 385.8 b | 10.76 c | 469 b,c | 3.84 b | 300.2 f | 10.92 b,c,d |
| V2F2G0 | 433 a | 4.98 a | 385.2 b | 10.76 c | 424 d,e | 3.34 d | 261.6 i | 10.79 e,f |
| V2F1G2 | 396 b | 4.72 b | 387.0 b | 10.99 b | 476 b | 3.11 e | 350.3 b | 11.14 a |
| V2F1G1 | 394 b | 4.70 b | 387.0 b | 10.99 b | 416 e,f | 2.75 f | 309.5 d,e | 10.92 b,c,d |
| V2F1G0 | 392 b | 4.66 b | 386.4 b | 11.00 b | 377 h | 2.41 h | 271.7 h | 10.77 e,f |
| V2F0G2 | 364 c | 3.82 d | 391.9 a | 11.24 a | 429 d | 2.74 f | 359.0 a | 11.16 a |
| V2F0G1 | 364 c | 3.80 d | 391.1 a | 11.21 a | 390 g | 2.39 h | 314.1 d | 10.90 c,d |
| V1F2G2 | 350 d | 4.40 c | 359.8 d | 10.52 e | 459 c | 3.57 c | 324.8 c | 11.01 b |
| V1F2G1 | 351 d | 4.35 c | 360.0 d | 10.51 e | 412 f | 3.10 e | 282.0 g | 10.84 d,e |
| V1F2G0 | 345 d | 4.37 c | 360.8 d | 10.50 e,f | 349 j | 2.64 g | 239.9 j | 10.58 g |
| V1F1G2 | 316 e | 3.46 e | 364.8 c | 10.72 d | 409 f | 2.05 i | 330.6 c | 10.95 b,c |
| V1F1G1 | 317 e | 3.37 e | 364.7 c | 10.71 d | 362 i | 1.60 j | 258.5 i | 10.83 d,e |
| V1F1G0 | 313 e | 3.36 e | 363.8 c | 10.72 d | 301 l | 1.22 l | 197.4 k | 10.61 g |
| V1F0G2 | 263 f | 1.37 f | 354.6 e | 10.47 f | 339 j | 1.45 k | 306.2 e,f | 10.71 f |
| V1F0G1 | 258 f | 1.36 f | 355.0 e | 10.48 ef | 317 k | 0.94 m | 199.5 k | 10.61 g |
| Treatment | 2018 | 2019 | ||||||
|---|---|---|---|---|---|---|---|---|
| GPSG | GISG | SLSG | RLSG | GPSG | GISG | SLSG | RLSG | |
| % | cm | cm | % | cm | cm | |||
| V2F2G2 1 | 97.8 a,2 | 36.79 c,d | 9.1 c,d | 26.9 c | 98.5 a | 32.09 c | 10.6 c | 30.2 b |
| V2F2G1 | 98.0 a | 36.79 c,d | 9.0 c,d | 26.8 c | 94.3 c | 30.70 e | 9.7 f | 29.0 d |
| V2F2G0 | 98.0 a | 36.77 d | 8.9 d | 26.8 c | 92.5 e | 29.19 g | 8.8 h | 26.3 g |
| V2F1G2 | 97.9 a | 37.03 b | 10.0 b | 27.5 b | 98.3 a | 32.72 b | 11.0 b | 31.3 a |
| V2F1G1 | 97.5 a | 36.96 b,c | 10.0 b | 27.4 b | 94.8 b,c | 31.26 d | 10.0 e,f | 29.8 b,c |
| V2F1G0 | 97.9 a | 37.03 b | 9.9 b | 27.4 b | 90.6 f | 29.20 g | 9.3 g | 26.7 f,g |
| V2F0G2 | 98.0 a | 37.36 a | 10.5 a | 28.0 a | 98.6 a | 33.58 a | 11.6 a | 32.1 a |
| V2F0G1 | 97.9 a | 37.32 a | 10.4 a | 28.0 a | 94.6 b,c | 31.98 c | 10.5 c,d | 30.1 b |
| V1F2G2 | 96.3 b | 36.25 e | 8.7 e | 26.4 d | 95.0 b,c | 30.72 e | 9.7 f | 29.0 d |
| V1F2G1 | 96.3 b | 36.23 e | 8.6 e | 26.4 d | 93.3 d | 29.83 f | 9.1 g,h | 27.7 e |
| V1F2G0 | 96.2 b | 36.20 e | 8.7 e | 26.4 d | 88.1 h | 27.88 i | 8.3 i | 24.0 h |
| V1F1G2 | 96.3 b | 36.38 e | 9.2 c | 26.8 c | 95.2 b | 31.22 d | 10.2 d,e | 29.8 b,c |
| V1F1G1 | 96.3 b | 36.38 e | 9.2 c | 26.7 c | 93.5 d | 28.71 h | 8.9 g,h | 27.2 e,f |
| V1F1G0 | 95.9 b | 36.29 e | 9.2 c | 26.8 c | 87.9 h | 26.77 j | 7.8 j | 24.5 h |
| V1F0G2 | 94.5 c | 35.64 f | 8.1 f | 25.7 e | 94.5 b,c | 29.95 f | 9.8 e,f | 29.1 c,d |
| V1F0G1 | 94.4 c | 35.59 f | 8.0 f | 25.7 e | 89.4 g | 27.96 i | 8.0 I,j | 26.4 f,g |
| WX | 0.067 | 0.070 | 0.089 | 0.079 | 0.088 | 0.071 | 0.089 | 0.073 |
| Treatment | 2018 | 2019 | ||||||
|---|---|---|---|---|---|---|---|---|
| GPAA | GIAA | SLAA | RLAA | GPAA | GIAA | SLAA | RLAA | |
| % | cm | cm | % | cm | cm | |||
| V2F2G2 1 | 79.8 d,2 | 26.63 c | 6.8 c | 15.7 c | 74.8 c | 24.66 c | 7.7 b c | 17.3 c |
| V2F2G1 | 79.7 d | 26.58 c,d | 6.7 c | 15.7 c | 72.6 e | 23.98 d | 6.9 e,f | 16.2 d,e |
| V2F2G0 | 79.7 d | 26.58 c,d | 6.8 c | 15.6 c | 70.3 h | 23.11 g | 6.2 g,h | 15.2 f |
| V2F1G2 | 80.3 b | 26.94 b | 7.1 b | 16.2 b | 76.0 b | 25.12 b | 7.9 b | 17.8 b |
| V2F1G1 | 80.2 b,c | 26.88 b | 7.1 b | 16.1 b | 73.6 d | 24.14 d | 7.1 d,e | 16.3 d |
| V2F1G0 | 80.2 b,c | 26.89 b | 7.1 b | 16.1 b | 71.0 g | 23.41 e,f | 6.6 f,g | 15.3 f |
| V2F0G2 | 81.0 a | 27.18 a | 7.7 a | 16.7 a | 78.8 a | 26.10 a | 8.3 a | 18.4 a |
| V2F0G1 | 80.9 a | 27.13 a | 7.6 a | 16.7 a | 69.8 i,j | 22.82 h | 6.2 g,h | 16.6 d |
| V1F2G2 | 79.1 e | 26.32 e | 6.4 d | 15.2 d | 72.0 f | 23.51 e | 6.9 e,f | 15.8 e |
| V1F2G1 | 79.1 e | 26.28 e | 6.3 d | 15.2 d | 70.3 h,i | 23.01 g | 6.6 f,g | 15.2 f |
| V1F2G0 | 79.0 e | 26.28 e | 6.5 d | 15.1 d | 68.0 k | 22.07 i | 5.8 h,i | 14.3 g |
| V1F1G2 | 79.9 b,c,d | 26.56 c,d | 6.8 c | 15.7 c | 73.0 e | 24.14 d | 7.4 c,d | 16.3 d |
| V1F1G1 | 80.0 b,c,d | 26.52 d | 6.7 c | 15.6 c | 70.0 h,i | 22.99 g | 6.1 h | 14.2 g |
| V1F1G0 | 79.8 c,d | 26.52 d | 6.8 c | 15.7 c | 67.3 l | 21.70 j | 5.5 i | 13.5 h |
| V1F0G2 | 78.3 f | 25.90 f | 5.9 e | 14.6 e | 73.0 e | 23.31 f | 7.1 d,e | 16.6 d |
| V1F0G1 | 78.4 f | 25.86 f | 5.8 e | 14.6 e | 69.3 j | 21.92 i | 6.1 h | 14.4 g |
| WX | 0.069 | 0.069 | 0.071 | 0.079 | 0.092 | 0.096 | 0.082 | 0.079 |
| Treatment | 2018 | 2019 | ||||
|---|---|---|---|---|---|---|
| SOD | CAT | POD | SOD | CAT | POD | |
| V2F2G2 1 | 0.98 a,2 | 0.0323 a | 0.0405 a | 1.25 a | 0.0391 a,b | 0.0486 a |
| V2F2G1 | 0.98 a | 0.0319 a,b | 0.0397 a,b,c | 1.16 b,c | 0.0386 a,b | 0.0476 a,b |
| V2F2G0 | 0.97 a,b | 0.0331 a | 0.0402 a,b | 0.97 e | 0.0360 c,d,e | 0.0463 c |
| V2F1G2 | 0.95 b,c | 0.0327 a | 0.0391 b,c,d | 1.18 b | 0.0395 a | 0.0470 b,c |
| V2F1G1 | 0.94 b,c | 0.0322 a | 0.0394 a,b,c,d | 0.96 e | 0.0375 b,c | 0.0463 c |
| V2F1G0 | 0.93 c | 0.0319 a,b | 0.0390 c,d | 0.84 f,g,h | 0.0355 d,e,f | 0.0448 d |
| V2F0G2 | 0.75 f | 0.0287 d | 0.0387 c,d | 1.09 d | 0.0377 a,b,c | 0.0465 b,c |
| V2F0G1 | 0.77 e,f | 0.0285 d | 0.0385 d | 0.87 f | 0.0347 e,f | 0.0441 d |
| V1F2G2 | 0.89 d | 0.0303 c | 0.0343 e | 1.14 c | 0.0367 c,d | 0.0411 e |
| V1F2G1 | 0.90 d | 0.0304 b,c | 0.0344 e | 0.96 e | 0.0352 d,e,f | 0.0393 f |
| V1F2G0 | 0.89 d | 0.0297 c,d | 0.0339 e | 0.82 h | 0.0340 f,g | 0.0387 f |
| V1F1G2 | 0.78 e | 0.0293 c,d | 0.0323 f | 0.95 e | 0.0365 c,d,e | 0.0388 f |
| V1F1G1 | 0.79 e | 0.0292 c,d | 0.0326 f | 0.83 g,h | 0.0354 d,e,f | 0.0371 g |
| V1F1G0 | 0.78 e,f | 0.0288 c,d | 0.0323 f | 0.72 i | 0.0329 g,h | 0.0358 h |
| V1F0G2 | 0.71 g | 0.0259 e | 0.0299 g | 0.86 f,g | 0.0313 h,i | 0.0359 h |
| V1F0G1 | 0.71 g | 0.0252 e | 0.0296 g | 0.73 i | 0.0305 i | 0.0339 i |
| WX | 0.097 | 0.056 | 0.093 | 0.107 | 0.065 | 0.089 |
| Treatment | 2018 | 2019 | ||||||
|---|---|---|---|---|---|---|---|---|
| CEM>GRA(0.480) 2 | CEM>PCA(0.520) | CEM | CEM>GRA(0.497) | CEM>PCA(0.503) | CEM | |||
| Ri* 3 | Pi* 4 | Vi5 | Rank | Ri* | Pi* | Vi | Rank | |
| V2F2G2 1 | 0.723 | 0.774 | 0.750 | 6 | 0.816 | 0.882 | 0.849 | 3 |
| V2F2G1 | 0.711 | 0.749 | 0.731 | 8 | 0.622 | 0.660 | 0.641 | 4 |
| V2F2G0 | 0.709 | 0.760 | 0.735 | 7 | 0.492 | 0.418 | 0.454 | 9 |
| V2F1G2 | 0.730 | 0.873 | 0.805 | 1 | 0.792 | 0.913 | 0.853 | 2 |
| V2F1G1 | 0.698 | 0.845 | 0.774 | 5 | 0.587 | 0.658 | 0.623 | 5 |
| V2F1G0 | 0.703 | 0.850 | 0.780 | 3 | 0.470 | 0.405 | 0.438 | 12 |
| V2F0G2 | 0.799 | 0.777 | 0.788 | 2 | 0.846 | 0.881 | 0.863 | 1 |
| V2F0G1 | 0.779 | 0.778 | 0.779 | 4 | 0.525 | 0.523 | 0.524 | 8 |
| V1F2G2 | 0.484 | 0.468 | 0.475 | 12 | 0.553 | 0.585 | 0.569 | 6 |
| V1F2G1 | 0.485 | 0.463 | 0.474 | 13 | 0.467 | 0.415 | 0.441 | 11 |
| V1F2G0 | 0.477 | 0.446 | 0.461 | 14 | 0.387 | 0.181 | 0.283 | 14 |
| V1F1G2 | 0.479 | 0.523 | 0.502 | 9 | 0.535 | 0.601 | 0.568 | 7 |
| V1F1G1 | 0.477 | 0.515 | 0.497 | 10 | 0.419 | 0.302 | 0.360 | 13 |
| V1F1G0 | 0.467 | 0.491 | 0.480 | 11 | 0.351 | 0.106 | 0.228 | 15 |
| V1F0G2 | 0.338 | 0.088 | 0.208 | 15 | 0.462 | 0.432 | 0.447 | 10 |
| V1F0G1 | 0.334 | 0.078 | 0.201 | 16 | 0.359 | 0.097 | 0.227 | 16 |
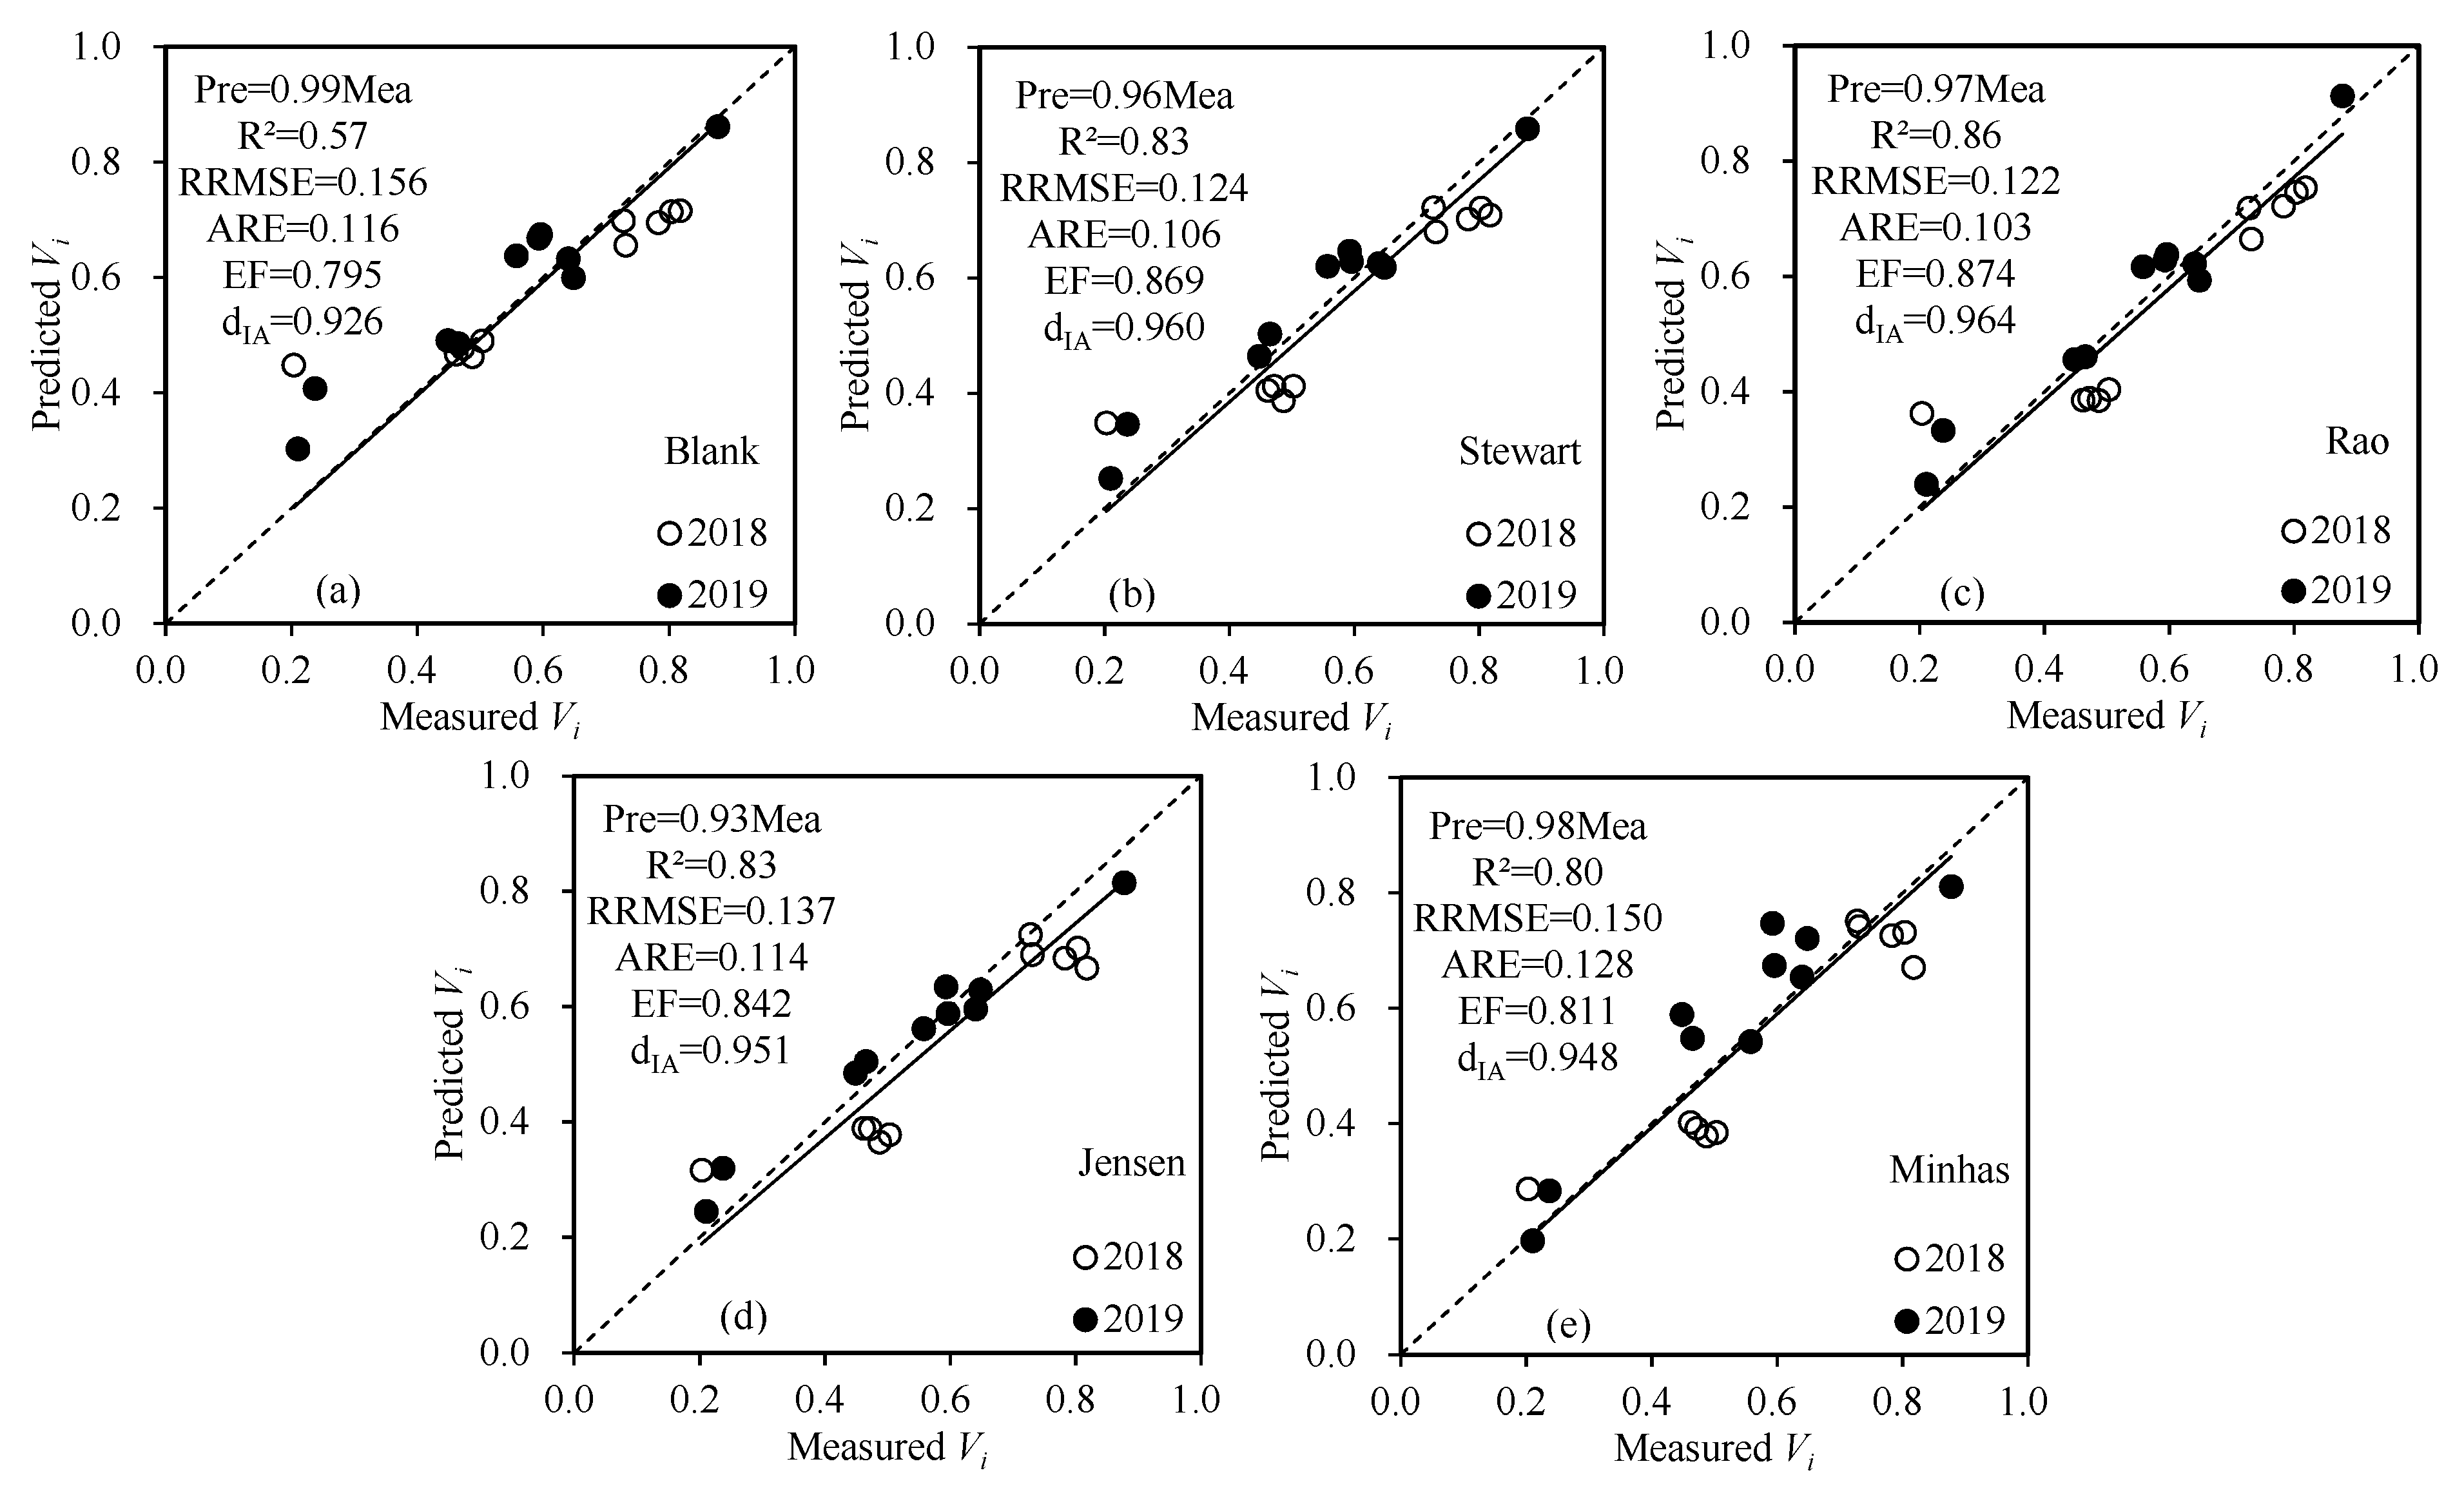
| Model | Water Sensitivity Index | R2 | RRMSE | ||
|---|---|---|---|---|---|
| Vegetative | Flowering | Grain-Filling | |||
| Blank | 0.379 | −0.217 | 0.807 | 0.65 | 0.175 |
| Steward | 0.615 | −0.136 | 0.811 | 0.85 | 0.140 |
| Rao | 0.772 | −0.343 | 0.916 | 0.88 | 0.132 |
| Jensen | 0.759 | 0.006 | 0.719 | 0.85 | 0.155 |
| Minhas | 2.184 | 0.352 | 1.437 | 0.84 | 0.154 |
Publisher’s Note: MDPI stays neutral with regard to jurisdictional claims in published maps and institutional affiliations. |
© 2020 by the authors. Licensee MDPI, Basel, Switzerland. This article is an open access article distributed under the terms and conditions of the Creative Commons Attribution (CC BY) license (http://creativecommons.org/licenses/by/4.0/).
Share and Cite
Shi, R.; Tong, L.; Du, T.; Shukla, M.K. Response and Modeling of Hybrid Maize Seed Vigor to Water Deficit at Different Growth Stages. Water 2020, 12, 3289. https://doi.org/10.3390/w12113289
Shi R, Tong L, Du T, Shukla MK. Response and Modeling of Hybrid Maize Seed Vigor to Water Deficit at Different Growth Stages. Water. 2020; 12(11):3289. https://doi.org/10.3390/w12113289
Chicago/Turabian StyleShi, Rongchao, Ling Tong, Taisheng Du, and Manoj K. Shukla. 2020. "Response and Modeling of Hybrid Maize Seed Vigor to Water Deficit at Different Growth Stages" Water 12, no. 11: 3289. https://doi.org/10.3390/w12113289
APA StyleShi, R., Tong, L., Du, T., & Shukla, M. K. (2020). Response and Modeling of Hybrid Maize Seed Vigor to Water Deficit at Different Growth Stages. Water, 12(11), 3289. https://doi.org/10.3390/w12113289