1. Introduction
Water-related problems, like drought, flooding, water main breaks, and poor water quality, can dramatically impact people’s lives. Citizens who understand the scientific principles underlying such issues are better prepared to participate in decision-making and to mitigate the negative impacts of water-related problems. As educators, we seek to improve people’s understanding of, interest in, and identity with water science in order to foster a society that understands the basics of water science and is motivated to minimize harmful events and ensure future water quality and availability.
As a component of scientific literacy, water literacy extends beyond content knowledge to include the skills needed to communicate knowledge to others, to apply knowledge in everyday life, and to make decisions forged from familiarity with local resources and water sustainability knowledge [
1,
2,
3]. To accomplish literacy goals, educators often focus on formal education, where classrooms provide opportunities for reaching school-age students, or on structured informal education experiences, such as special events, science centers, or aquariums, where large numbers of people can be reached in organized ways. Although these educational settings are invaluable, they do tend to bypass significant components of the population—namely those who are not in the formal education system and those who do not attend science-themed events. Similarly, science content published in print and online, even via a casual avenue like a blog, primarily reaches people who have high levels of science knowledge and are established consumers of science media [
4].
The study presented here was based on the construct that, in order to drive community-wide changes in water literacy, broad segments of the community must be included. In other words, it is necessary to extend educational engagement beyond traditionally served individuals and sectors. In this project, we investigated the use of regional television (TV) to share stories about fresh water conservation, recharge, and reuse concepts with the local community—highlighting regional resources and solutions.
1.1. Rational and Theoretical Framework
Researchers and educators are making strides to remove information barriers by providing open source information and free, online educational material. However, even free online materials require internet access. When considering the larger community, it is therefore important to examine what learning looks like for individuals without reliable internet connectivity. In 2019, the Pew Research Center released a report about internet accessibility, stating that 27% of Americans lack high-speed internet access (compared to 46% globally) [
5]. Lower-income segments of the population fare worse with regard to connectivity; in United States (U.S.) households earning less than
$30,000 per year, 44% lack high-speed internet—compared to just 8% in households with incomes of greater than
$75,000 per year. These trends are similar to those for educational attainment, with disparities more pronounced among non-Caucasian ethnic groups, in black and Hispanic communities, and in rural areas [
5].
The move to online instruction during the current coronavirus pandemic has underscored these differences, with children from low-income homes three times more likely to lack consistent access to an internet-connected device [
6]. Moreover, corresponding remote learning declines have been observed in lower income areas (from 1 March to 26 April 2020), in comparison to increases in higher income areas during the same time period [
7]. These statistics are snapshots of inequity, barely skimming the surface of the digital divide, and yet they critically underscore the need to produce educational content and solicit community engagement beyond scholarly publications and online offerings—in support of broader water literacy.
1.2. The (Surprising) Importance of TV Programming
Perhaps as a result of less than universal access to the not-so-worldwide web, TV remains the most used media platform nationally—and a primary source of information for vast segments of our communities. In 2019, Nielsen reported that, on average, Americans watch more than 4 h of broadcast TV daily, with viewing time ranging from 22% of daily media time for young adults (aged 18 to 34 years) up to 58% in adults over 65 years of age [
8]. Additionally, as a result of the Covid-19 pandemic, TV viewing for informational, entertainment, and educational purposes has increased, not only in the U.S. but also across the world [
9,
10]. This widespread accessibility and use of TV establishes it as an important tool in the quest to engage with communities in general and key influencers in particular. Key influencers are defined here as individuals who are instrumental in making societal decisions and providing career advice to youth.
In addition, with respect to content, viewers are surprisingly positive about the trustworthiness of TV, and Americans still prefer watching TV over reading print or internet news [
5]. In the state of Hawai’i, where our study was conducted, residents report TV to be the most reliable source of information about important issues facing their communities, at 65%—similar to newspaper (61%) and far outdistancing second-tier responses such as social media (26%), radio (19%), and word-of-mouth 15% [
11]. This trust makes TV a valuable resource for sharing important scientific, cultural, management, and policy information about water resources. Furthermore, the ability of TV to reach populations that have less access to digital technology and high-speed internet can create meaningful bridges among researchers, community groups, cultural organizations, and professionals [
12]. Thus, TV provides a promising platform for enhancing water literacy amongst a broad demographic, including those rarely, if ever, engaged by traditional outreach programs that focus on K-12 students or science centers [
13].
1.3. Preparing the Next Generation of STEM Professionals
Public perceptions of scientists are generally flawed, with scientists commonly viewed as unrelatable and unbelievable [
13]. Moreover, although medical and criminal TV dramas have brought a veneer of the scientific process to the living room, these dramas frequently rely on situational plot twists or unnecessarily glamorized laboratory methods to solve cases—rather than data and logic. This approach inaccurately represents much of the process of data collection and portrays the results as overly open to interpretation [
12,
14]. In other instances, the science presented on TV is entirely fabricated, with lasting negative effects on viewers’ perceptions of scientists and the process of science itself, accelerating the spread of pseudoscience rather than increasing scientific literacy—as in the 2013 fake stories of Megalodon on the Discovery Channel and the 2012–2013 mermaid “mocumentaries” on Animal Planet [
15,
16,
17]. Further, TV scientists are seldom diverse [
18], with the majority portrayed as mature Caucasian men or sexualized young women [
16]. As such, the scientists portrayed on TV dramas do little to aid in closing the diversity gap in science, technology, engineering, and mathematics (STEM) [
19].
However, increasing awareness and understanding of actual STEM careers—through video—has been demonstrated to improve both the accuracy of students’ perceptions and their desire to pursue STEM careers [
19]. Indeed, the blend of sound, motion, and imagery make video a powerful learning platform, providing the opportunity for viewers to meet individuals, experience events, and view perspectives not readily possible in their real-world experience [
20,
21]. Video has also been demonstrated to be more effective than text in communicating not only the process of science but also difficult and controversial concepts like climate change [
22]. Effective engagement of the TV-watching, adult population is thus a potential avenue for the improvement of water literacy and workforce development insofar as accurate portrayals of science on TV can serve to lessen barriers to STEM careers that exist due to (1) lack of relatable role models, (2) lack of knowledge and/or guidance from adults aware of and knowledgeable about such opportunities, and (3) psychological barriers from culturally prescribed roles [
23,
24].
1.4. About Voice of the Sea
Voice of the Sea is a 30-min, weekly TV series, developed to increase knowledge of and promote interest in aquatic science research. Now in its seventh season, Voice of the Sea episodes are broadcast in regional markets across the Pacific (in Hawai’i as well as in U.S. territories and affiliated Pacific regions: Guam, American Samoa, Palau, and the Federated States of Micronesia)—providing a platform for connecting research and culture amongst a broad demographic. The TV stations airing Voice of the Sea are accessible to 90% of the 1.8 million regional population, and station surveys indicate that an average of 24,000 (±2900 viewers) tune in weekly in Hawai’i to watch Voice of the Sea on TV [
25,
26], with a largely female (75%) audience that skews toward older, local viewers, with 57% over 50 years of age, 55% home-owners, 75% non-college educated, and 95% having lived in Hawai’i for more than 16 years [
25,
26].
The series has won 30 national Telly Awards, and previous results suggest that episode viewers demonstrate significant gains in content knowledge, interest, and self-perceived understanding across episodes and audiences; N = 650,
p < 0.000; [
27]. Viewers also report affinity for episode experts and the environment. Viewer surveys further suggest that approximately 25% of the series’ audience plans to engage in suggested actions, demonstrating that the series has potential to positively impact its viewers [
27].
In collaboration with the Hawai’i Community Foundation, the board of the Wai Maoli: Hawai’i Fresh Water Initiative, and local fresh water experts, we produced and aired on TV four 30-min episodes of Voice of the Sea. The episodes highlight fresh water science and resource sustainability across the state of Hawai’i. We used questionnaires to quantitatively and qualitatively evaluate the change in water literacy and engagement of episode viewers at in-person screenings.
2. Materials and Methods
In 2019, we conceived, developed, produced, and distributed four 30-min episodes of the Voice of the Sea TV series highlighting fresh water science across the state of Hawai’i. Three episodes focused on specific fresh water topics: recharge, conservation, and reuse. The fourth episode encompassed and synthesized all three topics. Each episode presented issues and actions that could be adopted and implemented at both the community and individual scale. Content for the episodes was informed and structured to compliment the Wai Maoli: Hawai’i Fresh Water Initiative, which was developed through a multi-year, facilitated collaboration among diverse water stakeholders in Hawai’i, generating a report with actionable elements in support of sustainable water resources [
28]. All four episodes were aired on TV during normally scheduled regional programming in 2019. The episodes included:
Episode 1: Recharging Groundwater
Transcribed Description: “We’re in the watershed forests of O’ahu, Maui, and Hawai’i. We talk to hydrologists and ecological experts working to conserve and re-establish native plants and animals in these forests—in an effort to not only preserve the ‘āina (land) but also to recharge the underground aquifers that feed the Hawaiian islands with fresh water” (
http://seagrant.soest.hawaii.edu/native-forests/).
Episode 2: Conserving Fresh Water
Transcribed Description: “We’re talking about the need to conserve fresh water in Hawai’i—as we face a future of reduced rainfall, increased drought, and a growing population. We’ll learn from experts about how to protect our most precious natural resource, in our homes and in our communities” (
http://seagrant.soest.hawaii.edu/conserving-fresh-water/).
Episode 3: Reusing Wastewater
Transcribed Description: “We’re learning about the newest strategies for recycling wastewater. We’ll check out farms that use recycled water and tour a new University of Hawai’i building that captures and treats wastewater and rainwater” (
http://seagrant.soest.hawaii.edu/water-reuse/).
Episode 4: Wai Maoli—A Hawai’i Fresh Water Initiative
Transcribed Description: “We’re learning about Wai Maoli—Hawaii’s Fresh Water Initiative to ensure water abundance for future generations. We talk to experts across Hawai’i about water conservation, water recharge, and water reuse” (
http://seagrant.soest.hawaii.edu/wai-maoli/).
In September 2019, we conducted four in-person screenings (viewings) in Hawai’i—one for each of the four water-literacy related Voice of the Sea episodes. Each of the episodes was screened on a separate Thursday evening at the Hanauma Bay Education Program seminar series on O’ahu island. This ongoing, weekly seminar series is open to the public and free of charge to attend. We invited attendees to complete a voluntary, paper survey at the conclusion of each screening to gauge viewers’ perceived understanding, interest, and motivation. Participants were free to decline to answer one or more survey questions. No individually identifying information was maintained with survey responses, and selected survey data are presented here in aggregate. The project, inclusive of each of the four episode surveys, was reviewed and approved by the University of Hawai’i Institutional Review Board (IRB) with regard to research compliance for human studies (IRB approval number 15657).
The three content-specific episode surveys included Likert scale questions to query viewers’ self-perceived changes in a retrospective pre-post design section [
29,
30]. This survey design facilitates examination of participants’ perceptions of their knowledge before (pre-) and after (post-) viewings using a single survey per participant, post-viewing. That is, the respondents were asked to think about their understanding, interest, and motivation after having viewed the episode and then to reflect back to their previous level before viewing the episode. This survey design also decreases response shift bias [
29,
30,
31]. Each survey also queried respondents’ likelihood of taking action on items discussed in the episode. Additionally, we asked open-ended questions about what viewers learned, liked, and would improve about episode presentation. For all Likert scale questions, lower numbers indicated less understanding or intention and higher numbers indicated elevated understanding or intention, e.g., 1 = little and 5 = very much. To help account for the ordinal nature of Likert scale data, we included a not applicable (NA) option where appropriate. Study questions for which an NA response was returned were not included in analysis for that question.
We calculated descriptive statistics, mean, and standard deviation (SD) for the Likert scale responses. Although Likert scale data are ordinal in nature, mean and SD provide robust descriptions of the data [
32,
33], and paired
t-tests were used to test differences in retrospective, pre-post Likert scale responses, with the null hypothesis of no-difference and alpha set at 0.05 [
32,
33]. Comparisons of Likert scale responses within categories (e.g., willingness to take particular action or vote on particular issues) were tested using non-parametric Kendall’s W tests for dependent samples.
For Episodes 1 to 3, the survey also included questions to determine if a viewer had seen the episode on television prior to the study screening. If a respondent had previously seen an episode, their survey was excluded from analysis. For Episode 4, Wai Maoli, which was produced as a culminating synopsis of Episodes 1 to 3, no viewers had previously seen the episode. However, it was expected, and desired, that some viewers may have seen one or more previous topical episodes (Episodes 1 to 3). To better characterize viewer preparation and inform data interpretation, we included questions to assess if a respondent had attended a previous episode screening during the month.
The viewer survey for the fourth synoptic episode, Wai Maoli, used Likert scale questions (Likert 1 to 5) to query viewers’ perceptions regarding how much they liked the culminating Wai Maoli episode (1 = not at all, 5 = very much) as well as the Wai Maoli episode’s treatment of recharge, conservation, and reuse in comparison to how well these topics were covered in the individual episodes (1 = not covered well, 5 = very well covered). Viewers were also asked to select their preference with regard to watching (a) only the synoptic episode, (b) only the three topical episodes, or (c) all four episodes (topical Episodes 1 to 3 in addition to synoptic Episode 4).
A survey response rate was calculated by dividing the total number of completed surveys by the total number of attendees and multiplying this by 100. As survey participants were allowed to skip questions, we considered a survey complete if it was handed in at the completion of a screening with one or more questions answered. To further explore non-response bias, item non-response rate at the question level was also calculated. Item non-response rate was calculated by dividing the total number of blank responses per question by the total number of surveys handed in and multiplied by 100.
We also collected voluntary demographic parameters of survey participants to assist in characterizing attendees and compare with metrics of our Voice of the Sea TV-watching population described by TV marketing surveys of Voice of the Sea viewers [
25,
26]. These data were intended to inform comparisons between in-person screenings and our TV audience. Demographic variables collected included age, residence time in the state of Hawai’i, educational attainment, and whether respondents were homeowners (reported as counts).
Additionally, after screening the fourth synoptic episode (Wai Maoli), we conducted a focus group activity to assess audience knowledge gains and perspectives on the type, method, and depth of content presented in the episodes. Focus group participants were each given a paper with two main questions and asked to discuss and summarize their group responses in main points (as captured by the focus group recorder):
- 1.
What are your views on fresh water availability and use?
- 2.
With respect to the Wai Maoli episode you just watched:
- a.
If you watched the previous individual episodes, how do you think this overarching episode compared?
- b.
What do you think of the amount of information presented in the episode? Why?
- c.
What do you think of the number of people sharing in the episode? Why?
- d.
What do you think of the pacing of the episode? Why?
3. Results
We distributed a total of 110 surveys over the four episode screenings and received 85 completed surveys. Of the 85 completed surveys, 78 were included in our analysis; seven were excluded because viewers had previously watched the episode for which they attended a screening. We used anonymous identifiers (nicknames) provided by respondents on their surveys to estimate the number of unique individuals participating in the four screenings (as we anticipated some individuals might attend more than one episode screening). We estimate that 55 unique individuals returned the 78 completed surveys (
Table 1). Respondents ranged from 18 to 85 years of age across all episodes, with the mean spanning middle age at 41 to 61 years of age. Overall, respondents were more frequently female; all demographic data for respondents by episode are presented in
Table 1.
3.1. Episode 1: Recharging Groundwater
The Recharging Groundwater episode screening had 33 attendees who returned 23 completed surveys. Demographic information was obtained for 22 of the 23 survey respondents (
Table 1). Episode viewers ranged in age from 20 to 85 years, with a mean age of 56.3 ± 23.6 SD. Viewers had resided in the state of Hawai’i for an average of 24.1 ± 25.6 SD years. Viewers had a very high level of educational attainment, with all reporting some college, many of which earned degrees (including nine respondents with advanced degrees). Sixty-four percent reported owning their own home. Female and male viewers approached parity at 55% and 45%, respectively.
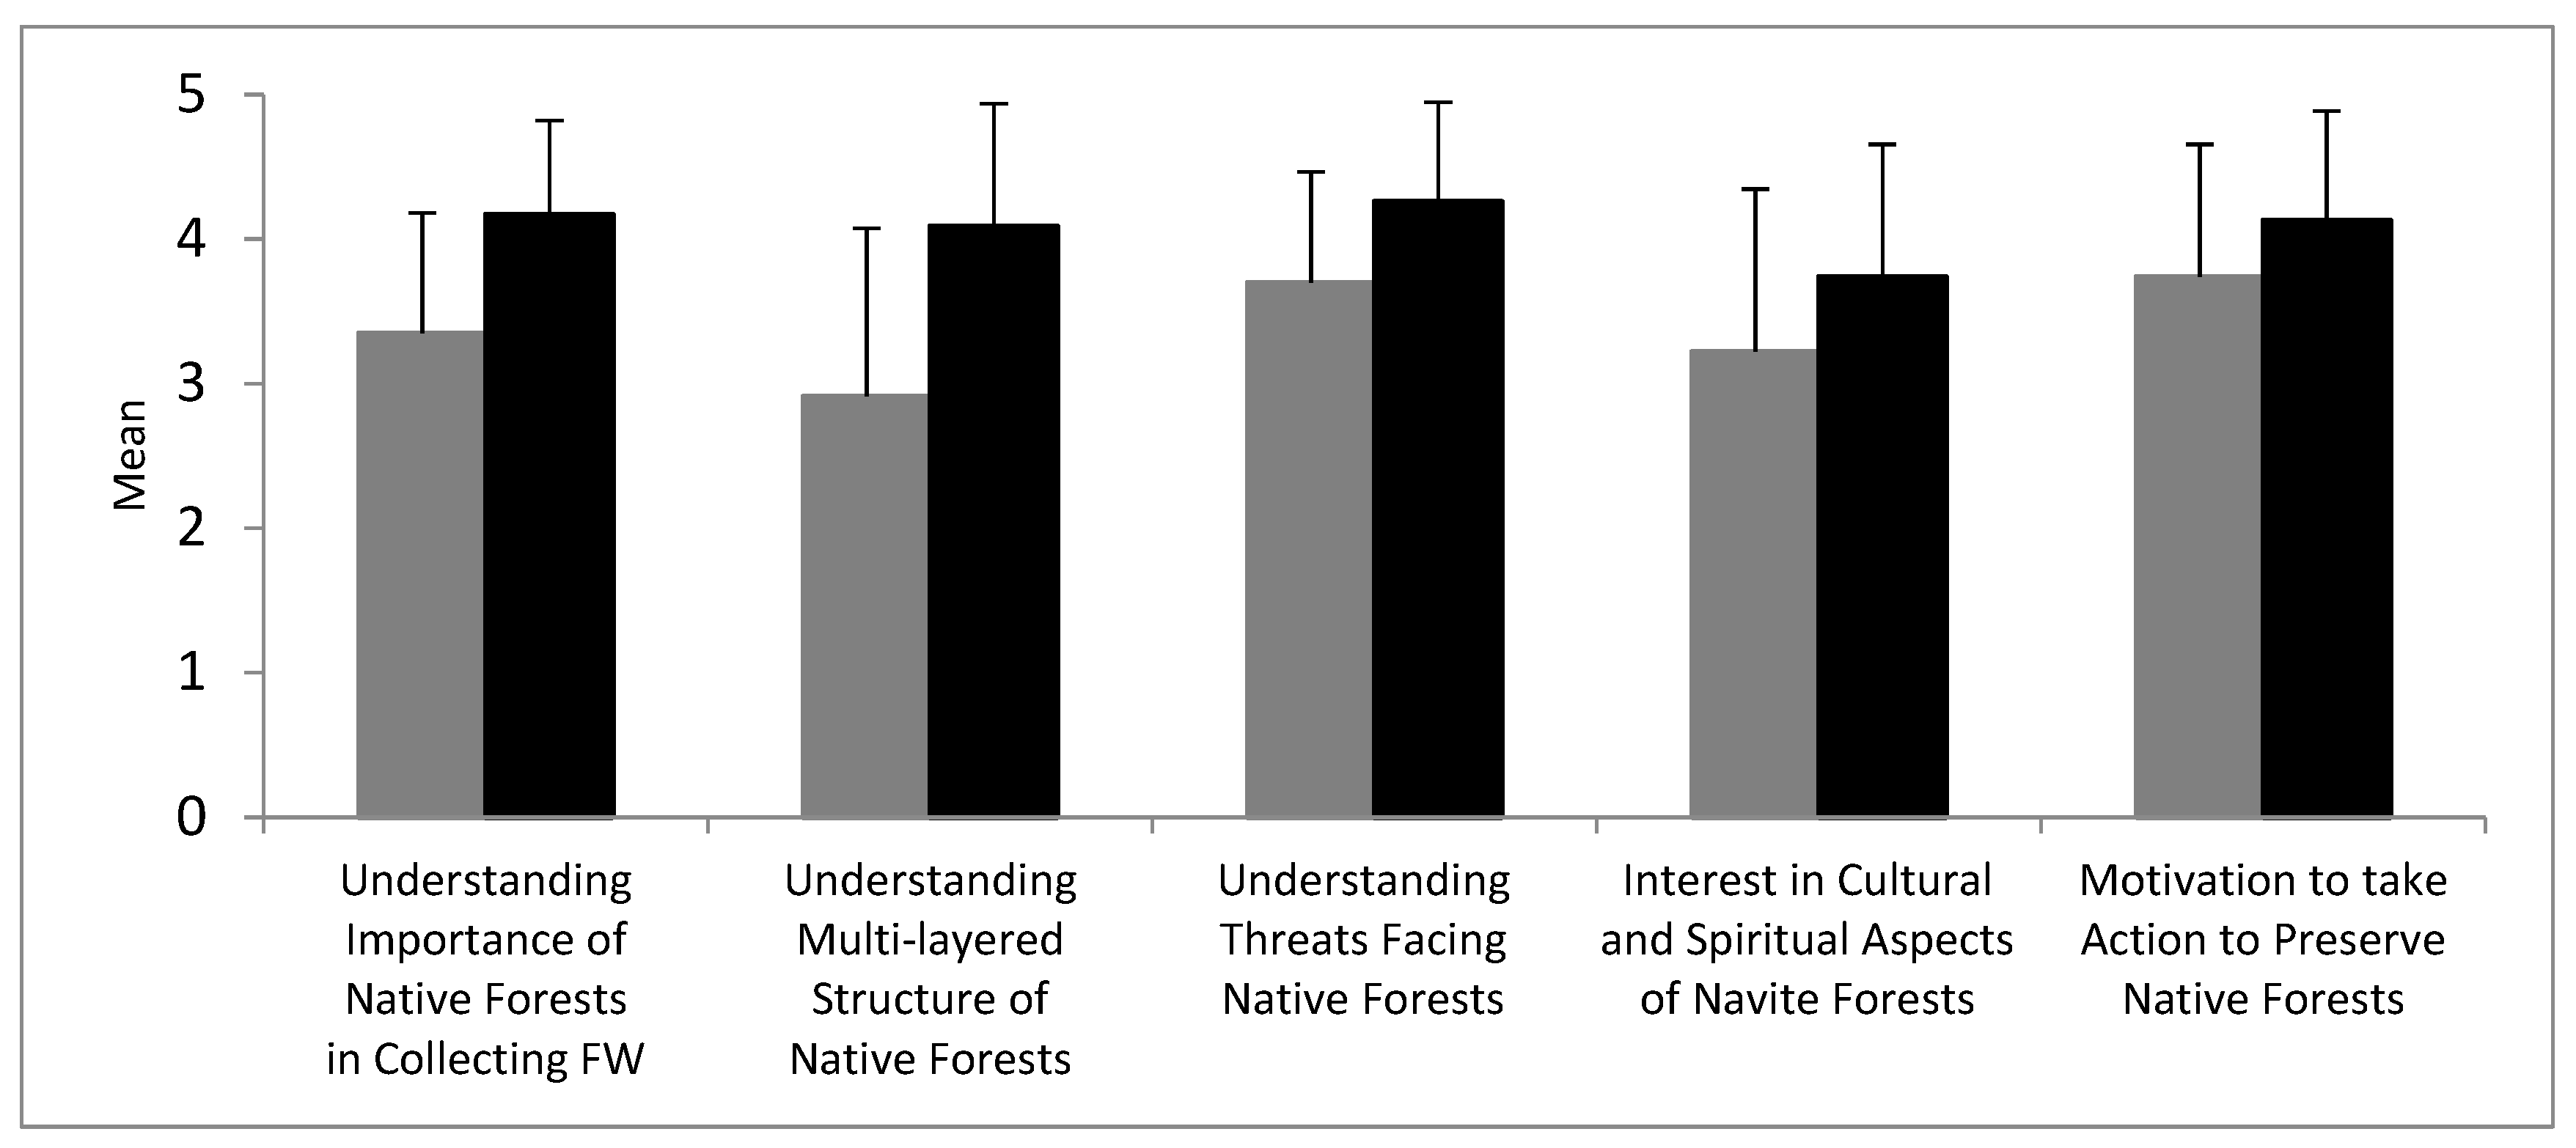
Results indicate that respondents liked the episode, with a mean Likert value of 4.6 ± 0.5 SD (Likert scale 1–5: 1 = not at all, 5 = very much). There was a significant increase in respondent understanding post-screening for all episode topics, including the importance of native forests in collecting fresh water; of the multi-layered structure of plants in the Native Hawaiian forest; of the threats facing Native Hawaiian forests; respondent interest in the cultural and spiritual aspects of Native Hawaiian forest ecosystems; and respondent motivation to take action toward preserving Native Hawaiian forest ecosystems (retrospective pre-post Likert scale 1–5;
p ≤ 0.009 for all, paired
t-tests,
Figure 1).
With respect to what respondents perceived that they learned (open-ended survey responses), respondents commented most frequently on the ability of native forests to collect water (seven respondents), and the importance of native versus invasive species in a healthy forest and watershed (seven respondents). Representative examples of open-ended responses describing what viewers learned in this episode include:
“There are a bunch of problems that need to be solved. We can all help if we know what to do. The movie is a good start”.
“How invasive species have impacted the forests and what a good healthy forest looks like. About the path water takes in a forest”.
“About the importance of the Hawai’i watershed + the detriment of invasive plants on the native ecology + resilience. Not to transport plants between islands”.
“I learned about the watershed process. How it’s affected by the forest community; how invasive species result in mud/too much (many) nutrients in the ocean”.
Respondents reported a willingness to take action across all Recharging Groundwater episode actions queried, with mean Likert values ranging from 3.9 ± 1.3 SD to 4.3 ± 1.5 SD (
Table 2, section A). There were no significant differences in rankings across actions,
p = 0.465, Kendall’s W (
Table 2). Respondents also reported relatively high willingness to vote for spending public funds on protection of the forest in general, but respondents reported less likelihood of voting for specific actions, such as installing fences and removing invasive species; the differences in rankings between voting themes were significant (
p = 0.009, Kendall’s W,
Table 2, Section B).
3.2. Episode 2: Conserving Fresh Water
The Conserving Fresh Water episode screening had 30 attendees with 19 completed surveys; nine of these survey respondents had also attended the Recharging Groundwater episode. Demographic information was obtained for 15 of the 19 respondents (
Table 1). Episode viewers ranged in age from 19 to 84 years, with a mean age of 57.7 ± 19.4 SD. Viewers had resided in the state of Hawai’i for an average of 25.7 ± 22.2 SD years. Eighty-seven percent of viewers had some college (13/15), 12 of which had earned degrees (including seven advanced degrees). Nearly 60% reported owning their own home (9/15). Female to male viewers split at approximately 60% to 40%, respectively.
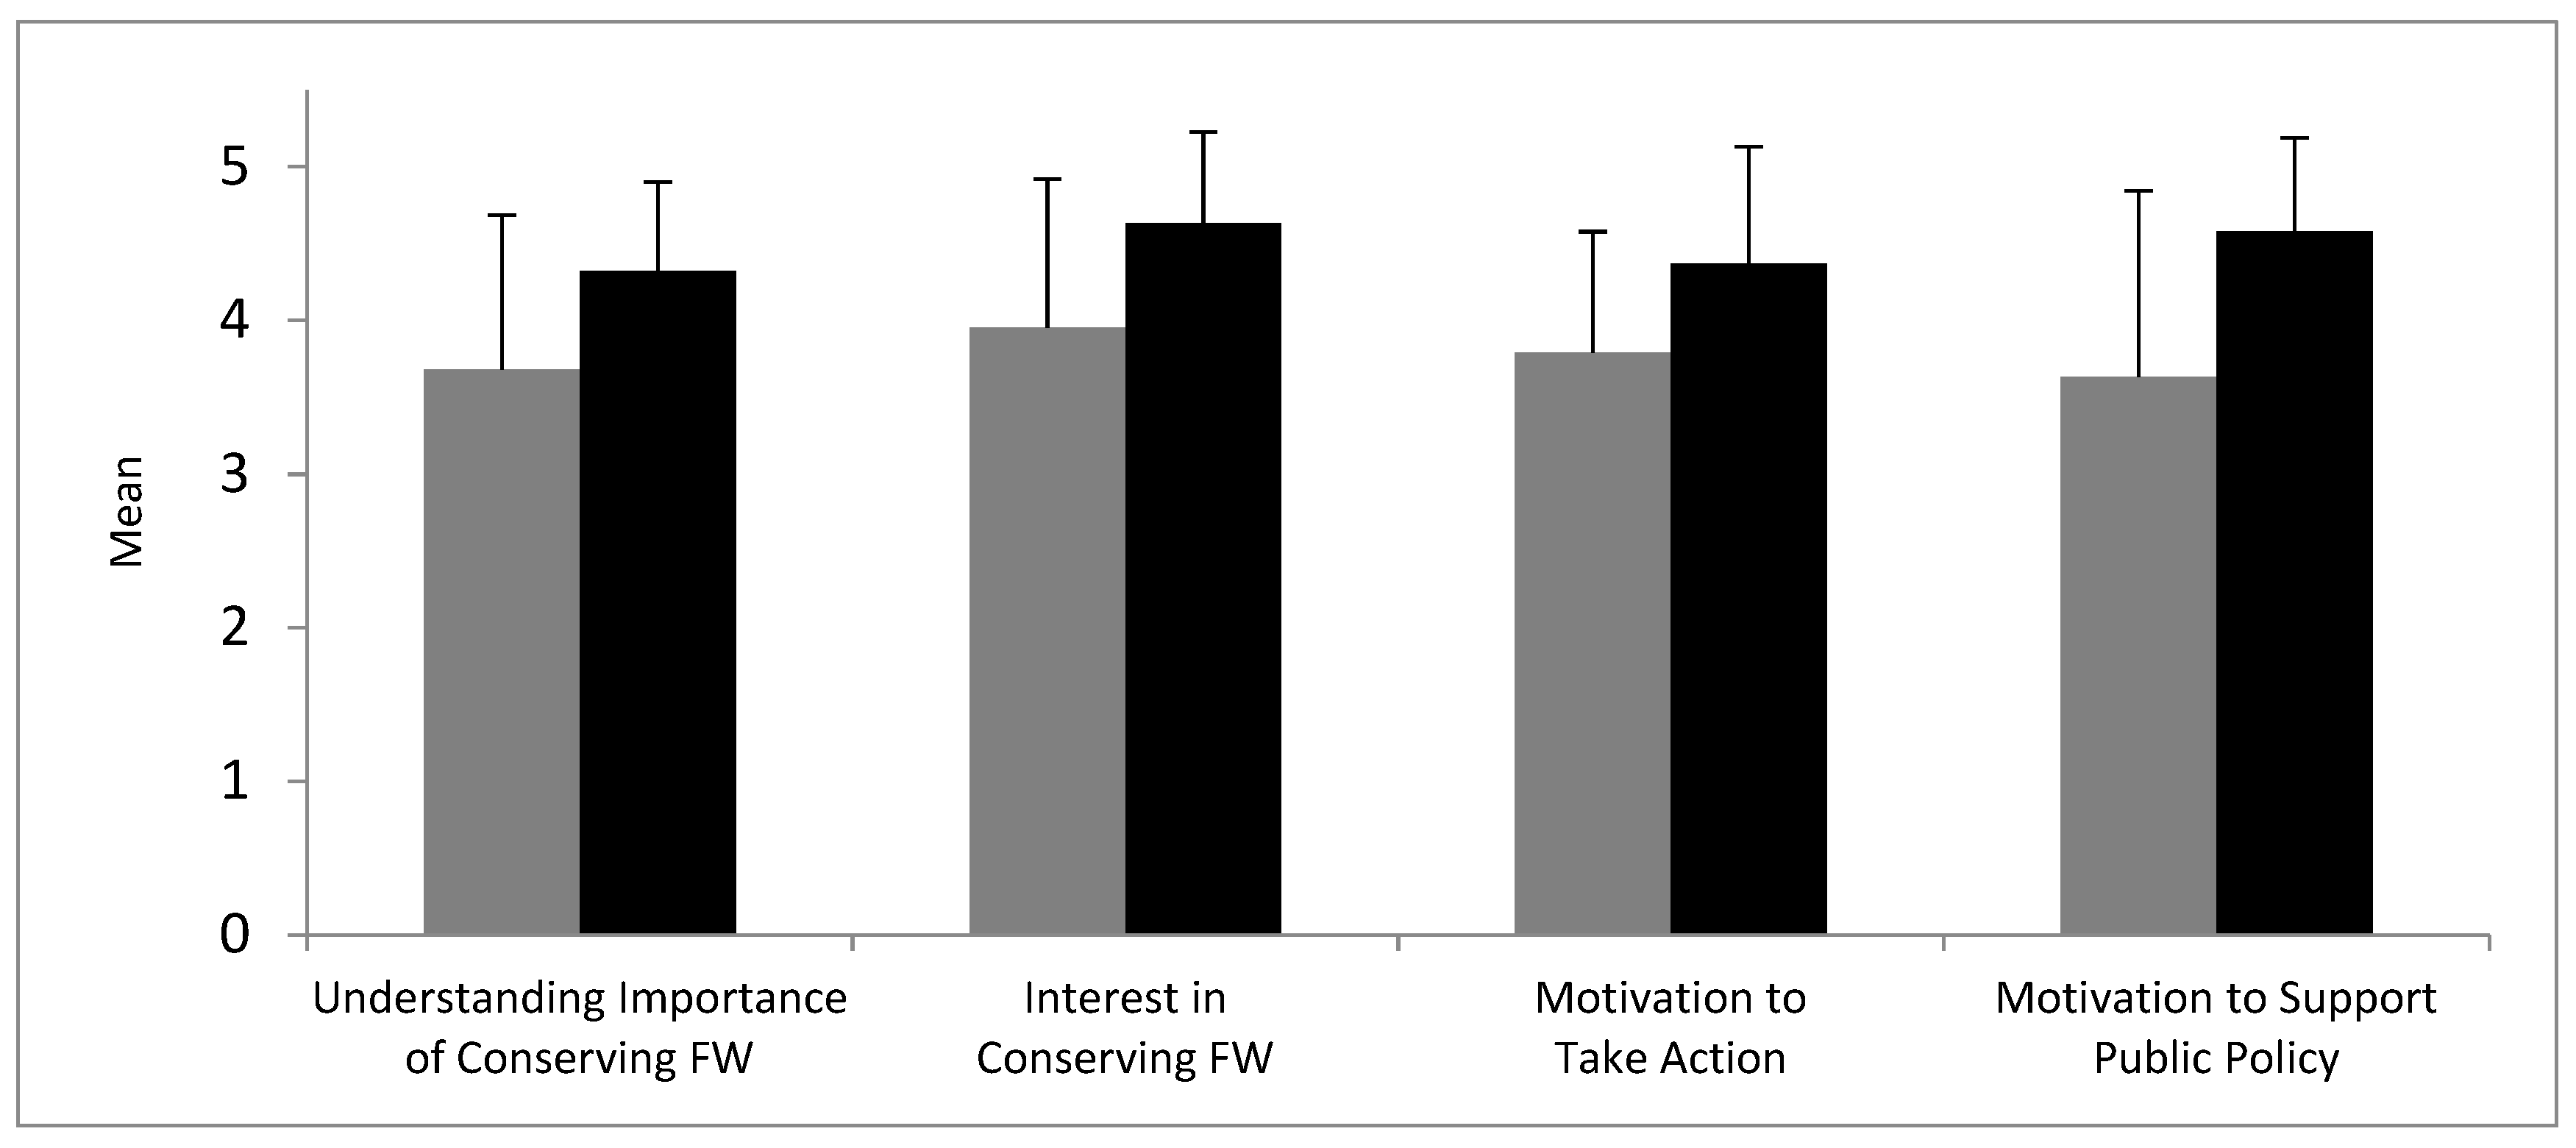
Respondents (N = 19) indicated that they liked the episode, with a mean Likert value of 4.5 ± 0.6 SD (Likert scale 1–5: 1 = not at all, 5 = very much). Moreover, there was a significant increase in respondent understanding of the importance of conserving fresh water; interest in conserving fresh water; motivation to take action toward conserving fresh water; and motivation to support public policies that help conserve fresh water (retrospective pre-post Likert scale 1–5;
p ≤ 0.006 for paired
t-tests,
Figure 2).
With respect to what was learned by watching the episode and what they liked (both open-ended responses), respondents commented most often on (the type of) native plants (six respondents), the social and community aspects of monitoring water use (four respondents), and the experts featured in the episode (five respondents). Representative examples of open-ended responses describing what viewers learned are provided below:
“I’ve taken steps to conserve fresh water but mainly for personal benefit such as cost of water and saving water from going into my septic system. I use rain barrels to collect water to water plants. This episode brought to my attention the needs of HI as a whole and that hard but necessary choices lie ahead”.
“Plant native species to support water collection, the ‘Ōhi’a lehua have root systems that collect much water; think of the wai as riches (wai wai); many water mains break each year, rising sea levels are an interconnected problem; much more!”
“All that is being done for future climate change. for water use. the dual standard for fresh water use! ie: potable and non potable use in 2 separate systems was interesting”.
“That water is wealth. Hawai’i uses a lot of potable water for non-potable items. Our supply of water in the aquifer needs to be managed sustainably, by capturing water using native plants. 34–90% of fixtures that COULD be using grey water are not”.
Respondents also had relatively high self-reports of willingness to take action for all water conservation elements, with mean Likert values ranging from 3.9 ± 1.7 SD to 4.4 ± 0.9 SD, and no differences in willingness across specific actions,
p = 0.745, Kendall’s W (
Table 3). In addition, respondents had high self-reports of willingness to vote for spending public funds to conserve fresh water (
Table 3). However, there was a significant difference across voting categories (
p = 0.021, Kendall’s W), with a greater likeliness to vote for general water conservation policies than the specific policies of plumbing code and water main upgrades (
Table 3).
3.3. Episode 3: Reusing Wastewater
The Reusing Wastewater episode screening had 25 attendees and 17 completed surveys; seven of these respondents had also attended both the Recharging Groundwater and Conserving Fresh Water episode screenings. Demographic information was obtained for 13 of the 17 respondents (
Table 1). Episode viewers ranged in age from 28 to 79 years, with a mean age of 61.8 ± 15.4 SD. Viewers had resided in the state of Hawai’i for an average of 29.0 ± 17.1 SD years. Almost all viewers had some college education (12/13), and nine of the 12 held degrees (two of which were advanced degrees). The same percentage as those having college degrees owned their own home (12/13). Female to male viewers split at approximately 60% to 40%, respectively.
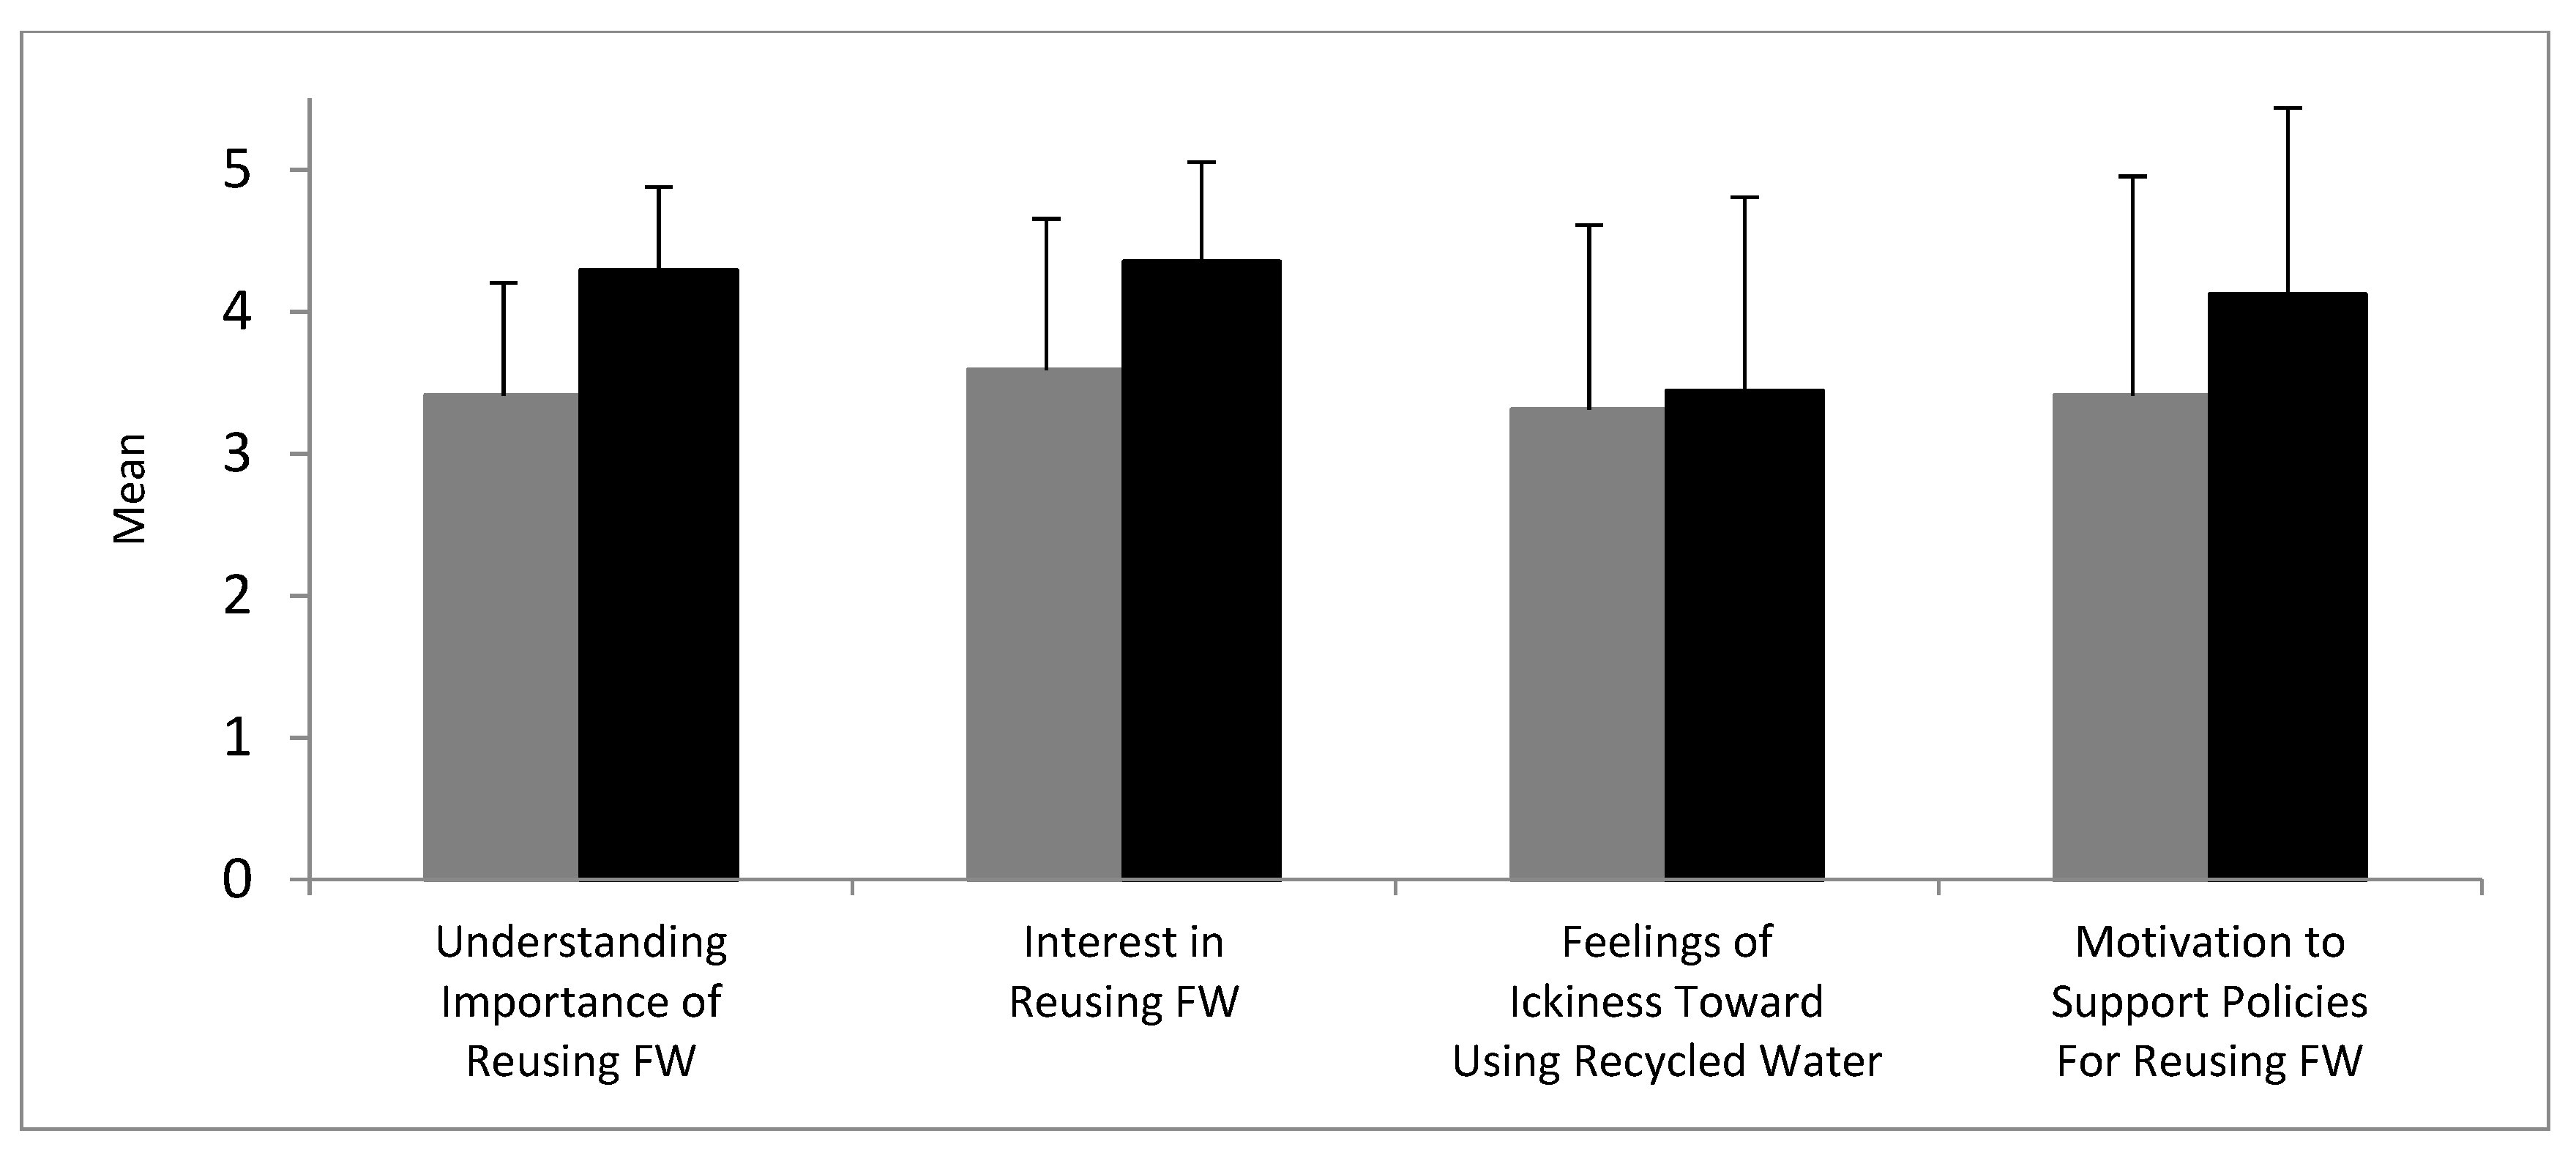
Respondents (N = 17) liked the episode (Likert scale 1–5; mean = 4.4 ± 1.1 SD). Respondents reported a significant increase in their understanding of the importance of reusing fresh water (
p < 0.001), their interest in reusing fresh water (
p < 0.011), and their motivation to support policies for reusing fresh water (
p = 0.013). However, respondents did not report a change in feelings of ickiness toward using recycled water (
p = 0.633, paired
t-tests,
Figure 3).
With respect to what was learned by watching the episode and what they liked (both open-ended responses), respondents commented most often on the definition of R1 water (three respondents), the processes of recycling water (five respondents), and specific uses in Hawai’i (seven respondents). Representative examples of open-ended responses describing what viewers learned are provided below:
“3 types of recycling: rain catchment, grey water, condensate recovery. R1 waters have few/no restrictions and can be used for root/leafy veggies & orchard fruits”.
“That we are recycling water in HI. This was all news to me! I know what R1 means now”.
“Waste water CAN BE processed to potable drinking water when processed properly. Shortage of fresh water will decline as population grows. Must develop alternatives”.
“Biggest hang-up is the “ick” factor that limits use of recycled water. The high-tech process is well equipped to recycle water to drinkable level. Lāna’i is the leader in water recycling [in HI]”.
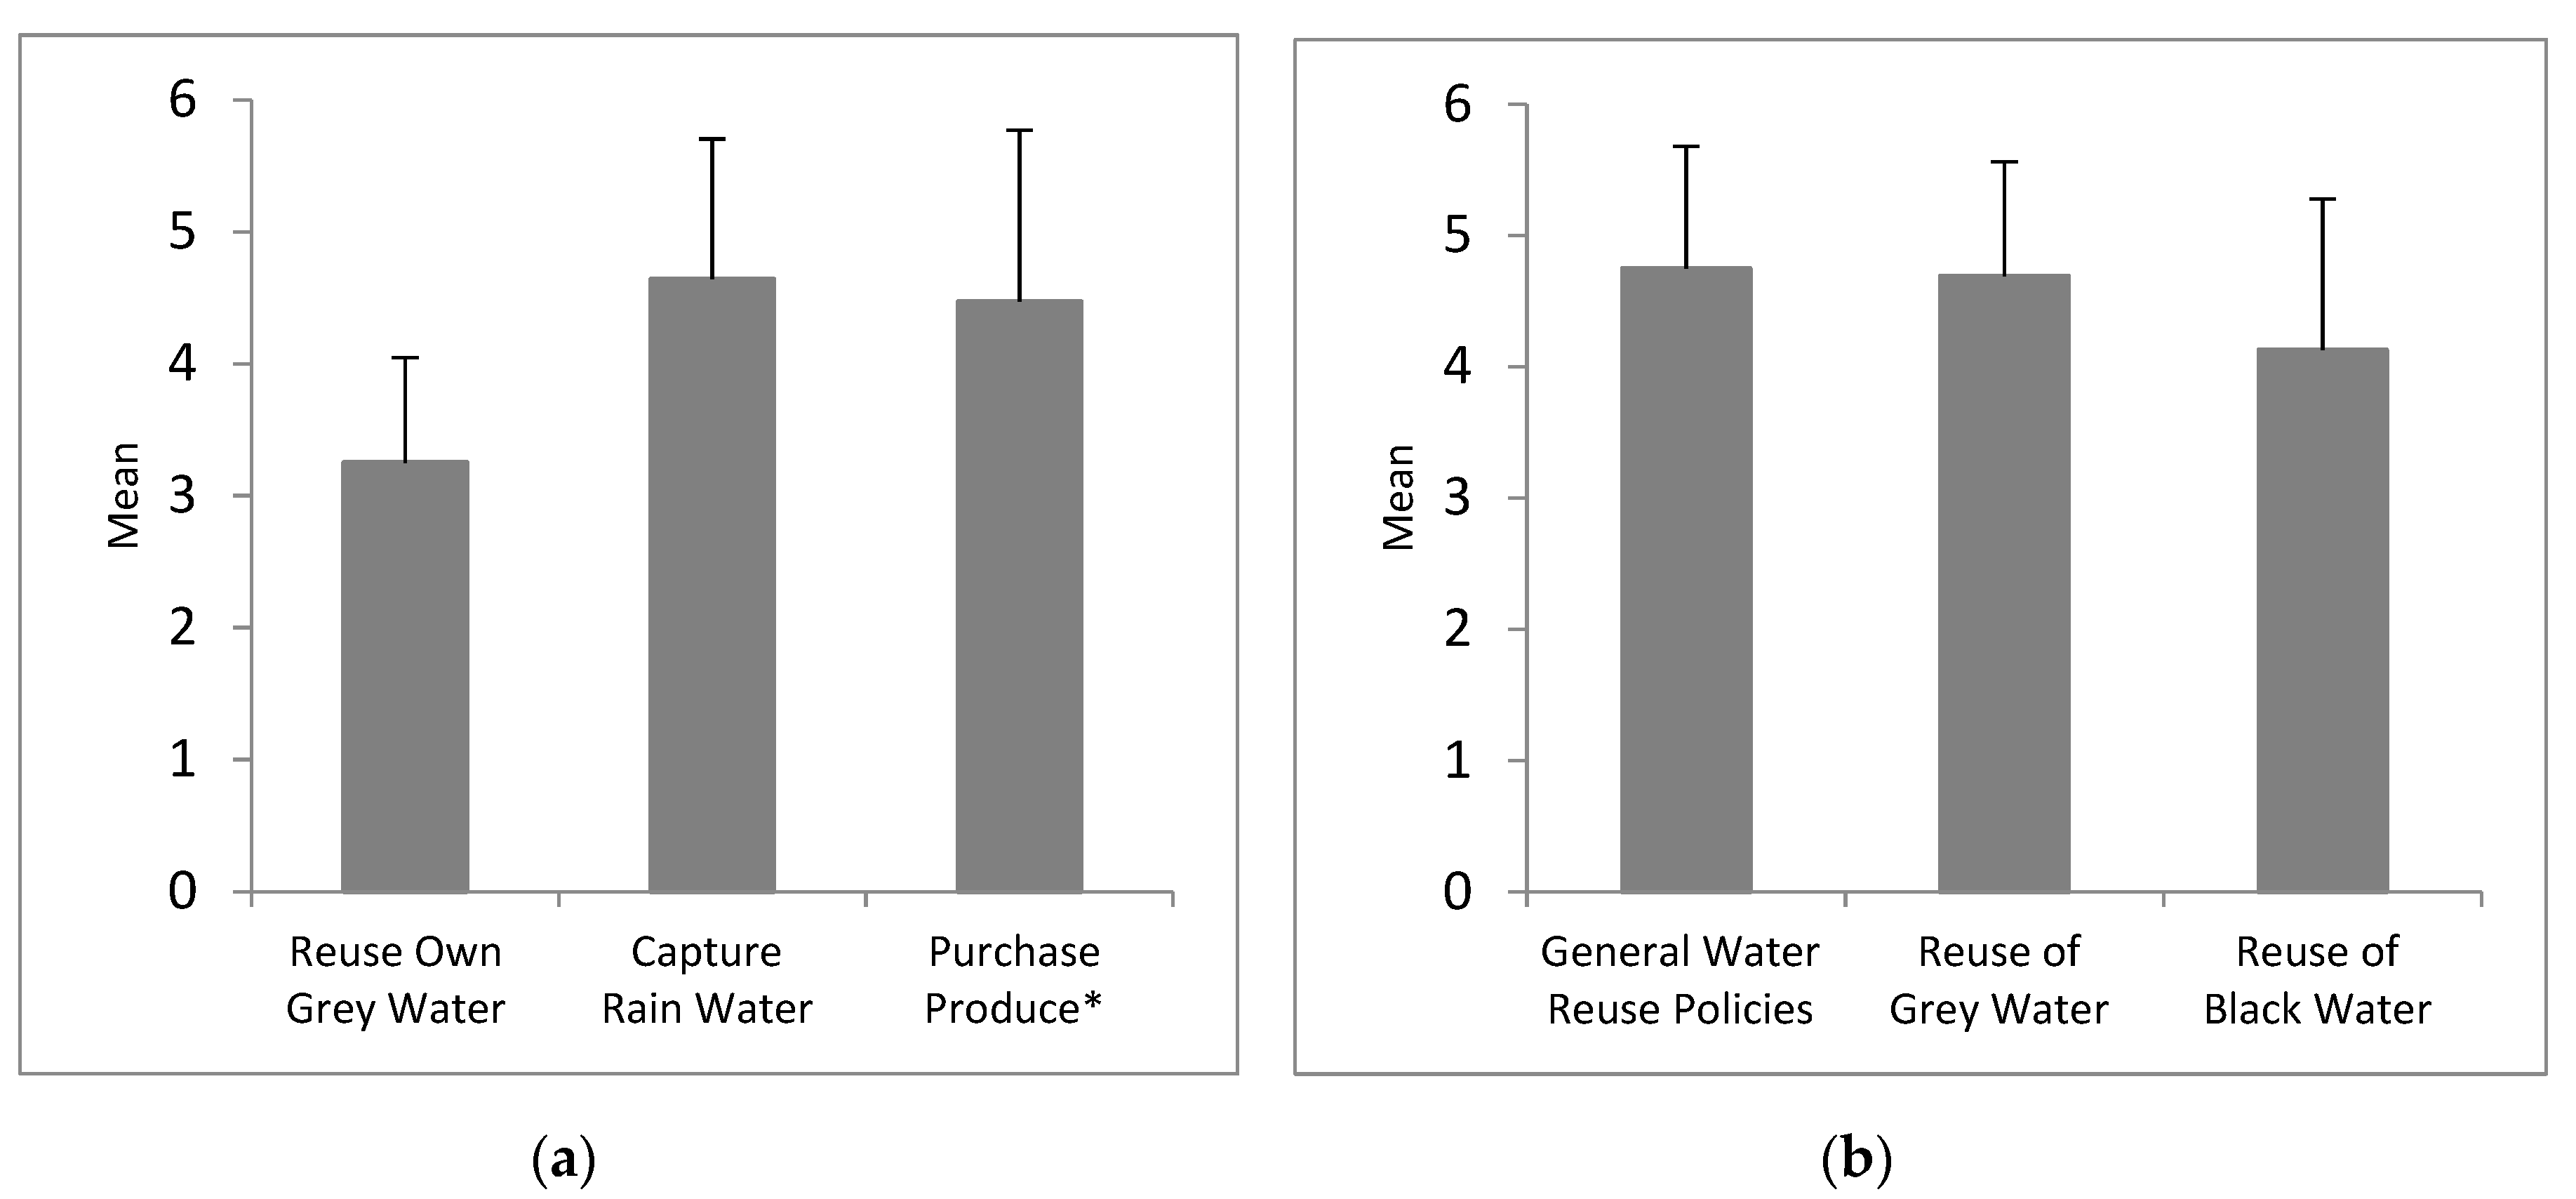
Respondents had relatively high self-reports of willingness to take action on certain types of fresh water reuse, but there was less likelihood of reusing their own grey water (mean Likert value = 3.3 ± 1.7 SD; Likert scale 1–6 with 1 = not likely, 6 = already do), compared to capturing rainwater (mean Likert value = 4.6 ± 1.6 SD) or purchasing vegetables grown in recycled water (mean Likert value = 4.5 ± 0.9 SD); the differences between actions were significant (N = 13;
p = 0.004, Kendall’s W,
Table 4,
Figure 3).
Similarly, respondents had relatively high self-reports of willingness to vote for water reuse overall (mean Likert value = 4.8 ± 0.9 SD; Likert scale 1–6 with 1 = not likely, 6 = already do), but were less likely to vote for the reuse of black water (mean Likert value = 4.1 ± 1.1 SD; Likert scale 1–6 as above); these differences were significant across voting items (
p = 0.001, Kendall’s W,
Table 4,
Figure 4).
3.4. Episode 4: Wai Maoli
The Wai Maoli synoptic episode screening had 22 attendees and 19 completed surveys; 11 of the 19 respondents had attended at least one of the previous three fresh water episode screenings. Demographic information was obtained for 17 of the 19 respondents (
Table 1). Episode viewers ranged in age from 18 to 85 years, with a mean age of a mean age of 41.1 ± 25.1 SD. Viewers had resided in the state of Hawai’i for an average of 23.7 ± 20.0 SD years. Fifty-nine percent of viewers had some college (10/17), with eight holding degrees (three of which were advanced degrees). Fewer viewers owned their own home, at 41% (7/17). Sixty-five percent of viewers self-identified as female and 35% as male.
Respondents (N = 19) liked the culminating Wai Maoli episode (Likert scale 1–5, mean = 4.4 ± 0.8 SD) but reported that all three previous fresh water topics (recharge, conservation, and reuse) were only modestly addressed in this summary episode (Likert scale 1–5, mean = 3.8 ± 1.1 SD, and see comments in
Table 5). Of the 19 respondents, five (5) reported that they preferred to watch only the summary Wai Maoli episode, seven (7) reported that they preferred to watch only the three individual content episodes, and seven (7) reported that they preferred watching all four of the fresh water episodes (individual episodes in addition to the summary). Respondents that had seen one or more of the in-depth topical content episodes (N = 13) reported that topics were better addressed in the individual topical episodes (Likert scale 1–5, with 1 = not very well covered and 5 = very well covered, mean = 4.4 ± 1.0 SD).
Following the discussion about episode format, each focus group was asked to discuss their views on fresh water availability and use. The most common themes that emerged included education, attitudes, sustainability, and solutions for the future. The main points recorded by each of the five focus groups were as follows:
“[People’s] ideas and biases have to change. Education (Children/adults/industry) is key. Need motivation. *focused on problem solving—education eg: government (city, state)—How to utilize water”.
“We are spoiled by having fresh water available to us so easily, and need to work on being sustainable. We should use waste water recycling on O’ahu.
“Fresh water is a precious and finite resource. However, current water use and attitude towards development is at odds with water availability for the future”.
“Water availability is a current and growing problem. We need to educate our Government people to be aware of problems and possible solutions. Need new plumbing codes for water usage”.
“For previous generations they were told they would never run out of water, however in recent decades it has started to become clear that we are going to run out, and people have to start being proactive with water conservation. It is important to consider now that the population and tourism industry has increased in Hawaii, O’ahu especially”.
4. Discussion
“Being ‘water literate’ means having an understanding of the significance of water in life, and understanding where water comes from and how to use it sustainably.” [
2]. Issues of fresh water supply and quality are large, complex, societal issues requiring individual to collective action. Awareness is the base level of water literacy; it is the foundation of knowledge taxonomy and precedes understanding. Action is a higher-level element, requiring an elevated level of interest and motivation needed for application [
34,
35]. The intent of our four-episode Voice of the Sea series on fresh water in Hawai’i was to improve viewers’ awareness of the emerging fresh water crisis on the horizon and to promote actions in Hawai’i to (1) recharge groundwater, (2) conserve fresh water, and (3) reuse wastewater.
Overall, the series of episodes contributed to the achievement of water-related environmental literacy; viewers generally liked the episodes, found them to be of good quality, and reported that they were able to learn valuable information. A common theme expressed by viewers was the connection to experts profiled in the episodes. For example, a respondent of the Conserving Fresh Water episode wrote, “I loved how passionate the experts were. It was really great to see them utilize indigenous knowledge to help solve modern problems. It was helpful to learn the details of what has to be addressed so I can make better informed decisions when policies are being voted on”. Providing a platform and positive exposure for such role models can contribute to achieving broader diversity, equity, and inclusion awareness and action [
19,
36], and the affinity of viewers for profiled experts demonstrates that innovative TV programming, such as Voice of the Sea, can serve a societal role by introducing and showcasing a diversity of experts, including members of underrepresented and underserved populations.
Although our respondents possessed relatively high initial levels of self-reported understanding, interest, and motivation, there were nonetheless significant increases in these parameters across all four episodes. Viewers reported gains in fresh water literacy, as evidenced by increases in their retrospective Likert scale and open-ended survey responses. Viewers were largely willing to take action and to pledge their support to vote for using public funds to restore native forests via groundwater water recharge, to conserve fresh water, and to recycle used water.
However, viewers were less swayed on difficult topics, such as the ickiness of recycled water, the reuse of black water, the adoption of new plumbing codes, and the reuse of water within their own homes. This finding is also reflected in the generally higher non-response rates for questions addressing these more difficult topics. Interestingly, the highest non-response rate for all surveys and episodes was the 8.7 percent non-response rate indicating that they would “Take precautions to prevent the spread of Rapid ‘Ōhi’a Death” in the Episode 1: Recharging Groundwater with respect to the question, “Which of the following are you most likely to do personally or as a family?” This lack of response suggests viewer unease and/or difficulty surrounding understanding of and taking action to prevent Rapid ‘Ōhi’a Death, a fungal disease of the ‘Ōhi’a lehua tree (which is a tree native to the Hawaiian Islands and critical to the absorption and transfer of water to aquifers). In terms of ways to improve the content delivery, viewers asked for more information and specifics about what they could personally do—such as native plant identification and growth, weed identification and removal, invasive species plans, rain barrel catchment, and reuse of grey water within a home.
Overall, viewers’ gains in self-perceived knowledge, interest, and motivation were consistently positive. We administered the surveys as retrospective, pre-post questionnaires. The retrospective pre-post design helps to ensure that respondents score their pre- and post-abilities on the same relative scale; however, it may have invited a social desirability effect. This effect is the tendency of respondents to answer questions in a way that others will find favorable, such as over-reporting “good” behavior and under-reporting “bad” behavior [
37]. Interpretation of viewer Likert scale responses in combination with their open-ended survey comments nonetheless suggest that respondents improved their knowledge, interest, and motivation.
The demographics of survey participants at study screenings were representative of our Voice of the Sea TV audience with regard to age and viewer residence time in the state of Hawai’i. Like our TV audience [
25,
26], viewers in this study were long-term residents in the state (on average having lived in Hawai’i between 20 and 30 years). Respondents spanned adult age groups but skewed toward older viewers, and female viewers were more frequently represented than males. As TV audiences are notoriously difficult to survey, the similarities of audiences allow broader, albeit cautionary, insight with regard to findings. Notably, both audiences tended toward maturity, emphasizing the ability of educational TV programming, like Voice of the Sea, to reach older audiences [
8].
This older demographic comprises a critical component in building water literacy in a community. Indeed, although educational programming for children is imperative, many pressing issues require community and individual understanding, engagement, and compliance inclusive of voting, career guidance, and support that must be undertaken by adults. In this regard, the ability to effectively reach adults and develop their environmental literacy is paramount. With regard to educational attainment, study screening participants generally had more formal education than the Voice of the Sea TV audience, which is largely non-college-educated [
25,
26]. Interpreting study results should include such considerations, therefore, as the scope and experimental design of this study did not allow for the exploration of variations in viewer understanding, interest, and motivation by educational attainment level.
The results of this study support the use of relatively long-form, content-rich educational video to enhance water literacy and increase viewers’ motivation to take action to conserve and protect water resources. Findings also imply that changing viewers’ perceptions on controversial or difficult topics requires more in-depth consideration of ideas and construction of new beliefs. Based on this, we suggest that a hybrid delivery approach, inclusive of TV programming, online media, in-person outreach, and classroom curricula, may effectively help to bridge the “digital divide” and better serve to establish water literacy across a broad cross-section of our population in various socio-economic circumstances. This is particularly relevant in light of the Covid-19 pandemic, during which in-person interaction remains limited and TV viewing for informational and entertainment purposes has increased [
10], expanding the relative importance of TV to deliver information.
4.1. Episode Story Format
When first approached about producing a fresh water educational video, the request was for one 30-min episode of Voice of the Sea. However, the depth of content, number of experts, and filming locations desired to convey the ideas in the Wai Maoli initiative exceeded the scope of a single episode. This invoked the following consideration: Would three individual topical episodes be substantially more effective than a single synoptic episode to offset expected viewership reduction from a single episode to a series of three episodes? This is a manifest issue in environmental education and, arguably, in education in general: given limited resources, is it more effective to gallop through a vast knowledge field in the hopes of providing broad awareness, or is it more effective to “dig post-holes” and address fewer topics more intensively? Constructivist theory lends support to the latter, with evidence pointing to more effective knowledge construction and application when learners have higher levels of engagement [
38]. Science communication research also supports these ideas, with much credence given to story-telling and personal connections, especially with respect to difficult-to-change beliefs like climate science [
39].
However, communication can only be successful when the target audience engages with the intended information, prompting many science communication experts to advocate for short, social-media-length products (e.g., 15 s to 1 min). However, in some situations, learners have relatively long attention spans; of particular interest is the phenomenon of increasing video length on social media platforms and the rapid growth of long-format podcasts [
8], both of which are informing our understanding of people’s interest in consuming complex information. In this study, we were able to engage with an audience, including repeat viewers, to investigate the question of in-depth versus synoptic content focused on a single topic of water science, with respect to 30-min Voice of the Sea episodes. The results of our surveys and focus groups support prior research—suggesting that in-depth, story-like content is preferred by viewers.
4.2. Study Summary
In summary, our study of the Voice of the Sea fresh water series demonstrates that gains in awareness, understanding, and motivation are achievable through innovative video programming delivered through multiple modalities, including traditional television broadcast and on-demand online viewing. We present these findings not only as an existing product for educators to freely use directly with their own audiences (via our archive at voiceofthesea.org) but also as a conceptual springboard for other education and outreach programs. We encourage colleagues to partner with video production experts, such as independent local producers, universities, and student media trainees, to develop TV programming. Regional TV stations, like our partner station KFVE in Hawai’i, have directives for airing locally produced content, which provide a unique opportunity for sharing evidence-based concepts and associated careers to expand viewers’ perceptions of how and by whom research is conducted while increasing water and environmental literacy.
4.3. Future Research
Here, we show that innovative educational TV programming can contribute to enhanced water literacy as evidenced by increased self-perceptions of knowledge, interest, and motivation. Motivation included evaluations of the likelihood of viewer engagement ranging from implementing individual acts toward achieving sustainable water resources to supporting policy inclusive of voting. However, the translation of reported motivations to actual action by viewers is unknown. As shown here, even achieving altered perceptions on difficult or uncomfortable topics, e.g., reuse of black water and the associated ick factor, is challenging. Future longitudinal studies that followed individuals to evaluate actual changes in behavior would provide key context on findings such as those presented here. Such studies might also include variations in delivery and engagement that couples viewing educational video programming and experiential learning inclusive of hands-on or place-based activities. Examples of such activities are interactive workshops, e.g., building a rain barrel, out-planting native plants, and water testing, among others. While we acknowledge the myriad funding, logistical, and cultural challenges associated with such research, we nonetheless encourage exploration of investigations that take this next step.
Environmental literacy is foundational to an engaged democracy, has a complex, critical relationship with diversity, equity, and inclusion (DEI), and can support environmental justice. Widespread environmental literacy is not possible without attaining broad societal DEI. Conversely, attaining comprehensive DEI will require an engaged citizenry with environmental literacy capacity. One barrier to achieving DEI is lack of exposure to potential opportunities and relatable role models [
13,
23]. One cannot dream, plan, or work toward an educational aspiration or job if one is unaware, even, of the existence of such opportunities or professions. Innovative environmental literacy programming can play a key role in overcoming such barriers [
19,
40]. Programming that reaches those not customarily served by professional extension and educational outreach—for example, underserved or underrepresented groups—is particularly valuable. The Voice of the Sea series is intentional in profiling experts from underrepresented and underserved groups as role models in support of preparing and recruiting a diverse workforce. However, the extent to which this, and other, programming reaches target groups is not fully understood and warrants investigation. Further, the impacts of exposure to such programming and role models on the perceptions, actions, and educational and career trajectories of underserved and underrepresented viewers are of interest. Future research that uses extant educational programming, like Voice of the Sea, to both deliver and evaluate elements related to DEI is recommended.


