Article

Spatial and Temporal Variability of Posidonia oceanica Monitoring Indicators, Valencian Community, Spain

by
Yolanda Fernández-Torquemada
1,*,
Marta Díaz-Valdés
2,
Andrés Izquierdo-Muñoz
3,
José Luis Sánchez-Lizaso
1 and
Alfonso A. Ramos-Esplá
1,3
1
Department of Marine Sciences and Applied Biology, University of Alicante, PO Box 99, 03080 Alicante, Spain
2
Oceanographic Centre of Baleares, IEO, Muelle de Poniente, s/n, Apartado de Correos 291, 07015 Palma, Spain
3
Marine Research Centre of Santa Pola (CIMAR), University of Alicante, Carretera de San Vicente del Raspeig s/n, 03690 San Vicente del Raspeig Alicante, Spain
*
Author to whom correspondence should be addressed.
Water 2020, 12(11), 3235; https://doi.org/10.3390/w12113235
Submission received: 30 October 2020 / Revised: 11 November 2020 / Accepted: 15 November 2020 / Published: 18 November 2020
(This article belongs to the Special Issue Marine Biology: Biodiversity and Conservation)

Abstract

:
This article presents the results from the long-term Water Framework Directive monitoring of Posidonia oceanica in the Valencian Community, Spain. A total of six areas where Posidonia occurs were studied. Locations were characterized by a different ecological condition: degraded Posidonia meadows; meadows in good conditions; meadows close to the best reference conditions. The spatiotemporal variability of different indicators were sampled from 2005 to 2017. Lower quality meadows are characterized by a lower density and coverage of Posidonia, a higher proportion of dead Posidonia, a higher proportion of plagiotropic rhizomes, smaller shoots, and higher epiphyte biomass, as well as the presence of foliar necrosis marks. For all study sites, the temporal trends indicated a decrease in the quality of the meadows from 2005 to 2011 and a recovery from 2012 to 2017. Some variability observed in the indicators such as P. oceanica cover in patchy meadows, could not be explained by changes in the meadow health.

1. Introduction

Seagrasses constitute fundamental ecosystems lying on soft coastal bottoms worldwide, by providing for key ecological functions (e.g., habitat, food, nutrient cycling) and ecosystem services that contribute to human welfare (e.g., global carbon sequestration, shoreline protection, enhanced fisheries [1,2]).
In the Mediterranean Sea, Posidonia oceanica is an endemic seagrass that forms dense meadows in coastal areas. These meadows represent one of the most productive and valuable key ecosystems in the Mediterranean but they are also very sensitive to changes in the quality of the environment [3,4].
Posidonia oceanica meadows have been experiencing a generalized decline [5,6], probably ensuing from local or medium-scale anthropogenic disturbances related to eutrophication, otter trawling fisheries, coastal development, and urban and industrial sewage, among others [4,7,8,9,10,11,12]. Currently, it seems that some Posidonia meadows are recovering as a result of several conservation measures [13,14,15].
The Water Framework Directive (WFD) has instituted an ambitious strategy with the aim of reaching a good ecological status for all surface water bodies within the European Union (EC, 2000). Monitoring in the WFD aims at detecting how eventual changes in the quality of the water are reflected in ecosystem status. To this aim, the WFD establishes the monitoring and protection of surface water bodies based on biological, hydromorphological, and physico-chemical quality elements. Biological quality elements (BQEs) can include different bioindicators, including seagrasses. For instance, in the Mediterranean Sea, Posidonia oceanica has been used as the main seagrass indicator [3,16,17,18]. Some indicators have been more often used in research and monitoring programs such as the shoot density, the P. oceanica meadow and dead-matte cover, the meadow limits, epiphytic coverage, leaf biometry, shoot balance, and total non-structural carbohydrates [16,17,18,19].
In this work, we present the results of a long-term WFD monitoring of P. oceanica in the Valencian Community of Spain. The objectives of this paper were to study temporal and spatial fluctuation of the P. oceanica indicators used in this monitoring; investigating possible sources of this variation. We also evaluated the ecological status of these meadows over time. A relevant aspect for seagrass management is the rate of the seagrass decline. While some authors warn that a global process of P. oceanica decline is currently ongoing [5,6], others argue that the perceived decline is due to an accumulation of local impacts [13]. We also discuss the relevance of local versus global drivers of seagrass meadow quality.

2. Materials and Methods

2.1. Study Area and Sampling Design

This study was conducted along the coast of the Valencian Community (Spain), in the western Mediterranean, during September–October from 2005 to 2017, in the context of the EU Water Framework Directive. Sampling was done by scuba divers in 6 locations (Figure 1) encompassing a depth range of 14–17 m, as meadows at these depths are usually not affected by natural alterations, e.g., those caused by waves or storms [20]. The locations were selected based on existing knowledge of the ecological status of their respective Posidonia meadows [17]. We selected two degraded localities (WFD status poor-moderate), namely Benicassim and Alicante; two localities where meadows present good conditions (WFD status good), namely Altea and Oropesa; two localities with meadows close to the best reference conditions (WFD status high) in the municipalities of Calpe and Santa Pola. At each locality, three sampling sites each at a distance of hundreds of meters from each other were randomly selected to prevent spatial pseudo-replication [21]. Logistical constraints prevented us to carry out sampling in Oropesa in 2005, in all the localities during 2011 and 2012, and to obtain plagiotropic rhizome proportion and necrosis data in 2005.

2.2. Posidonia Indicators

We studied Posidonia indicators of ecological condition related with the meadow community (such as the herbivore pressure and existing epiphyte biomass), the population (dead-matte cover, meadow cover, shoot density and proportion of plagiotropic rhizomes), and characteristics of individual plants (rhizome baring/burial, shoot foliar surface, and foliar necrosis).

2.2.1. Structural Indicators

At each sampling site, three 40 × 40 cm quadrats were randomly set to measure the shoot density, percentage of plagiotropic rhizomes, and rhizome baring. The living and dead Posidonia cover were estimated as the proportion of living and dead patches, respectively, in three replicate 20 m transects (for a more detailed methodology see [17]). In addition, the conservation index (CI) was derived from the ratio of the Posidonia meadow cover divided by the total meadow cover (calculated as the Posidonia cover plus the dead-matte cover) [22].

2.2.2. Shoot Morphology and Epiphytic Biomass

Five P. oceanica shoots were randomly collected by hand at each of the tree sampling sites per locality and sampling time and brought to the laboratory in a cooler for further analysis. In the laboratory, we quantified the number of leaves per shoot, as well as the length and width of all leaves. The foliar shoot surface was calculated as the sum of all individual leaf areas per shoot. Necrosis and herbivore occurrence were also estimated by calculating the percentage of leaves inside a shoot that presented these kind of marks. Macroscopic epiphytes were removed using a razor blade, and the epiphytes and leaves were subsequently oven-dried to obtain the epiphyte biomass (i.e., dry weight, DW, of epiphytes per cm2 of leaf) and shoot biomass.

2.3. Data Analysis

An analysis of variance (ANOVA; [23]) was performed in order to estimate whether the mean values of the various indicators varied significantly among locations, sites and sampling times. Previously, data normality was verified using the Kolmogorov–Smirnov test of normality and the homogeneity of variance was checked with a Cochran test [23]. If necessary, data were sqrt or log transformed. Minimum significance level was established at p < 0.05, but if the ANOVA assumptions were not accomplished, alpha was changed to 0.01. When analysis of variance identified a significant difference, the post-hoc Tukey test was applied to identify specific treatment differences. All statistical analyses were implemented in the open source software R3.6.1 (www.r-project.org).
We also used GAMs (Generalised Additive Models) models to observe fluctuations of Posidonia indicators through time in different locations, in order to estimate trends during years where data was lacking. In our case, GAMs allowed the treatment of our data consisting of temporal series irregularly spaced in time (there is a lack of sampling during 2012–2013), and that do not follow a linear trend [24,25]. Models were fitted using the mgcv package [26] for R [27].

3. Results

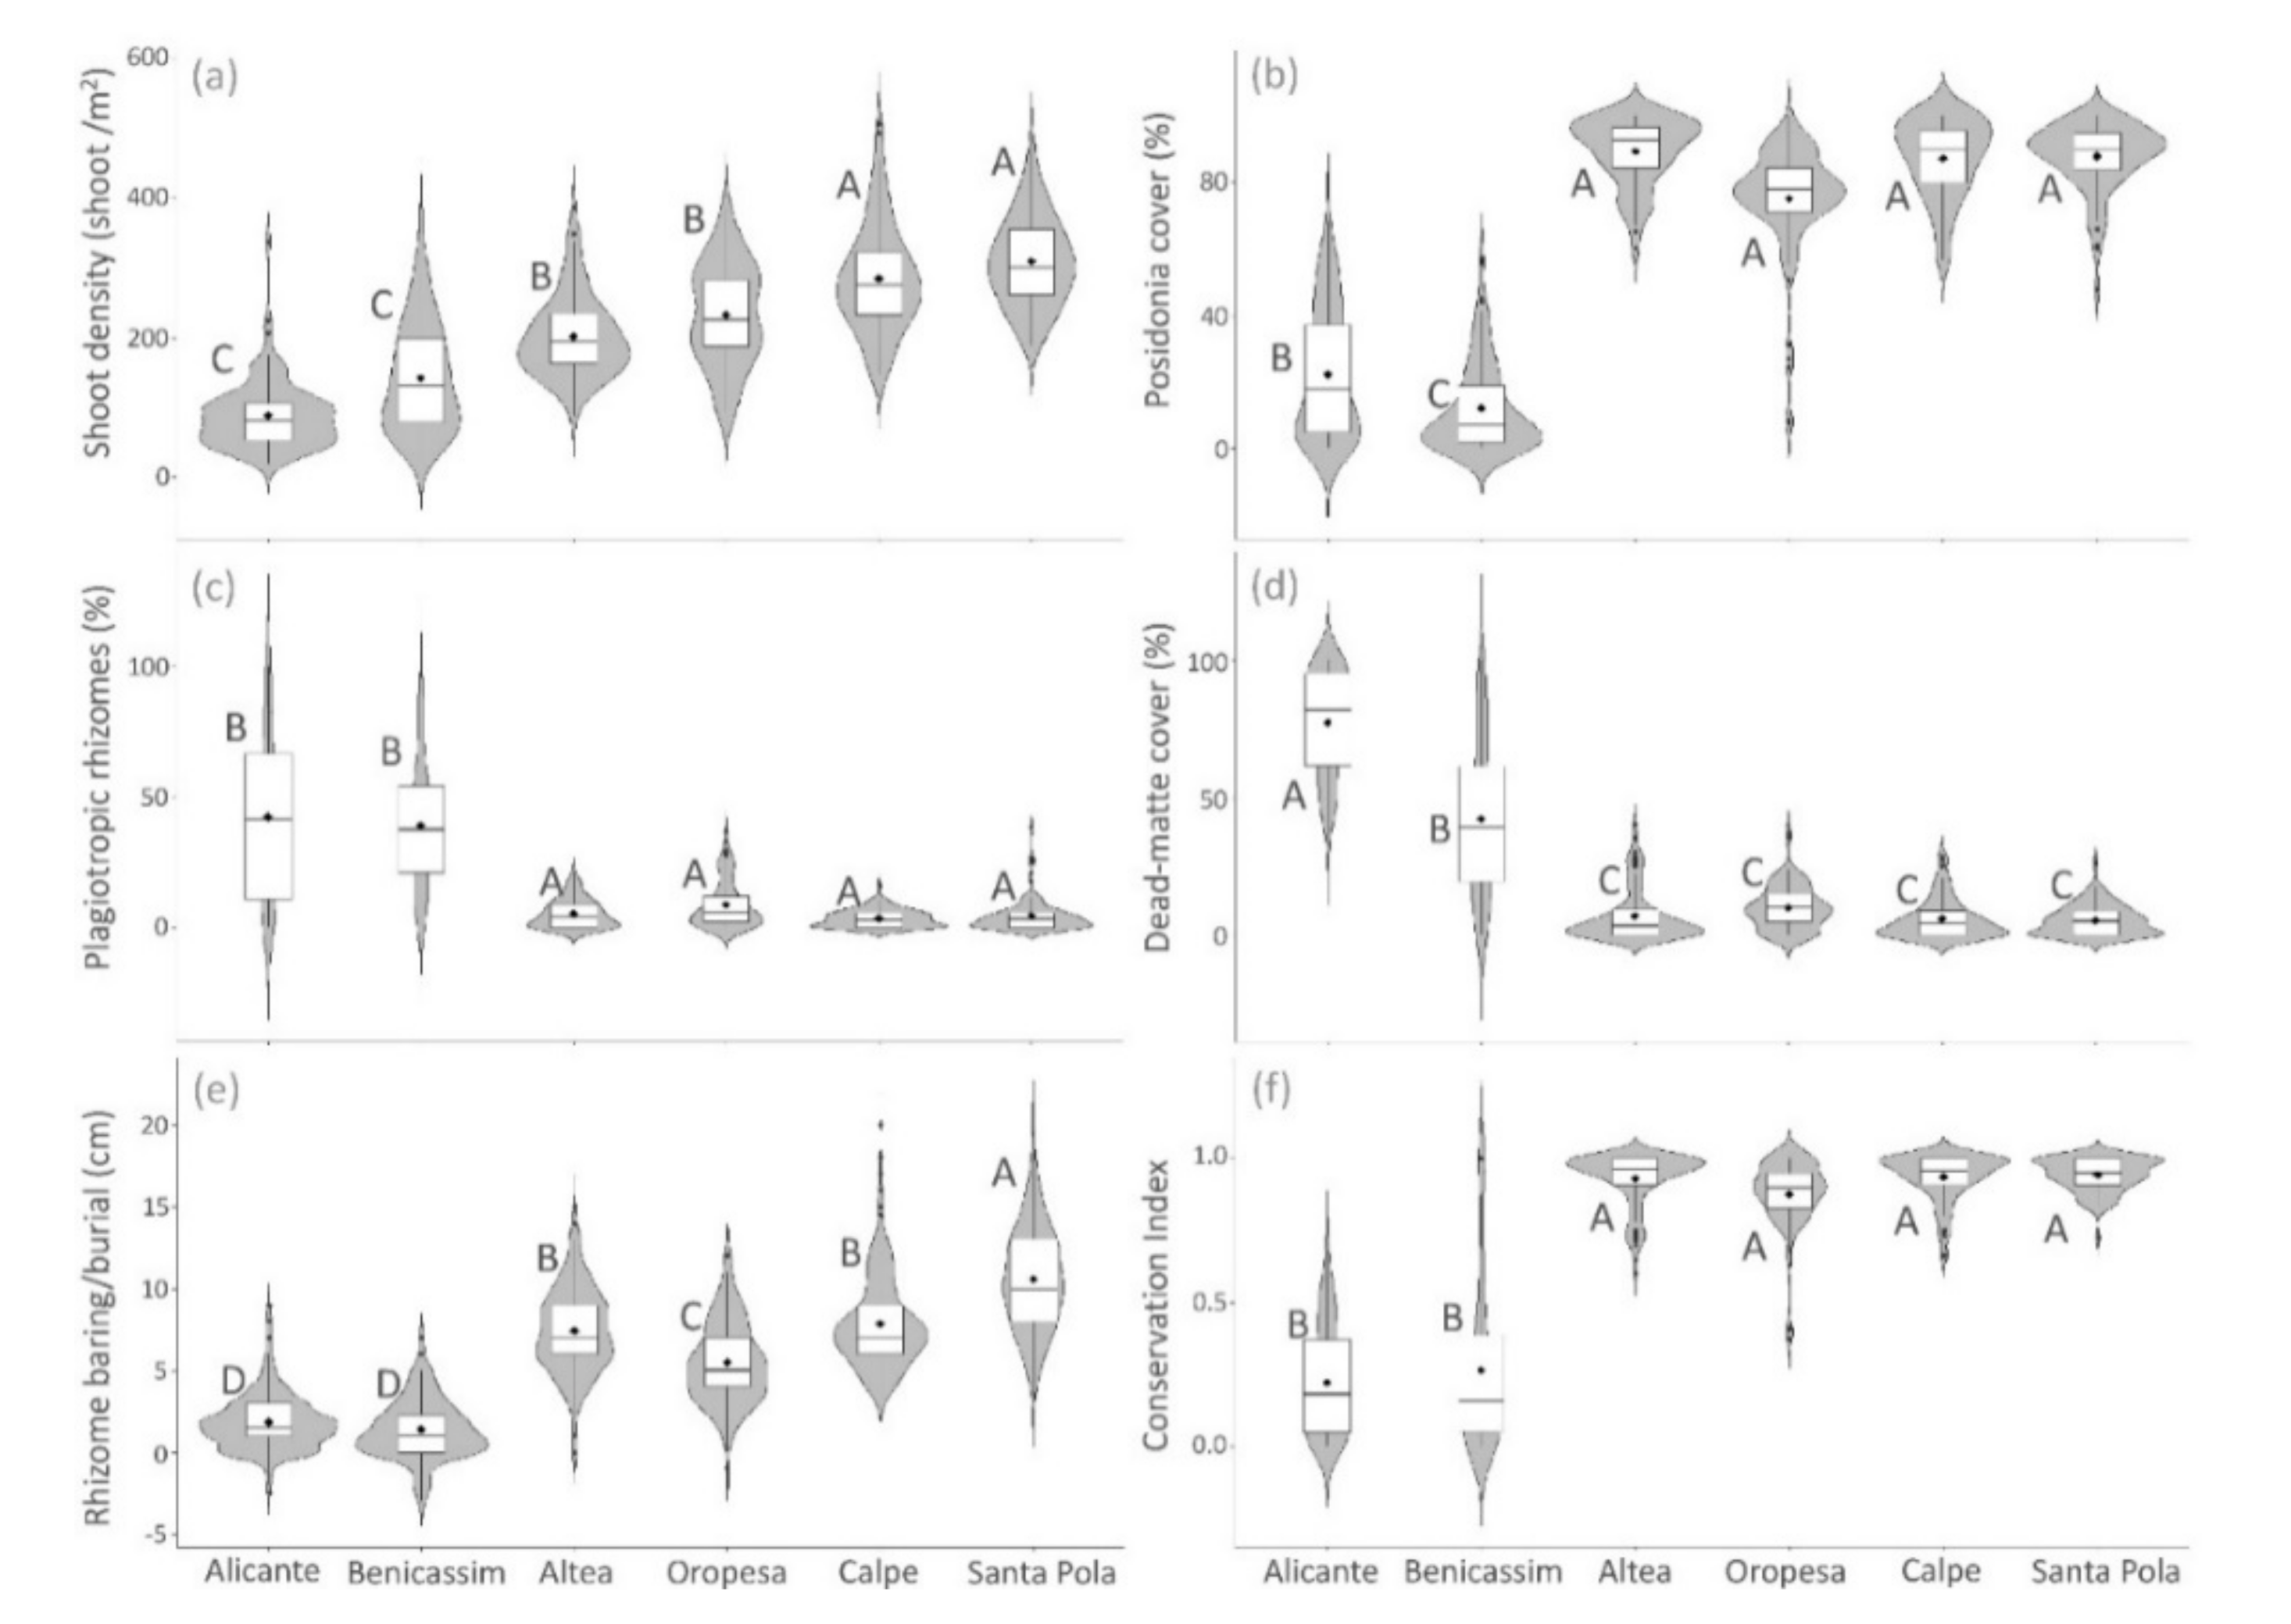
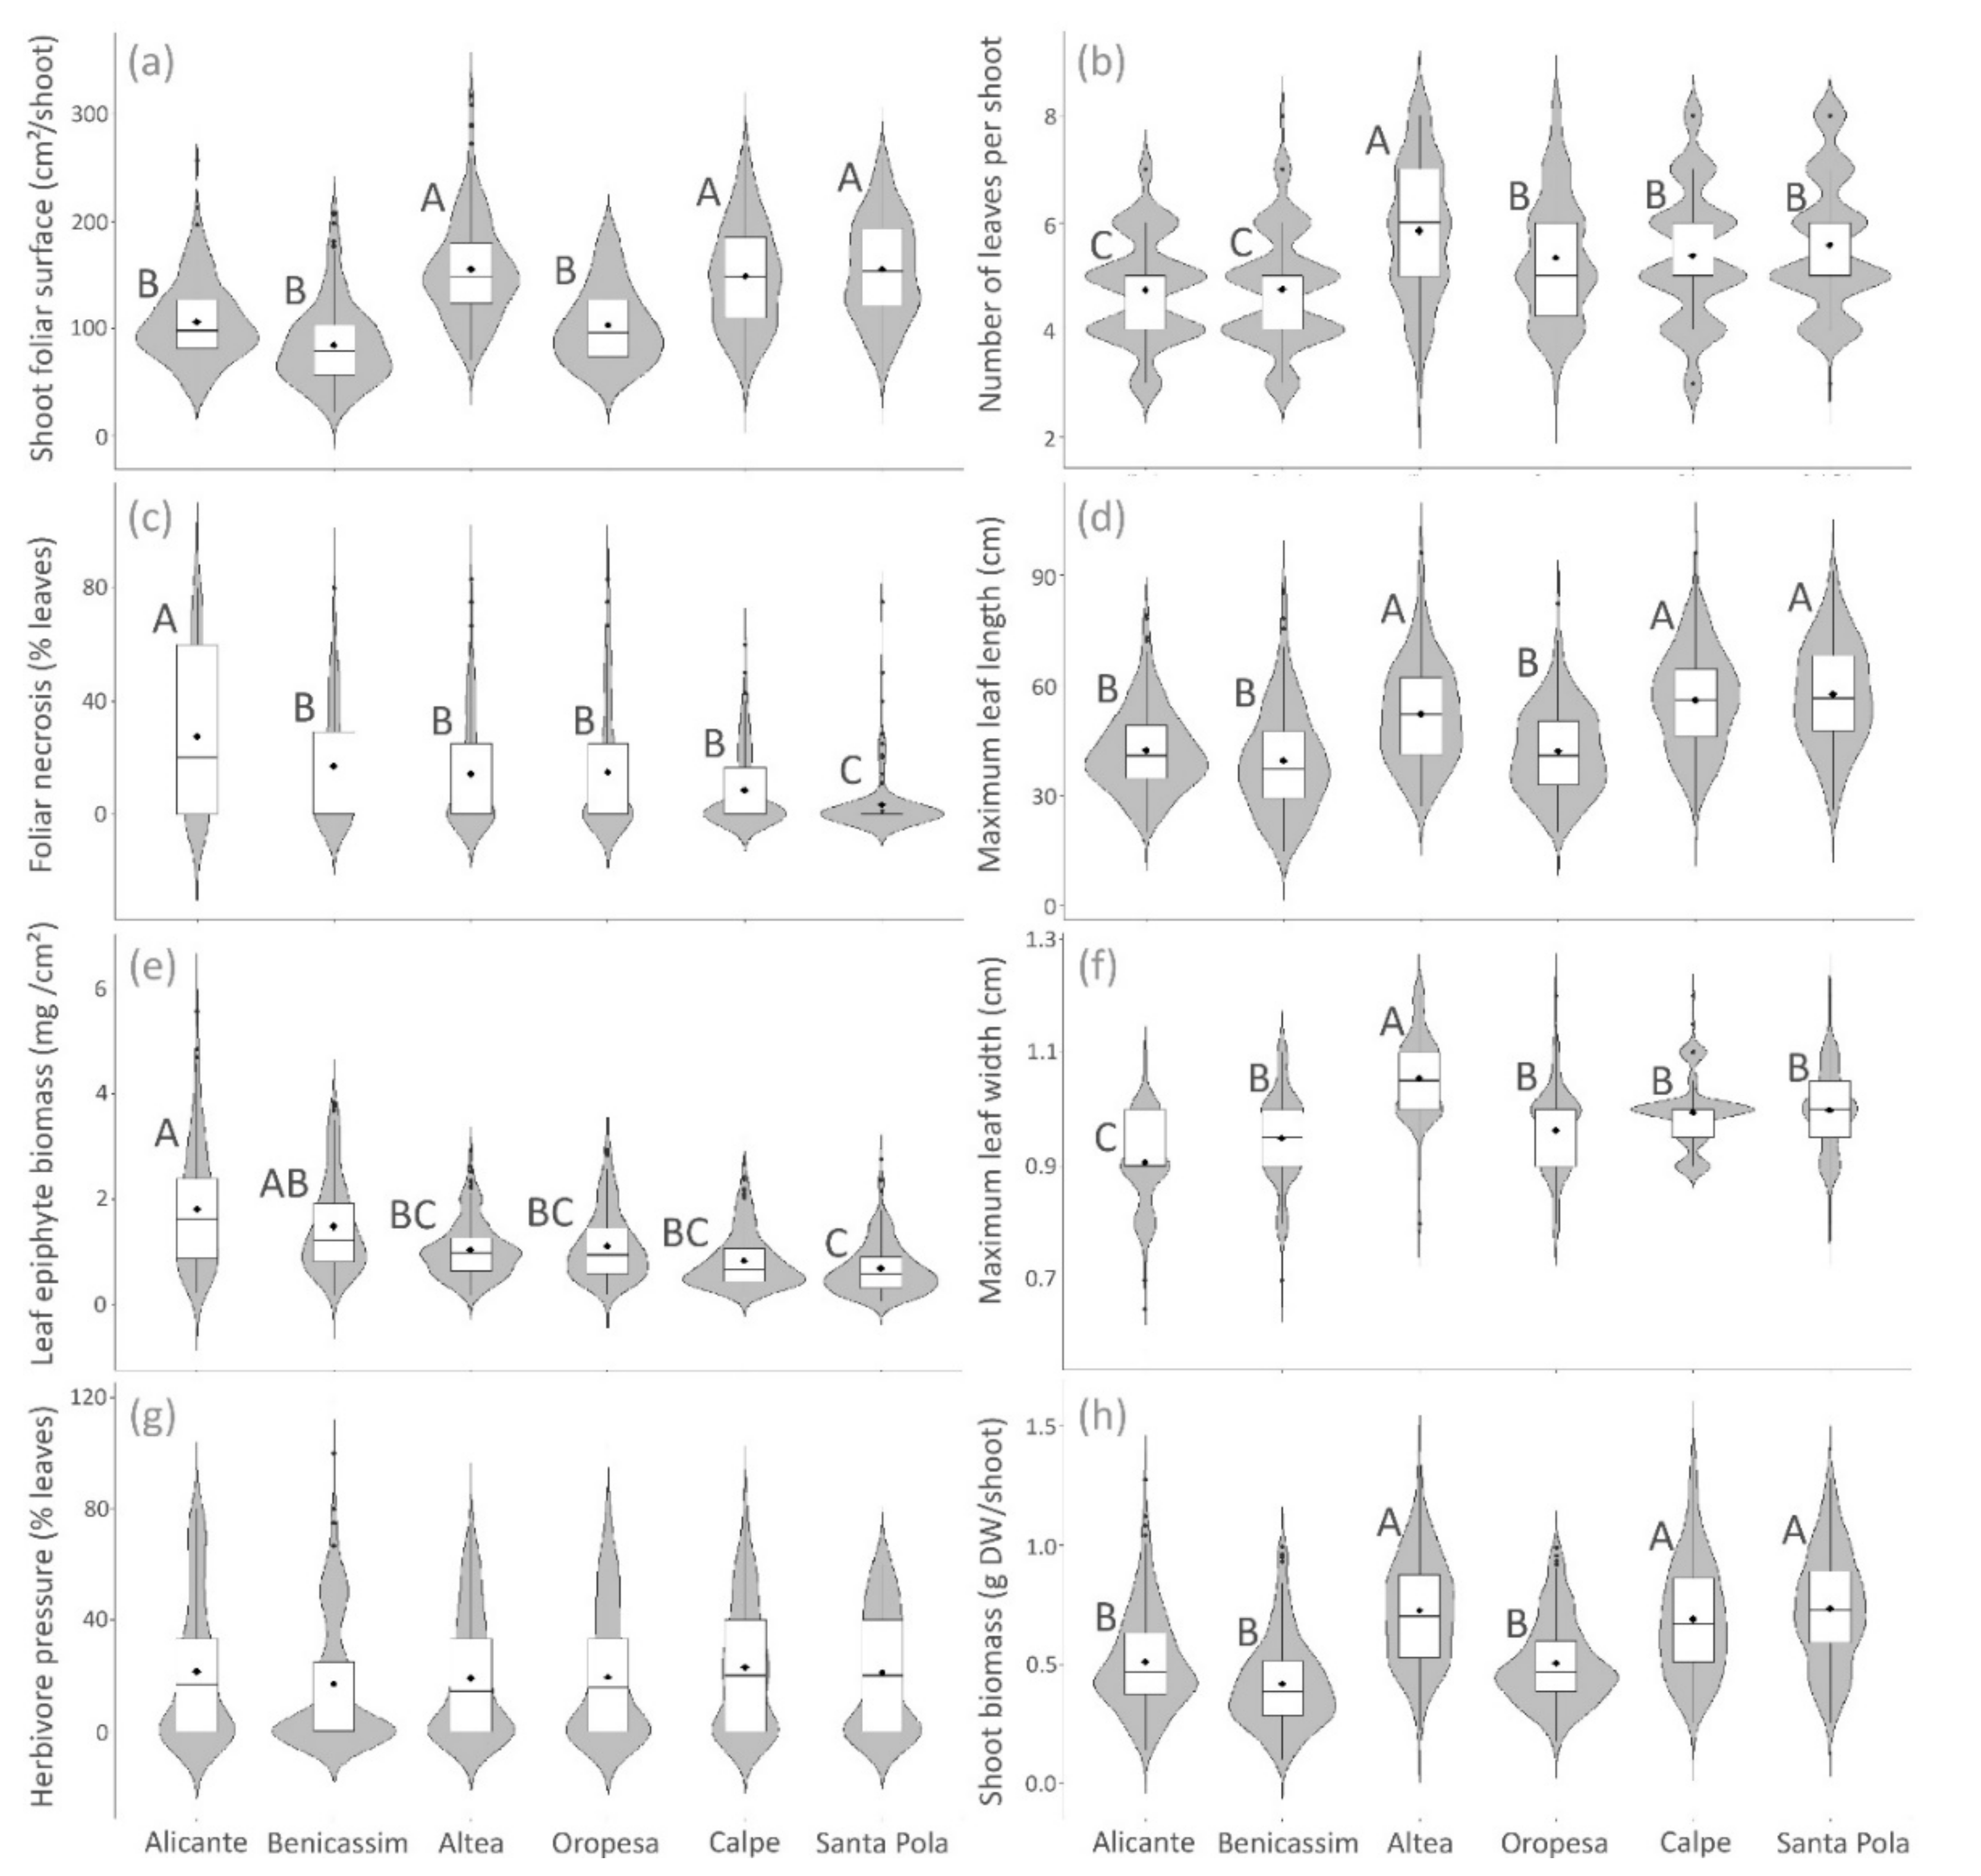
3.1. Spatial Variation of Posidonia Indicators

All structural indicators showed significant differences of means in all of the studied spatial scales (locality and site; Table 1). Average shoot density ranged between 88 and 310 shoots/m2 in the six studied localities (Figure 2a). Significant differences were detected among localities, with higher values coinciding with high ecological status quality (Santa Pola and Calpe). Significant differences were also detected between sampling sites (Table 1). Some outlier values were observed in Alicante, Altea, and Calpe.
The percentage of plagiotropic rhizomes was significantly higher in the most degraded localities (Alicante and Benicassim), for which the range of data was also broader (Figure 2b). In these two localities, shoots were also more significantly buried than those from the rest of the meadows (Figure 2c). Shoots from Santa Pola were significantly barer than those from the rest of localities, 8.2–12.2 cm above the sediment.
Posidonia cover significantly differed among localities (Figure 2b), with high and good status meadows (74–88%) showing higher values when compared to poor status meadows (11–22%). Dead-matte cover significantly differed among localities following the opposite pattern (Figure 2d), while conservation index (CI) showed a similar trend (Figure 2f).
Shoot morphological indicators, except herbivore pressure, showed significant differences for at least one of the spatial scales (locality and site; Table 1). Shoot foliar surface (Figure 3a), foliar biomass (Figure 3h) and maximum leaf length (Figure 3d) were significantly higher for high status localities (Santa Pola and Calpe) and one of the good status localities (Altea)—with average values of 149–156 cm2/shoot, 0.69–0.73 g DW/shoot, and 52.0–57.5 cm, respectively—and lowest in localities with a poor status (Benicassim and Alicante). Significant differences in this indicator were also detected at site scale (Table 1). Shoots from Altea meadow presented a significantly higher average number of leaves (5.9 leaves/shoot) and a maximum leaf width (1.05 cm) than the rest of the meadows (Figure 3b). The lowest values for these indicators were found for localities with a poor status (4.7–4.8 leaves/shoot and 0.91–0.95 cm, respectively).
Foliar necrosis (Figure 3c) and leaf epiphyte biomass (Figure 3e) were significantly higher in shoots from the Alicante meadow (23% and 1.84 mg/cm2), decreasing with the ecological status of the meadow, with lowest values found in the Santa Pola locality (3% and 0.68 mg/cm2). The percentage of herbivore marks on shoots did not showed significant differences among studied localities (Figure 3g).

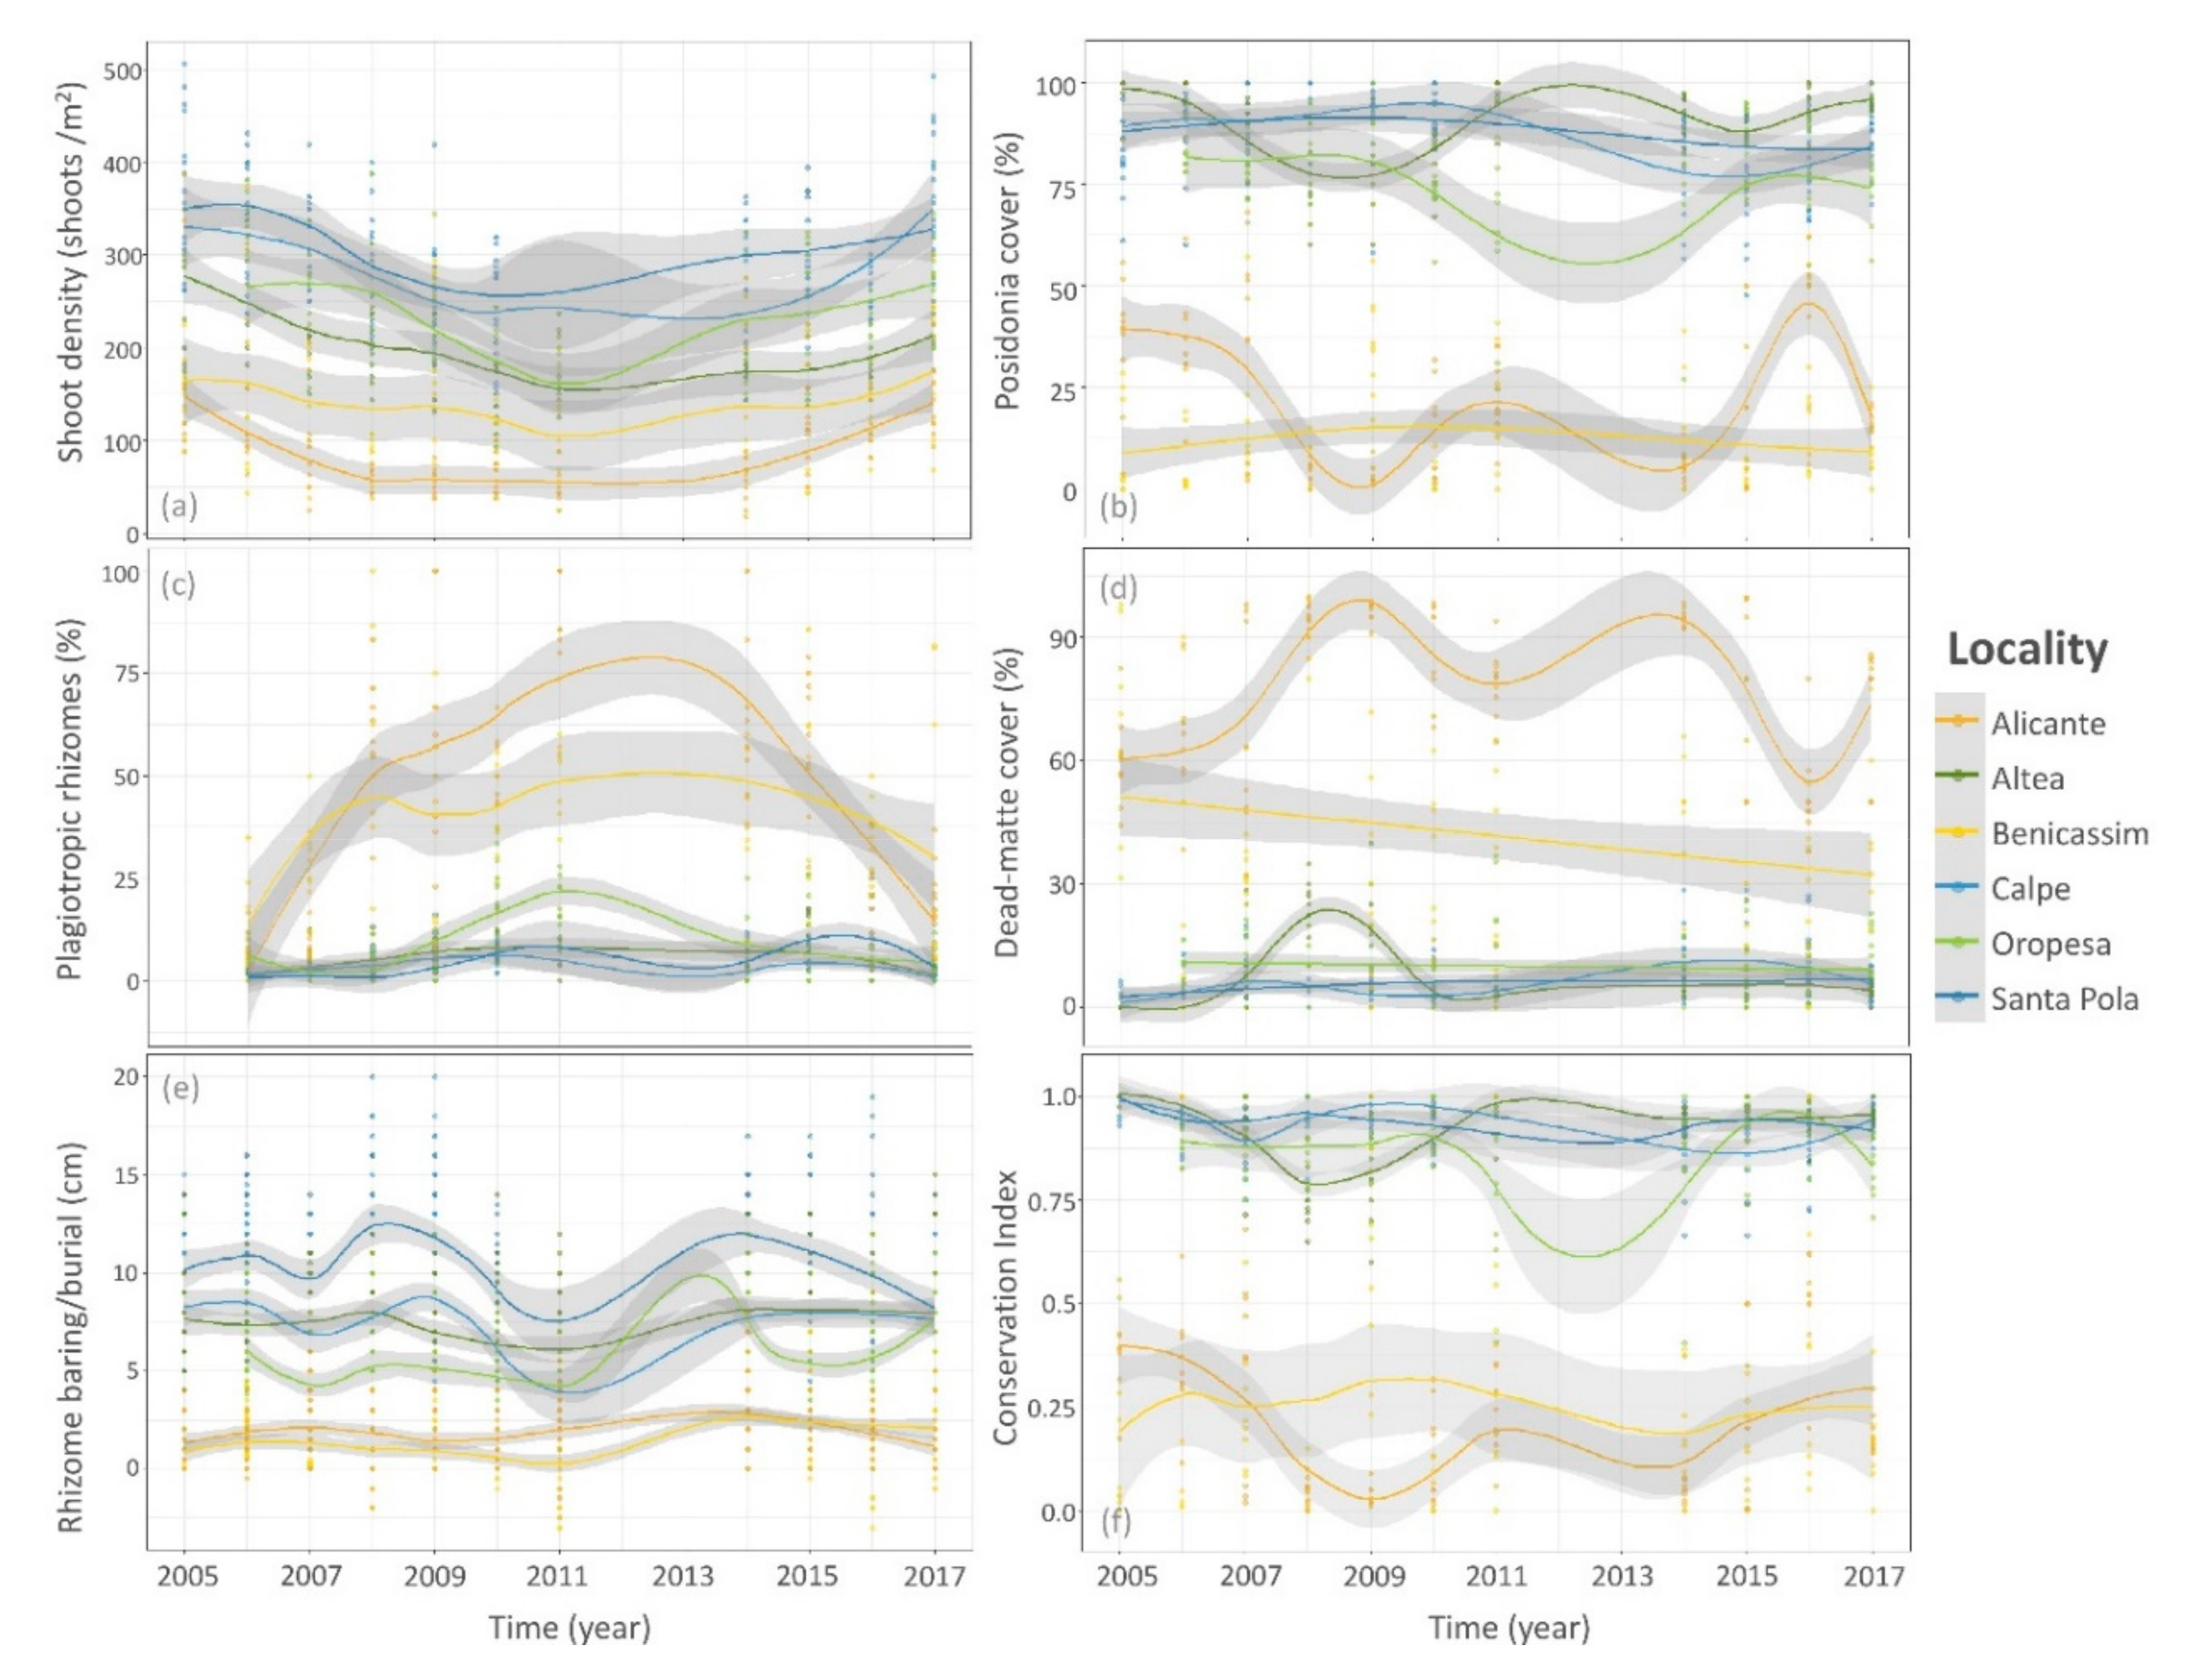
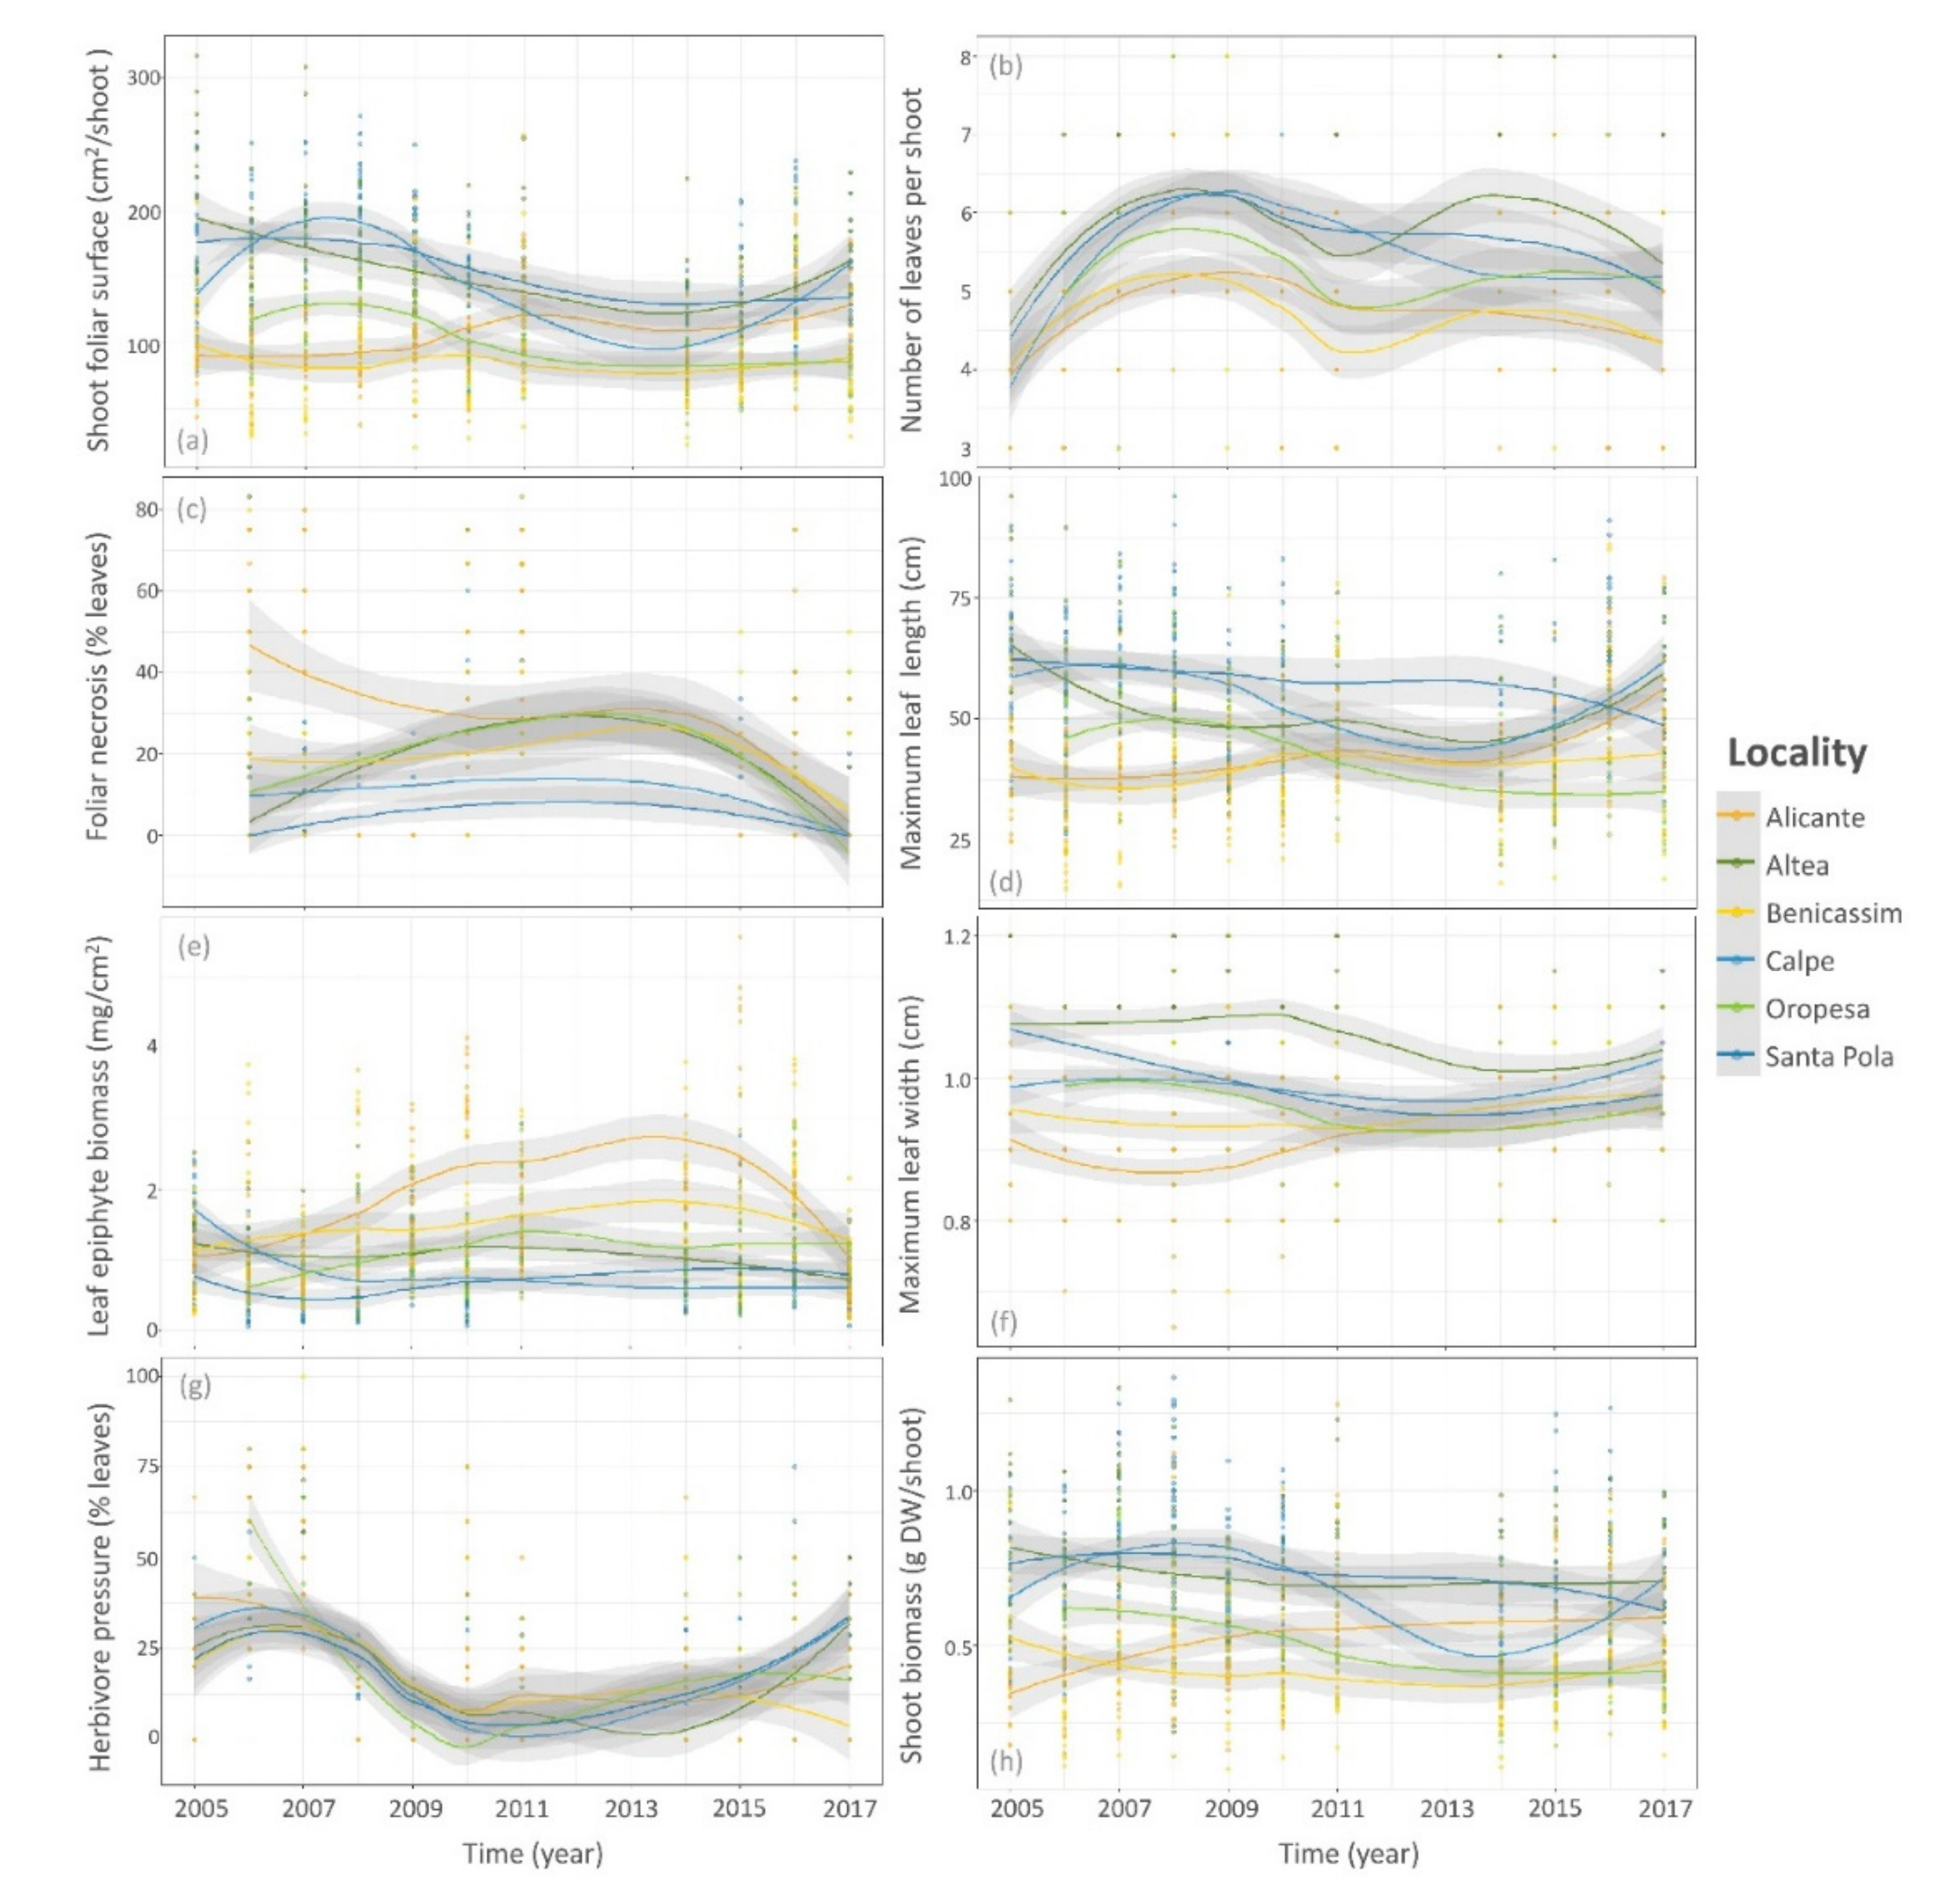
3.2. Temporal Trends of Posidonia Indicators

Significant differences of shoot density were detected with time (Table 1), although the temporal trend of this indicator was similar for all the studied localities (Figure 4a). A slight reduction from 2005 to 2011 was observed, followed by a reversed trend towards the initial density values in 2017. Localities with lower quality status showed lower values throughout the years. Posidonia and dead matte cover also showed significant differences with time (Table 1), but temporal trends were different between localities (Figure 4b). High quality status localities showed stable values of Posidonia cover (75–98%), while in localities with a good quality status this percentage fluctuated (57–98%). Dead matte cover values were steady at high and good quality meadows, showing a small increase in Altea in 2008 (Figure 4d). Posidonia and dead matte cover values also fluctuated (3–40 and 60–97%, respectively) in one of the poor quality status locality (Alicante). The temporal pattern of the Conservation Index was similar to the trends observed for P. oceanica cover (Figure 4f). The percentage of plagiotropic rhizomes significantly varied with time (Table 1), but not in the same way for all the localities (Figure 4c). Its average values slightly fluctuated in high and good quality status meadows (0–24%) when compared with the poor ones (9–68%). In one of the poor conservation status meadows (Alicante) an important increment was observed for this parameter from 2005 to 2012, followed by a reduction to initial values in 2017. Significant differences of rhizome baring were also detected with time (Table 1). Meadows with a poor status of conservation showed stable and lower values for this variable (0.7–3.5 cm), while the rest of the meadows showed higher and fluctuating values (3.5–12.4 cm; Figure 4e).
Regarding the morphological variables, all of them presented significant differences in their means throughout the studied temporal scale (Table 1). Temporal trends for average shoot foliar surface, shoot biomass, and maximum leaf length were similar (Figure 5a,h). In most of the high and good status meadows, these indicators showed higher average values during the first years of study, a decline during 2011–2014, and a subsequent recovery. In poor status meadows, these descriptors remained steady (Alicante) or showed a slight increment (Benicassim). The number of leaves per shoot showed a similar trend for all the studied localities (Figure 5b), with an increment in its average values in 2007–2009, a reduction in 2010–2012, another increment in 2014–2015 (except in Calpe and Benicassim), and a new reduction in the last year of study. The temporal trend for foliar necrosis was similar for most of the meadows, with an increment of this indicator in 2011–2014, except in high status localities, where this descriptor was lower and stable (Figure 5c). Leaf epiphyte biomass showed a similar trend, i.e., an increment during 2011–2015, in Alicante, one of the poor status meadows. In the rest of the localities, average values of this indicator were approximately steady (Figure 5e). During the first years of the study, herbivore pressure presented a similar trend for all the meadows: higher values were observed in 2006–2007, lower values during 2010–2014, and a subsequent recovery, except for poor quality localities (Figure 5g).

4. Discussion

In this study, we analyzed the variation of different indicators of a seagrass (Posidonia oceanica) associated to spatial and temporal scales. Spatial variability is mainly associated with meadow quality. High quality meadows are characterized by a high density, covering, and Conservation Index, low dead matte and plagiotropic rhizomes proportion, bigger shoots, and low foliar necrosis marks. However, some variability observed in the studied descriptors could not be explained by changes related to the meadow health. This is the case of the number of leaves per shoot and maximum leaf width, which do not correlate with the meadow status. This is also the case for the temporal variability of meadow cover in the northernmost stations (Oropesa, Benicasim). Therefore, this variability has to be explained by the high heterogeneity of these meadows with a patchiness of rocky bottoms and Posidonia. In fact, this type of fluctuation at small or medium spatial scales may not always be explained by anthropic influence [27]. In this case, the utilization of a sampling design with an adequate spatial replication is necessary, together with the use of less variable indicators as it is the Conservation Index [28].
We also detected spatial variability at a small scale (sites) for all of the structural indicators and for some of the morphological ones (leaf epiphyte biomass, shoot biomass, maximum leaf width, and length). This is in agreement with other studies, which have observed a high variability at small or medium spatial scales for Posidonia meadow cover and shoot density [29,30]. In order to detect and to be able to analyze this local variability, we recommend using a nested sampling design with spatial factors such as sites or zones.
A similar pattern of temporal evolution was observed in all the studied localities for some indicators (such as shoot density, number of leaves per shoot, foliar necrosis, and herbivore pressure), regardless of their environmental quality. It has been noted that indicators related with low meadow quality (such as proportion of plagiotropic rhizomes, foliar necrosis, or epiphyte biomass) increase for most of the stations until 2011–2014 and decrease until 2017. This similar pattern may indicate that not only local factors [13] are drivers of meadow quality, but importantly, some global factor may also be acting [6]. One of these drivers may be temperature, as some extreme warming events have been detected in the Mediterranean Sea from 2003–2008, causing mortality events and significant changes in Posidonia oceanica meadows during these and subsequent years [31]. Recovery of Posidonia morphological indicators can be fast, and related with the lack of effects of this kind of events, but also with the management measures taken, such as the Water Framework Directive, which aims to achieve an improvement of water quality. Recovery detected in Posidonia density may be explained also in this way, as its decay was not very strong in most of the localities. Moreover, no significant change in general meadows quality was observed between 2005 and 2017 which may confirm the reversion of seagrass decline that has been described by de los Santos et al. [15].
From this study, we may also infer the importance of selecting an adequate quantity and type of indicator to determine the ecological status of a meadow. Some descriptors can be easy to estimate, such as the meadow cover. However, as we have seen, they may also need to incorporate other information related with bottom structure or heterogeneity. Monitoring indicators must be specifically related with the driver or stressor we want to evaluate [32]. If general indicators are used to indicate a change, the cause of such change cannot be determined. For this reason, using specific indicators is highly recommendable [32]. Another option is to incorporate a suite of different indicators in order to provide strong evidence of an environmental change [3,17,18]. We do not recommend using few descriptors because it may lead to erroneous assumptions, while using many of indicators may be time and economically costly. A compromise between both situations should therefore be aimed for. For example, the present study selected metrics that implied a rapid processing, which reduces economic and time costs. A more complex analysis was discarded since it could be expensive and time-consuming and, sometimes, it may lead to analytical errors [33].
Moreover, we want to highlight the importance of this kind of study, in which a long time series of data is analyzed in order to estimate temporal trends. This is particularly necessary when studying slow-growing species, such as Posidonia oceanica, which are highly sensitive to perturbations but with a very slow recovery rate [34].

5. Conclusions

In this study, Posidonia oceanica meadows with a low conservation status were characterized by reduced density and covering values, elevated dead-matte covering, high proportion of plagiotropic rhizomes and small shoots with elevated epiphyte biomass and foliar necrosis marks. Spatial and temporal variability has been observed which may be related with natural variability but also with global factors such as temperature or water quality. No significant change in general meadows quality was observed between 2005 and 2017, which may indicate that there is no general decline of Posidonia meadows currently ongoing in the Mediterranean. Long monitoring series with an adequate spatial replication are necessary to detect trends on meadow ecological status.

Author Contributions

Conceptualization, Y.F.-T. and J.L.S.-L.; Methodology, Y.F.-T., J.L.S.-L. and A.A.R.-E.; Investigation, Y.F.-T., M.D.-V. and A.I.-M.; Data Curation, Y.F.-T.; Writing—Original Draft Preparation, Y.F.-T.; Writing—Review and Editing, all authors; Supervision, Project Administration and Funding Acquisition, A.A.R.-E. All authors have read and agreed to the published version of the manuscript.

Funding

This research was funded by the Conselleria d’Agricultura, Medi Ambient, Canvi Climàtic i Desenvolupament Rural of the Generalitat Valenciana.

Acknowledgments

We thank Vázquez, M., Rubio, E., Colilla, F., González-Correa, J.M., del Pilar, Y., de la Ossa, J.A., Múgica, Y., Luna, B.and Abellán, E. who assisted with field-data collection and samples processing. Lol Dahlet revised the English version of the document.

Conflicts of Interest

The authors declare no conflict of interest. The funders had no role in the design of the study; in the collection, analyses, or interpretation of data; in the writing of the manuscript, or in the decision to publish the results.

References

  1. Orth, R.J.; Carruthers, T.J.B.; Dennison, W.C.; Duarte, C.M.; Fourqurean, J.W.; Heck, K.L.; Hughes, A.R.; Kendrick, G.A.; Kenworthy, W.J.; Olyarnik, S.; et al. A Global Crisis for Seagrass Ecosystems. BioScience 2006, 56, 987–996. [Google Scholar] [CrossRef] [Green Version]
  2. Fourqurean, J.W.; Duarte, C.M.; Kennedy, H.; Marbà, N.; Holmer, M.; Mateo, M.A.; Apostolaki, E.T.; Kendrick, G.A.; Krause-Jensen, D.; McGlathery, K.J.; et al. Seagrass ecosystems as a globally significant carbon stock. Nat. Geosci. 2012, 5, 505–509. [Google Scholar] [CrossRef]
  3. Romero, J.; Martínez-Crego, B.; Alcoverro, T.; Pérez, M. A multivariate index based on the seagrass Posidonia oceanica (POMI) to assess ecological status of coastal waters under the Water Framework Directive (WFD). Mar. Poll. Bull. 2007, 55, 196–204. [Google Scholar] [CrossRef] [PubMed]
  4. Boudouresque, C.F.; Bernard, G.; Pergent, G.; Shili, A.; Verlaque, M. Regression of Mediterranean seagrasses caused by natural processes and anthropogenic disturbances and stress: A critical review. Bot. Mar. 2009, 52, 395–418. [Google Scholar] [CrossRef]
  5. Marbà, N.; Duarte, C.M.; Cebrian, J.; Gallegos, M.E.; Olesen, B.; Sand-Jensen, K. Growth and population dynamics of Posidonia oceanica on the Spanish Mediterranean coast: Elucidating seagrass decline. Mar. Ecol. Progr. Ser. 1996, 137, 203–213. [Google Scholar] [CrossRef]
  6. Jorda, G.; Marbà, N.; Duarte, C. Mediterranean seagrass vulnerable to regional climate warming. Nat. Clim. Chang. 2012, 2, 821–824. [Google Scholar] [CrossRef] [Green Version]
  7. Sánchez Lizaso, J.L.; Guillén Nieto, J.E.; Ramos Esplá, A.A. The regression of Posidonia oceanica meadow in El Campello (Spain). Rapp. Comm. Int. Mer Medit. 1990, 32, 7. [Google Scholar]
  8. Delgado, O.; Ruíz, J.M.; Pérez, M.; Romero, J.; Ballesteros, E. Effects of fish farming on seagrass (Posidonia oceanica) in a Mediterranean bay: Seagrass decline after organic loading cessation. Oceanol. Acta 1999, 22, 109–117. [Google Scholar] [CrossRef] [Green Version]
  9. Ruiz, J.M.; Romero, J. Effects of disturbance caused by coastal constructions on spatial structure, growth, dynamics and photosynthesis of the seagrass Posidonia oceanica. Mar. Poll. Bull. 2003, 46, 1523–1533. [Google Scholar] [CrossRef]
  10. Fernández Torquemada, Y.; González Correa, J.M.; Martínez, J.E.; Sánchez Lizaso, J.L. Evaluation of the effects produced by the construction and expansion of marinas on Posidonia oceanica (L.) Delile meadows. J. Coast. Res. 2005, 49, 94–99. [Google Scholar]
  11. González Correa, J.M.; Fernández Torquemada, Y.; Sánchez Lizaso, J.L. Long-term effect of beach replenishment on natural recovery of shallow Posidonia oceanica meadows. Est. Coast. Shelf Sci. 2008, 76, 834–844. [Google Scholar] [CrossRef]
  12. González Correa, J.M.; Fernández Torquemada, Y.; Sánchez Lizaso, J.L. Short-term effect of beach replenishment on a shallow Posidonia oceanica meadow. Mar. Environm. Res. 2009, 68, 143–150. [Google Scholar] [CrossRef] [PubMed]
  13. Guillen, J.E.; Sánchez Lizaso, J.L.; Jiménez, S.; Martínez, J.; Codina, A.; Montero, M.; Triviño, A.; Soler, G.; Zubcoff, J.J. Evolution of Posidonia oceanica seagrass meadows and its implications for management. J. Sea Res. 2013, 83, 65–71. [Google Scholar] [CrossRef] [Green Version]
  14. Roca, G.; Alcoverro, T.; De Torres, M.; Manzanera, M.; Martínez-Crego, B.; Bennett, S.; Farina, S.; Pérez, M.; Romero, J. Detecting water quality improvement along the Catalan coast (Spain) using stress-specific biochemical seagrass indicators. Ecol. Indic. 2015, 54, 161–170. [Google Scholar] [CrossRef]
  15. de-los-Santos, C.B.; Krause-Jensen, D.; Alcoverro, T.; Marbà, N.; Duarte, C.M.; van-Katwijk, M.M.; Pérez, M.; Romero, J.; Sánchez-Lizaso, J.L.; Roca, G.; et al. Recent trend reversal for declining European seagrass meadows. Nat. Commun. 2019, 10, 3356. [Google Scholar] [CrossRef] [Green Version]
  16. Casazza, G.; Lopez Royo, C.; Silvestri, C. Seagrasses as key coastal ecosystems: An overview of the recent EU WFD requirements and current applications. Biol. Mar. Med. 2006, 13, 189–193. [Google Scholar]
  17. Fernández-Torquemada, Y.; Díaz-Valdés, M.; Colilla, F.; Luna, B.; Sánchez-Lizaso, J.L.; Ramos-Esplá, A.A. Descriptors from Posidonia oceanica (L.) Delile meadows in coastal waters of Valencia, Spain, in the context of the EU Water Framework Directive. ICES J. Mar. Scien. 2008, 65, 1492–1497. [Google Scholar] [CrossRef] [Green Version]
  18. Lopez y Royo, C.; Pergent, G.; Pergent-Martini, C.; Casazza, G. Seagrass (Posidonia oceanica) monitoring in western Mediterranean: Implications for management and conservation. Environ. Monit. Assess. 2010, 171, 365–380. [Google Scholar] [CrossRef]
  19. Pergent-Martini, C.; Leoni, V.; Pasqualini, V.; Ardizzone, G.D.; Balestri, E.; Bedini, R.; Belluscio, A.; Belsher, T.; Borg, J.; Boudouresque, C.; et al. Descriptors of Posidonia oceanica meadows: Use and application. Ecol. Ind. 2005, 5, 213–230. [Google Scholar] [CrossRef]
  20. González-Correa, J.M.; Sánchez Lizaso, J.L.; Fernández Torquemada, Y.; Forcada, A. Long-term population dynamics in a healthy Posidonia oceanica meadow. Thalassas 2015, 31, 63–72. [Google Scholar]
  21. Hurlbert, S.H. Pseudoreplication and the design of ecological field experiments. Ecol. Monogr. 1984, 54, 187–211. [Google Scholar] [CrossRef] [Green Version]
  22. Moreno, D.; Aguilera, P.A.; Castro, H. Assessment of the conservation status of seagrass (Posidonia oceanica) meadows: Implications for monitoring strategy and the decision-making process. Biol. Conserv. 2001, 102, 325–332. [Google Scholar] [CrossRef]
  23. Underwood, A.J. Experiments in Ecology. Their Logical Design and Interpretation Using Analysis of Variance; Cambridge University Press: Cambridge, UK, 1997; p. 522. [Google Scholar]
  24. Fisher, R.; Wilson, S.K.; Sin, T.M.; Lee, A.C.; Langlois, T.J. A simple function for full-subsets multiple regression in ecology with R. Ecol. Evol. 2018, 8, 6104–6113. [Google Scholar] [CrossRef] [PubMed]
  25. Simpson, G.L. Modelling palaeoecological time series using generalised additive models. Front. Ecol. Evol. 2018, 6, 149. [Google Scholar] [CrossRef] [Green Version]
  26. Wood, S.N. Generalized Additive Models: An Introduction with R; CRC Press: Boca Raton, FL, USA, 2017; p. 496. [Google Scholar]
  27. R Core Team. R: A Language and Environment for Statistical Computing; R Foundation for Statistical Computing: Vienna, Austria, 2020; Available online: https://www.R-project.org/ (accessed on 10 July 2020).
  28. Leriche, A.; Boudouresque, C.F.; Gravez, V.; Mayot, N. Does coverage matter at mesoscale within a Posidonia oceanica seagrass meadow? C. R. Biol. 2006, 329, 733–741. [Google Scholar] [CrossRef] [PubMed]
  29. Panayotidis, P.; Boudouresque, C.F.; Marcot-Coqueugniot, J. Microstructure de l’herbier de Posidonia oceanica (Linnaeus) Delile. Bot. Mar. 1981, 24, 115–124. [Google Scholar] [CrossRef]
  30. Balestri, E.; Cinelli, F.; Lardicci, C. Spatial variation in Posidonia oceanica structural, morphological and dynamic features in a northwestern Mediterranean coastal area: A multi scale analysis. Mar. Ecol. Progr. Ser. 2003, 250, 51–60. [Google Scholar] [CrossRef]
  31. Darmaraki, S.; Somot, S.; Sevault, F.; Nabat, P.; Cabos Narvaez, W.D.; Cavicchia, L.; Djurdjevic, V.; Li, L.; Sannino, G.; Sein, D.V. Future evolution of Marine Heatwaves in the Mediterranean Sea. Clim. Dyn. 2019, 53, 1371–1392. [Google Scholar] [CrossRef] [Green Version]
  32. Roca, G.; Alcoverro, T.; Krause-Jensen, D.; Balsby, T.J.S.; van Katwijk, M.M.; Marba, N.; Santos, R.; Arthur, R.; Mascaró, O.; Fernández-Torquemada, Y.; et al. Response of seagrass indicators to shifts in environmental stressors: A global review and management synthesis. Ecol. Indic. 2016, 63, 310–323. [Google Scholar] [CrossRef] [Green Version]
  33. Krause-Jensen, D.; Quaresma, A.L.; Cunha, A.H.; Greve, T.M. How are seagrass distribution and abundance monitored? In European Seagrasses: An Introduction to Monitoring and Management; Borum, J., Duarte, C.M., Krause-Jensen, D., Greve, T.M., Eds.; EU Project Monitoring and Managing of European Seagrasses (M & MS): Copenhagen, Denmark, 2004; pp. 45–53. Available online: http://www.seagrasses.org (accessed on 2 March 2020).
  34. González-Correa, J.M.; Bayle, J.T.; Sánchez-Lizaso, J.L.; Valle, C.; Sánchez-Jerez, P.; Ruiz, J.M. Recovery of deep Posidonia oceanica meadows degraded by trawling. J. Exp. Mar. Biol. Ecol. 2005, 320, 65–76. [Google Scholar] [CrossRef]
Figure 1. Map of the coast of Valencian Community (eastern Spain) with the 6 sampling locations (blue circles correspond to a high ecological status, green crosses reflect good ecological status and orange squares stand for a moderate-poor ecological status).
Water 12 03235 g001
Figure 2. Violin plots for Posidonia meadow structural indicators at each of the six locations, including: (a) Shoot density, (b) Posidonia cover, (c) Plagiotropic rhizomes, (d) Dead-matte cover, (e) Rhizome baring/burial and (f) Conservation Index. Boxplots denote the first and third quartile, the minimum and maximum values are represented as the lower and upper part of the whiskers, the median is symbolized by a black horizontal line, and the mean by a black diamond. Outliers are represented as dot points. Different capital letters are statistically different at p < 0.05.
Water 12 03235 g002
Figure 3. Violin plots for Posidonia shoot morphological descriptors at each of the six locations, including: (a) Shoot foliar surface, (b) Number of leaves per shoot, (c) Foliar necrosis, (d) Maximum leaf length, (e) Leaf epiphyte biomass, (f) Maximum leaf width, (g) Herbivore pressure, and (h) Shoot biomass. Boxplots denote the first and third quartile, the minimum and maximum values are represented as the lower and upper part of the whiskers, the median is symbolized by a black horizontal line, and the mean by a black diamond. Outliers are represented as dot points. Different capital letters are statistically different at p < 0.05.
Water 12 03235 g003
Figure 4. Temporal trends in (a) Shoot density, (b) Posidonia cover, (c) Plagiotropic rhizomes, (d) Dead-matte cover, (e) Rhizome baring/burial and (f) Conservation Index. Different colors indicate different locality and meadow conservation quality (bluish = high, greenish = good, yellow-orange = poor). The shaded bands surrounding the estimated trends represent 95% confidence interval.
Water 12 03235 g004
Figure 5. Temporal trends in (a) Shoot foliar surface, (b) Number of leaves per shoot, (c) Foliar necrosis, (d) Maximum leaf length, (e) Leaf epiphyte biomass, (f) Maximum leaf width, (g) Herbivore pressure and, (h) Shoot biomass. Different colors indicate different locality and meadows conservation status (bluish = high, greenish = good, yellow-orange = poor). The shaded bands surrounding the estimated trends represent 95% confidence interval.
Water 12 03235 g005
Table 1. Summary of the results from the ANOVA applied to different Posidonia indicators for the six locations (* p-value < 0.05; ** p-value < 0.01; *** p-value < 0.001; when p-valor is not significant, its real value is shown).
Indicatorp-Valor
Locality
p-Valor Sitep-Valor
Time
Shoot density*********
Plagiotropic rhizomes*********
Rhizome baring/burial*********
Posidonia cover*********
Dead-matte cover*********
Conservation Index*********
Shoot foliar surface***0.2616***
Foliar necrosis***0.4591***
Leaf epiphyte biomass*********
Herbivore pressure0.05240.5117***
Number of leaves***0.0815***
Maximum leaf length********
Maximum leaf width*******
Shoot biomass*******
Publisher’s Note: MDPI stays neutral with regard to jurisdictional claims in published maps and institutional affiliations.

