Article

Evaluation of TMPA Satellite Precipitation in Driving VIC Hydrological Model over the Upper Yangtze River Basin

1
Joint Innovation Center for Modern Forestry Studies, College of Biology and the Environment, Nanjing Forestry University, Nanjing 210037, China
2
State Key Laboratory of Hydrology-Water Resources and Hydraulics Engineering, Hohai University, Nanjing 210098, China
3
Guangdong Province Key Laboratory for Climate Change and Natural Disaster Studies, School of Atmospheric Sciences, Sun Yat-sen University, Guangzhou 510275, China
4
Department of Physical Geography and Ecosystem Science, Lund University, SE-223 62 Lund, Sweden
*
Author to whom correspondence should be addressed.
Water 2020, 12(11), 3230; https://doi.org/10.3390/w12113230
Submission received: 26 September 2020 / Revised: 8 November 2020 / Accepted: 16 November 2020 / Published: 18 November 2020
(This article belongs to the Special Issue Hydrological Modeling in Water Cycle Processes)

Abstract

:
Although the Tropical Rainfall Measurement Mission (TRMM) has come to an end, the evaluation of TRMM satellite precipitation is still of great significance for the improvement of the Global Precipitation Measurement (GPM). In this paper, the hydrological utility of TRMM Multi-satellite Precipitation Analysis (TMPA) 3B42 RTV7/V7 precipitation products was evaluated using the variable infiltration capacity (VIC) hydrological model in the upper Yangtze River basin. The main results show that (1) TMPA 3B42V7 had a reliable performance in precipitation estimation compared with the gauged precipitation on both spatial and temporal scales over the upper Yangtze River basin. Although TMPA 3B42V7 slightly underestimated precipitation, TMPA 3B42RTV7 significantly overestimated precipitation at daily and monthly time scales; (2) the simulated runoff by the VIC hydrological model showed a high correlation with the gauged runoff and lower bias at daily and monthly time scales. The Nash–Sutcliffe coefficient of efficiency (NSCE) value was as high as 0.85, the relative bias (RB) was −6.36% and the correlation coefficient (CC) was 0.93 at the daily scale; (3) the accuracy of the 3B42RTV7-driven runoff simulation had been greatly improved by using the hydrological calibration parameters obtained from 3B42RTV7 compared with that of gauged precipitation. A lower RB (14.38% vs. 66.58%) and a higher CC (0.87 vs. 0.85) and NSCE (0.71 vs. −0.92) can be found at daily time scales when we use satellite data instead of gauged precipitation data to calibrate the VIC model. However, the performance of the 3B42V7-driven runoff simulation did not improve in the same operation accordingly. The cause might be that the 3B42V7 satellite products have been adjusted by gauged precipitation. This study suggests that it might be better to calibrate the parameters using satellite data in hydrological simulations, especially for unadjusted satellite data. This study is not only helpful for understanding the assessment of multi-satellite precipitation products in large-scale and complex areas in the upper reaches of the Yangtze River, but also can provide a reference for the hydrological utility of the satellite precipitation products in other river basins of the world.

1. Introduction

Precipitation is a fundamental part of the hydrological cycle, which is of great significance in meteorology, hydrology, ecology and other scientific research areas [1,2]. Precipitation is a complex natural phenomenon which is characterized by a significant variability both in time and space [3,4,5]. Therefore, accurate precipitation data are extremely important for water resource-related research. Currently, the main methods of obtaining precipitation data are the ground rain gauge, ground radar and space-borne passive radiometer [6,7,8]. Although the rain gauge is considered to be the standard for measuring precipitation, the gauge networks are unfortunately sparse or nonexistent in many remote areas of the world. Remote sensing can break through this limitation by directly providing high spatial and temporal resolution of precipitation in large areas. Satellite-based precipitation products will hopefully be an alternative to ground-based precipitation estimates for the current and foreseeable future [9].
In recent years, more and more various satellite precipitation products with different temporal and spatial resolutions have been easily obtained [8,10,11]. Among them, the Tropical Rainfall Measurement Mission (TRMM) is a widely used satellite precipitation product and large numbers of researchers have evaluated the quality of TRMM Multi-satellite Precipitation Analysis (TMPA) estimates by comparing it with other satellite productions and the ground rain gauge of various regions around the world [9,12,13,14]. For example, Mehran et al. [15] proved that CPC MORPHing (CMORPH) showed a better precipitation detection skill, while the TMPA satellite data led to a relatively smaller level of false alarms above the heavy precipitation thresholds. Dinku et al. [16] demonstrated that the TMPA productions performed slightly better agreement both at lower and higher rainfall accumulations than the Global Precipitation Climatology Project (GPCP) and the National Oceanographic and Atmospheric Administration Climate Prediction Center (NOAA-CPC) merged analysis (CMAP). Naumann et al. [17] conducted a comparative analysis between the TMPA and the Global Precipitation Climatology Centre (GPCC) datasets and showed that for reliable drought monitoring in Africa particularly, the TMPA datasets with higher spatial resolution were more reliable than the GPCC datasets.
The TMPA 3B42 dataset consists of two standard products: the near-real-time version (3B42RT) and the post-real-time version (3B42) [18]. The post-real-time product (3B42) is released 10–15 days after each month, covering the global latitude zone from 60° N to 60° S, and the near-real-time product (3B42 RT) is released approximately 9 h after real time with the coverage of the latitude belt from 50° N to 50° S [19]. Many studies have reported comparisons between the two versions [20,21]. For example, Zhu et al. [18] reported that the post-real-time TMPA 3B42V7 overestimates precipitation, while the near-real-time TMPA 3B42RTV7 underestimates the precipitation from the positive/negative sign of bias in the Huifa River basin in Northeast China. Tang et al. [22] found that TMPA 3B42V7 had slightly better performance in the precipitation estimation than TMPA 3B42RTV7 at both daily and monthly scales; meanwhile, both of these two productions overestimated the precipitation when the value of precipitation was over 30 mm/day or below 1 mm/day. Hao et al. [23] found that TMPA 3B42V7 performs better than TMPA 3B42RTV7, while TMPA 3B42RTV7 can roughly capture the spatial precipitation pattern but overestimation exists throughout the upper Yellow River and Yangtze River basins.
Although the TRMM has come to an end, the observation of hurricanes and precipitation from space will not end after TRMM. The Global Precipitation Measurement (GPM) mission was launched in February 2014 to improve upon the TRMM project and the development of GPM algorithms to improve precipitation retrievals can be addressed through the lessons learned from the former TRMM [20,24]. Both TMPA and the Integrated Multi-satellite Retrievals for GPM (IMERG) use a constellation of passive microwave satellites, and within the general umbrella groups of “sounder” and “imager”, the inputs are much the same. At the back end of the multi-satellite algorithms, both TMPA and IMERG use the same scheme for combining satellite data with the GPCC analysis, although IMERG uses the GPCC Final analysis up through 2018, which tends to be more accurate than the GPCC Monitoring analysis that TMPA used for the last ~nine years [25]. Up to now, due to the long time series and advanced algorithm of TRMM, there is still a lot of research centering on TRMM [26,27], and the accuracy estimates of the GPM precipitation products are usually compared with the TRMM products [20]. For example, Liu et al. [28] reported that the GPM showed better performance in precipitation estimation than TMPA, but in terms of precipitation detection, TMPA showed a lower false alarm ratio than GPM in the Yellow River basin. Tan et al. [29] found that GPM had better performance in the characterization of spatial precipitation variability and precipitation detection capability compared to the TMPA products over Singapore. In addition, both of them overestimated moderate precipitation events (1–20 mm/day) while underestimating light (0.1–1 mm/day) and heavy (>20 mm/day) precipitation events. Guo et al. [30] reported that both GPM and TMPA 3B42V7 show similar performances. GPM showed a favorable performance in capturing the spatial patterns of precipitation compared with TMPA 3B42V7. However, both of them demonstrate poor performance in winter with the largest relative bias and smallest Pearson linear correlation coefficient. Tang et al. [31] also found that the GPM showed appreciably better performance than TMPA 3B42V7 at both daily time scales and spatial scales, especially at the mid- and high latitudes, as well as relatively dry climate regions. Therefore, the evaluation of TRMM satellite precipitation is still of great significance for the improvement of the GPM.
There is much work that has been carried out to evaluate the suitability of satellite products as input to hydrological models in different basins around the world [32]. For example, Hughes et al. [33] reported that TMPA 3B42 V7 has a good hydrological ability to detect intense tropical cyclones precipitation at the Okavango River basin in Africa. Su et al. [34] reported that the simulated flows driven by TMPA had good consistency in the reproduction of seasonal and interannual streamflow variability at the La Plata Basin. Zhang et al. [20] used the variable infiltration capacity (VIC) and Xin’anjiang (XAJ) hydrological models to compare TMPA’s and GPM’s hydrologic performance in a humid river basin of China. Tobin and Bennett [35] estimated the hydrological simulation performance of gauge observations and 3B42 data in South Texas and Northern Mexico. Jiang et al. [36] reported that the three widely used satellite precipitation products (TMPA 3B42V6, TMPA 3B42RT and CMORPH) showed a better skill in streamflow simulations through the test of the XAJ model within the Mishui basin, South China. Xue et al. [27] selected the Coupled Routing and Excess Storage (CREST) hydrologic model to explore the improvements of the TMPA productions in the mountainous Wangchu basin of Bhutan, which found that TMPA 3B42 proved a significant improvement in terms of potential hydrological utility. However, it is still insufficient to assess the capability and limitation of TMPA 3B42V7 and 3B42RT as input to a hydrological model for streamflow simulation in a large river basin. Usually, previous works focused on the model parameters obtained from the gauged precipitation, and few researchers tried to calibrate model parameters based on the satellite products. Tang et al. [22] used TMPA 3B42RTV7/V7 and gauged-based observations for CREST model parameters gaining and then used these parameters for runoff simulation in the Ganjiang River basin. The comparison results demonstrated that the TMPA-driven runoff simulation using parameters obtained from TMPA had better performance than that using parameters obtained from gauged-based observations. Wang et al. [37] drew similar conclusions when they conducted a similar simulation study with the VIC model in the source region of the Yellow River.
The upper reaches of the Yangtze River occupy more than 40% of the area of the whole Yangtze River basin and have a large area with a complicated topography and climate. The change in streamflow in the upper reaches of the Yangtze River directly affects water security in the middle and lower reaches. Most of the existing studies use gauged precipitation data to drive the hydrological models to obtain the hydrological model parameters and then apply them to the hydrological simulation using satellite precipitation products [32]. There is a lack of comparative studies using satellite precipitation products to drive hydrological models to obtain parameters for the simulation. Therefore, it is of great practical significance to evaluate the hydrological performance of TMPA 3B42V7 and 3B42RTV7 satellite precipitation products in a large river basin [19,38]. The objectives are to (1) assess the capability and limitation of TMPA satellite-based precipitation products as input to a hydrological model for streamflow simulation in a large watershed with complex terrain in the upper Yangtze reach; and (2) evaluate the hydrological performance of TMPA 3B42RTV7 and 3B42V7 using the VIC hydrologic model driven by the parameters obtained from gauged and satellite precipitation, respectively. This study is not only helpful for understanding the assessment of multi-satellite precipitation products in large-scale and complex areas in the upper reaches of the Yangtze River, but also can provide a reference for the hydrological utility of satellite precipitation products in other river basins of the world.

2. Materials and Methods
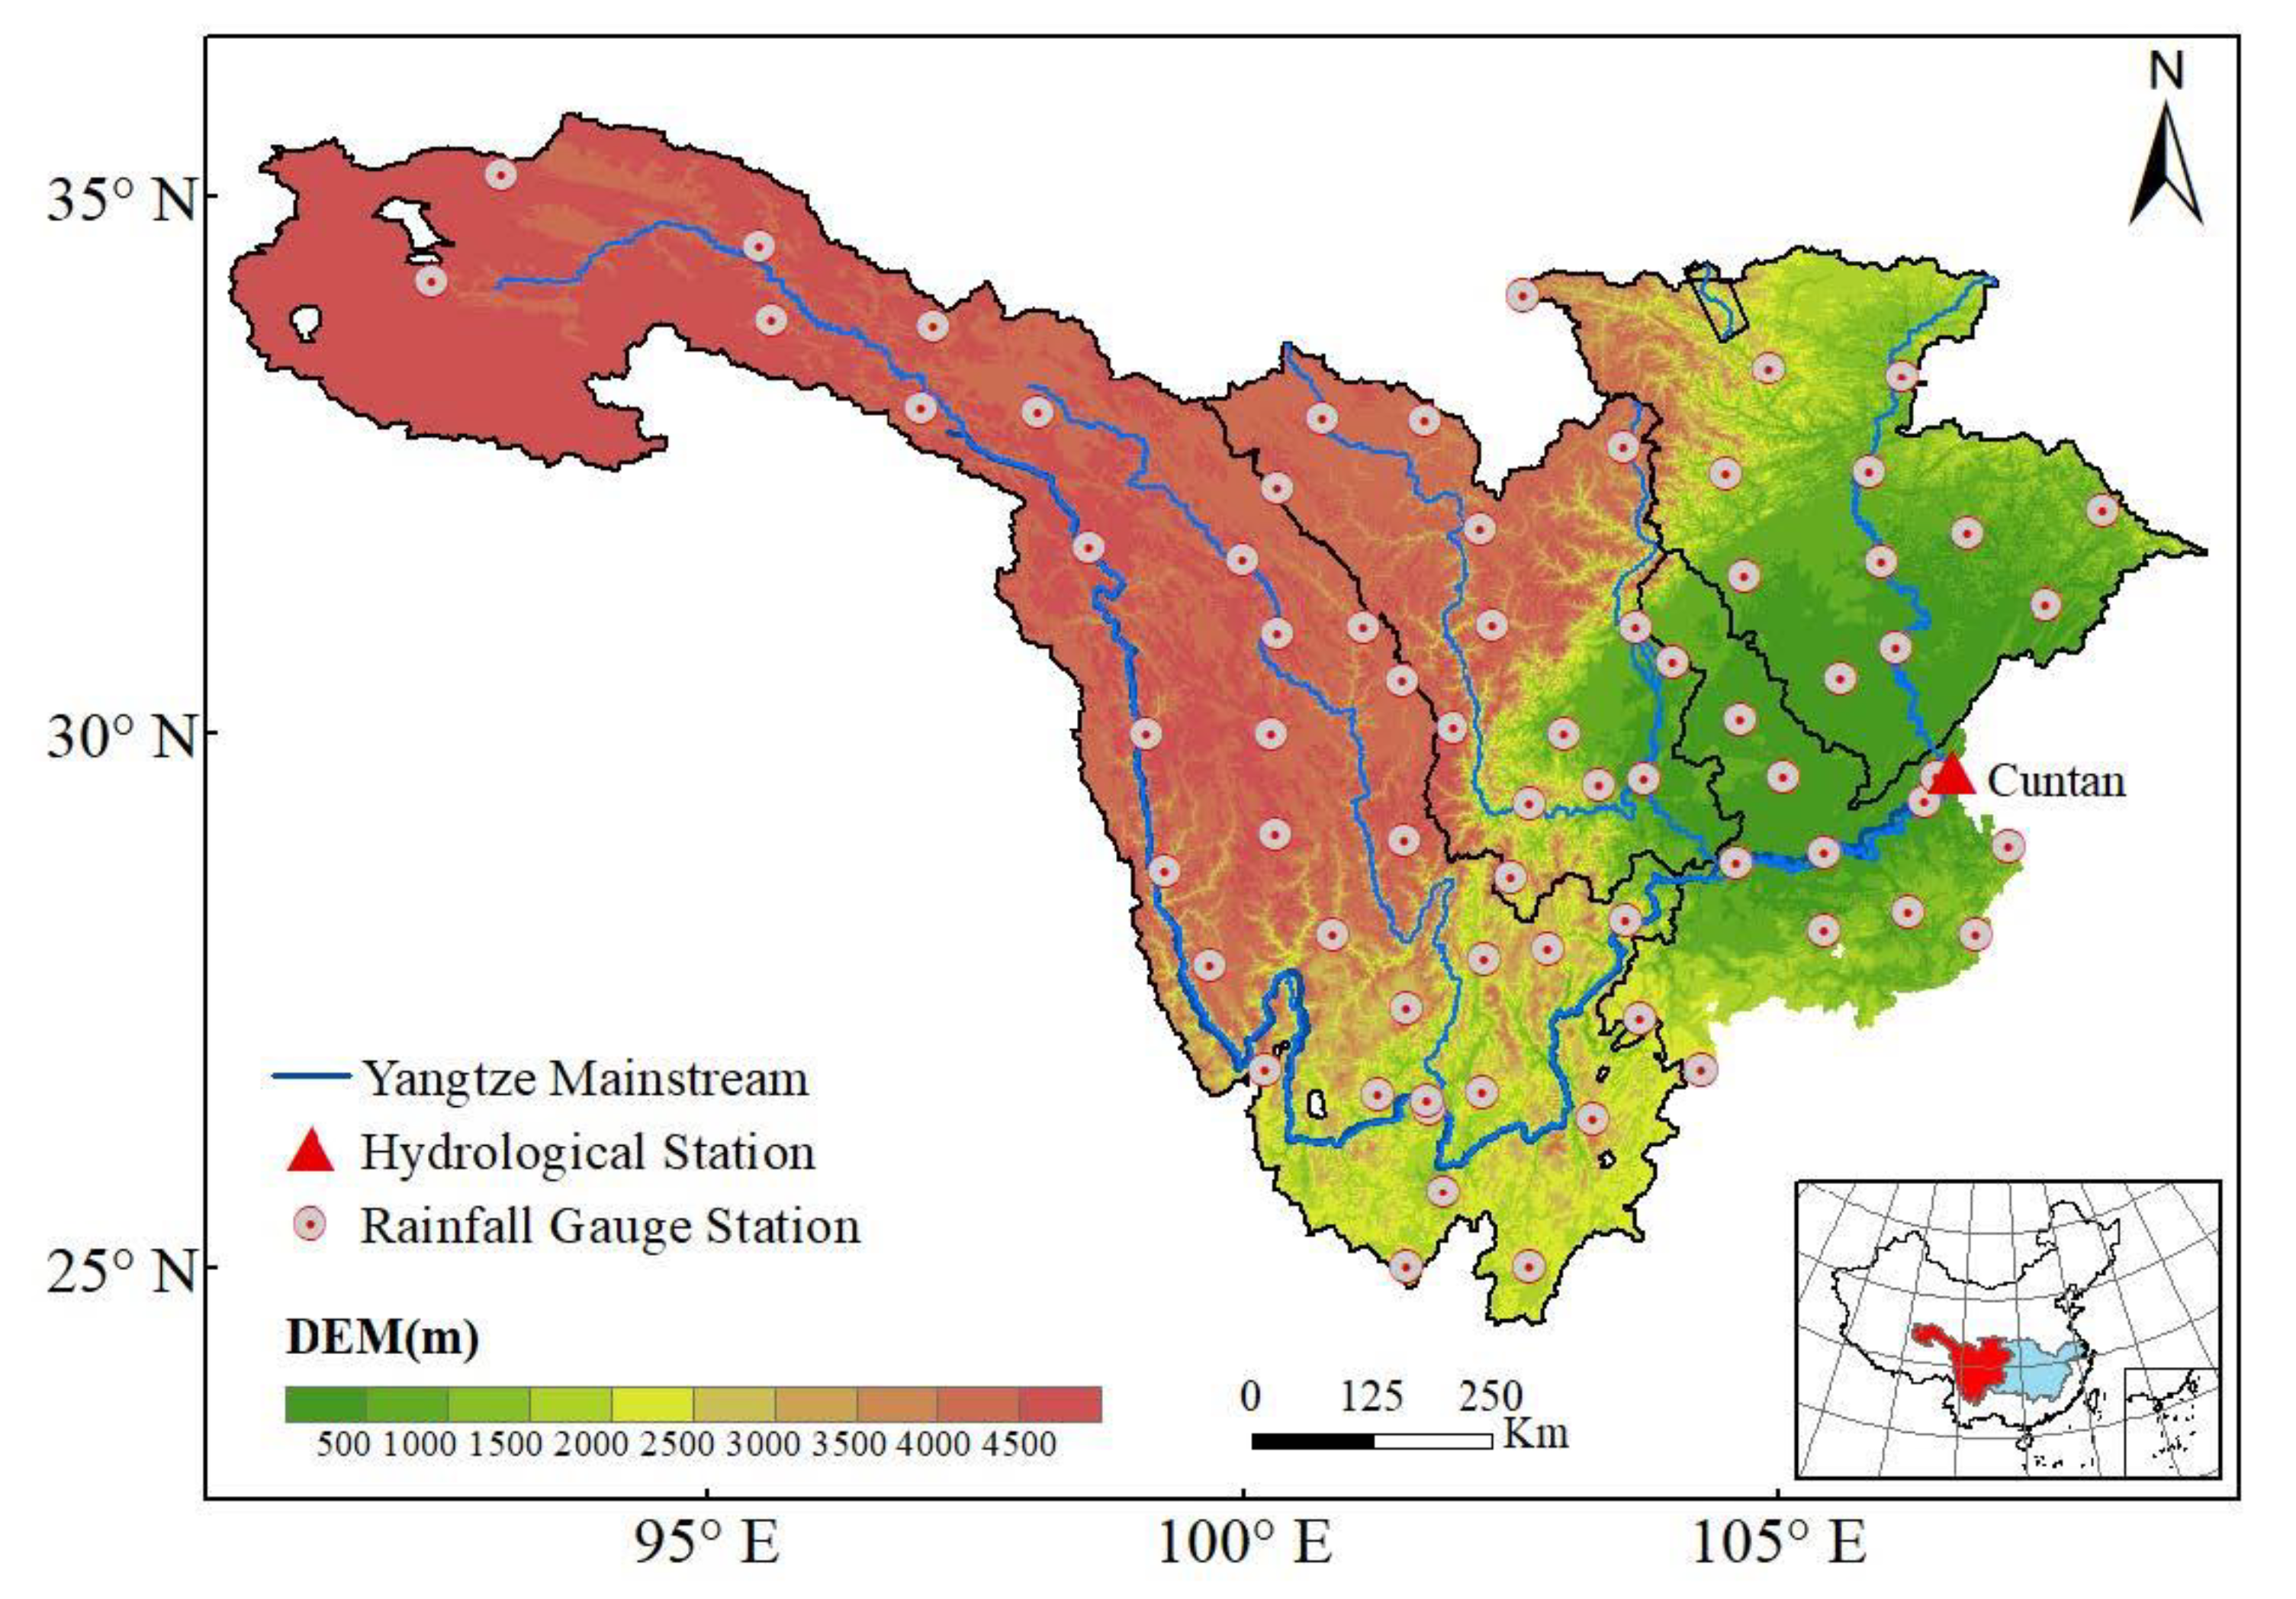
2.1. Study Area

The Yangtze River is the longest in China [39]. It originates from “the roof of the world”, the Qinghai–Tibet Plateau. Its mainstream flows from west to east through 11 provinces [40]. The river is about 6300 km long and the basin lies in southern China with an area of 1,800,000 km2 that accounts for almost one fifth of China’s territory. The total amount of water resources in the Yangtze River basin is 976 km3 [40]. The importance of the Yangtze River lies not only in its geographical location, large scale and complex landforms, but also in the role that the river plays in the regional water cycle, energy balance, climate change and ecosystems, as well as in China’s economic and social development [41,42].
The upper reaches of the Yangtze River occupy more than 40% of the area of the whole Yangtze River basin. The climate and the underlying surface conditions are complex, and the problems related to water resources are prominent in the upper Yangtze River basin.

2.2. Data

The TMPA (Tropical Rainfall Measuring Mission (TRMM) Multi-satellite Precipitation Analysis) precipitation estimates are based primarily on a combination of microwave (MW) and merging infrared (IR) estimates from multiple satellites [19]. The Tropical Rainfall Measuring Mission (TRMM) is a satellite launched by NASA in November 1997 [38]. It has provided a wealth of scientific information for the structure, evolution and other characteristics of tropical precipitation systems. Its unique combination of precipitation measurement instruments had become the premier satellite platform for tropical precipitation diagnosis [38,43]. The TMPA 3B42 dataset is available in two versions: a research-quality product (3B42) released 10–15 days after each month, covering the global latitude zone from 60° N to 60° S, and a near-real-time product (3B42 RT), which is released approximately 9 h after real time with the coverage of the latitude belt from 50° N to 50° S. The main difference between the two versions is the use of the rain gauge data for bias reduction, which is unavailable in real time [19,44].
The TMPA 3B42V7 and 3B42RTV7 datasets from 2003 to 2010 used in this study were obtained from the National Aeronautics and Space Administration (NASA) website (http://trmm.gsfc.nasa.gov/). They have a high temporal (3 h) and spatial (0.25° × 0.25°) resolution. The gauged precipitation data for 2003–2010 were recorded by the rainfall gauges distributed within the upper Yangtze River basin. The gauged precipitation data were interpolated by the Kriging interpolation method by ArcGIS 10.5 (Esri China, Hong Kong, China). The runoff data used for validating the simulation results were obtained from the Cuntan hydrologic station located at the basin (Figure 1).

2.3. Hydrological Model

VIC is a semi-distributed and macro-grid hydrological model that solves the complete balance of water and energy, originally developed by Liang Xu of the University of Washington, and then applied in various forms in most major river basins in the world [45]. The VIC model shares several basic characteristics with the other land surface models (LSMs) that are commonly coupled to global circulation models (GCMs), making the model applicable as a fully coupled water and energy balance system [45].
VIC-2L is comprised of a simple two-layer characterization of the soil column and uses an aerodynamic representation of the latent and sensible heat fluxes at the land surface based on a simplified soil-vegetation-atmosphere transfer schemes (SVATS)-type representation of vegetation cover. The upper layer is characterized by the usual VIC spatial distribution of soil moisture capacities, and the lower layer is spatially lumped and uses the Arno drainage term [45,46]. The VIC-3L model separates a thin layer (usually 0.1 m) from the top of the VIC-2L model, which allows soil moisture to diffuse between the soil layers, and considers bare soil and different vegetation coverage types in the cell grid [47]. Evaporation and transpiration are parameterized by a Penman–Monteith formulation, applied separately to bare soil and vegetation classes. Evaporation from water intercepted by vegetation is also represented. Besides, the model contains an energy-based snow accumulation and ablation parameterization [45].
One of the most notable characteristics of the VIC model is that it has a good ability to solve the problem of water and surface energy budgets in each grid unit and at each time step. In this study, VIC 4.1.2 version was chosen for the runoff simulation [48].

2.4. Statistical Method

This study used relative bias (RB), correlation coefficient (CC) and root mean square error (RMSE) to measure the difference between 3B42 RTV7 and 3B42 V7. The relative bias (%) was selected to measure the consistency between the average of the measured data and the average of the gauged data. To evaluate the correlation linearity of the datasets and the average error magnitude, the correlation coefficient (CC) and root mean square error (RMSE) were respectively used. Meanwhile, the RB and CC were also used to evaluate hydrology skills through the assessment of simulated runoff performance. Moreover, the Nash–Sutcliffe coefficient of efficiency (NSCE), which is commonly used to verify the quality of hydrological model simulation results, was used to evaluate the performance of the VIC hydrological model [20]. The false alarm ratio (FAR) measures the proportion of actual rain that is falsely reported [49]. The probability of detection (POD) indicates the proportion of rain events that were correctly detected, whereas the critical success index (CSI) is a combination of false and missed events detected by satellites [50].
The RB, CC, RMSE and NSCE are expressed by the following formulas:
RB = n = 1 N ( Sat n Gag n ) n = 1 N Gag n
CC = 1 N n = 1 N ( Sat n Sat ¯ ) ( Gag n Gag ¯ ) ( SD Sat ) × ( SD Gag )
RMSE = 1 N n = 1 N ( Sat n Gag n ) 2
NSCE = 1 n = 1 N ( Sat n Gag n ) 2 n = 1 N ( Sat n Sat ¯ ) 2
where n is the number of samples; Satn is the satellite precipitation estimate; Gagn is the gauged precipitation; Sat ¯ is the averaged satellite precipitation; Gag ¯ is the averaged gauged precipitation; SDSat is the standard deviations of satellite precipitation; SDGag is the standard deviations of gauged precipitation [27,51,52];
The FAR, POD and CSI are expressed by the following formulas:
POD = C sg C sg + C g M S
FAR = C s M g C sg + C s M g
CSI = C sg C sg + C s M g + C g M S
where Csg is the event captured by satellite and gauge; CsMg is the event captured by satellite and missed by gauge; CgMs is the event captured by gauge and missed by satellite [51].

3. Results

3.1. Evaluation of the TMPA Precipitation Products

The spatial distribution of the mean annual precipitation in the upper Yangtze reaches showed a decreasing trend from east to west (Figure 2). TMPA 3B42RTV7 can roughly capture the entire spatial pattern of mean annual precipitation, with the high values of precipitation mainly appearing in the middle and north-western parts of the region. However, the tendency of significant overestimation compared to the gauged data for the entire region was visible, especially in the Jinshajiang River basin, where the average elevation was above 3000 m and precipitation was around 400 mm/year (Figure 2b). The TMPA 3B42V7 precipitation product resembled well the gauged precipitation in terms of the spatial pattern of mean annual precipitation, however, it underestimated the precipitation in the upper Yangtze reaches (Figure 2c).
The spatial distributions of the precipitation relative bias (%) from the TMPA 3B42RTV7/V7 data against the gauged precipitation data in the upper Yangtze reaches are shown in Figure 3. It can be found that the precipitation relative bias fluctuation of the 3B42V7 product was slight with a range between −30% and 10%, and over 66% (negative bias) parts of the spatial distribution of precipitation were underestimated in the whole basin. Besides, near half of the relative bias of 3B42V7 maintained between −10% and 10% in the whole study region (Figure 3b). The precipitation relative bias of 3B42RTV7 overestimated more than 75% of parts of the entire study area, and about 20% of parts of a large positive bias even beyond 100%, which mostly appeared in the northwestern parts of Jinshajiang River basin and Mintuojiang River basin. From the perspective of spatial precipitation bias percentage, the capacity of TMPA 3B42V7 was better than 3B42RTV7 in the precipitation estimation.
The areal mean of TMPA 3B42 RTV7/V7 and gauged annual precipitation at different time scales in the upper Yangtze River basin from 2003 to 2010 are shown in Figure 4. Both TMPA 3B42 productions followed the tendency variations of the gauged precipitation very well for all three time scales. The monthly variations of the 3B42V7 product agreed much better with the gauged precipitation, while the underestimation was visible on the daily and annual scales. Although 3B42RTV7 roughly captured the tendency variations of the gauged precipitation, it significantly overestimated the precipitation. Notably, for the monthly scale, 3B42RTV7 usually agreed well with the dry seasons (October–May) but overestimated precipitation during the wet seasons (June–September). Similar to the spatial analysis results, TMPA 3B42V7 also showed better performance than 3B42RTV7 in terms of time scales.
The comparison of statistical indexes of precipitation between TMPA products and gauged precipitation is listed in Table 1. Comparisons suggest that 3B42V7 had a better performance than 3B42RTV7 at both daily and monthly scales with a significantly improved reduced bias ratio. The 3B42RTV7 significantly overestimated the precipitation at both daily and monthly time scales, and the RB is as high as 34.68% and 34.71%, respectively. Meanwhile, 3B42V7 maintained a relatively low RB at both daily (−6.24%) and monthly (−6.21%) scales, which demonstrates that 3B42V7 slightly underestimates the precipitation. The RMSE and CC values were 2.2 mm/day and 0.84 for the 3B42RTV7 product at daily time scales. When it comes to the monthly scale, the RMSE rises to 1108.3 mm/month; the CC rises to 0.97 at the same time. However, 3B42V7 had a higher correlation (CC = 0.92) than 3B42RTV7 at daily time scales. For the RMSE of 3B42V7, a similar increase occurred from the daily time scale (1.1 mm/day) to the monthly scale (196.2 mm/month), which was still much lower than 3B42RTV7. Generally, the 3B42V7 product had a significant improvement in bias ratio reduction, with a lower RB and RMSE. Meanwhile, 3B42V7 also had a slight advantage over 3B42RTV7 in terms of correlation with the gauged precipitation.
The statistical indexes (POD, CSI, FAR) of different precipitation thresholds at daily time scales are shown in Figure 5. In terms of the values of POD, 3B42RTV7 maintained a high value throughout (>0.8), which indicated 3B42RTV7 was sensitive to precipitation events. In contrast, the POD of 3B42V7 was above 0.7 when the precipitation was below 4 mm/day. Once the precipitation continued increasing, the POD decreased significantly, indicating that 3B42V7 was more sensitive to slight precipitation events, and it was difficult to accurately detect heavy precipitation events (Figure 5a). However, Figure 5c revealed that the probability of errors reporting precipitation events for both 3B42RTV7 and 3B42V7 will increase with increasing precipitation, and 3B42RTV7 performed worse (Figure 5c). The CSI index, which is related to both POD and FAR, showed the same behavior for both types of products (Figure 5b). The decrease in the CSI values along with the precipitation increase demonstrated that both 3B42RTV7 and 3B42V7 had a better skill in detecting slight precipitation events than large precipitation events (Figure 5b). Above all, 3B42RTV7 was more sensitive to precipitation events, while 3B42V7 showed better ability and accuracy in slight precipitation events detection in the upper reaches of the Yangtze River.

3.2. Hydrologic Model Calibration

Based on the gauged runoff data, the VIC hydrological model was driven by the gauged precipitation and satellite precipitation products, and different calibration parameters of the hydrological model were obtained. Then, the simulation study of the gauged precipitation and satellite precipitation products was conducted by using the parameters to test the effect of satellite products in the runoff simulation. This paper used the MOCOM-UA algorithm to automatically calibrate the parameters of the VIC hydrological model. This method is an effective method for solving multi-objective global optimization problems [31]. The calibration parameters and calibration values of the VIC model in the upper reaches of the Yangtze River are shown in Table 2. (1) Variable infiltration curve parameter (B); (2) three base flow parameters which determine how quickly the water stored in the third layer is withdrawn, including the fraction of maximum soil moisture (Ws) where a non-linear base flow begins, the fraction of maximum base flow (Ds) and the maximum velocity of the base flow (Dsmax); and (3) the three soil layer thicknesses (d1, d2, d3) which affect the maximum storage available in the soil layers [53,54]. The values of B, Ws, Ds, Dsmax, d1, d2 and d2 were 0.4, 0.2008, 0.01, 6.008, 0.01, 0.1 and 1.24 when the gauged precipitation was used as input data to calibrate the VIC hydrological model, respectively. However, when using the precipitation products of TMPA 3B42RTV7 and TMPA 3B42V7 to calibrate the hydrological model, the new calibrated parameter values of B, Ws, Ds, Dsmax, d1, d2 and d2 are shown in Table 2.
Figure 6 shows comparisons between the gauged runoff and simulated runoff forced by the gauged precipitation at (a) daily and (b) monthly time scales. The correlation coefficient of the simulated hydrograph was as high as 0.93, with a negative relative bias of 6.36%, and NSCE reached 0.85 at daily time scales (Figure 6a). For the monthly time scale, the relative bias (−6.34) and correlation coefficient (0.98) were slightly better than those of the daily time scale, but the NSCE increased to 0.95 (Figure 6b). Therefore, the results of the model calibration indicated that the VIC model had good skills in the hydrological simulation when forced by the gauged precipitation.
To further verify the performance of the VIC model on the monthly scale, the comparison of the monthly cumulative average runoff between the simulated runoff and the gauged runoff is shown in Figure 7. The simulated monthly accumulated average runoff agreed well with the gauged runoff from 1996 to 2010. The runoff simulation curve was very close to the gauged in the dry seasons, where it decreased from October to the following March. In the rainy seasons, from June to September, the simulated runoff was lower than the gauged, although the simulated runoff in June was similar to the gauged (Figure 7). The simulation results in September were worse than those in June, possibly due to the simulation deviations accumulated in July and August.

3.3. Hydrologic Model Simulation

To investigate how differences between precipitation estimates affect the accuracy or quality of VIC runoff simulations, different VIC model parameters obtained from the gauged precipitation and the TMPA precipitation were compared in Figure 8 and defined in Table 3. The red fitting line was very close to the 1:1 blue line, and the numerical aggregation degree of the runoff simulation was higher than that of previous dispersion, which demonstrated that the runoff simulation driven by 3B42RTV7 using the hydrological parameters obtained from 3B42RTV7 (R = 0.87) was superior to the parameters obtained from the gauged precipitation (R = 0.85) (Figure 8a,b). However, the runoff simulation using parameters obtained from the gauged precipitation (R = 0.90) had a slightly better performance than using parameters obtained from 3B42V7 (R = 0.87). From the analysis of results in Figure 8, 3B42RTV7 showed a better improvement for the runoff simulation when used for model parameters obtainment and model driving data in the upper reaches of the Yangtze River.
Figure 9 shows the daily simulated runoff with the driven data from the gauged precipitation and the TMPA precipitation over the upper Yangtze reaches from 2003 to 2010. In terms of runoff simulation using the VIC model parameters obtained from the gauged precipitation, the 3B42RTV7-driven runoff simulations tended to overestimate the peak flows through the entire time scale, resulting in an RB of 66.58%, a CC of 0.85 and an NSCE of −0.92. The simulation results improved a lot when using the parameters obtained from 3B42RTV7, which followed the gauged runoff curve well. The simulation results showed a lower bias (RB = 14.38) and higher correlation (CC = 0.87), and an NSCE as high as 0.71 (Figure 9a and Table 4). It can be seen from Figure 9b that the 3B42V7-driven simulation runoff using the calibration parameters obtained from the gauged precipitation agreed well with the gauged runoff. The statistical indexes were relatively well correlated with the values of RB, CC and NSCE of −5.77%, 0.90 and 0.79, respectively (Table 4). When using the parameters obtained from 3B42V7 to simulate runoff, the simulations got worse, with an RB, CC and NSCE of −19.17%, 0.87 and 0.73, respectively, which showed varying degrees of overestimation and underestimation (Figure 9b and Table 4). Overall, the 3B42RTV7-driven runoff simulations had a better performance when using the VIC model parameters obtained from 3B42RTV7; in particular, it can accurately describe the peak flow after adjustment.
Similar to the daily runoff simulation comparisons, the monthly comparisons are shown in Figure 10. The 3B42RTV7-driven runoff simulation had a greater improvement using the parameters obtained from 3B42RTV7 than from the gauged precipitation. The simulation results were more reliable with a lower bias (RB decreased from 66.61% to 14.41%) and higher correlation (CC increased from 0.93 to 0.95), and an NSCE as high as 0.86 (Figure 10a and Table 4). The correction for peak flow was visible. For 3B42V7, runoff simulation results were far from ideal. Comparing the runoff simulation driven by the parameters obtained from two different methods, the runoff simulation by using the parameters obtained from 3B42V7 got worse with the RB expanding from −5.75% to −20.90%, the NSCE decreasing from 0.94 to 0.87 and the CC (0.97) nearly the same (Figure 10b and Table 4). From the perspective of the monthly scale, the 3B42RTV7-driven runoff simulations still had better skills than the TMPA 3B42V7-driven runoff simulations when using parameters obtained from the TMPA products.

4. Discussion

Satellite precipitation products are very important for regional and global hydrological studies, particularly for remote regions and ungauged areas. TMPA precipitation products were widely used for quantitative measurement of tropical and subtropical precipitation [55]. The spatial pattern of the TMPA precipitation estimations and precipitation relative bias suggested that the TMPA satellite products had a close association with elevation [56]. Results of the precipitation estimation in this study demonstrated that TMPA 3B42V7 can well capture the spatial pattern of precipitation, though it underestimated through the whole basin. However, TMPA 3B42RTV7 showed poor performance with unrealistic overestimation, especially in the area where the average elevation was above 3000 m and precipitation was around 400 mm/year. Hao et al. [23] also drew a similar conclusion in the upper Yellow River and Yangtze River basins on the Tibetan Plateau. These results were in agreement with Tian et al. [57], who suggested that current satellite-based precipitation products are more reliable over areas with strong convective precipitation and flat surfaces, and measurement uncertainties would emerge in the areas with complex terrains, inland water bodies, cold surfaces, high latitudes and light precipitation. However, the uncertainty of TMPA satellite products for high-altitude precipitation estimation is probably caused by algorithms. Both TMPA 3B42 RTV7 and TMPA 3B42 V7 are based primarily on a combination of microwave (MW) and merging infrared (IR) estimates from multiple satellites [19]. However, high-latitude regions pose an effect on satellite rainfall estimation from either MW or IR sensors due to the snow cover, glaciers and ice aloft [32]. Therefore, climatologic adjustments and algorithm improvements ought to be considered to minimize bias and uncertainty in future research [58]. Besides, another probable reason might be the sparse meteorological sites which cannot adequately depict the spatial distributions over the complex research region [59]. Although the TMPA products used similar algorithms, 3B42V7 showed better agreement with the gauged precipitation than 3B42RTV7 at both daily and monthly time scales. This is because 3B42V7 was adjusted by the monthly gauged precipitation [56]. In terms of precipitation detections, 3B42RTV7 tended to overestimate peak precipitation, while 3B42V7 underestimated peak precipitation in the wet seasons at all three time scales. These results are similar to previous studies. For example, Li et al. [8] found that the daily TMPA precipitation data had better abilities to determine rain occurrence and mean values than to determine extreme precipitation. Ward et al. [60] found that the daily TMPA 3B42V7 could not capture small precipitation and underestimated the precipitation during the dry season. Narayanan et al. [61] validated the TMPA 3B42 data with the India Meteorological Department (IMD) rain gauge’s data and showed that the satellite algorithm did not pick up very high and very low daily precipitations. TMPA 3B42 had a better ability to detect heavy rain events, although it did not capture the same amount of precipitation [62].
Large amounts of research tested the suitability of satellite products as input to VIC hydrologic models in different basins around the world [32]. During the phase of runoff simulation, the gauged precipitation was firstly used for the acquisition of model parameters. Based on the parameters obtained by the gauged precipitation, the runoff simulation results were significantly overestimated when using 3B42RTV7 as precipitation input to the VIC model at daily and monthly scales. Runoff simulations driven by 3B42V7 followed the gauged runoff well under the same hydrologic parameters. A similar conclusion was drawn by Huang et al. [63], who used the VIC hydrological model driven by the TMPA 3B42RTV7/V7 precipitation products in the Ganjiang River basin. Tong et al. [32] found that 3B42V7 showed comparable performance to the China Meteorological Administration data in both monthly and daily streamflow simulations using the VIC hydrological model, while 3B42RT7 showed little capability for streamflow simulations over the Tibetan Plateau. These were consistent with our results. For land surface hydrology models, errors in precipitation inputs can cause significant uncertainties in runoff simulations and predictions [64]. It is also clearly shown that the TMPA-driven runoff simulations had better abilities in capturing gauged runoff in dry seasons than wet seasons (Figure 6). The probable reason is that the model can withstand smaller errors during the process of extensive integration of the basin. Once the input error increases to a certain extent beyond the tolerance level of the VIC model, the model behaves unrealistically and generates amplified errors in the output [56]. During the precipitation estimation phase, 3B42RTV7 severely overestimated the precipitation with 3B42V7 underestimating in the wet season, but it can accurately capture the precipitation in the dry season. Due to error propagation, when the TMPA precipitation products spread errors into the runoff simulation, the runoff simulation showed a better performance in the dry seasons than the wet seasons.
It is worth noting that this research then focused on the comparative studies on the calibration parameters obtained from observation and TMPA 3B42RTV7/V7 precipitation. The 3B42RTV7-driven runoff simulations using the calibration parameter obtained from 3B42RTV7 were significantly better than those using the calibration parameter obtained from the gauged runoff. Unfortunately, the runoff simulations driven by TMPA 3B42V7 performed even worse with the same method. The cause might be that the TMPA 3B42V7 satellite products have been adjusted by gauged precipitation. Different from ours, Tang et al. [24] used the recalibration parameters obtained from the TMPA products for the CREST model, which found that the runoff simulation performed better than the gauged ones using the calibration parameter based on gauged runoff in the Ganjiang River basin, and the runoff simulation driven by 3B42V7 showed a better performance than the one driven by 3B42RTV7. Wang et al. [37] found that the TMPA 3B42V7-driven runoff simulation using the calibration parameter of the VIC model obtained from TMPA 3B42V7 agreed well with the gauged runoff in the source region of the Yellow River. The probable reasons were the model uncertainties of calibration parameters which were important to the runoff simulation for the VIC model. Therefore, it is important to conduct a study about the strategies to reduce the uncertainty of model parameters in the future. Overall, it is possible to use real-time TMPA 3B42RTV7 satellite precipitation data to drive hydrological models for real-time hydrological simulation or prediction in remote regions and ungauged areas.

5. Conclusions

This study evaluated the hydrological utilities of TMPA 3B42RTV7/V7 products against gauge observations using the VIC hydrological model over the upper Yangtze River basin from 2003 to 2010. The main findings of this study can be summarized as follows:
(1)
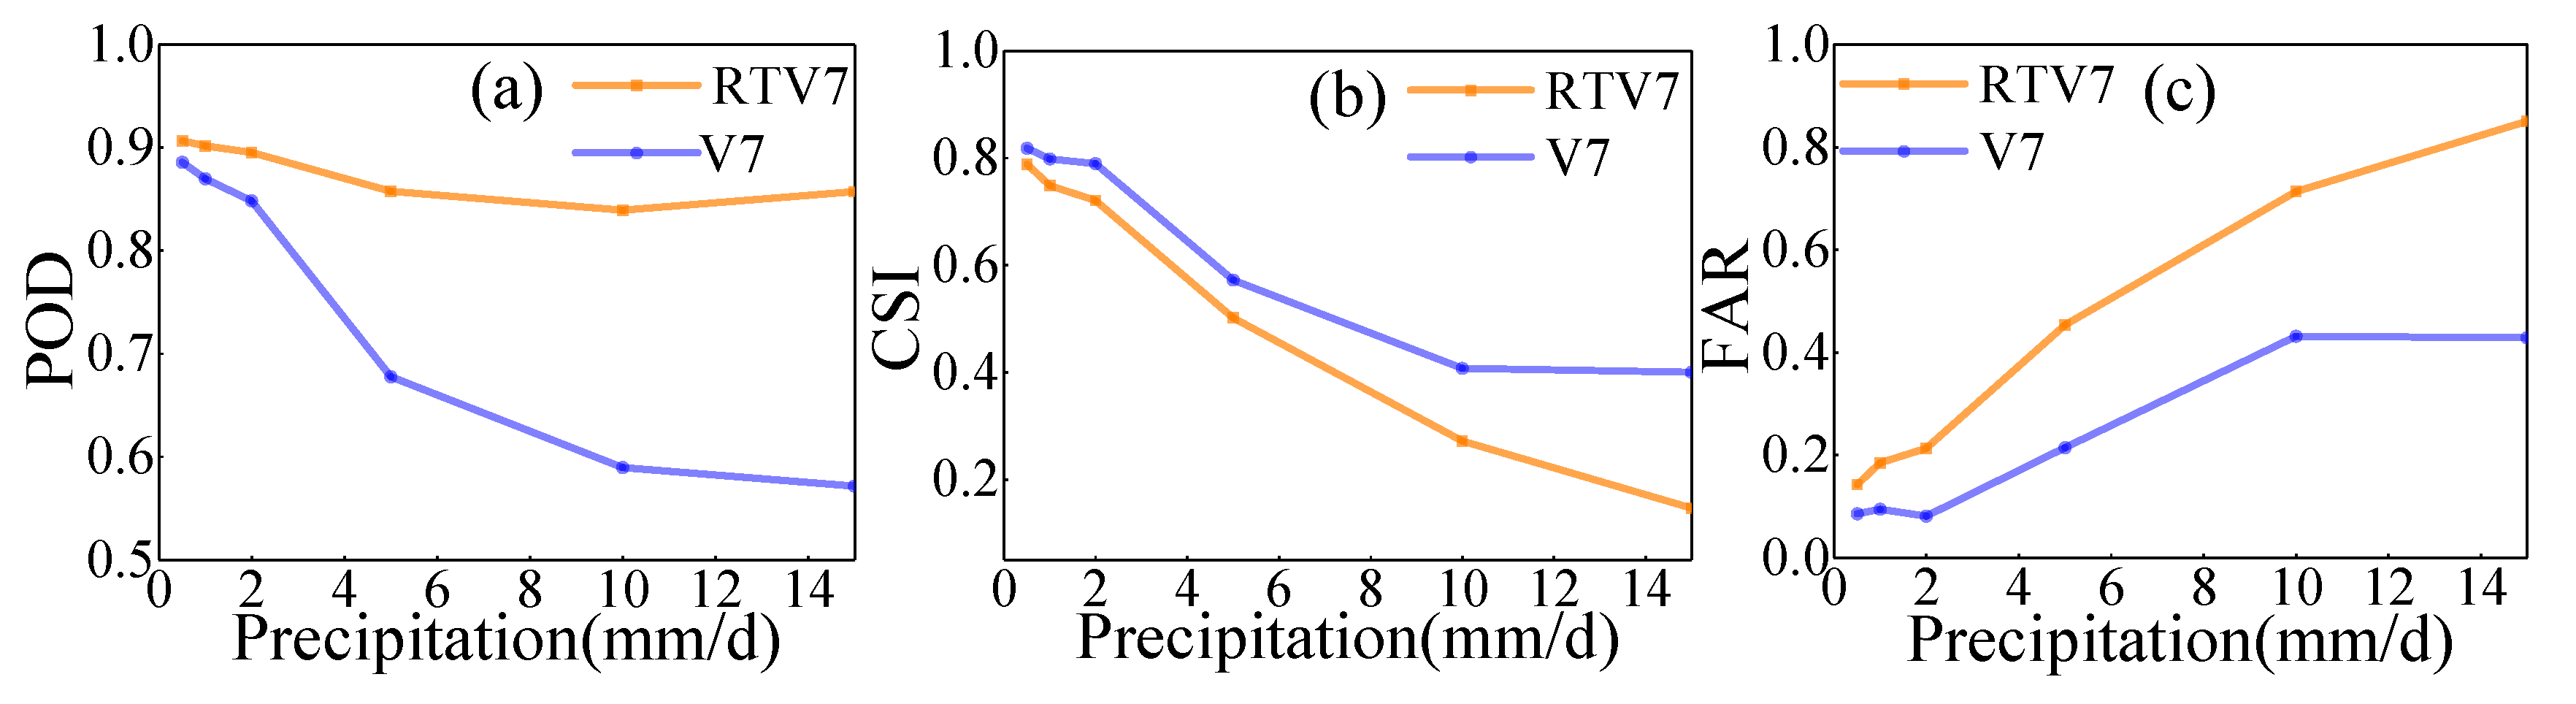
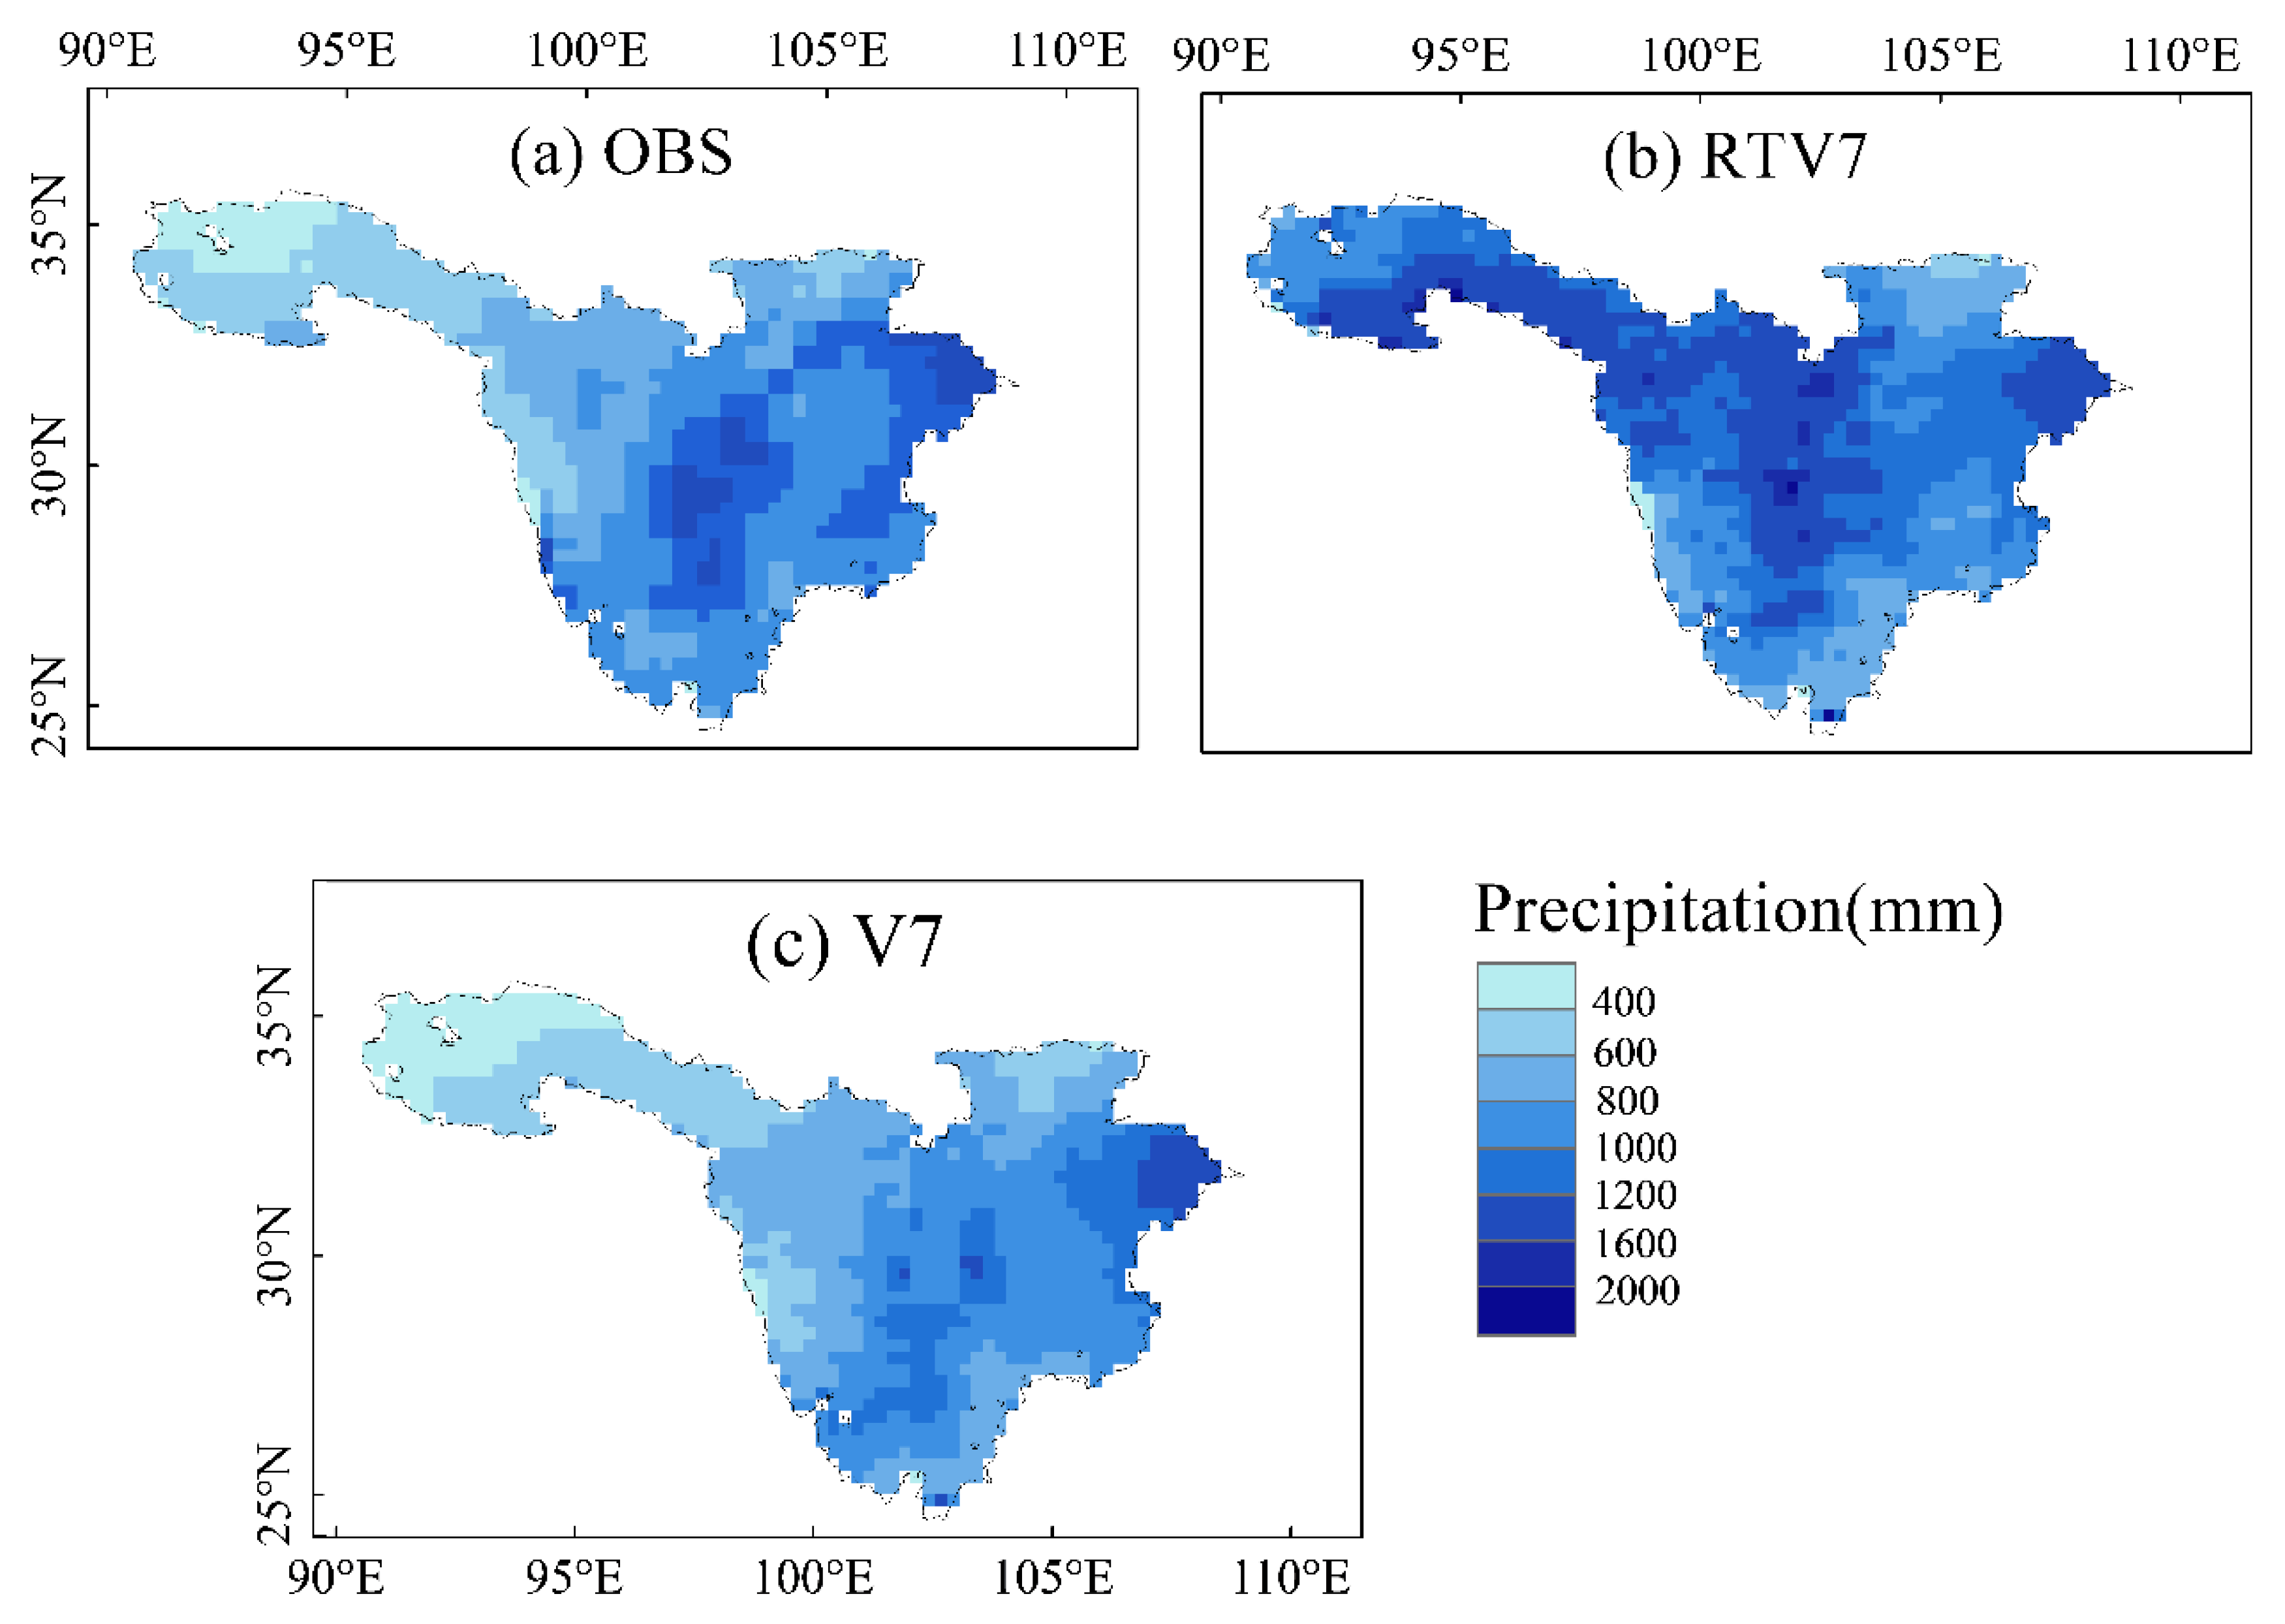
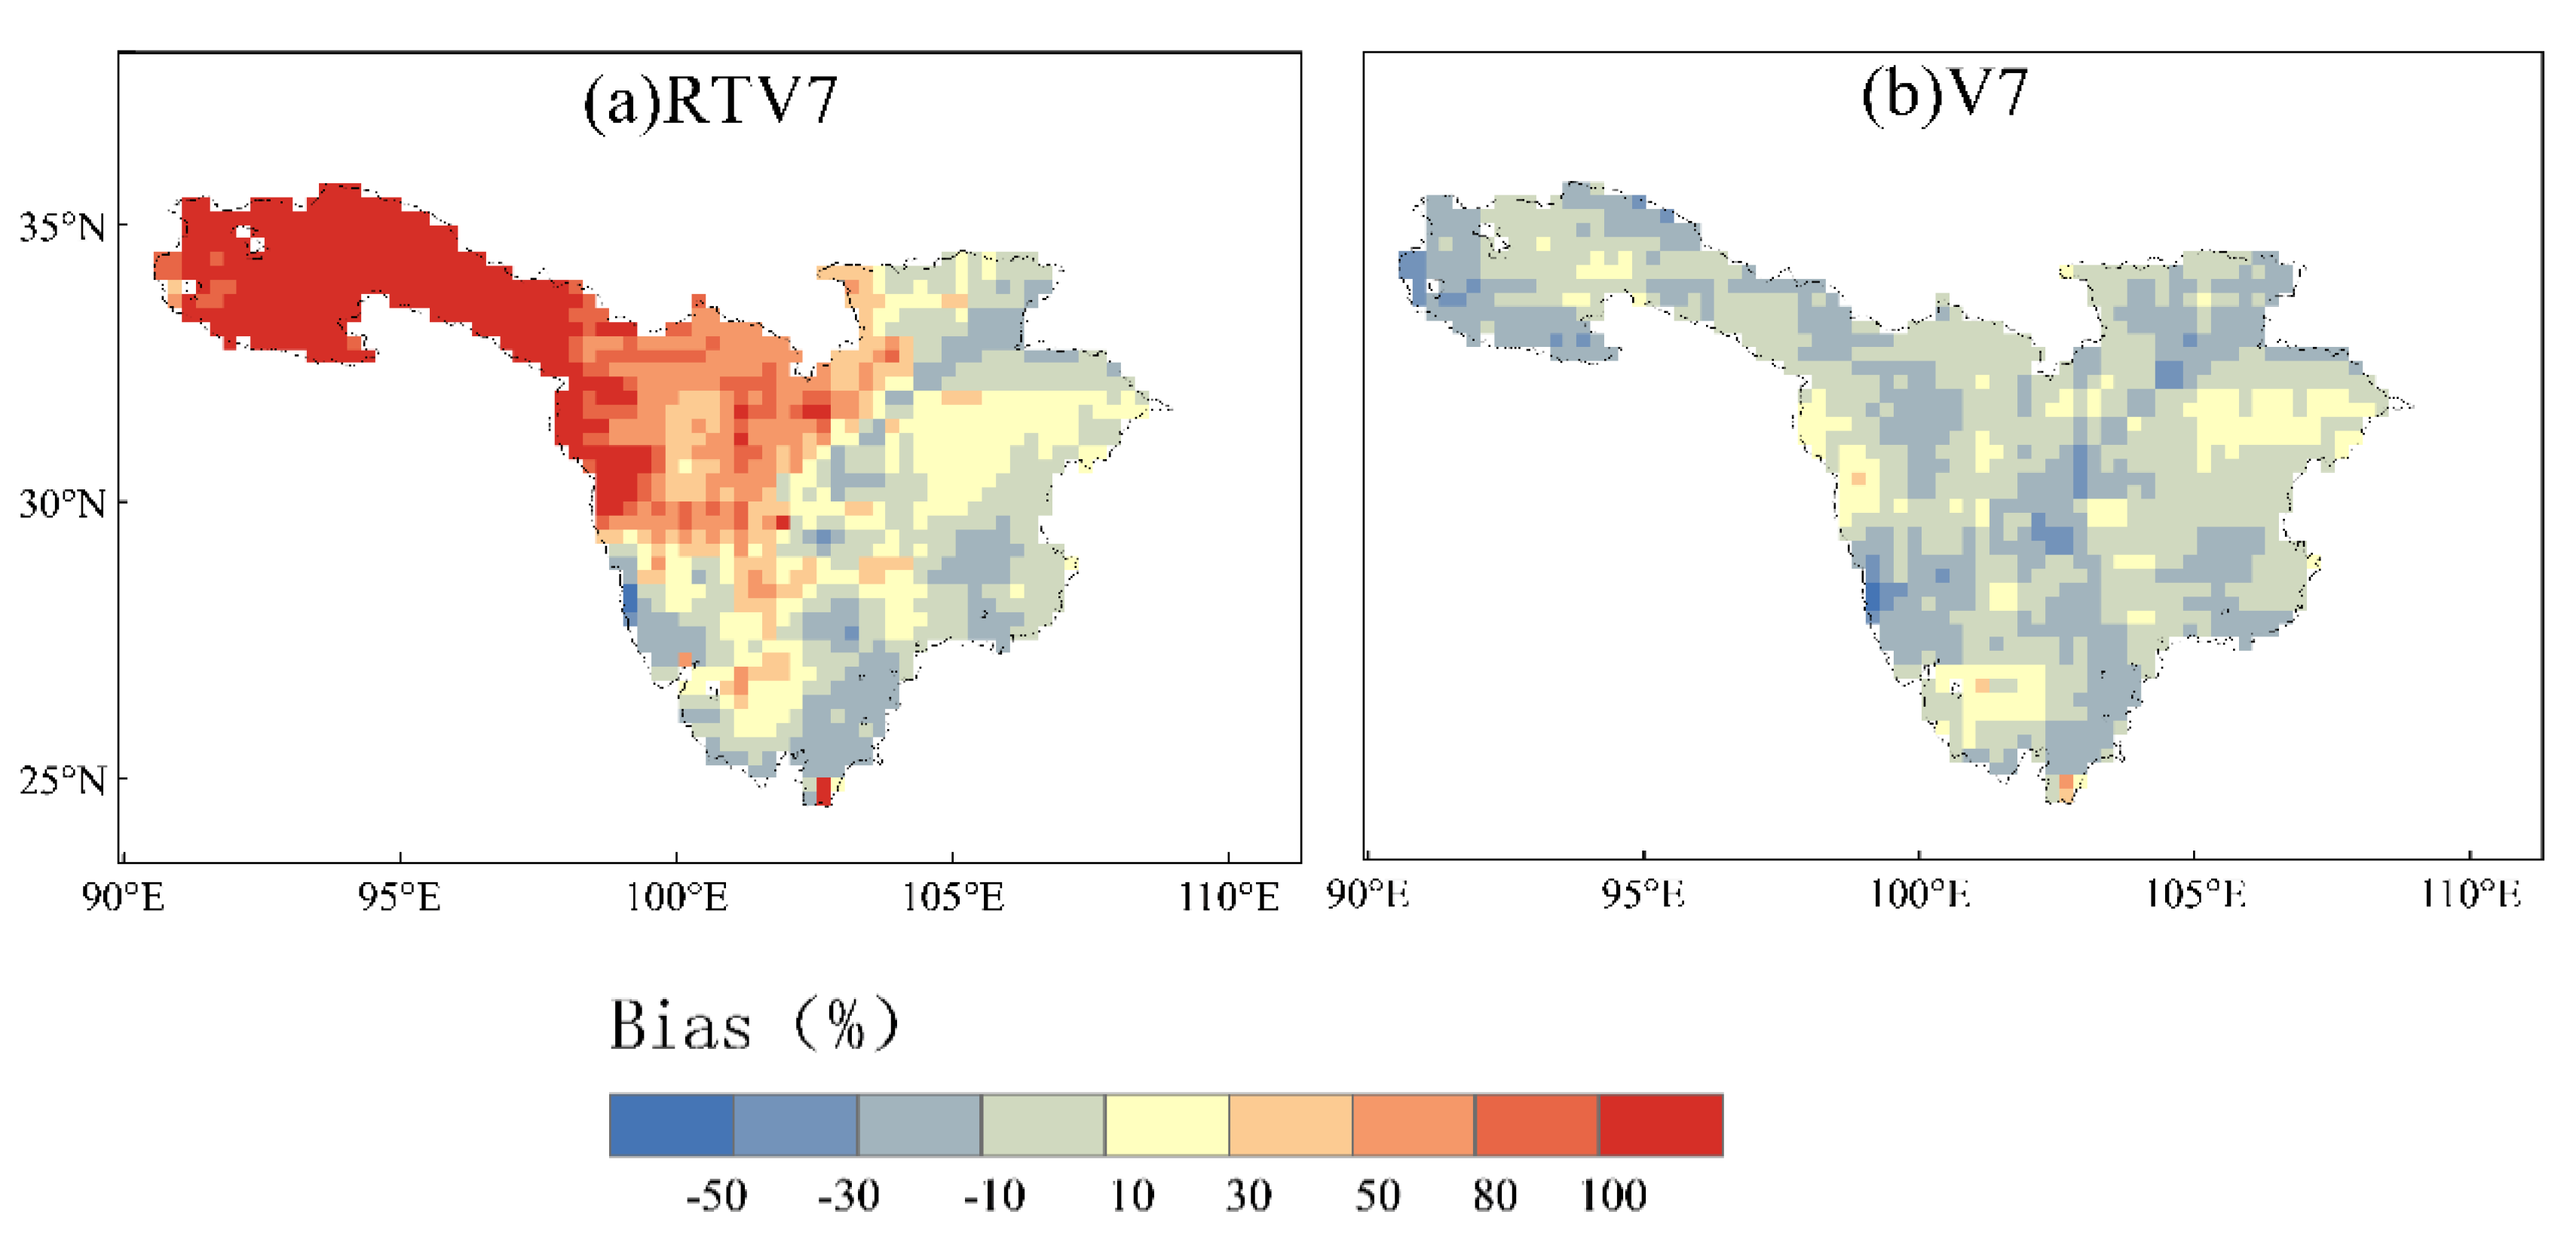
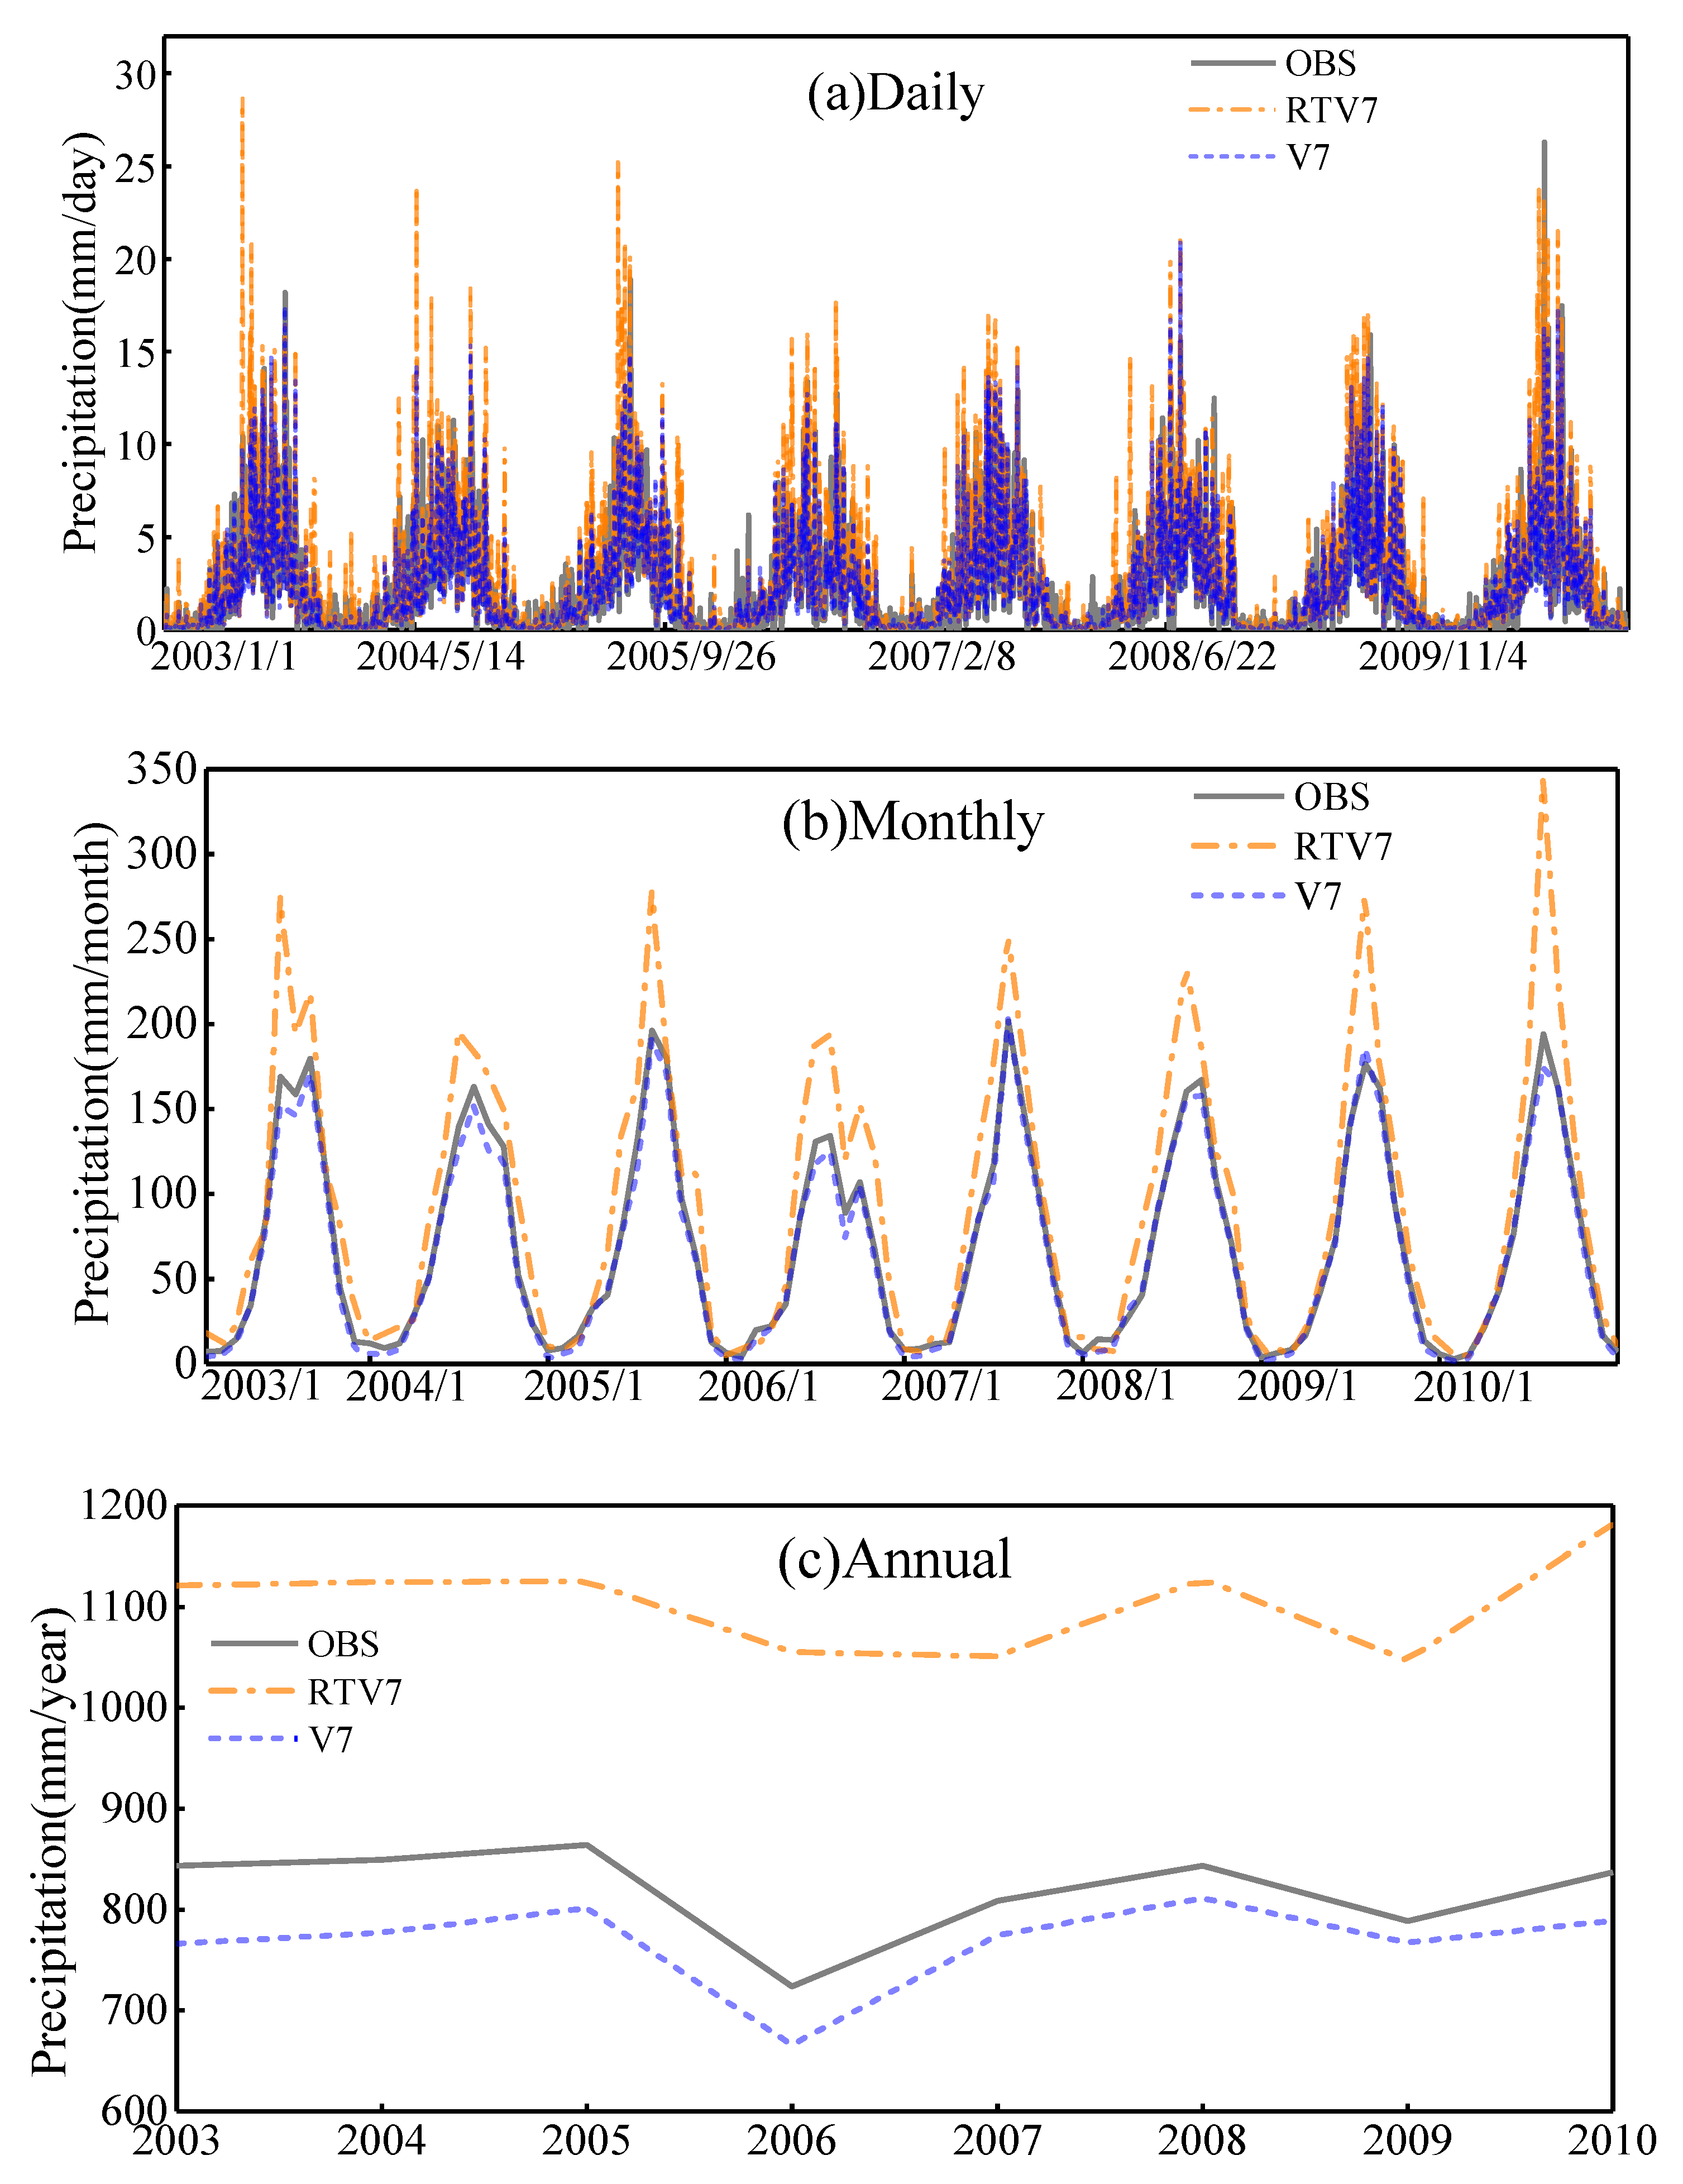
The spatiotemporal comparisons of precipitation over the upper Yangtze River basin suggest that 3B42V7 had a reliable performance in the precipitation estimation. Although 3B42V7 (RB = −6.24%, RMSE = 1.10 mm/day and CC = 0.92) slightly underestimated precipitation, 3B42RTV7 (RB = −34.68%, RMSE = 2.2 mm/day and CC = 0.84) significantly overestimated precipitation at the daily time scale. 3B42V7 well captured the distribution of precipitation but underestimated almost 66% of parts of the entire study area. 3B42RTV7 overestimated more than 75% of parts of the entire study area, especially in the northwestern parts of the Jinshajiang River basin. Besides, 3B42RTV7 was more sensitive to precipitation events (POD > 0.7), while 3B42V7 showed better ability and accuracy in slight precipitation events detection (precipitation < 4 mm/day, POD > 0.7). Overall, the good performances of the 3B42RTV7/V7 precipitation products suggest that they are feasible for runoff simulation.
(2)
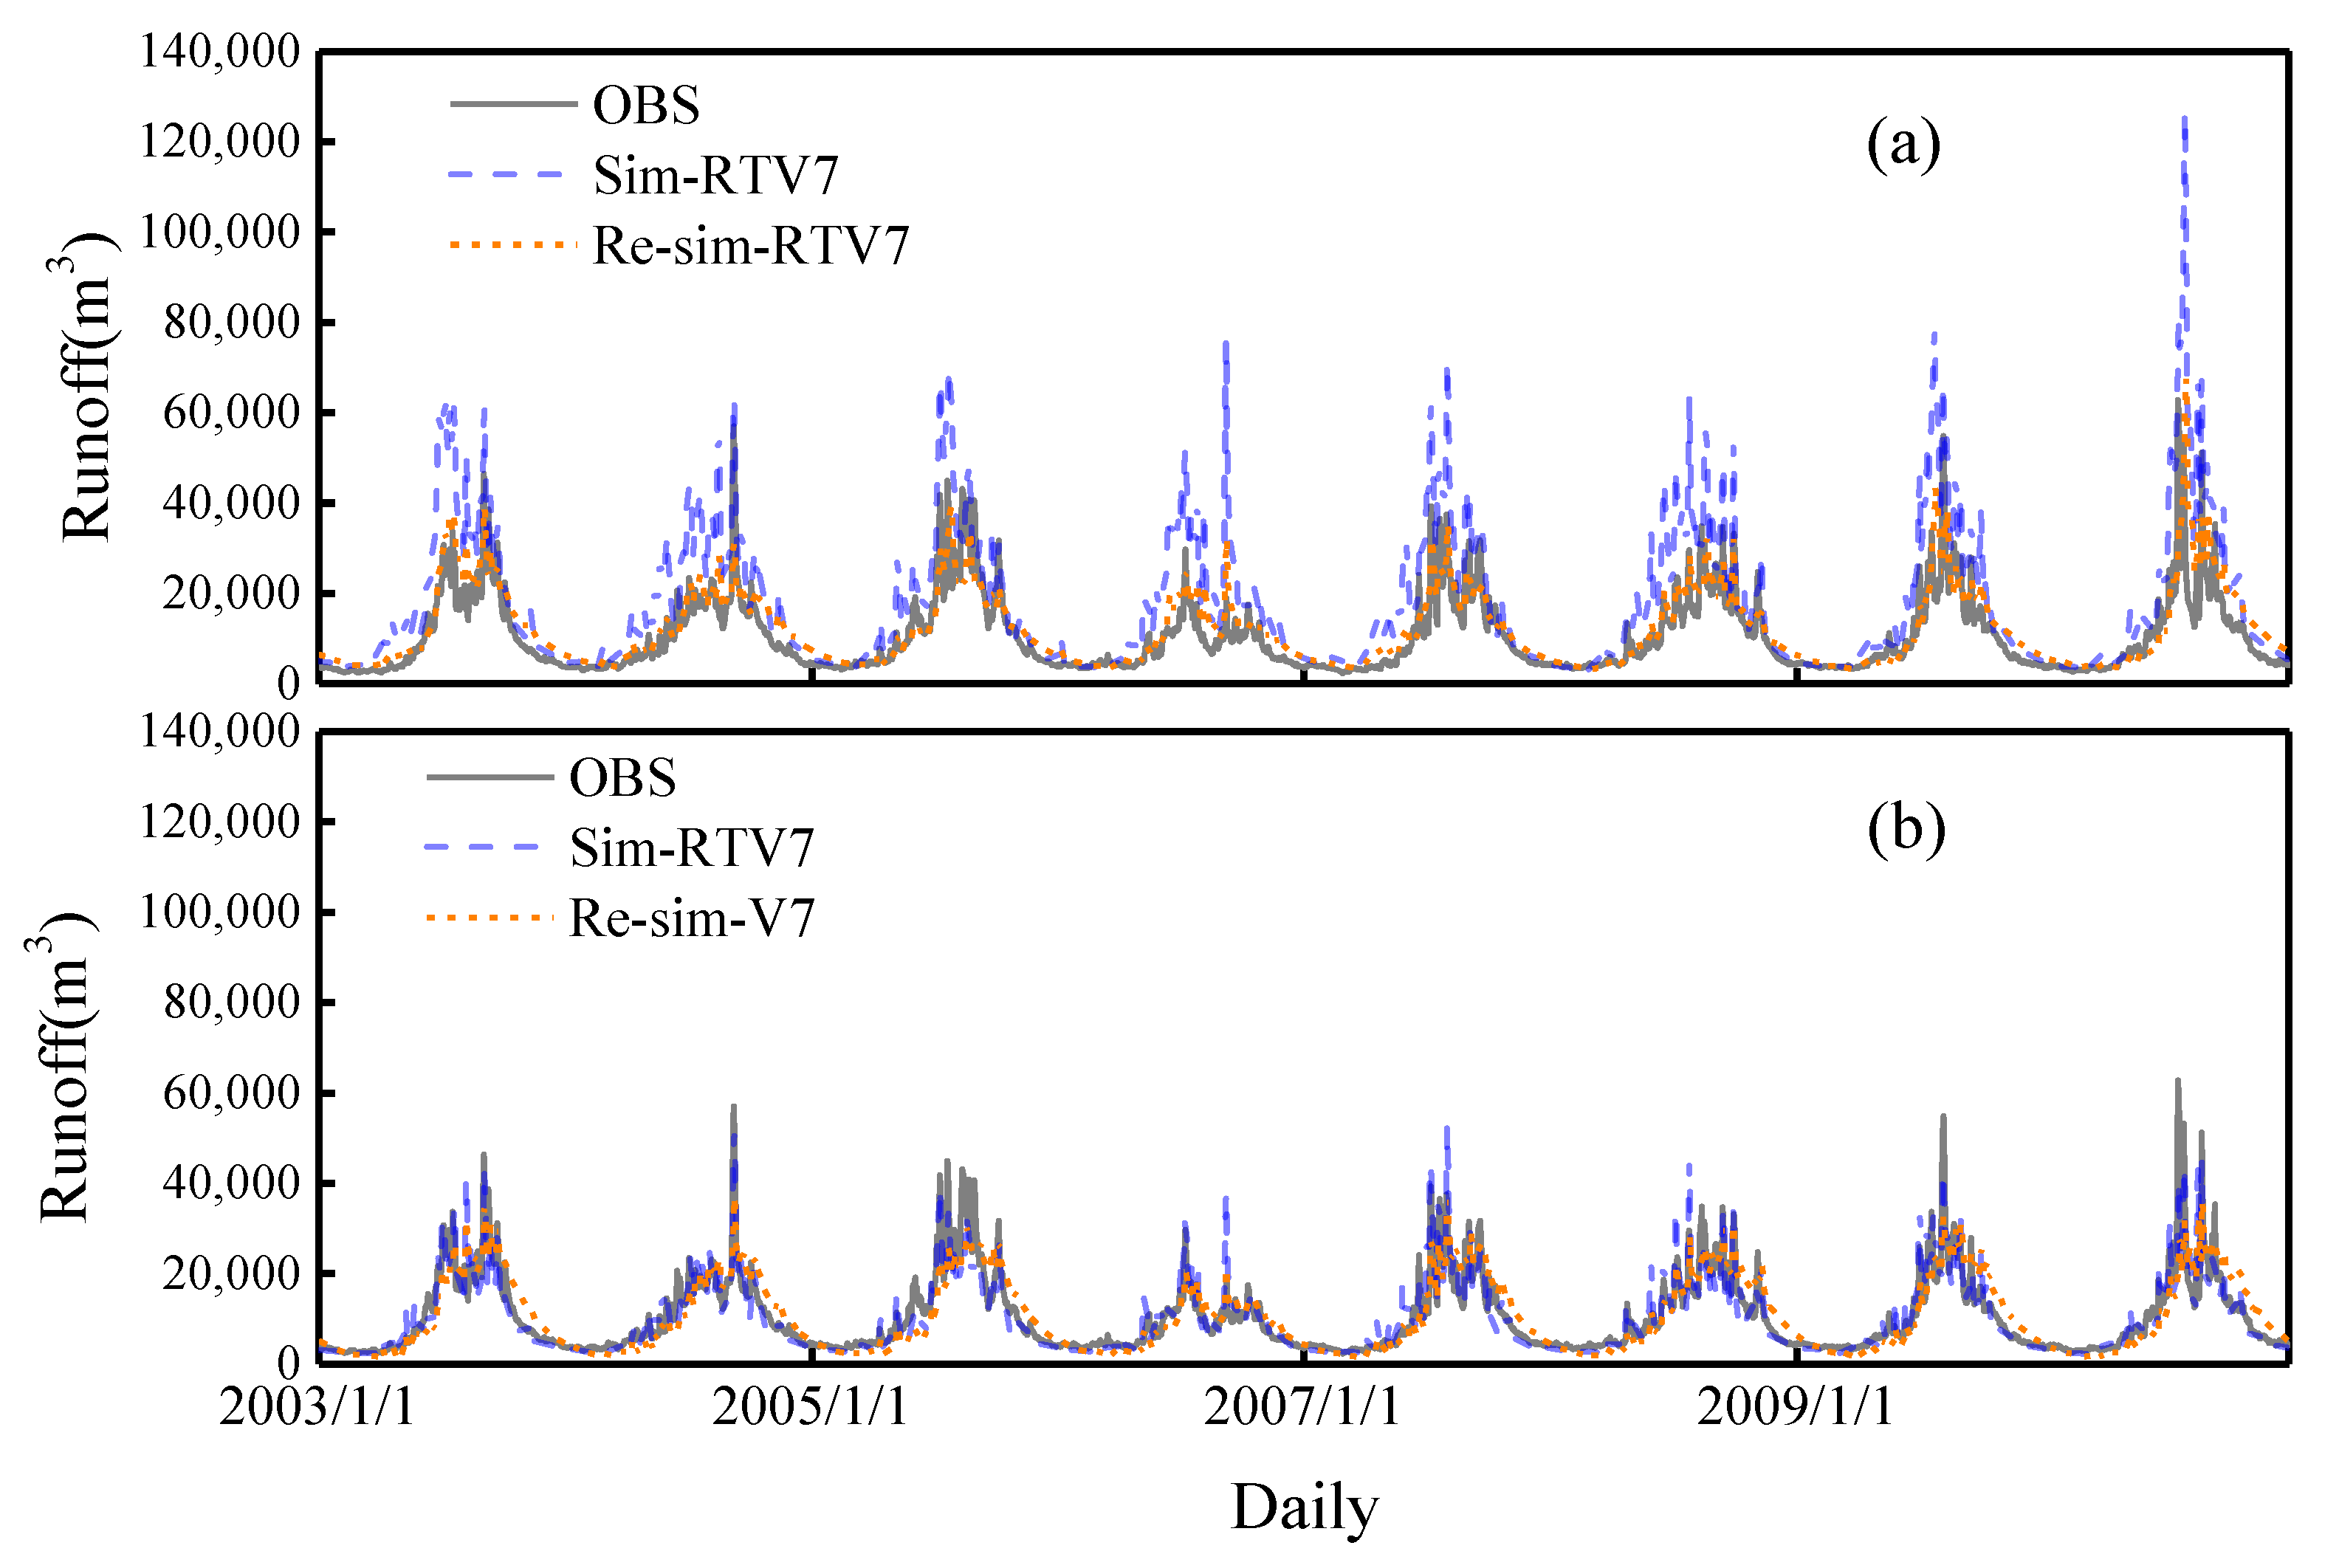
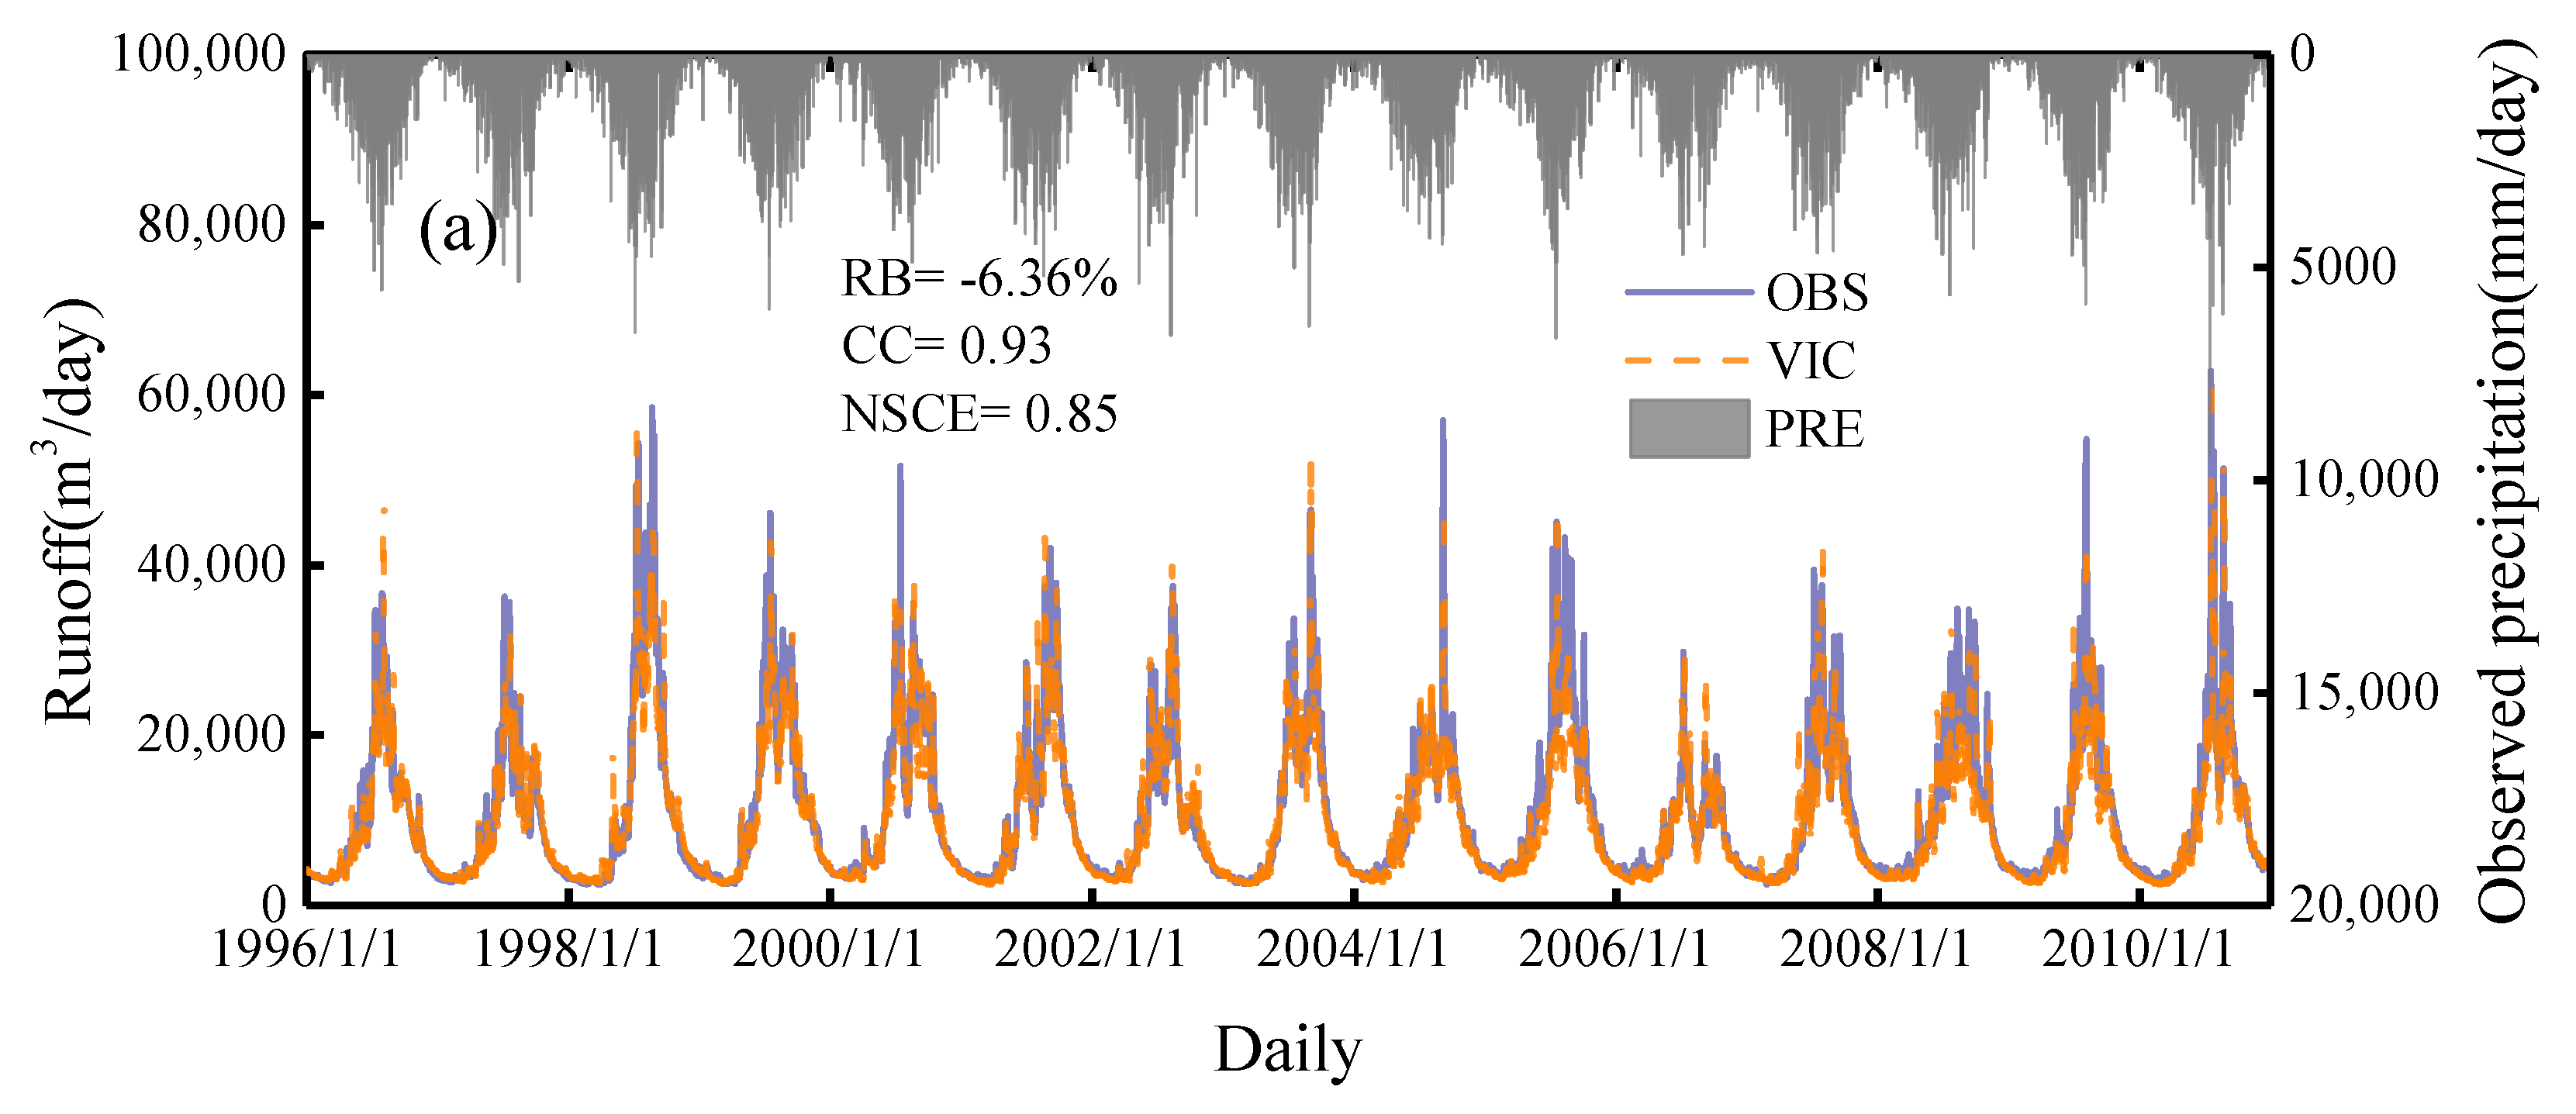
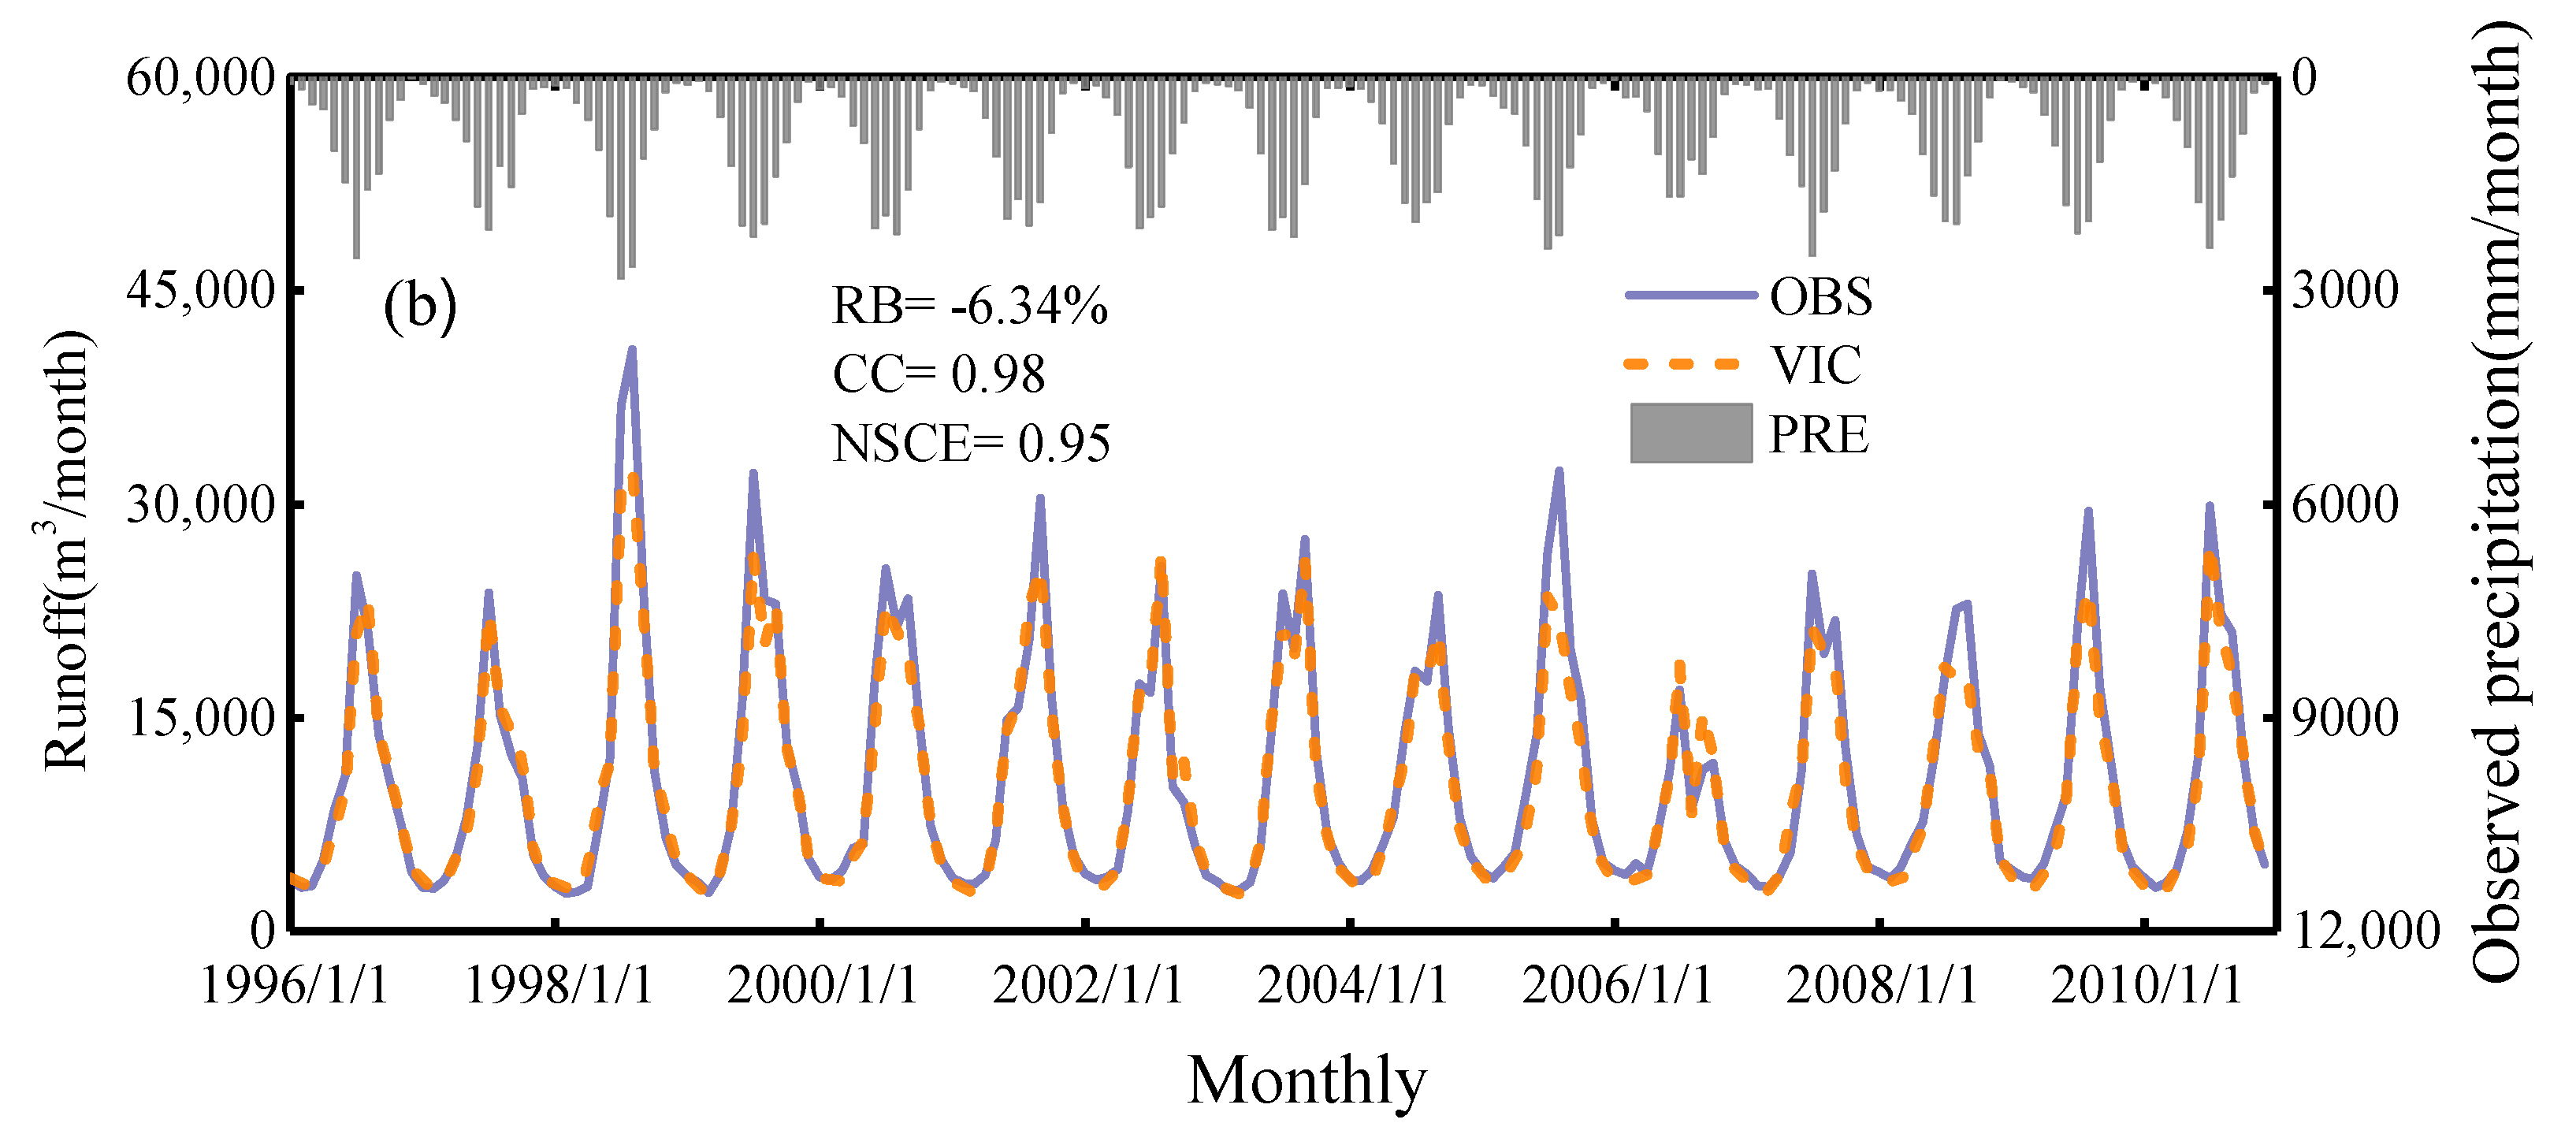
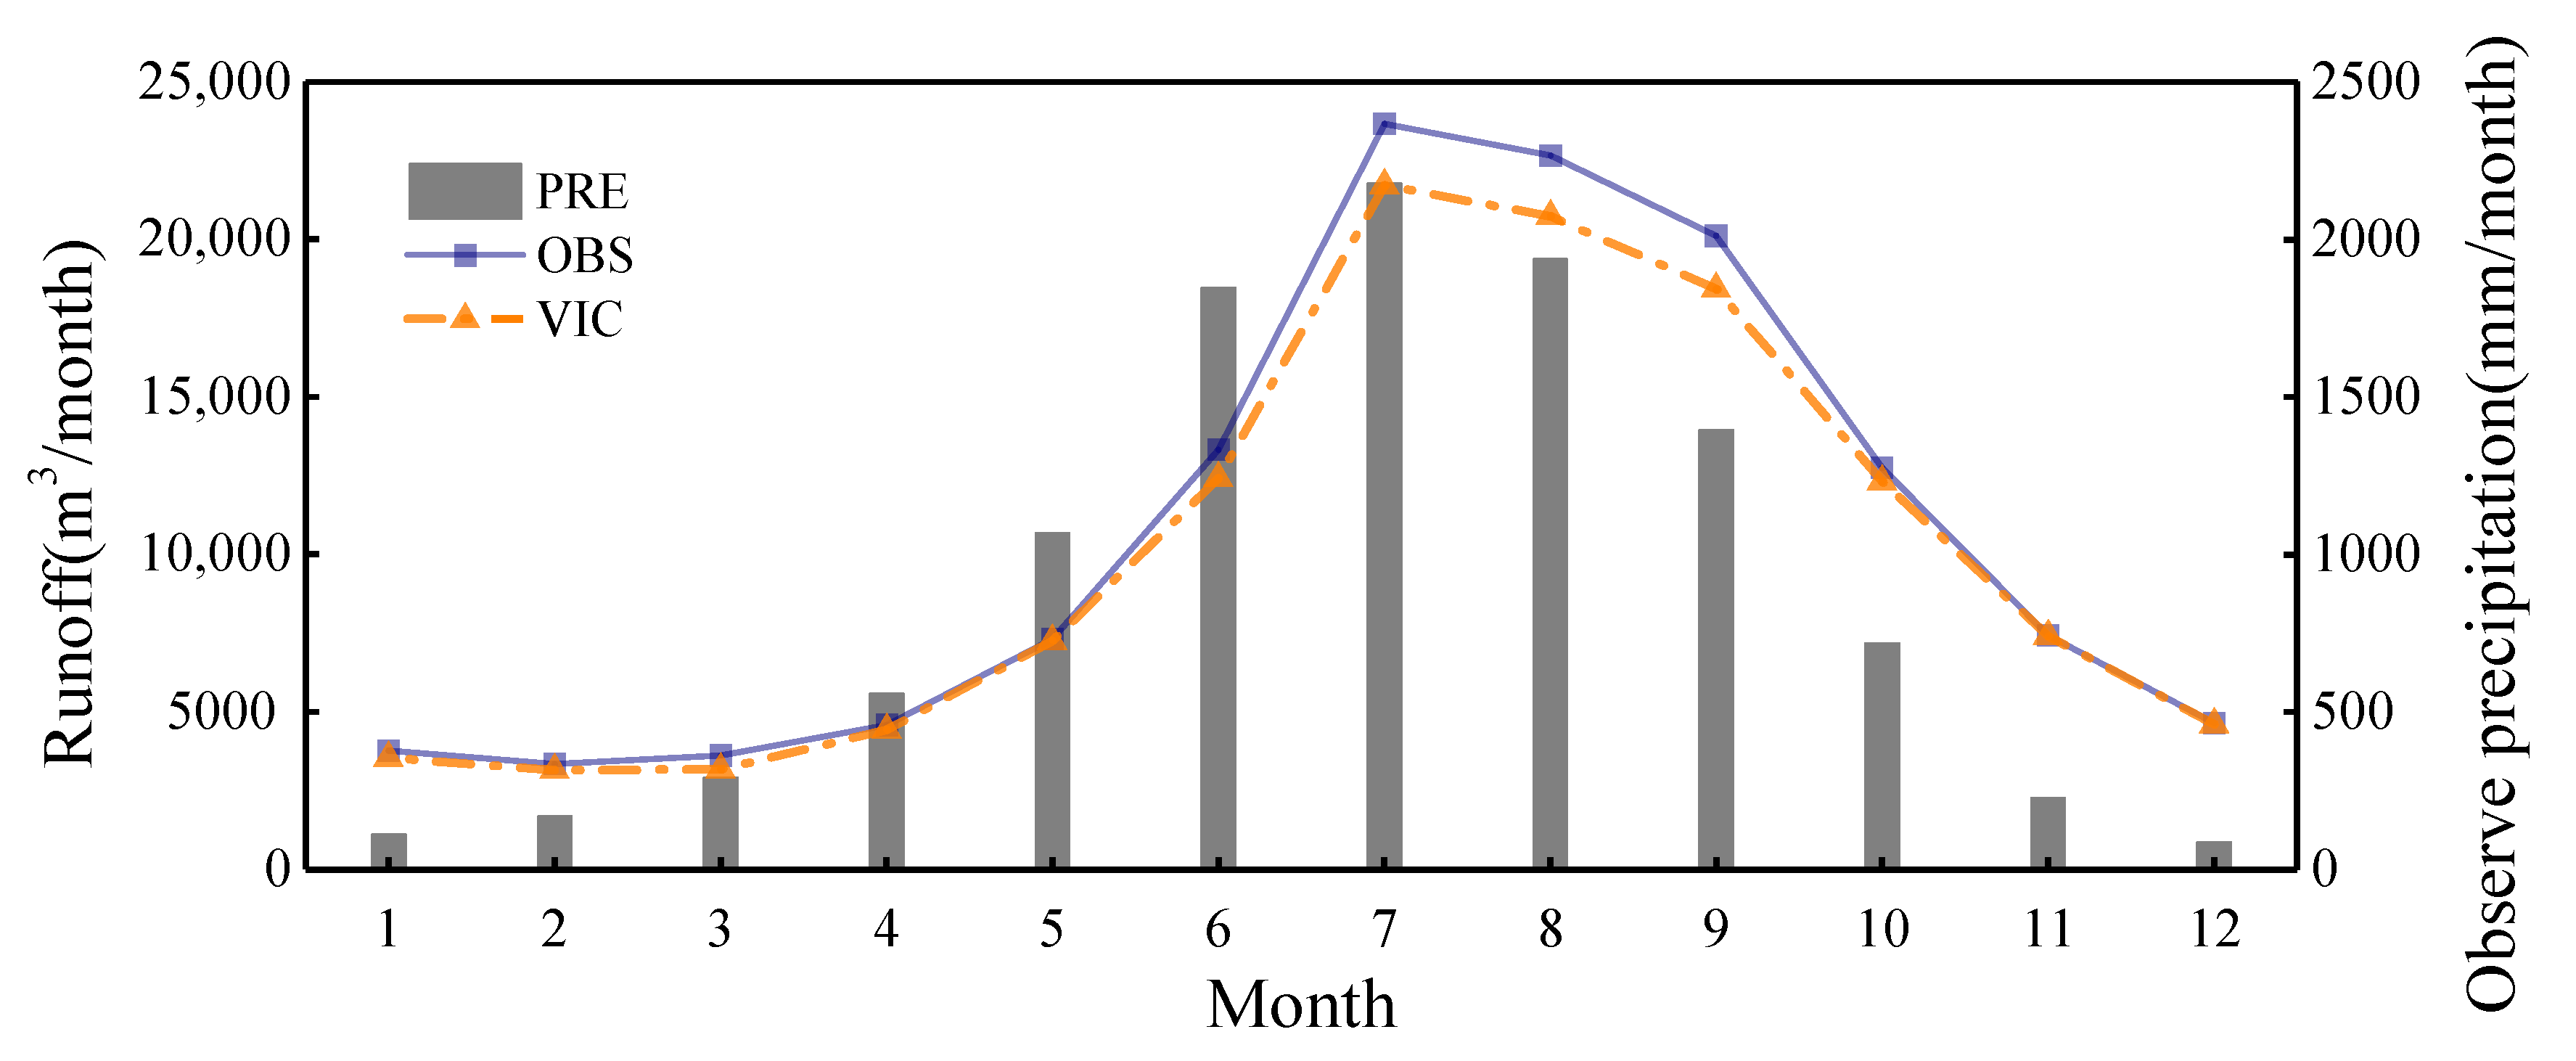
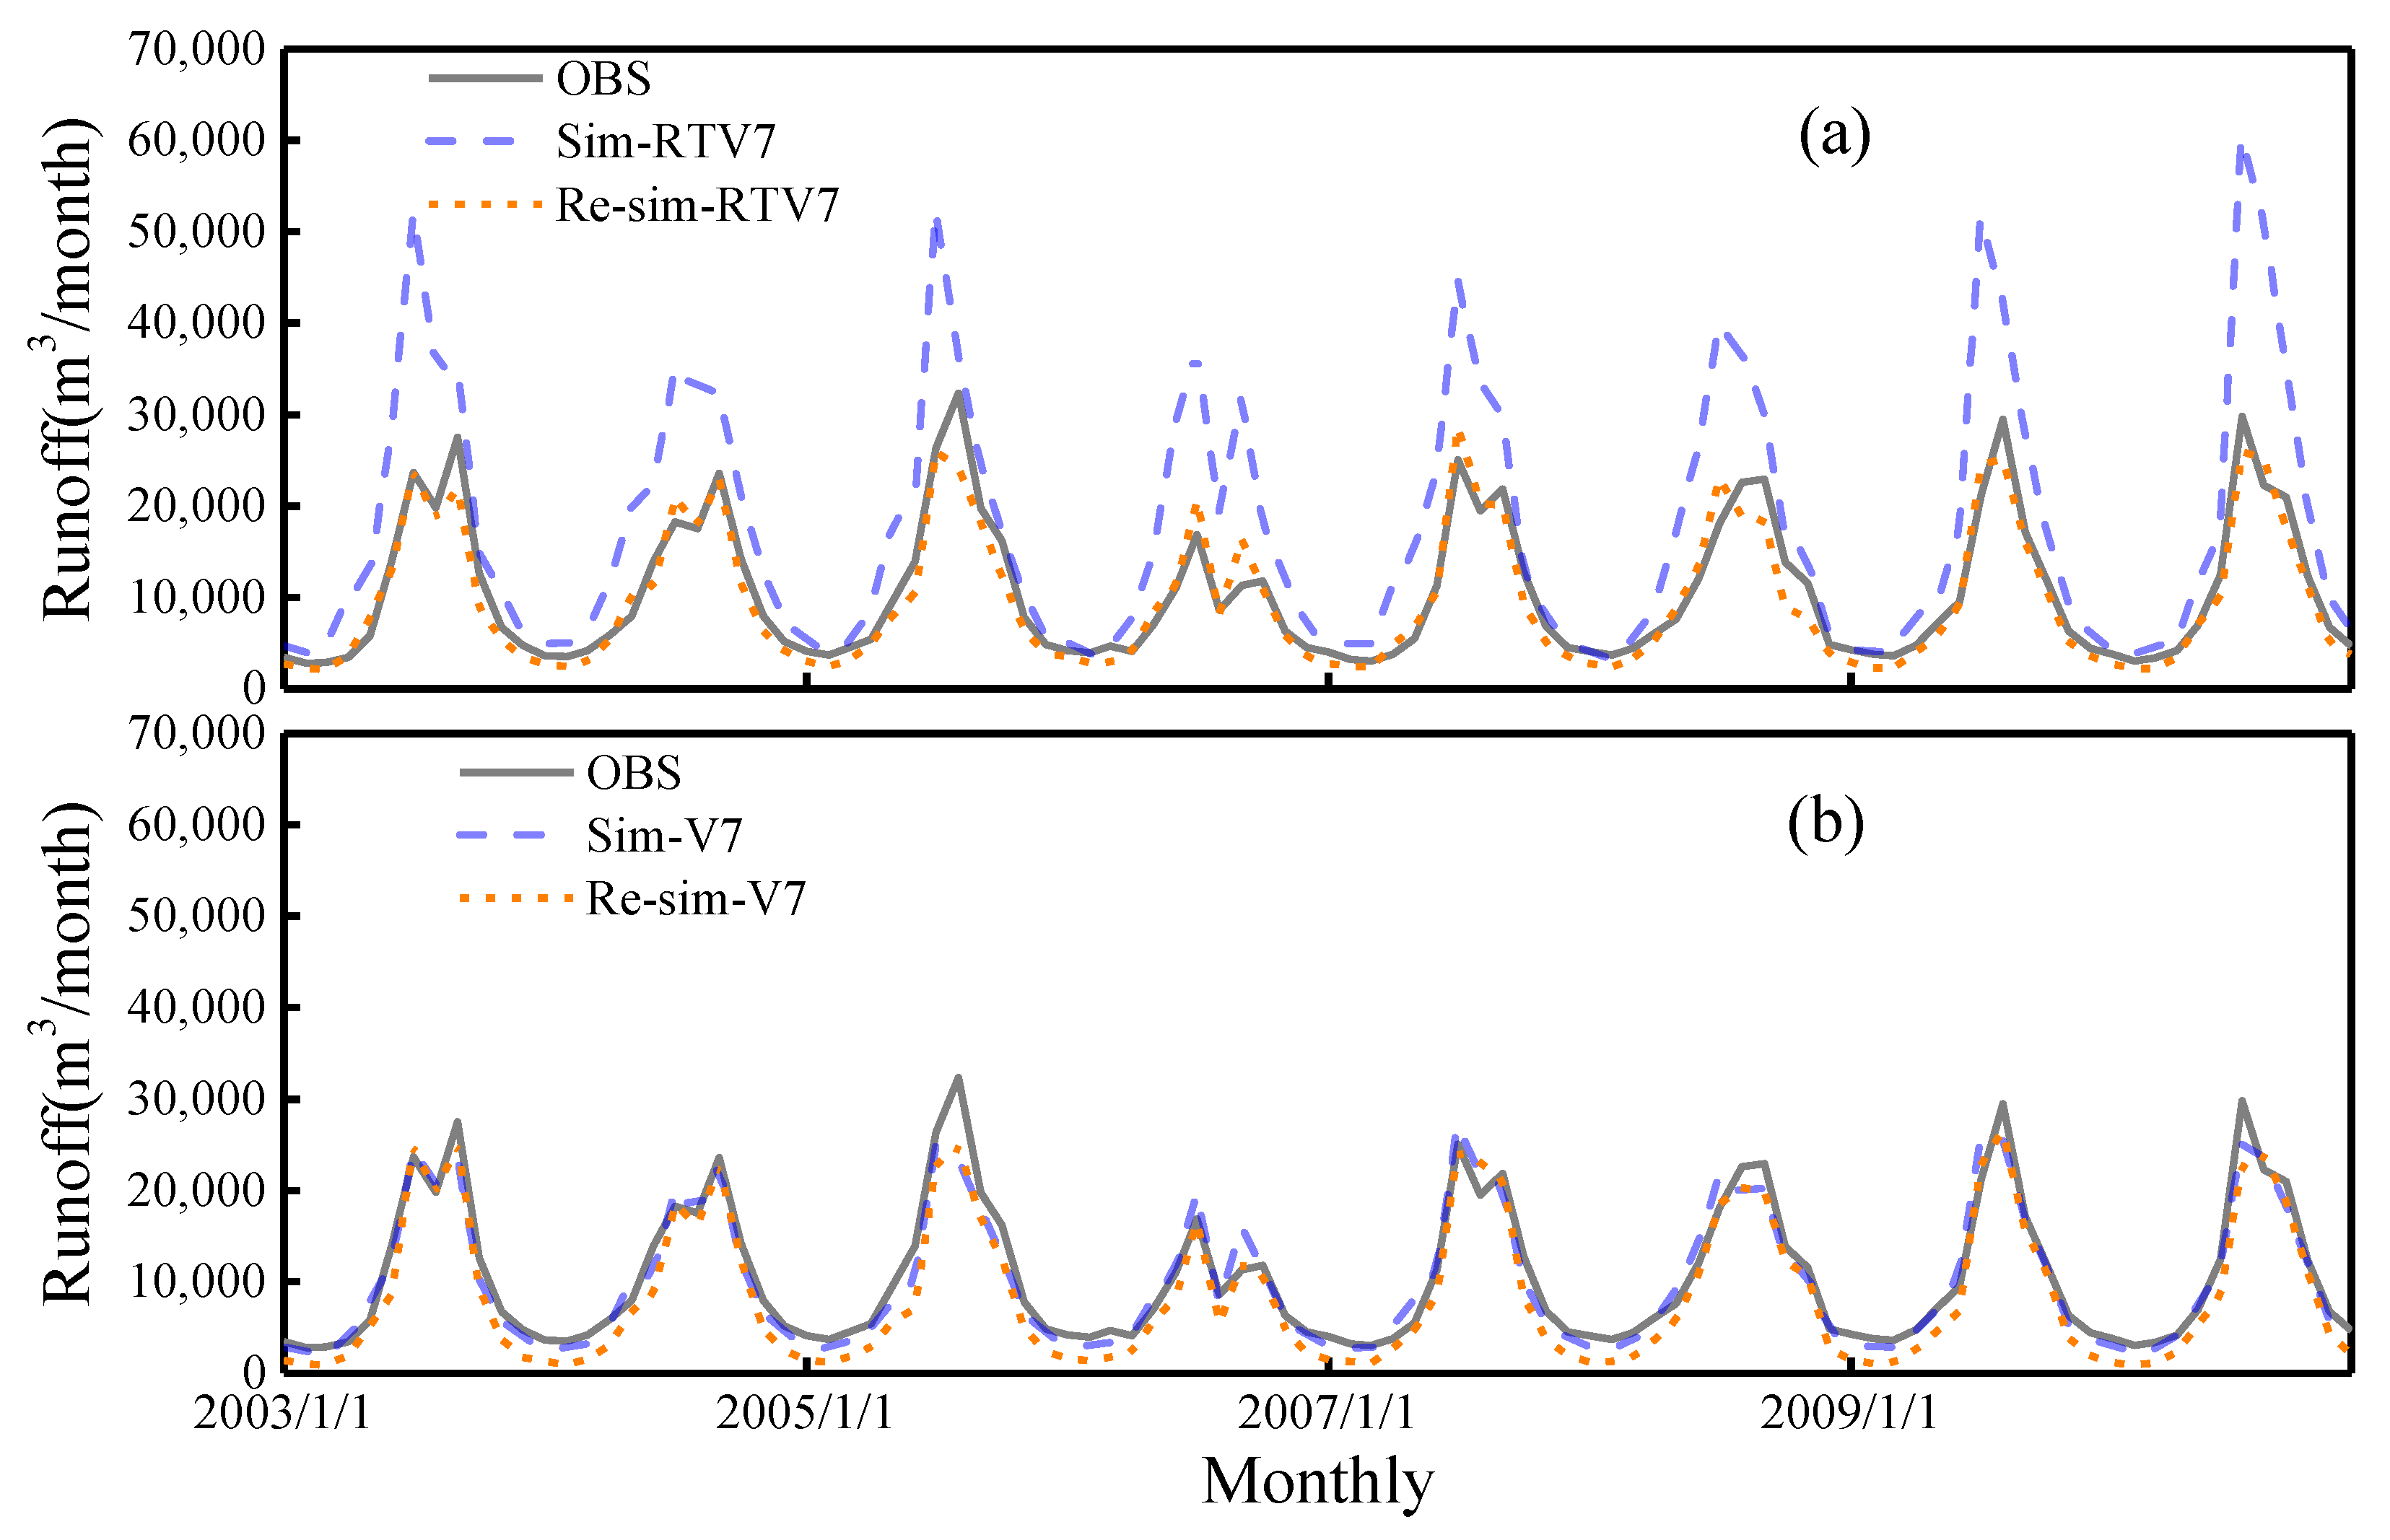
The VIC hydrological model has good adaptability in hydrological simulation in the upper reaches of the Yangtze River. The simulated runoff using the VIC hydrological model has a good correlation with the gauged runoff at daily/monthly time scales using the gauged precipitation for parameter calibration. The NSCE value was as high as 0.85, the RB was −6.36% and the CC value was 0.93 at daily scales, while the NSCE and CC rose to 0.95 and 0.98 at monthly scales, respectively. The VIC model simulation results indicated that it was reliable in runoff simulation over the upper Yangtze River basin. When using 3B42RTV7/V7 as the input data, the 3B42V7-driven runoff simulation agreed well with the gauged runoff, where the CC was 0.90, the RB was −5.78 and the NSCE was 0.79 at the daily scale. Although the 3B42RTV7-driven runoff simulation had a good correlation with the gauged runoff (CC = 0.85/daily, 0.93/monthly), it over-simulated the gauged runoff with a significant bias (RB = 66.58%/daily, 66.61%/monthly), and the NSCE was −0.92/daily and −0.81/monthly.
(3)
The accuracy of the 3B42RTV7-driven runoff simulation (daily/monthly) had been improved by using the hydrological calibration parameters obtained from 3B42RTV7 compared with parameters obtained from the gauged precipitation. The NSCE rose from −0.92 to 0.71, the RB decreased from 66.58% to 14.38% and the CC rose from 0.85 to 0.87 at daily time scales. However, the performance of the 3B42V7-driven runoff simulation (daily/monthly) was not improved in the same operation accordingly. In particular, the negative RB increased from −5.78% to −19.17% and from −5.75 to −20.90 at daily and monthly time scales, respectively. The outcomes of this work suggest that it might be better to calibrate the parameters using satellite data in hydrological simulations, especially for unadjusted satellite data. It also provides a reference for the application of satellite data to hydrological simulations in other river basins of the world, especially in regions lacking gauged data.

Author Contributions

Z.Z. provided the datasets including the required supporting software needed for the analyses; B.Z., Z.Z., S.C. and Z.D. cooperated in designing and improving the concept of the research project and related processes; B.Z., R.K., J.T., Y.Z. and Y.H. conducted the data processing and analysis. All the authors participated actively in preparing and reviewing the manuscript. All authors have read and agreed to the published version of the manuscript.

Funding

This research was funded by National Key Research and Development Project of China (Grant No. 2019YFC0409004) and National Natural Science Foundation of China (Grant No. 41971025).

Acknowledgments

This paper is financially supported by National Key Research and Development Project of China (Grant No. 2019YFC0409004) and National Natural Science Foundation of China (Grant No. 41971025) and the Priority Academic Program Development of Jiangsu Higher Education Institutions (PAPD). We would like to thank the National Climate Centre in Beijing for providing valuable climate datasets.

Conflicts of Interest

The authors declare no conflict of interest.

References

  1. Duan, Z.; Bastiaanssen, W.G.M. First results from Version 7 TRMM 3B43 precipitation product in combination with a new downscaling-calibration procedure. Remote Sens. Environ. 2013, 131, 1–13. [Google Scholar] [CrossRef]
  2. Zhao, X.; Sun, Y.; Zhao, C.; Jiang, H. Impact of precipitation with different intensity on PM2.5 over typical regions of China. Atmosphere 2020, 11, 906. [Google Scholar] [CrossRef]
  3. Marzano, F.S.; Cimini, D.; Montopoli, M. Investigating precipitation microphysics using ground-based microwave remote sensors and disdrometer data. Atmos. Res. 2010, 97, 583–600. [Google Scholar] [CrossRef]
  4. Bohnenstengel, S.I.; Schlünzen, K.H.; Beyrich, F. Representativity of in situ precipitation measurements—A case study for the LITFASS area in North-Eastern Germany. J. Hydrol. 2011, 400, 387–395. [Google Scholar] [CrossRef]
  5. Su, Y.; Zhao, C.; Wang, Y.; Ma, Z. Spatiotemporal variations of precipitation in china using surface gauge observations from 1961 to 2016. Atmosphere 2020, 11, 303. [Google Scholar] [CrossRef] [Green Version]
  6. Zhang, X.; Srinivasan, R. GIS-based spatial precipitation estimation: A comparison of geostatistical approaches. J. Am. Water Resour. 2009, 45, 894. [Google Scholar] [CrossRef]
  7. Sun, Y.; Zhao, C.; Su, Y.; Ma, Z.; Li, J.; Letu, H.; Yang, Y.; Fan, H. Distinct impacts of light and heavy precipitation on PM2.5 mass concentration in Beijing. Earth Space Sci. 2019, 6, 1915–1925. [Google Scholar] [CrossRef] [Green Version]
  8. Zhao, C.; Garrett, T.J. Ground-based remote sensing of precipitation in the Arctic. J. Geophys. Res. Atmos. 2008, 113, D14204. [Google Scholar] [CrossRef] [Green Version]
  9. Li, X.; Zhang, Q.; Xu, C. Suitability of the TRMM satellite rainfalls in driving a distributed hydrological model for water balance computations in Xinjiang catchment, Poyang lake basin. J. Hydrol. 2012, 426–427, 28–38. [Google Scholar] [CrossRef]
  10. Arkin, P.A.; Ardanuy, P.E. Estimating climatic-scale precipitation from space: A review. J. Clim. 1989, 2, 1229–1238. [Google Scholar] [CrossRef] [Green Version]
  11. Zhao, C.; Lin, Y.; Wu, F.; Wang, Y.; Li, Z.; Rosenfeld, D.; Wang, Y. Enlarging rainfall area of tropical cyclones by atmospheric aerosols. Geophys. Res. Lett. 2018, 45, 8604–8611. [Google Scholar] [CrossRef] [Green Version]
  12. Nair, S.; Srinivasan, G.; Nemani, R. Evaluation of multi-satellite TRMM derived rainfall estimates over a western state of India. J. Meteorol. Soc. Jpn. 2009, 87, 927–939. [Google Scholar] [CrossRef] [Green Version]
  13. Vrieling, A.; Sterk, G.; de Jong, S.M. Satellite-based estimation of rainfall erosivity for Africa. J. Hydrol. 2010, 395, 235–241. [Google Scholar] [CrossRef]
  14. Wang, G.; Zhang, P.; Liang, L.; Zhang, S. Evaluation of precipitation from CMORPH, GPCP-2, TRMM 3B43, GPCC, and ITPCAS with ground-based measurements in the Qinling-Daba Mountains, China. PLoS ONE 2017, 12, e185147. [Google Scholar] [CrossRef] [PubMed] [Green Version]
  15. Mehran, A.; AghaKouchak, A. Capabilities of satellite precipitation datasets to estimate heavy precipitation rates at different temporal accumulations. Hydrol. Process 2014, 28, 2262–2270. [Google Scholar] [CrossRef]
  16. Dinku, T.; Ceccato, P.; Grover Kopec, E.; Lemma, M.; Connor, S.J.; Ropelewski, C.F. Validation of satellite rainfall products over East Africa’s complex topography. Int. J. Remote Sens. 2007, 28, 1503–1526. [Google Scholar] [CrossRef]
  17. Naumann, G.; Barbosa, P.; Carrao, H.; Singleton, A.; Vogt, J. Monitoring drought conditions and their uncertainties in Africa using TRMM data. J. Appl. Meteorol. Clim. 2012, 51, 1867–1874. [Google Scholar] [CrossRef] [Green Version]
  18. Zhu, H.; Li, Y.; Huang, Y.; Li, Y.; Hou, C.; Shi, X. Evaluation and hydrological application of satellite-based precipitation datasets in driving hydrological models over the Huifa river basin in Northeast China. Atmos. Res. 2018, 207, 28–41. [Google Scholar] [CrossRef]
  19. Habib, E.; Henschke, A.; Adler, R.F. Evaluation of TMPA satellite-based research and real-time rainfall estimates during six tropical-related heavy rainfall events over Louisiana, USA. Atmos. Res. 2009, 94, 373–388. [Google Scholar] [CrossRef]
  20. Zhang, Z.; Tian, J.; Huang, Y.; Chen, X.; Chen, S.; Duan, Z. Hydrologic evaluation of TRMM and GPM IMERG Satellite-based Precipitation in a Humid Basin of China. Remote Sens. 2019, 11, 431. [Google Scholar] [CrossRef] [Green Version]
  21. Krishnaswamy, J. Remote Sensing-Based Rainfall Estimates in Data-Scarce Himalaya: Performance Assessment of TRMM_3B42v7, TRMM_3B42RT v7 & GPM_3IMERGHH v03 Using Ground Rainfall and Stream Hydrographs in Sikkim Himalaya, India; In Proceedings of the Fall Meeting 2016; American Geophysical Union: San Francisco, CA, USA, 2016. [Google Scholar]
  22. Tang, G.; Li, Z.; Xue, X.; Hu, Q.; Yong, B.; Hong, Y. A study of substitutability of TRMM remote sensing precipitation for gauge-based observation in Ganjiang River basin. Adv. Water Sci. 2015, 26, 340–346. [Google Scholar]
  23. Hao, Z.; Tong, K.; Liu, X.; Zhang, L. Capability of TMPA products to simulate streamflow in upper Yellow and Yangtze River basins on Tibetan Plateau. Water Sci. Eng. 2014, 7, 237–249. [Google Scholar]
  24. Tang, G.; Zeng, Z.; Long, D.; Guo, X.; Yong, B.; Zhang, W.; Hong, Y. Statistical and hydrological comparisons between TRMM and GPM level-3 products over a Mid-latitude Basin: Is day-1 IMERG a good successor for TMPA 3B42V7? J. Hydrometeorol. 2015, 17, 121–137. [Google Scholar] [CrossRef]
  25. Huffman, G.J.; Bolvin, D.T.; Braithwaite, D.; Hsu, K.L.; Xie, P. Integrated Multi-Satellite Retrievals for the Global Precipitation Measurement (GPM) Mission (IMERG); In Proceedings of the Satellite Precipitation Measurement; Springer: Cham, Germany, 2020; pp. 343–353. [Google Scholar]
  26. Islam, M.; Uyeda, H. Use of TRMM in determining the climatic characteristics of rainfall over Bangladesh. Remote Sens. Environ. 2007, 108, 264–276. [Google Scholar] [CrossRef]
  27. Xue, X.; Hong, Y.; Limaye, A.S.; Gourley, J.J.; Huffman, G.J.; Khan, S.I.; Dorji, C.; Chen, S. Statistical and hydrological evaluation of TRMM-based Multi-satellite Precipitation Analysis over the Wangchu Basin of Bhutan: Are the latest satellite precipitation products 3B42V7 ready for use in ungauged basins? J. Hydrol. 2013, 499, 91–99. [Google Scholar] [CrossRef]
  28. Zhaochen, L.; Meixue, Y.; Xuejia, W.; Lizhen, C. The GPM and TRMM satellite-based precipitation products applied in the source regions of the Yellow River. J. Glaciol. Geocryol. 2020, 42, 575–586. [Google Scholar]
  29. Tan, M.; Duan, Z. Assessment of GPM and TRMM Precipitation Products over Singapore. Remote Sens. 2017, 9, 720. [Google Scholar] [CrossRef] [Green Version]
  30. Guo, H.; Chen, S.; Bao, A.; Behrangi, A.; Hong, Y.; Ndayisaba, F.; Hu, J.; Stepanian, P.M. Early assessment of integrated multi-satellite retrievals for global precipitation measurement over China. Atmos. Res. 2016, 176–177, 121–133. [Google Scholar] [CrossRef]
  31. Tang, G.; Ma, Y.; Long, D.; Zhong, L.; Hong, Y. Evaluation of GPM Day-1 IMERG and TMPA Version-7 legacy products over Mainland China at multiple spatiotemporal scales. J. Hydrol. 2016, 533, 152–167. [Google Scholar] [CrossRef]
  32. Tong, K.; Su, F.; Yang, D.; Hao, Z. Evaluation of satellite precipitation retrievals and their potential utilities in hydrologic modeling over the Tibetan Plateau. J. Hydrol. 2014, 519, 423–437. [Google Scholar] [CrossRef]
  33. Hughes, D.A.; Andersson, L.; Wilk, J.; Savenije, H.H.G. Regional calibration of the Pitman model for the Okavango River. J. Hydrol. 2006, 331, 30–42. [Google Scholar] [CrossRef]
  34. Su, F.; Hong, Y.; Lettenmaier, D.P. Evaluation of TRMM Multisatellite Precipitation Analysis (TMPA) and its utility in hydrologic prediction in the La Plata Basin. J. Hydrometeorol. 2008, 9, 622–640. [Google Scholar] [CrossRef] [Green Version]
  35. Tobin, K.J.; Bennett, M.E. Using SWAT to model streamflow in two river basins with ground and satellite precipitation data1. J. Am. Water Resour. 2009, 45, 253–271. [Google Scholar] [CrossRef]
  36. Jiang, S.; Ren, L.; Hong, Y.; Yong, B.; Yang, X.; Yuan, F.; Ma, M. Comprehensive evaluation of multi-satellite precipitation products with a dense rain gauge network and optimally merging their simulated hydrological flows using the Bayesian model averaging method. J. Hydrol. 2012, 452–453, 213–225. [Google Scholar] [CrossRef]
  37. Wang, B.; Jin, S. Study on the feasibility of rainfall measuring productsbase on satellite remote sensing in the source region of Yellow River. J. Qinghai Univ. 2020, 38, 78–85. [Google Scholar]
  38. Adler, R.F.; Wang, J.; Gu, G.; Huffman, G.J. A ten-year tropical rainfall climatology based on a composite of TRMM products. J. Meteorol. Soc. Jpn. 2009, 87A, 281–293. [Google Scholar] [CrossRef] [Green Version]
  39. Fengying, Z.; Zengxin, Z.; Jiaxi, T.; Richao, H.; Kong, R.; Bin, Z.; Zhu, M.; Wang, Y.; Chen, X. Forest NPP simulation in the Yangtze River Basin and its response to climate change. J. Nanjing For. Univ. (Nat. Sci. Ed.) 2020, 1–7. [Google Scholar]
  40. Long, D.; Yang, Y.; Wada, Y.; Hong, Y.; Liang, W.; Chen, Y.; Yong, B.; Hou, A.; Wei, J.; Chen, L. Deriving scaling factors using a global hydrological model to restore GRACE total water storage changes for China’s Yangtze River Basin. Remote Sens. Environ. 2015, 168, 177–193. [Google Scholar] [CrossRef]
  41. Guan, Y.; Zhang, X.; Zheng, F.; Wang, B. Trends and variability of daily temperature extremes during 1960–2012 in the Yangtze River Basin, China. Glob. Planet. Chang. 2015, 124, 79–94. [Google Scholar] [CrossRef] [Green Version]
  42. Li, Q.; Liu, X.; Zhang, J. Changing trends of acid rain types in the Yangtze River Delta region. J. Nanjing For. Univ. (Nat. Sci. Ed.) 2020, 1–8. [Google Scholar]
  43. Kummerow, C.; Simpson, J.; Thiele, O.; Barnes, W.; Chang, A.T.C.; Stocker, E.; Adler, R.F.; Hou, A.; Kakar, R.; Wentz, F.; et al. The status of the Tropical Rainfall Measuring Mission (TRMM) after two years in orbit. J. Appl. Meteorol. 2000, 39, 1965–1982. [Google Scholar] [CrossRef]
  44. Chen, S.; Hong, Y.; Cao, Q.; Gourley, J.J.; Kirstetter, P.; Yong, B.; Tian, Y.; Zhang, Z.; Shen, Y.; Hu, J.; et al. Similarity and difference of the two successive V6 and V7 TRMM multisatellite precipitation analysis performance over China. J. Geophys. Res. Atmos. 2013, 118, 13060–13074. [Google Scholar] [CrossRef]
  45. Liang, X.; Lettenmaier; Wood, E.F.; Burges, S.J. A simple hydrologically based model of land surface water and energy fluxes for general circulation models. J. Geophys. Res. 1994, 99, 14415–14428. [Google Scholar] [CrossRef]
  46. Franchini, M.; Pacciani, M. Comparative analysis of several conceptual rainfall-runoff models. J. Hydrol. 1991, 122, 161–219. [Google Scholar] [CrossRef]
  47. Liang, X.; Wood, E.F.; Lettenmaier, D.P. Surface soil moisture parameterization of the VIC-2L model: Evaluation and modification. Glob. Planet. Chang. 1996, 13, 195–206. [Google Scholar] [CrossRef]
  48. Xu, L. A Two-Layer Variable Infiltration Capacity Land Surface Representation for General Circulation Models. Ph.D. Thesis, University of Washington, Washington, DC, USA, 1 May 1994. [Google Scholar]
  49. Ebert, E.E.; Janowiak, J.E.; Kidd, C. Comparison of near-real-time precipitation estimates from satellite observations and numerical models. Bull. Am. Meteorol. Soc. 2007, 88, 47–64. [Google Scholar] [CrossRef] [Green Version]
  50. El Kenawy, A.M.; Lopez-Moreno, J.I.; McCabe, M.F.; Vicente-Serrano, S.M. Evaluation of the TMPA-3B42 precipitation product using a high-density rain gauge network over complex terrain in northeastern Iberia. Glob. Planet. Chang. 2015, 133, 188–200. [Google Scholar] [CrossRef] [Green Version]
  51. Omranian, E.; Sharif, H.O. Evaluation of the Global Precipitation Measurement (GPM) satellite rainfall products over the lower Colorado River Basin, Texas. J. Am. Water. Resour. 2018, 54, 882–898. [Google Scholar] [CrossRef]
  52. Chang, J.; Zhang, Z.; Tian, J.; Chen, X.; Chen, Y. Spatio-temporal characteristics of grassland water use efficiency and its response to climate change in northwest China. J. Nanjing For. Univ. (Nat. Sci. Ed.) 2020, 44, 119–125. [Google Scholar]
  53. Xie, Z.; Yuan, F.; Duan, Q.; Zheng, J.; Liang, M.; Chen, F. Regional parameter estimation of the VIC land surface model: Methodology and application to river basins in China. J. Hydrometeorol. 2007, 8, 447–468. [Google Scholar] [CrossRef] [Green Version]
  54. Su, F.G.; Adam, J.C.; Bowling, L.C.; Lettenmaier, D.P. Streamflow simulations of the terrestrial Arctic domain. J. Geophys. Res. Atmos. 2005, 110. [Google Scholar] [CrossRef]
  55. Chen, C.; Yu, Z.; Li, L.; Yang, C. Adaptability evaluation of TRMM satellite rainfall and its application in the Dongjiang River Basin. Procedia Environ. Sci. 2011, 10, 396–402. [Google Scholar] [CrossRef] [Green Version]
  56. Yong, B.; Ren, L.; Hong, Y.; Wang, J.; Gourley, J.J.; Jiang, S.; Chen, X.; Wang, W. Hydrologic evaluation of Multisatellite Precipitation Analysis standard precipitation products in basins beyond its inclined latitude band: A case study in Laohahe basin, China. Water Resour. Res. 2010, 46. [Google Scholar] [CrossRef] [Green Version]
  57. Tian, Y.; Peters-Lidard, C.D. A global map of uncertainties in satellite-based precipitation measurements. Geophys. Res. Lett. 2010, 37. [Google Scholar] [CrossRef]
  58. Huffman, G.J.; Bolvin, D.T.; Nelkin, E.J.; Wolff, D.B.; Adler, R.F.; Gu, G.; Hong, Y.; Bowman, K.P.; Stocker, E.F. The TRMM Multisatellite Precipitation Analysis (TMPA): Quasi-global, multiyear, combined-sensor precipitation estimates at fine scales. J. Hydrometeorol. 2007, 8, 38–55. [Google Scholar] [CrossRef]
  59. Bai, A.J.; Liu, C.H.; Liu, X.D. Diurnal variation of summer rainfall over the Tibetan Plateau and its neighboring regions revealed by TRMM Multi-satellite Precipitation Analysis. Chin. J. Geophys. 2008, 51, 518–529. [Google Scholar] [CrossRef] [Green Version]
  60. Ward, E.; Buytaert, W.; Peaver, L.; Wheater, H. Evaluation of precipitation products over complex mountainous terrain: A water resources perspective. Adv. Water Resour. 2011, 34, 1222–1231. [Google Scholar] [CrossRef]
  61. Narayanan, M.S.; Shah, S.; Kishtawal, C.M.; Sathiyamoorthy, V.; Rajeevan, M.; Kriplani, R.H. Validation of TRMM merge daily rainfall with IMD raingauge analysis over Indian Land Mass. Tech. Rep. 2005, 87, 927–939. [Google Scholar]
  62. Chen, Y.; Ebert, E.E.; Walsh, K.J.E.; Davidson, N.E. Evaluation of TRMM 3B42 precipitation estimates of tropical cyclone rainfall using PACRAIN data. J. Geophys. Res. Atmos. 2013, 118, 2184–2196. [Google Scholar] [CrossRef]
  63. Huang, Y.H.; Zhang, Z.X.; Fei, M.Z.; Jin, Q. Hydrological evaluation of the TMPA multisatellite precipitation estimates over the Gangjiang basin. Resour. Environ. Yangtze Basin 2016, 10, 1618–1625. [Google Scholar]
  64. Nijssen, B.; Lettenmaier, D.P. Effect of precipitation sampling error on simulated hydrological fluxes and states: Anticipating the Global Precipitation Measurement satellites. J. Geophys. Res. 2004, 109, D2103. [Google Scholar] [CrossRef]
Figure 1. Location of the upper Yangtze River basin and 3 sub-basins.
Water 12 03230 g001
Figure 2. Spatial distribution of gauged precipitation and the Tropical Rainfall Measurement Mission (TRMM) Multi-satellite Precipitation Analysis (TMPA) precipitation for the annual mean value.
Water 12 03230 g002
Figure 3. The spatial distributions of relative bias percentage (%) from the TMPA RTV7/V7 precipitation against the gauged precipitation.
Water 12 03230 g003
Figure 4. Changes in the areal mean of precipitation from TMPA and gauged precipitation in the upper Yangtze reaches: (a) daily; (b) monthly; (c) annual.
Water 12 03230 g004
Figure 5. Statistical indices for different precipitation thresholds at the daily time scale: (a) probability of detection (POD); (b) critical success index (CSI); and (c) false alarm ratio (FAR).
Water 12 03230 g005
Figure 6. The runoff simulation in the upper Yangtze reaches using the VIC hydrological model: (a) daily; (b) monthly.
Water 12 03230 g006aWater 12 03230 g006b
Figure 7. Comparison of monthly accumulated average runoff.
Water 12 03230 g007
Figure 8. Scatter plots of the gauged and simulated runoff by using VIC hydrological models in the upper Yangtze River basin: (a) driven by 3B42TRV7 using the parameters obtained from 3B42RTV7; (b) driven by 3B42RTV7 using the parameters obtained from the gauged precipitation; (c) driven by 3B42V7 using the parameters obtained from 3B42V7; and (d) driven by 3B42V7 using the parameters obtained from gauged precipitation.
Water 12 03230 g008
Figure 9. Comparison of gauged and simulated runoff based on the TMPA 3B42RTV7 and TMPA 3B42V7 precipitation products by using the VIC hydrological model in the upper Yangtze reaches from 2003 to 2010 at daily scale. (a) Simulated runoff using the parameters obtained from the gauged precipitation and TMPA 3B42RTV7; (b) simulated runoff using the parameters obtained from the gauged precipitation and TMPA 3B42V7.
Water 12 03230 g009
Figure 10. The VIC model driven by the upper reaches of the Yangtze River and the TMPA 3B42RTV7/V7 precipitation products used to obtain different parameters from 2003 to 2010 at monthly scales: (a) TMPA 3B42RTV7 simulated runoff based on the calibration parameters obtained from the gauged precipitation and TMPA 3B42RTV7; (b) TMPA 3B42V7 simulated runoff based on the calibration parameters obtained from the gauged precipitation and TMPA 3B42V7.
Water 12 03230 g010
Table 1. Statistical summary of the comparison of the precipitation estimates between TMPA 3B42RTV7/V7 products and the gauged precipitation for daily/monthly time scales in the upper Yangtze River (relative bias (RB), correlation coefficient (CC) and root mean square error (RMSE)).
Precipitation ProductDailyMonthly
RB (%)RMSE (mm)CCRB (%)RMSE (mm)CC
TMPA 3B42RTV734.682.20.8434.711108.30.97
TMPA 3B42V7−6.241.10.92−6.21196.20.99
Table 2. The variable infiltration capacity (VIC) model calibrated parameters and calibrated values in the upper Yangtze River basin.
ParametersDefinitionValue RangeCalibration Value
OBS3B42RTV73B42V7
BVariable infiltration curve parameter (binfilt)0–0.40.40.18720.4
WsFraction of maximum soil moisture where a non-linear base flow occurs0–1.00.20080.60040.2008
DsFraction of Dsmax where a non-linear base flow begins0–1.00.010.0011
DsmaxMaximum velocity of the baseflow (mm/day)0–306.0084.00912.006
d1Thickness of each soil moisture layer (m)0.1–2.00.010.010.01
d20.10.60670.1
d31.2421.8733
Table 3. The definition of the simulated runoff driven by TMPA 3B42TRV7/V7 using different hydrological parameters in the upper Yangtze reaches.
Simulated RunoffDriven by the PrecipitationHydrological Parameters
RRTV7_RTV73B42RTV73B42RTV7
RRTV7_OBS3B42RTV7Gauged
RV7_V73B42V73B42V7
RV7_OBS3B42V7Gauged
Table 4. The statistical summary of the simulated runoff driven by TMPA 3B42TRV7/V7 using different hydrological parameters in the upper Yangtze reaches (relative bias (RB), correlation coefficient (CC) and the Nash–Sutcliffe coefficient of efficiency (NSCE)).
Hydrological ParametersDriven by the PrecipitationDailyMonthly
RB (%)CCNSCERB (%)CCNSCE
Gauged3B42RTV766.580.85−0.9266.610.93−0.81
3B42RTV73B42RTV714.380.870.7114.410.950.86
Gauged3B42V7−5.780.900.79−5.750.970.94
3B42V73B42V7−19.170.870.73−20.900.970.87
Publisher’s Note: MDPI stays neutral with regard to jurisdictional claims in published maps and institutional affiliations.

