Water Resources for Sustainable Healthy Diets: State of the Art and Outlook


Abstract
1. Introduction
2. Current Research State
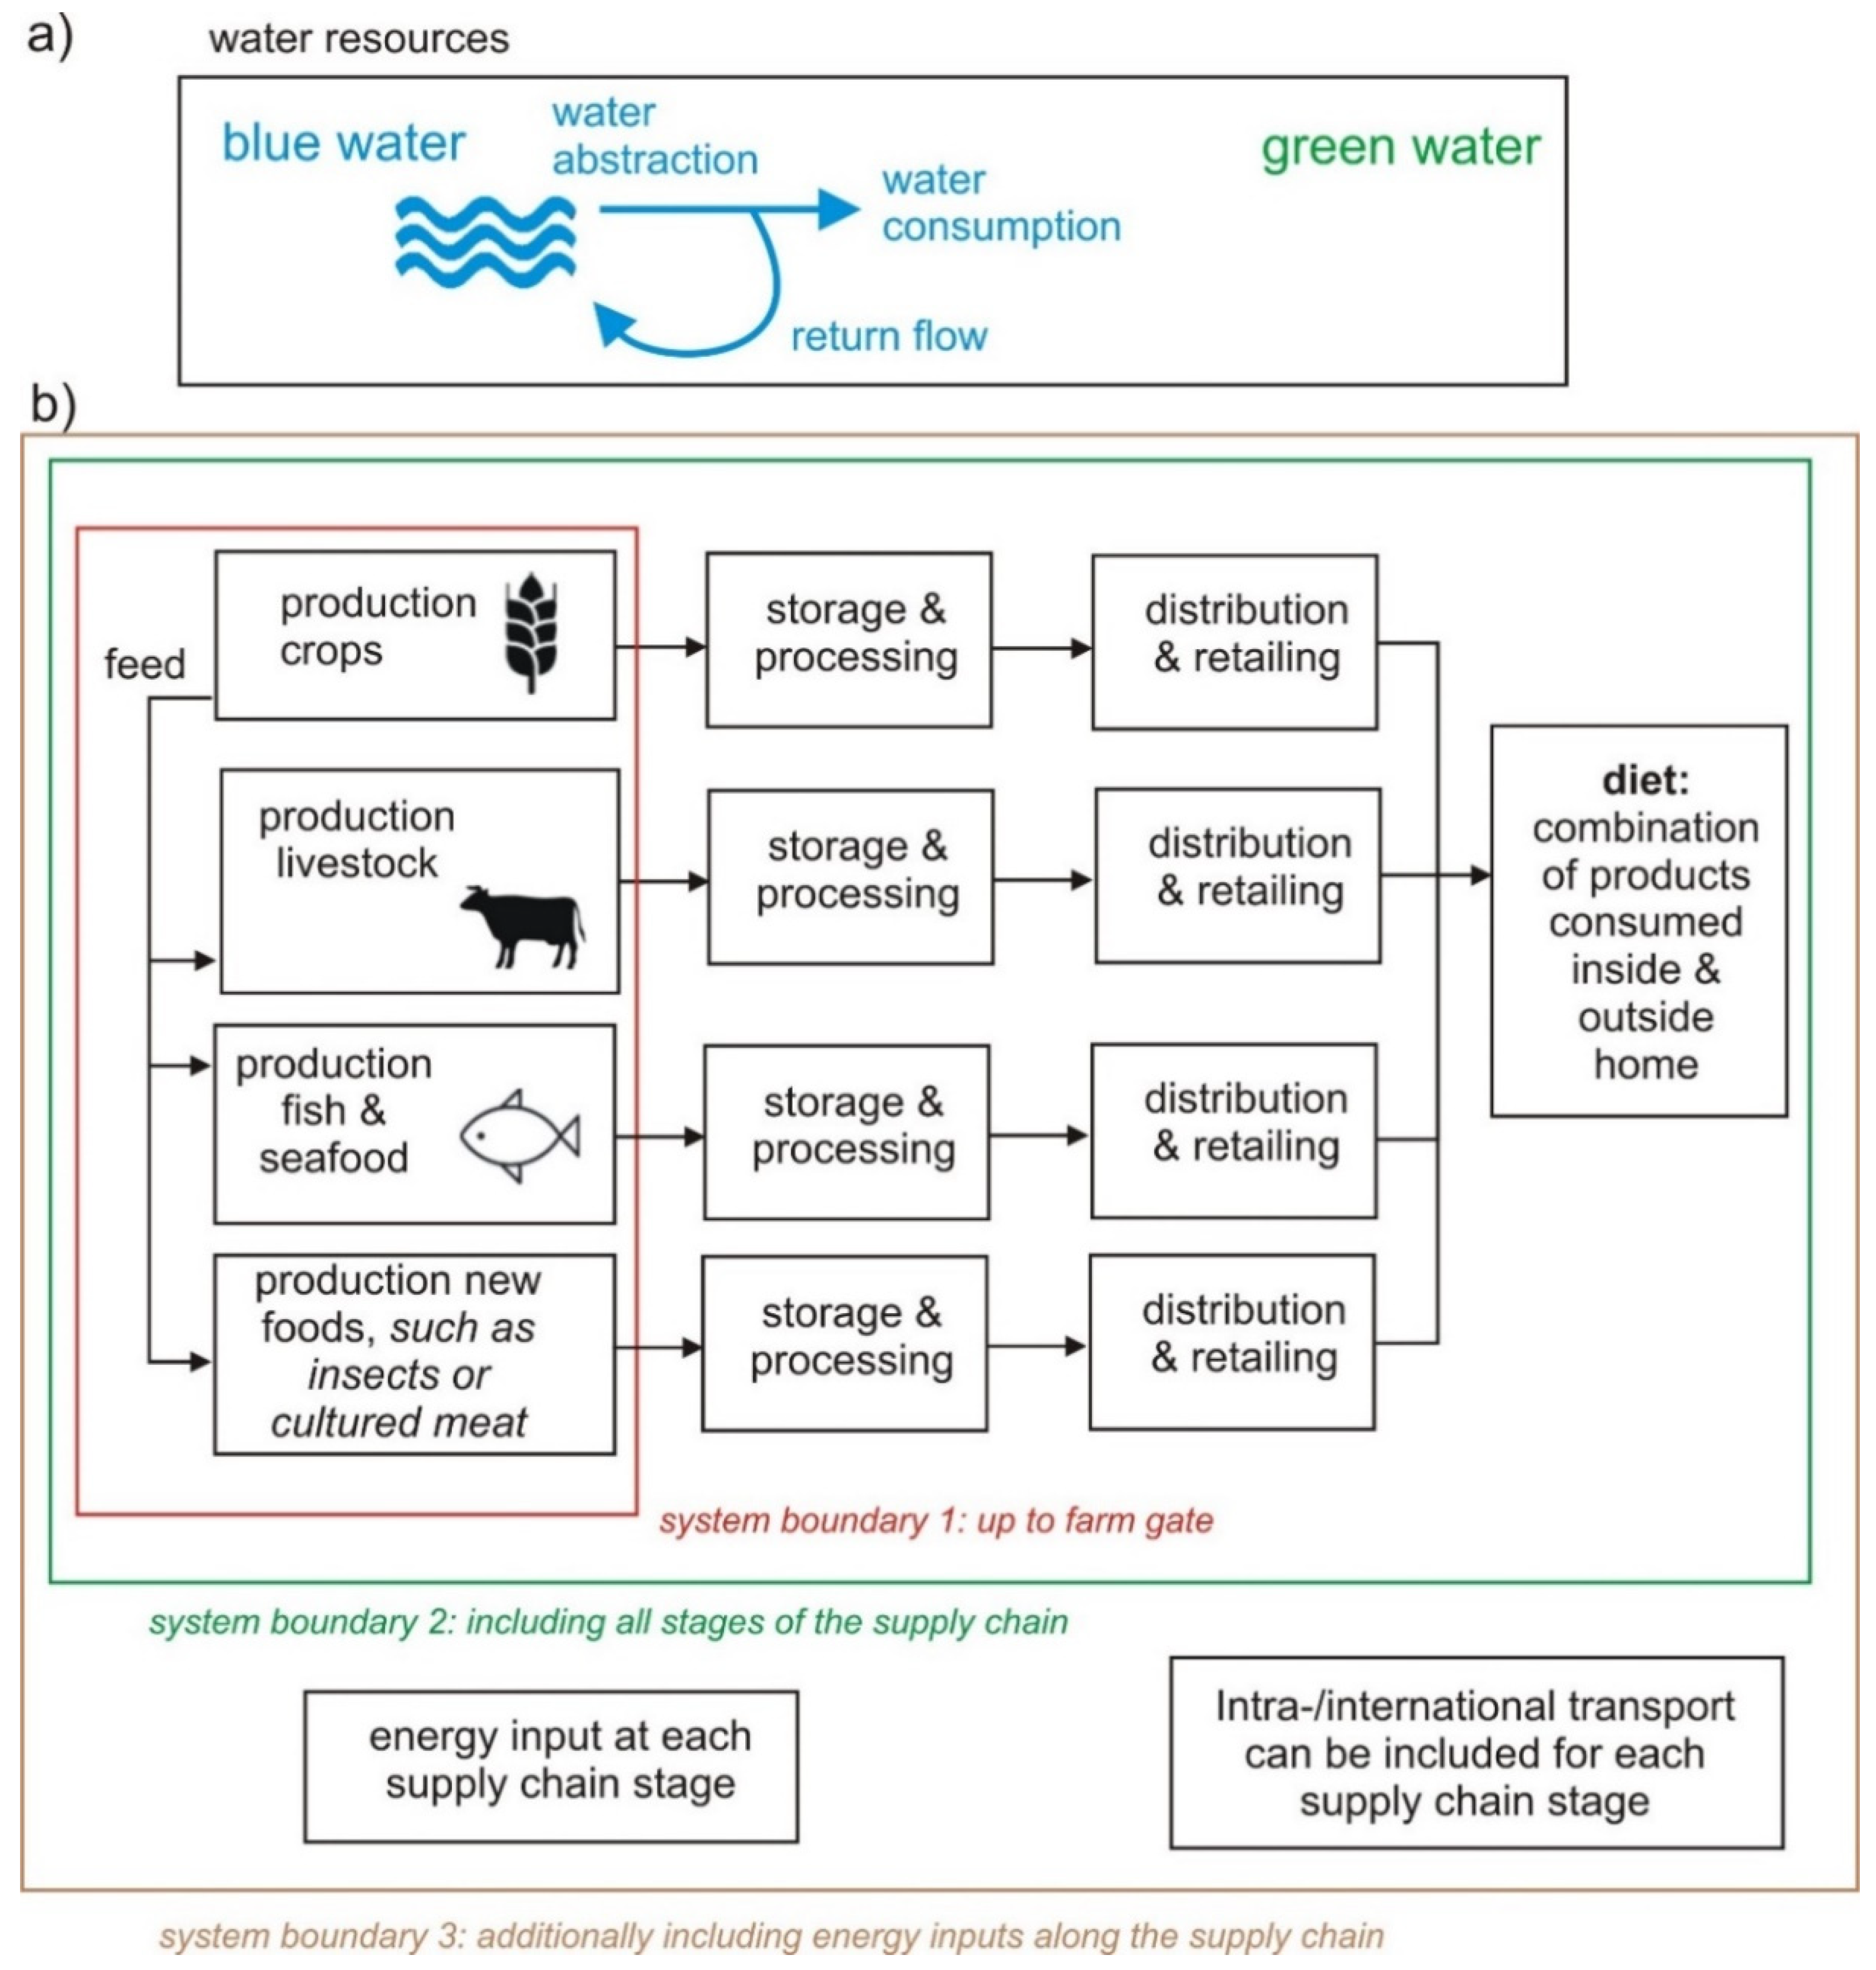
2.1. Blue and Green Water Resources Used in the Supply Chain of Food Products Providing a Healthy Diet
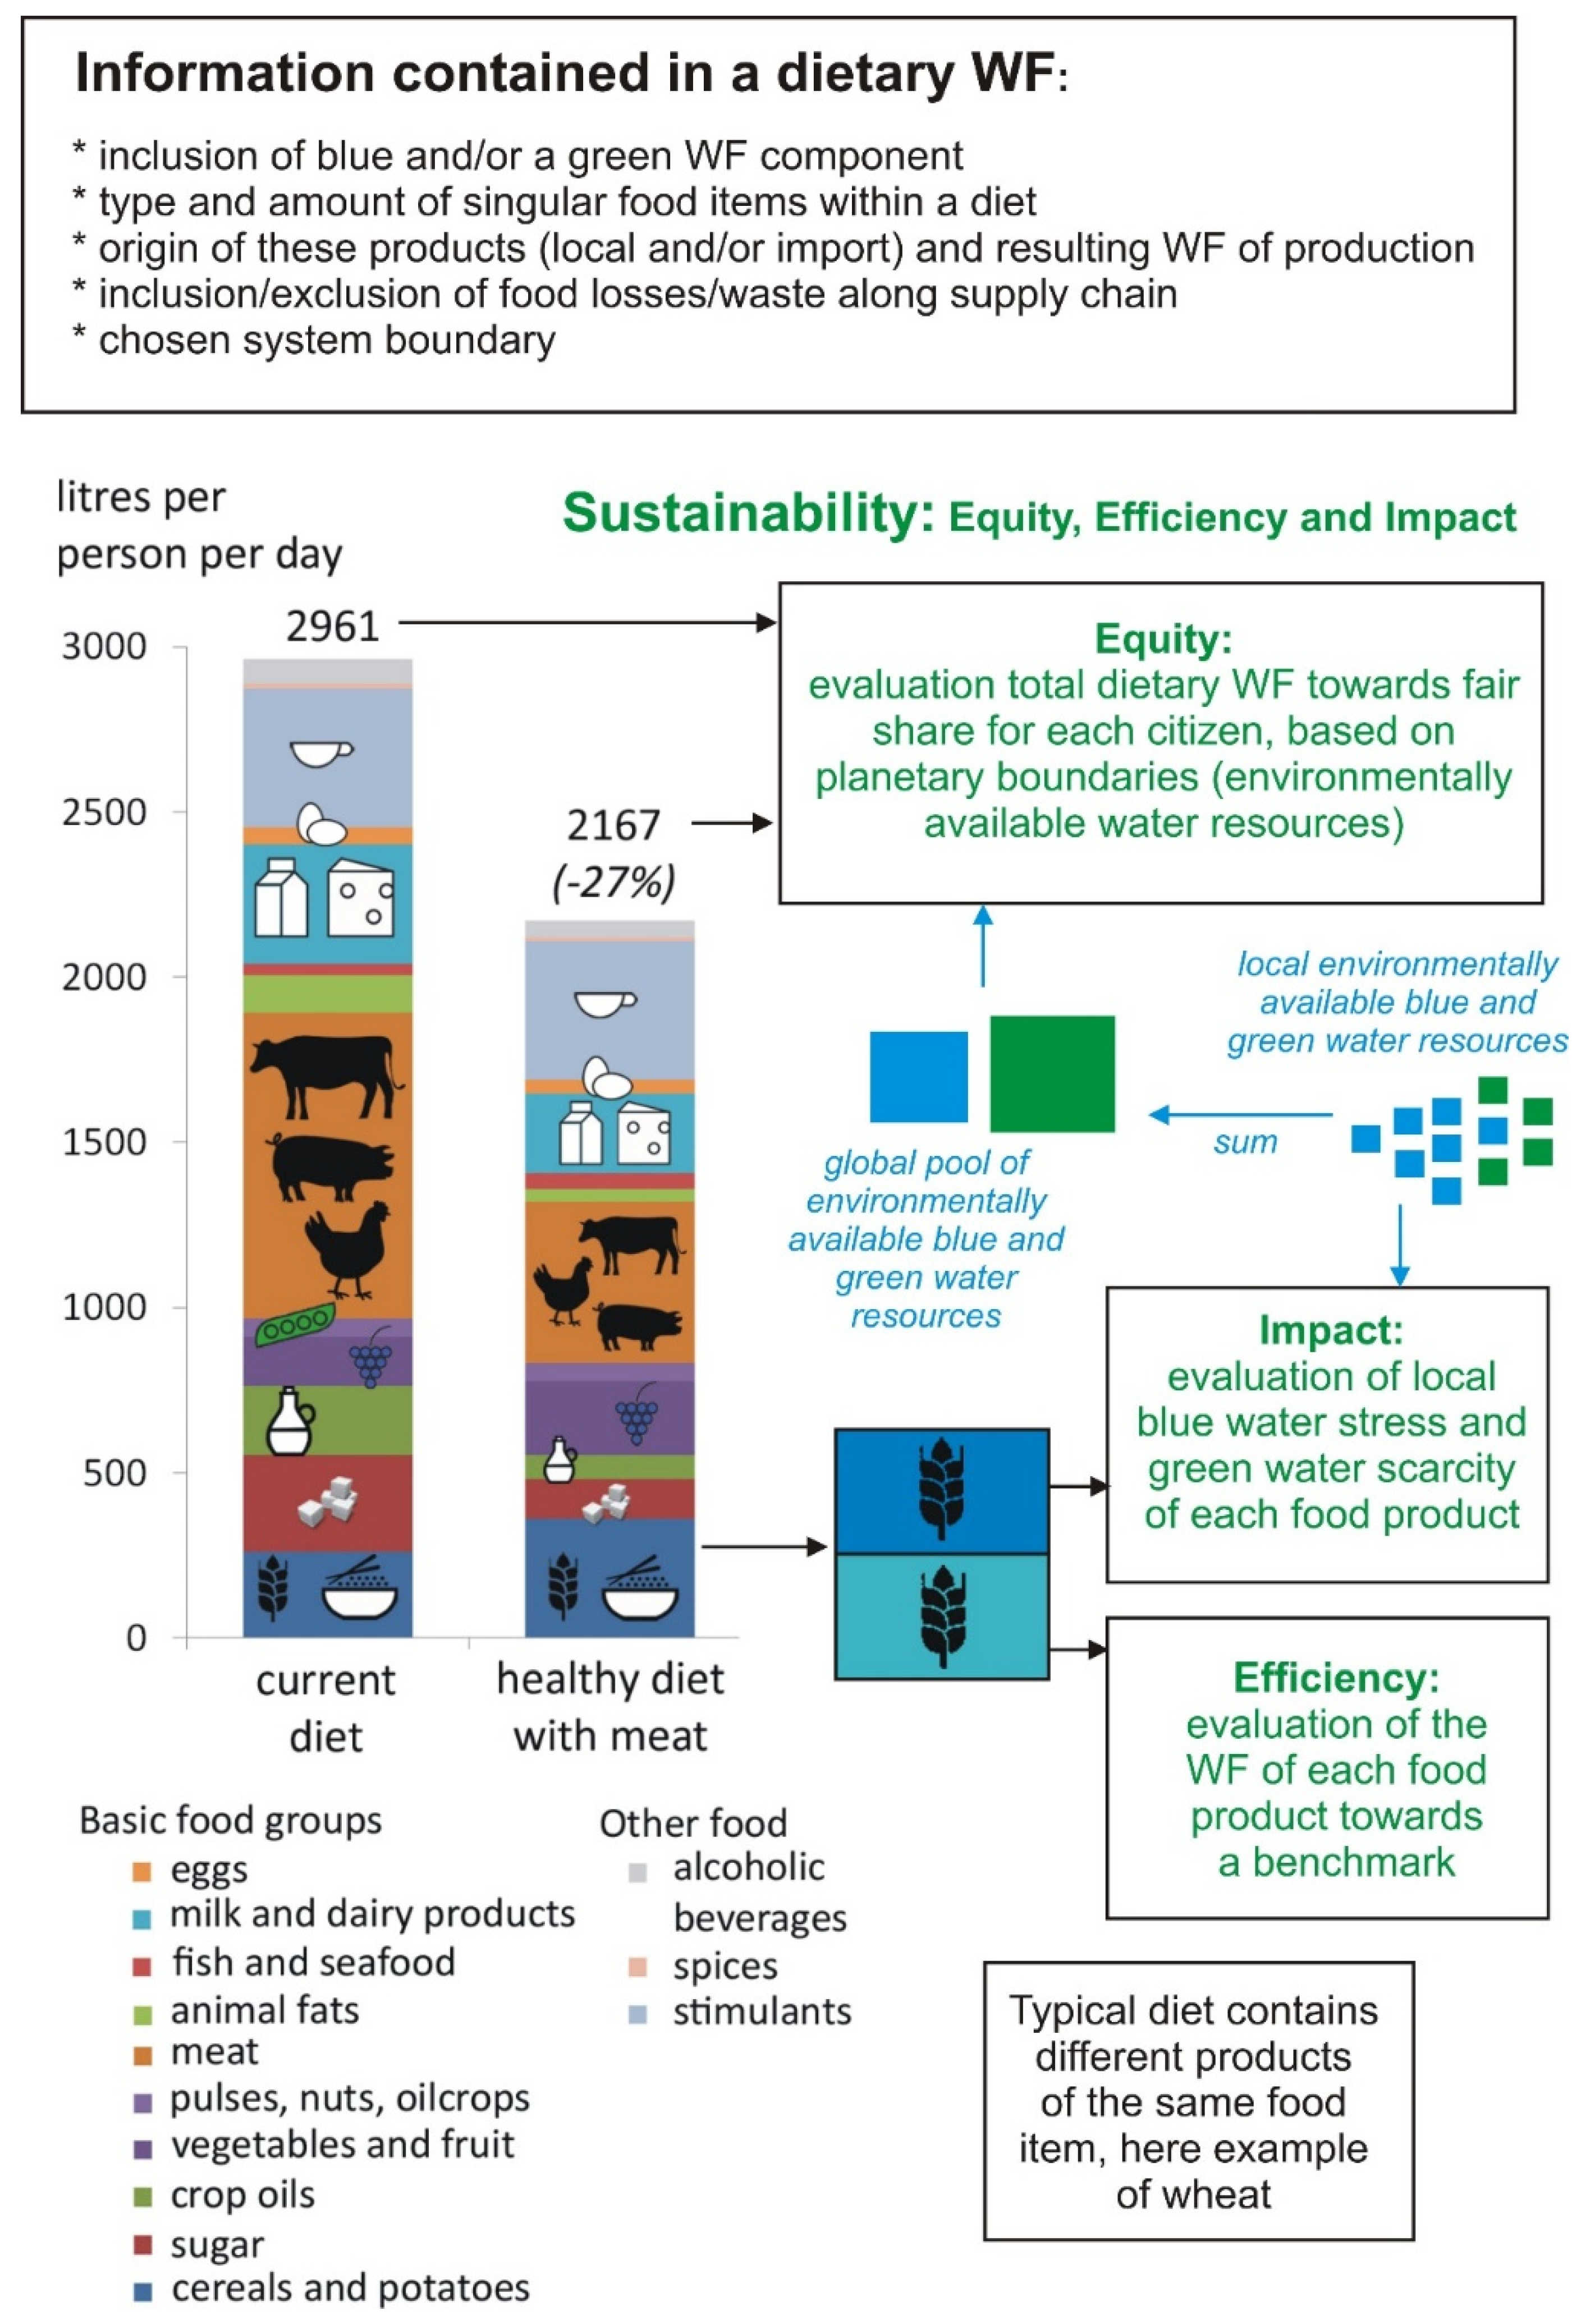
2.2. Embedded Information and Environmental Sustainability of a Dietary WF
- The inclusion of blue and/or a green WF component. Studies in the literature report on only the blue WF, the blue and green WF and the total WF (green plus blue) [33].
- The type and amount of singular food items within a diet, thereby identifying a healthy or unhealthy diet from a nutrition perspective (calories, protein, fats, macro- and micronutrients).
- The origin of these products (local and/or import) and associated WF of production. The latter is the result of production methods (irrigated versus rainfed, conservation agriculture, nutrient application etc.) and resulting yield, and agroclimatological conditions (soil, climate, etc.).
- The inclusion or exclusion of food losses and waste along the supply chain.
- The choice of system boundary (three selected choices are presented in Figure 1).
- Equity: the evaluation of a total dietary WF towards a fair share of globally available blue and green water resources for each global citizen. WF amounts above this share are considered unsustainable. Local environmentally available blue water resources (available blue water resources minus environmental flows as well as sustainably available groundwater resources) [3,8,23,38] are scaled up to river basins [39] and ultimately a global pool/planetary boundary of blue water [23,40,41], as conceptually displayed in Figure 2. In addition, green water availability is scaled up to a planetary boundary [4,23]. Fair shares are generally defined as per capita equivalents to the global pool of water resources, although other distribution methods exist [42,43]. As already pointed out by Hoekstra [44], this per capita fair share will decrease due to population growth. In order for a diet to remain within such a fair share, substitution of water-intensive products such as animal products into less water-intensive products such as most vegetal products may be needed. Indeed, healthy diets with less or different animal products have lower total green plus blue WFs [34,45]. When only accounting for the blue or green component separately, this observation is more differentiated [33]. A more comprehensive discussion on this topic is included in Section 3.2.
2.3. Geographical Coverage, Data Used and Modelling Approaches
- Many studies use FAO Food Balance Sheet (FBS) data [14,45], which have the advantage that they are internationally standardized. These data are however food supply data, i.e., food reaching the consumer. They are on an “as purchased” basis, i.e., as the food leaves the retail shop or otherwise enters the household. The quantities are provided on the basis of “primary equivalents”. In order to convert them into actual food intake values, two correction factors are required. The first factor accounts for product equivalent conversions and the second for food waste (by households but also catering) and feed to domestic animals. Often FAO FBS dietary WF assessments therefore include a WF component of consumer food waste [45,75].
- National food supply data from national statistical offices can be used. These often differ in amount and/or food product specifications from FAO FBS data.
- Many dietary WF studies use dietary survey data directly. These are food intake data, often with additional information on socioeconomic factors. They thus provide the possibility to compute dietary WFs according to socioeconomic statistics [34,61]. Such surveys can be very detailed in the type of food item consumed. They can however also be biased due to under-reporting.
2.4. Scarcity-Weighted WF and Human Health Impact (Due to Malnutrition) from Water Stress in LCA
- The value of Falkenmark and Rockstrom [5,7] incorporates green and blue water resources. The approach of Pfister et al. [83] and Verones et al. [22] only address blue water scarcity, by assuming a lack of available food due to water stressed irrigation. It is not clear how green water is addressed. Green water is the dominant resource in global food production [14,85]. River basins may be blue water stressed; they can still provide enough rainfed food for a healthy diet.
- The value of Falkenmark and Rockstrom is a rough global average high estimate for producing a balanced diet of 3000 kcal per person per day, with 20% calories from animal products and 80% from vegetal products. Many countries require much less green and blue water resources for a healthy diet [45,52,53,54]. Healthy diets also include pescatarian and vegetarian diets, which are even less water demanding.
- International food trade partly compensates for national food shortages. Water stressed countries can import food. Many river basins cross international borders.
- Trade within countries between river basins can compensate for regional food shortages. As an example, inhabitants in China’s northern water stressed region, coloured yellow to red (high DALY/m3) on the map of Verones et al. [22], can very well still have access to a healthy diet with food items produced in China’s wet non water stressed southern region, coloured green (low DALY/m3) on the same map.
- This approach ignores socioeconomic differences within a country/river basin. Local water resources may be relevant for the local human health of a small-scale farmer depending on his/her own food, most other inhabitants will purchase their food from the regional, national or international market. Especially middle class or wealthy inhabitants will be able to do this. In many transition and developing countries, proportions of the population now overconsume particular products such as sugar and fats.
- Some river basins are specialized in producing particular food items. The diversity of food items within a river basin can be not enough for a healthy diet.
- Countries or people within river basins can to a large extent depend on marine fish and seafood, for which wild catch does not depend on available water resources.
- Malnutrition has many forms, including overconsumption of specific products.
3. Outlook
3.1. Future Clarity in System Boundary and Modelling Assumptions, with Comparison of Results between Different Approaches
3.2. Full Comprehensive Sustainability Assessments
3.3. Dietary Footprint Family Assessments with the WF as One Member
3.4. WF Assessment for Multiple Dietary Regimes with Support to the Development of Local FBDG
3.5. Assessment of the Synergies with and Validity of Lca-Based Indicators
4. Conclusions
- (1).
- Future studies on dietary WFs should provide clarity in system boundary and modelling assumptions. Full food supply chain assessments are a topic of future research as well as studies comparing results between different approaches.
- (2).
- Studies addressing all three sustainability components (equity, efficiency and impact) are currently not abundant in the literature.
- (3).
- To address trade-offs between different environmental concerns, dietary footprint family assessments with the WF as one member are to be conducted.
- (4).
- A key research topic is WF assessments for multiple dietary regimes including with the aim to support the development of local dietary guidelines, which account for local agroclimatological, historic and sociocultural conditions.
- (5).
- This paper confirms previous concerns about the validity of the LCA mid-point indicator scarcity-weighted WF, stressing the need to evaluate the physical meaning of this indicator and whether it conflicts with established indicators on water sustainability. In addition, this paper argues that it is probably impossible to prove an empirical relation between local blue water stress and its effect on local malnutrition (LCA end-point indicator human health impact). Further research should evaluate the validity of these indicators.
Funding
Acknowledgments
Conflicts of Interest
References
- FAO; WHO. Sustainable Healthy Diets—Guiding Principles; FAO, WHO: Rome, Italy, 2019. [Google Scholar]
- EC. Communication from the Commission to the European Parliament, the Council, the European Economic and Social Committee and the Committee of the Regions: A Farm to Fork Strategy for a Fair, Healthy and Environmentally-Friendly Food System; European Commission: Brussels, Belgium, 2020. [Google Scholar]
- Mekonnen, M.M.; Hoekstra, A.Y. Four billion people facing severe water scarcity. Sci. Adv. 2016, 2, e1500323. [Google Scholar] [CrossRef] [PubMed]
- Schyns, J.F.; Hoekstra, A.Y.; Booij, M.J.; Hogeboom, R.J.; Mekonnen, M.M. Limits to the world’s green water resources for food, feed, fiber, timber, and bioenergy. Proc. Natl. Acad. Sci. USA 2019, 116, 4893–4898. [Google Scholar] [CrossRef] [PubMed]
- Falkenmark, M.; Rockström, J. Balancing Water for Humans and Nature; Earthscan Publications: London, UK, 2004. [Google Scholar]
- Rockström, J.; Falkenmark, M.; Karlberg, L.; Hoff, H.; Rost, S.; Gerten, D. Future water availability for global food production: The potential of green water for increasing resilience to global change. Water Resour. Res. 2009, 45, W00A12. [Google Scholar] [CrossRef]
- Rockström, J.; Lannerstad, M.; Falkenmark, M. Assessing the water challenge of a new green revolution in developing countries. Proc. Natl. Acad. Sci. USA 2007, 104, 6253–6260. [Google Scholar] [CrossRef] [PubMed]
- Vanham, D.; Hoekstra, A.Y.; Wada, Y.; Bouraoui, F.; de Roo, A.; Mekonnen, M.M.; van de Bund, W.J.; Batelaan, O.; Pavelic, P.; Bastiaanssen, W.G.M.; et al. Physical water scarcity metrics for monitoring progress towards SDG target 6.4: An evaluation of indicator 6.4.2 “Level of water stress”. Sci. Total Environ. 2018, 613–614, 218–232. [Google Scholar] [CrossRef] [PubMed]
- Poore, J.; Nemecek, T. Reducing food’s environmental impacts through producers and consumers. Science 2018, 360, 987–992. [Google Scholar] [CrossRef]
- Mekonnen, M.M.; Hoekstra, A.Y. Sustainability of the blue water footprint of crops. Adv. Water Resour. 2020, 143, 103679. [Google Scholar] [CrossRef]
- Vanham, D.; Leip, A. Sustainable food system policies need to address environmental pressures and impacts: The example of water use and water stress. Sci. Total Environ. 2020, 730, 139151. [Google Scholar] [CrossRef]
- Hoekstra, A.Y.; Chapagain, A.K.; Aldaya, M.M.; Mekonnen, M.M. The Water Footprint Assessment Manual: Setting the Global Standard; Earthscan: London, UK, 2011. [Google Scholar]
- Hoekstra, A.Y.; Chapagain, A.K.; van Oel, P.R. Advancing Water Footprint Assessment Research: Challenges in Monitoring Progress towards Sustainable Development Goal 6. Water Int. 2017, 9, 438. [Google Scholar] [CrossRef]
- Hoekstra, A.Y.; Mekonnen, M.M. The water footprint of humanity. Proc. Natl. Acad. Sci. USA 2012, 109, 3232–3237. [Google Scholar] [CrossRef]
- Hoekstra, A.Y. The sustainability of a single activity, production process or product. Ecol. Indic. 2015, 57, 82–84. [Google Scholar] [CrossRef]
- Mekonnen, M.M.; Hoekstra, A.Y. The green, blue and grey water footprint of crops and derived crop products. Hydrol. Earth Syst. Sci. 2011, 15, 1577–1600. [Google Scholar] [CrossRef]
- Mekonnen, M.; Hoekstra, A. A global assessment of the water footprint of farm animal products. Ecosystems 2012, 15, 401–415. [Google Scholar] [CrossRef]
- Pahlow, M.; van Oel, P.R.; Mekonnen, M.M.; Hoekstra, A.Y. Increasing pressure on freshwater resources due to terrestrial feed ingredients for aquaculture production. Sci. Total Environ. 2015, 536, 847–857. [Google Scholar] [CrossRef] [PubMed]
- Parodi, A.; Leip, A.; De Boer, I.J.M.; Slegers, P.M.; Ziegler, F.; Temme, E.H.M.; Herrero, M.; Tuomisto, H.; Valin, H.; Van Middelaar, C.E.; et al. The potential of future foods for sustainable and healthy diets. Nat. Sustain. 2018, 1, 782–789. [Google Scholar] [CrossRef]
- Miglietta, P.P.; De Leo, F.; Ruberti, M.; Massari, S. Mealworms for Food: A Water Footprint Perspective. Water 2015, 7, 6190–6203. [Google Scholar] [CrossRef]
- Green, A.; Nemecek, T.; Chaudhary, A.; Mathys, A. Assessing nutritional, health, and environmental sustainability dimensions of agri-food production. Glob. Food Secur. 2020, 26, 100406. [Google Scholar] [CrossRef]
- Verones, F.; Hellweg, S.; Antón, A.; Azevedo, L.B.; Chaudhary, A.; Cosme, N.; Cucurachi, S.; de Baan, L.; Dong, Y.; Fantke, P.; et al. LC-IMPACT: A regionalized life cycle damage assessment method. J. Ind. Ecol. 2020, 24, 1201–1219. [Google Scholar] [CrossRef]
- Vanham, D.; Leip, A.; Galli, A.; Kastner, T.; Bruckner, M.; Uwizeye, A.; van Dijk, K.; Ercin, E.; Dalin, C.; Brandão, M.; et al. Environmental footprint family to address local to planetary sustainability and deliver on the SDGs. Sci. Total Environ. 2019, 693, 133642. [Google Scholar] [CrossRef]
- Vanham, D. Does the water footprint concept provide relevant information to address the water–food–energy–ecosystem nexus? Ecosyst. Serv. 2016, 17, 298–307. [Google Scholar] [CrossRef]
- Mekonnen, M.M.; Gerbens-Leenes, P.W.; Hoekstra, A.Y. The consumptive water footprint of electricity and heat: A global assessment. Environ. Sci. Water Res. Technol. 2015, 1, 285–297. [Google Scholar] [CrossRef]
- Gerbens-Leenes, W.; Hoekstra, A.Y.; van der Meer, T.H. The water footprint of bioenergy. Proc. Natl. Acad. Sci. USA 2009, 106, 10219–10223. [Google Scholar] [CrossRef] [PubMed]
- Schyns, J.F.; Vanham, D.W. The Water Footprint of Wood for Energy Consumed in the European Union. Water 2019, 11, 206. [Google Scholar] [CrossRef]
- Hogeboom, R.J.; Knook, L.; Hoekstra, A.Y. The blue water footprint of the world’s artificial reservoirs for hydroelectricity, irrigation, residential and industrial water supply, flood protection, fishing and recreation. Adv. Water Resour. 2018, 113, 285–294. [Google Scholar] [CrossRef]
- Vanham, D.; Medarac, H.; Schyns, J.F.; Hogeboom, R.J.; Magagna, D. The consumptive water footprint of the European Union energy sector. Environ. Res. Lett. 2019, 14, 104016. [Google Scholar] [CrossRef]
- Mekonnen, M.M.; Gerbens-Leenes, P.W.; Hoekstra, A.Y. Future electricity: The challenge of reducing both carbon and water footprint. Sci. Total Environ. 2016, 569–570, 1282–1288. [Google Scholar] [CrossRef] [PubMed]
- Holmatov, B.; Hoekstra, A.Y. The Environmental Footprint of Transport by Car Using Renewable Energy. Earth’s Future 2020, 8, e2019EF001428. [Google Scholar] [CrossRef]
- Gerbens-Leenes, W.; Holtz, K. Consequences of Transport Low-Carbon Transitions and the Carbon, Land and Water Footprints of Different Fuel Options in The Netherlands. Water 2020, 12, 1968. [Google Scholar] [CrossRef]
- Harris, F.; Moss, C.; Joy, E.J.M.; Quinn, R.; Scheelbeek, P.F.D.; Dangour, A.D.; Green, R. The Water Footprint of Diets: A Global Systematic Review and Meta-analysis. Adv. Nutr. 2019, 11, 375–386. [Google Scholar] [CrossRef]
- Vanham, D.; Comero, S.; Gawlik, B.M.; Bidoglio, G. The water footprint of different diets within European sub-national geographical entities. Nat. Sustain. 2018, 1, 518–525. [Google Scholar] [CrossRef]
- Hoekstra, A.Y. Sustainable, efficient, and equitable water use: The three pillars under wise freshwater allocation. Wires Water 2014, 1, 31–40. [Google Scholar] [CrossRef]
- EC. Resource Efficiency. Available online: https://ec.europa.eu/environment/resource_efficiency/index_en.htm (accessed on 15 September 2020).
- Hoekstra, A.Y.; Wiedmann, T.O. Humanity’s unsustainable environmental footprint. Science 2014, 344, 1114–1117. [Google Scholar] [CrossRef] [PubMed]
- Dalin, C.; Wada, Y.; Kastner, T.; Puma, M.J. Groundwater depletion embedded in international food trade. Nature 2017, 543, 700–704. [Google Scholar] [CrossRef] [PubMed]
- Hogeboom, R.J.; de Bruin, D.; Schyns, J.F.; Krol, M.S.; Hoekstra, A.Y. Capping human water footprints in the world’s river basins. Earth’s Future 2020, 8, e2019EF001363. [Google Scholar] [CrossRef] [PubMed]
- Steffen, W.; Richardson, K.; Rockström, J.; Cornell, S.E.; Fetzer, I.; Bennett, E.M.; Biggs, R.; Carpenter, S.R.; de Vries, W.; de Wit, C.A.; et al. Planetary boundaries: Guiding human development on a changing planet. Science 2015, 347, 1259855. [Google Scholar] [CrossRef] [PubMed]
- Gerten, D.; Hoff, H.; Rockström, J.; Jägermeyr, J.; Kummu, M.; Pastor, A.V. Towards a revised planetary boundary for consumptive freshwater use: Role of environmental flow requirements. Curr. Opin. Environ. Sustain. 2013, 5, 551–558. [Google Scholar] [CrossRef]
- O’Neill, D.W.; Fanning, A.L.; Lamb, W.F.; Steinberger, J.K. A good life for all within planetary boundaries. Nat. Sustain. 2018, 1, 88–95. [Google Scholar] [CrossRef]
- Häyhä, T.; Lucas, P.L.; van Vuuren, D.P.; Cornell, S.E.; Hoff, H. From Planetary Boundaries to national fair shares of the global safe operating space—How can the scales be bridged? Glob. Environ. Chang. 2016, 40, 60–72. [Google Scholar] [CrossRef]
- Hoekstra, A.Y. Water Footprint Assessment: Evolvement of a New Research Field. Water Resour. Manag. 2017, 31, 3061–3081. [Google Scholar] [CrossRef]
- Vanham, D.; Mekonnen, M.M.; Hoekstra, A.Y. The water footprint of the EU for different diets. Ecol. Indic. 2013, 32, 1–8. [Google Scholar] [CrossRef]
- Mekonnen, M.M.; Hoekstra, A.Y. Water footprint benchmarks for crop production: A first global assessment. Ecol. Indic. 2014, 46, 214–223. [Google Scholar] [CrossRef]
- Vanham, D.; Mekonnen, M.M.; Hoekstra, A.Y. Treenuts and groundnuts in the EAT-Lancet reference diet: Concerns regarding sustainable water use. Glob. Food Secur. 2020, 24, 100357. [Google Scholar] [CrossRef] [PubMed]
- Willett, W.; Rockström, J.; Loken, B.; Springmann, M.; Lang, T.; Vermeulen, S.; Garnett, T.; Tilman, D.; DeClerck, F.; Wood, A.; et al. Food in the Anthropocene: The EAT-Lancet Commission on healthy diets from sustainable food systems. Lancet 2019, 393, 447–492. [Google Scholar] [CrossRef]
- Springmann, M.; Clark, M.; Mason-D’Croz, D.; Wiebe, K.; Bodirsky, B.L.; Lassaletta, L.; de Vries, W.; Vermeulen, S.J.; Herrero, M.; Carlson, K.M.; et al. Options for keeping the food system within environmental limits. Nature 2018, 562, 519–525. [Google Scholar] [CrossRef] [PubMed]
- Kim, B.F.; Santo, R.E.; Scatterday, A.P.; Fry, J.P.; Synk, C.M.; Cebron, S.R.; Mekonnen, M.M.; Hoekstra, A.Y.; de Pee, S.; Bloem, M.W.; et al. Country-specific dietary shifts to mitigate climate and water crises. Glob. Environ. Chang. 2019, 62, 101926. [Google Scholar] [CrossRef]
- Jalava, M.; Kummu, M.; Porkka, M.; Siebert, S.; Varis, O. Diet change—A solution to reduce water use? Environ. Res. Lett. 2014, 9, 074016. [Google Scholar] [CrossRef]
- Vanham, D.; Hoekstra, A.Y.; Bidoglio, G. Potential water saving through changes in European diets. Environ. Int. 2013, 61, 45–56. [Google Scholar] [CrossRef]
- Vanham, D. The water footprint of Austria for different diets. Water Sci. Technol. 2013, 67, 824–830. [Google Scholar] [CrossRef]
- Liu, J.; Savenije, H.H.G. Food consumption patterns and their effect on water requirement in China. Hydrol. Earth Syst. Sci. 2008, 12, 887–898. [Google Scholar] [CrossRef]
- Green, R.F.; Joy, E.J.M.; Harris, F.; Agrawal, S.; Aleksandrowicz, L.; Hillier, J.; Macdiarmid, J.I.; Milner, J.; Vetter, S.H.; Smith, P.; et al. Greenhouse gas emissions and water footprints of typical dietary patterns in India. Sci. Total Environ. 2018, 643, 1411–1418. [Google Scholar] [CrossRef]
- Mekonnen, M.M.; Fulton, J. The effect of diet changes and food loss reduction in reducing the water footprint of an average American. Water Int. 2018, 43, 860–870. [Google Scholar] [CrossRef]
- Blas, A.; Garrido, A.; Unver, O.; Willaarts, B. A comparison of the Mediterranean diet and current food consumption patterns in Spain from a nutritional and water perspective. Sci. Total Environ. 2019, 664, 1020–1029. [Google Scholar] [CrossRef] [PubMed]
- Blas, A.; Garrido, A.; Willaarts, B.A. Evaluating the Water Footprint of the Mediterranean and American Diets. Water 2016, 8, 448. [Google Scholar] [CrossRef]
- Mirzaie-Nodoushan, F.; Morid, S.; Dehghanisanij, H. Reducing water footprints through healthy and reasonable changes in diet and imported products. Sustain. Prod. Consum. 2020, 23, 30–41. [Google Scholar] [CrossRef]
- Goldstein, B.; Moses, R.; Sammons, N.; Birkved, M. Potential to curb the environmental burdens of American beef consumption using a novel plant-based beef substitute. PLoS ONE 2017, 12, e0189029. [Google Scholar] [CrossRef]
- Souissi, A.; Mtimet, N.; Thabet, C.; Stambouli, T.; Chebil, A. Impact of food consumption on water footprint and food security in Tunisia. Food Secur. 2019, 11, 989–1008. [Google Scholar] [CrossRef]
- Wahba, S.M.; Scott, K.; Steinberger, J.K. Analyzing Egypt’s water footprint based on trade balance and expenditure inequality. J. Clean. Prod. 2018, 198, 1526–1535. [Google Scholar] [CrossRef]
- Tompa, O.; Lakner, Z.; Oláh, J.; Popp, J.; Kiss, A. Is the Sustainable Choice a Healthy Choice?—Water Footprint Consequence of Changing Dietary Patterns. Nutrients 2020, 12, 2578. [Google Scholar] [CrossRef]
- Vanham, D.; Bidoglio, G. The water footprint of agricultural products in European river basins. Environ. Res. Lett. 2014, 9, 064007. [Google Scholar] [CrossRef]
- Koteswara Rao, D.; Chandrasekharam, D. Quantifying the water footprint of an urban agglomeration in developing economy. Sustain. Cities Soc. 2019, 50, 101686. [Google Scholar] [CrossRef]
- Vanham, D.; Bidoglio, G. The water footprint of Milan. Water Sci. Technol. 2014, 69, 789–795. [Google Scholar] [CrossRef] [PubMed]
- Vanham, D.; del Pozo, S.; Pekcan, A.G.; Keinan-Boker, L.; Trichopoulou, A.; Gawlik, B.M. Water consumption related to different diets in Mediterranean cities. Sci. Total Environ. 2016, 573, 96–105. [Google Scholar] [CrossRef] [PubMed]
- Vanham, D.; Gawlik, B.M.; Bidoglio, G. Food consumption and related water resources in Nordic cities. Ecol. Indic. 2017, 74, 119–129. [Google Scholar] [CrossRef]
- Vanham, D.; Gawlik, B.M.; Bidoglio, G. Cities as hotspots of indirect water consumption: The case study of Hong Kong. J. Hydrol. 2019, 573, 1075–1086. [Google Scholar] [CrossRef] [PubMed]
- Vanham, D.; Mak, T.N.; Gawlik, B.M. Urban food consumption and associated water resources: The example of Dutch cities. Sci. Total Environ. 2016, 565, 232–239. [Google Scholar] [CrossRef] [PubMed]
- Kang, J.; Lin, J.; Zhao, X.; Zhao, S.; Kou, L. Decomposition of the Urban Water Footprint of Food Consumption: A Case Study of Xiamen City. Sustainability 2017, 9, 135. [Google Scholar] [CrossRef]
- Cai, B.; Liu, B.; Zhang, B. Evolution of Chinese urban household’s water footprint. J. Clean. Prod. 2019, 208, 1–10. [Google Scholar] [CrossRef]
- González-García, S.; González-García, R.; González Vázquez, L.; Moreira, M.T.; Leis, R. Tracking the environmental footprints of institutional restaurant service in nursery schools. Sci. Total Environ. 2020, 728, 138939. [Google Scholar] [CrossRef]
- Hadjikakou, M.; Chenoweth, J.; Miller, G. Estimating the direct and indirect water use of tourism in the eastern Mediterranean. J. Environ. Manag. 2013, 114, 548–556. [Google Scholar] [CrossRef]
- Vanham, D.; Bouraoui, F.; Leip, A.; Grizzetti, B.; Bidoglio, G. Lost water and nitrogen resources due to EU consumer food waste. Environ. Res. Lett. 2015, 10, 084008. [Google Scholar] [CrossRef]
- Hoekstra, A.Y. A critique on the water-scarcity weighted water footprint in LCA. Ecol. Indic. 2016, 66, 564–573. [Google Scholar] [CrossRef]
- Pfister, S.; Boulay, A.-M.; Berger, M.; Hadjikakou, M.; Motoshita, M.; Hess, T.; Ridoutt, B.; Weinzettel, J.; Scherer, L.; Döll, P.; et al. Understanding the LCA and ISO water footprint: A response to Hoekstra (2016) “A critique on the water-scarcity weighted water footprint in LCA”. Ecol. Indic. 2017, 72, 352–359. [Google Scholar] [CrossRef] [PubMed]
- Brauman, K.A.; Siebert, S.; Foley, J.A. Improvements in crop water productivity increase water sustainability and food security—A global analysis. Environ. Res. Lett. 2013, 8, 024030. [Google Scholar] [CrossRef]
- Notarnicola, B.; Tassielli, G.; Renzulli, P.A.; Castellani, V.; Sala, S. Environmental impacts of food consumption in Europe. J. Clean. Prod. 2017, 140, 753–765. [Google Scholar] [CrossRef]
- Ridoutt, B.G.; Baird, D.; Anastasiou, K.; Hendrie, G.A. Diet Quality and Water Scarcity: Evidence from a Large Australian Population Health Survey. Nutrients 2019, 11, 1846. [Google Scholar] [CrossRef]
- Hess, T.; Andersson, U.; Mena, C.; Williams, A. The impact of healthier dietary scenarios on the global blue water scarcity footprint of food consumption in the UK. Food Policy 2015, 50, 1–10. [Google Scholar] [CrossRef]
- United Nations (UN). Sustainable Development Goal 6 Synthesis Report on Water and Sanitation; United Nations: New York, NY, USA, 2018. [Google Scholar]
- Pfister, S.; Koehler, A.; Hellweg, S. Assessing the Environmental Impacts of Freshwater Consumption in LCA. Environ. Sci. Technol. 2009, 43, 4098–4104. [Google Scholar] [CrossRef]
- Huijbregts, M.A.J.; Steinmann, Z.J.N.; Elshout, P.M.F.; Verones, F.; Vieira, M.D.M.; Hollander, A.; Zijp, M.; van Zelm, R. ReCiPe 2016 A Harmonized Life Cycle Impact Assessment Method at Midpoint and Endpoint Level Report I: Characterization; RIVM: Bilthoven, The Netherlands, 2016. [Google Scholar]
- Rost, S.; Gerten, D.; Hoff, H.; Lucht, W.; Falkenmark, M.; Rockström, J. Global potential to increase crop production through water management in rainfed agriculture. Environ. Res. Lett. 2009, 4, 044002. [Google Scholar] [CrossRef]
- Liu, J.; Mao, G.; Hoekstra, A.Y.; Wang, H.; Wang, J.; Zheng, C.; van Vliet, M.T.H.; Wu, M.; Ruddell, B.; Yan, J. Managing the energy-water-food nexus for sustainable development. Appl. Energy 2018, 210, 377–381. [Google Scholar] [CrossRef]
- Bleischwitz, R.; Spataru, C.; VanDeveer, S.D.; Obersteiner, M.; van der Voet, E.; Johnson, C.; Andrews-Speed, P.; Boersma, T.; Hoff, H.; van Vuuren, D.P. Resource nexus perspectives towards the United Nations Sustainable Development Goals. Nat. Sustain. 2018, 1, 737–743. [Google Scholar] [CrossRef]
- D’Odorico, P.; Davis, K.F.; Rosa, L.; Carr, J.A.; Chiarelli, D.; Dell’Angelo, J.; Gephart, J.; MacDonald, G.K.; Seekell, D.A.; Suweis, S.; et al. The Global Food-Energy-Water Nexus. Rev. Geophys. 2018, 56, 456–531. [Google Scholar] [CrossRef]
- Hoekstra, A.Y.; Mekonnen, M.M. Imported water risk: The case of the UK. Environ. Res. Lett. 2016, 11, 055002. [Google Scholar] [CrossRef]
- Chaudhary, A.; Gustafson, D.; Mathys, A. Multi-indicator sustainability assessment of global food systems. Nat. Commun. 2018, 9, 848. [Google Scholar] [CrossRef] [PubMed]
- Hachem, F.; Vanham, D.; Moreno, L.A. Territorial and sustainable healthy diets. Food Nutr. Bull. 2020, in press. [Google Scholar] [CrossRef]
- Rockstrom, J.; Steffen, W.; Noone, K.; Persson, A.; Chapin, F.S.; Lambin, E.F.; Lenton, T.M.; Scheffer, M.; Folke, C.; Schellnhuber, H.J.; et al. A safe operating space for humanity. Nature 2009, 461, 472–475. [Google Scholar] [CrossRef]
- Bach-Faig, A.; Berry, E.M.; Lairon, D.; Reguant, J.; Trichopoulou, A.; Dernini, S.; Medina, F.X.; Battino, M.; Belahsen, R.; Miranda, G.; et al. Mediterranean diet pyramid today. Science and cultural updates. Public Health Nutr. 2011, 14, 2274–2284. [Google Scholar] [CrossRef]
- Sáez-Almendros, S.; Obrador, B.; Bach-Faig, A.; Serra-Majem, L. Environmental footprints of Mediterranean versus Western dietary patterns: Beyond the health benefits of the Mediterranean diet. Environ. Health 2013, 12, 118. [Google Scholar] [CrossRef]
- Vanham, D.; Guenther, S.; Ros Baró, M.; Bach-Faig, A. Water resources for different diets in Mediterranean countries. Glob. Food Sec. 2020. Submitted Manuscript. [Google Scholar]
- ISO. ISO 14046: Environmental Management—Water Footprint—Principles, Requirements and Guidelines; International Organization for Standardization: Geneva, Switzerland, 2014. [Google Scholar]
- Unver, O.; Bhaduri, A.; Hoogeveen, J. Water-use efficiency and productivity improvements towards a sustainable pathway for meeting future water demand. Water Secur. 2017, 1, 21–27. [Google Scholar] [CrossRef]
- Vanham, D.; Mekonnen, M.M.; Chapagain, A.K.; Arjen, Y. Hoekstra 1967–2019. Nat. Sustain. 2020, 3, 80. [Google Scholar] [CrossRef]


Publisher’s Note: MDPI stays neutral with regard to jurisdictional claims in published maps and institutional affiliations. |
© 2020 by the author. Licensee MDPI, Basel, Switzerland. This article is an open access article distributed under the terms and conditions of the Creative Commons Attribution (CC BY) license (http://creativecommons.org/licenses/by/4.0/).
Share and Cite
Vanham, D. Water Resources for Sustainable Healthy Diets: State of the Art and Outlook. Water 2020, 12, 3224. https://doi.org/10.3390/w12113224
Vanham D. Water Resources for Sustainable Healthy Diets: State of the Art and Outlook. Water. 2020; 12(11):3224. https://doi.org/10.3390/w12113224
Chicago/Turabian StyleVanham, Davy. 2020. "Water Resources for Sustainable Healthy Diets: State of the Art and Outlook" Water 12, no. 11: 3224. https://doi.org/10.3390/w12113224
APA StyleVanham, D. (2020). Water Resources for Sustainable Healthy Diets: State of the Art and Outlook. Water, 12(11), 3224. https://doi.org/10.3390/w12113224