Water and Salt Balance in Agricultural Lands under Leaching with Shallow Subsurface Drainage Used in Combination with Cut-Drains


Abstract
1. Introduction
2. Materials and Methods
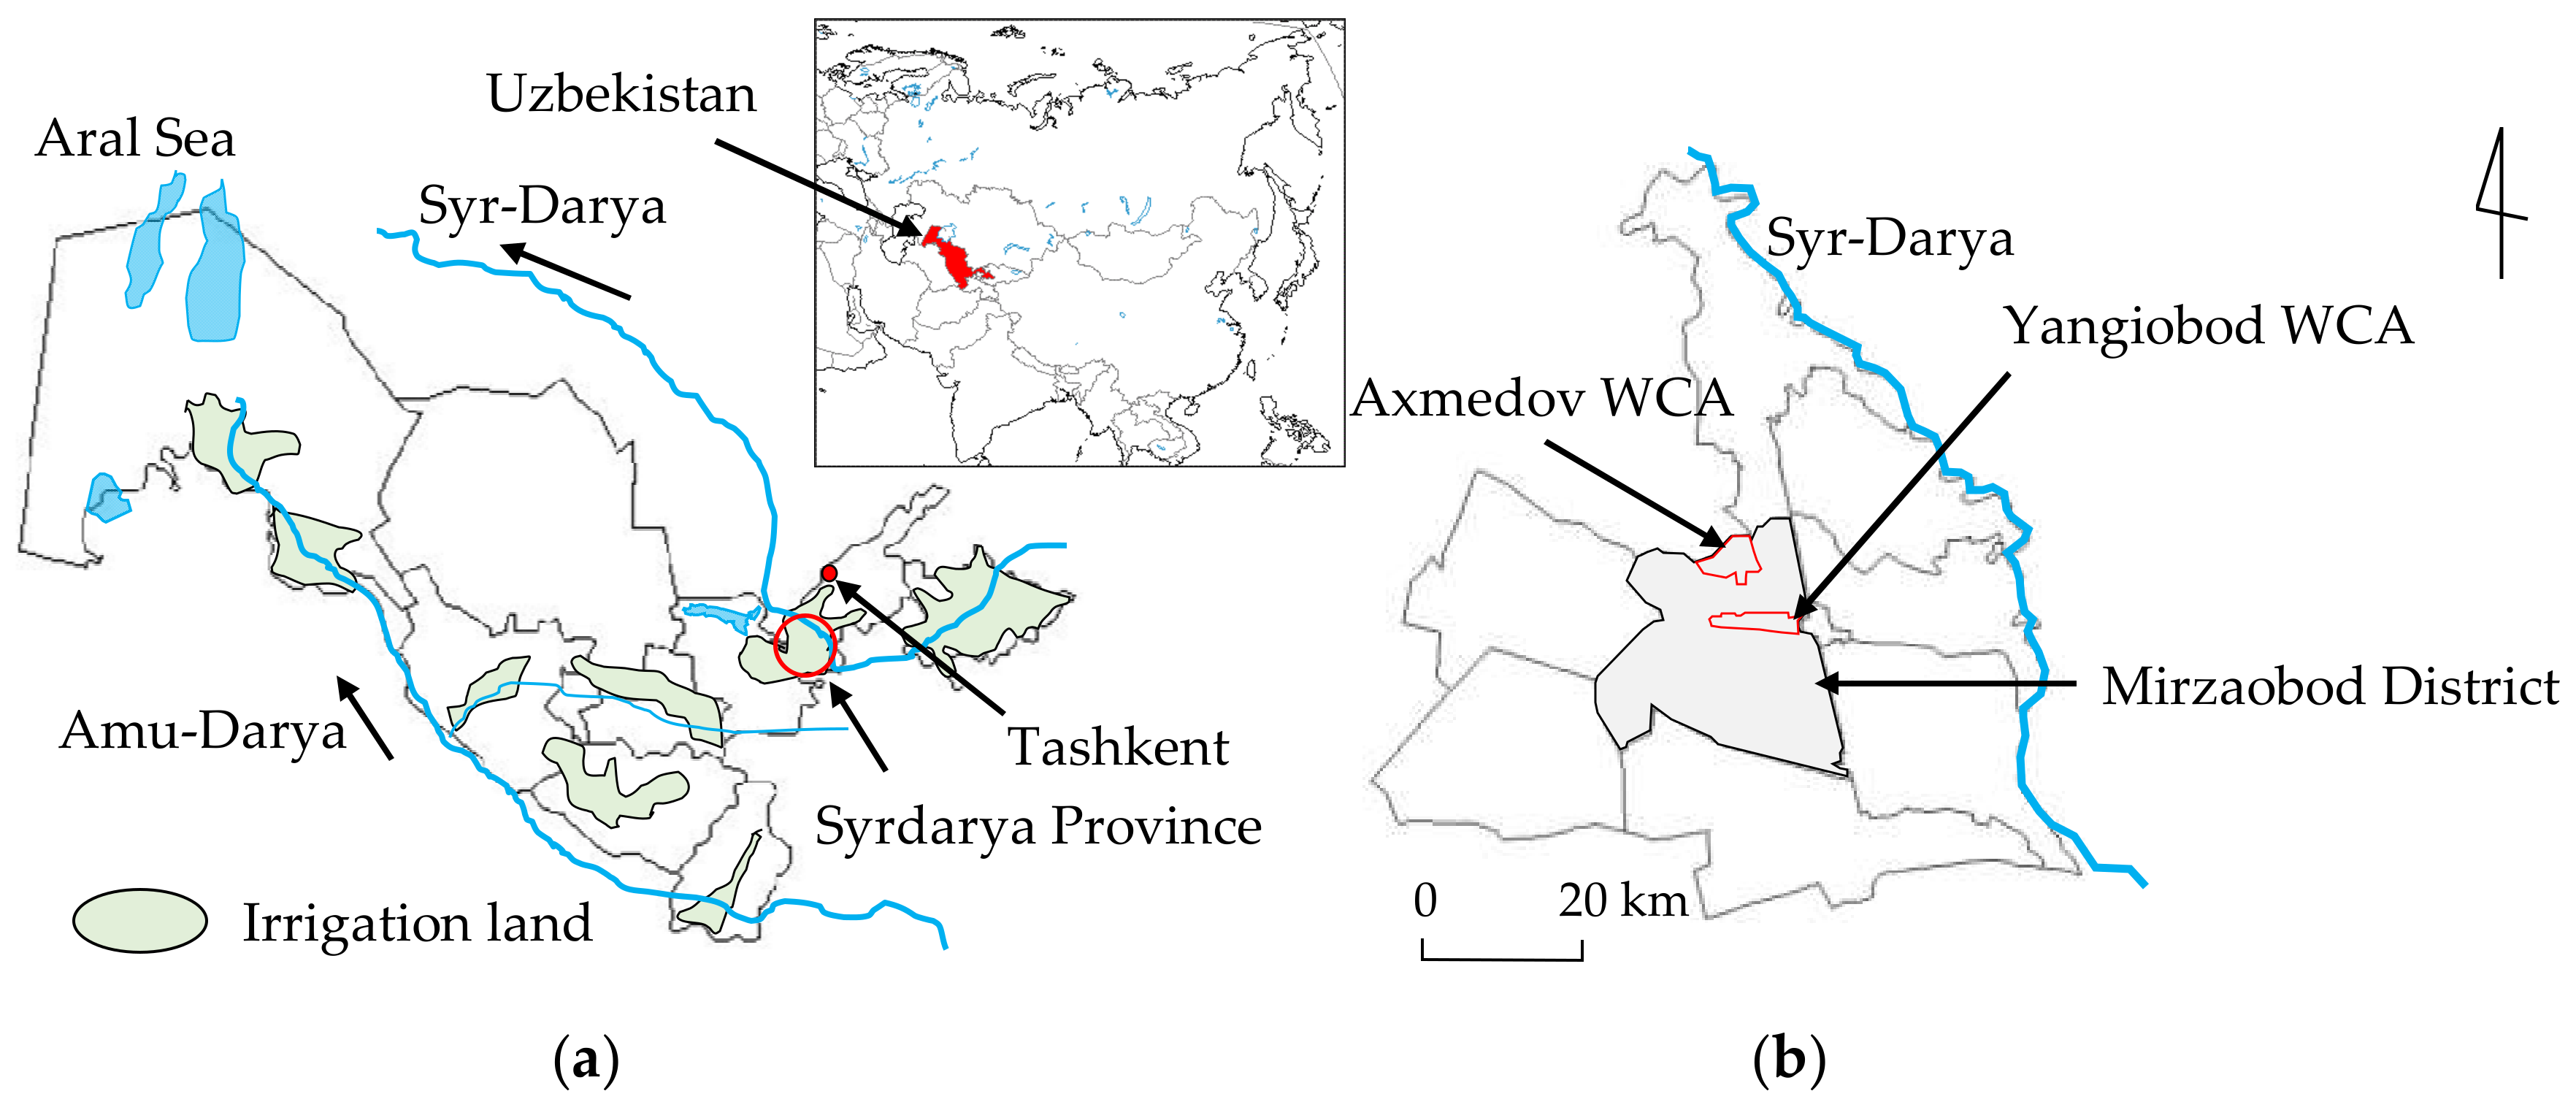
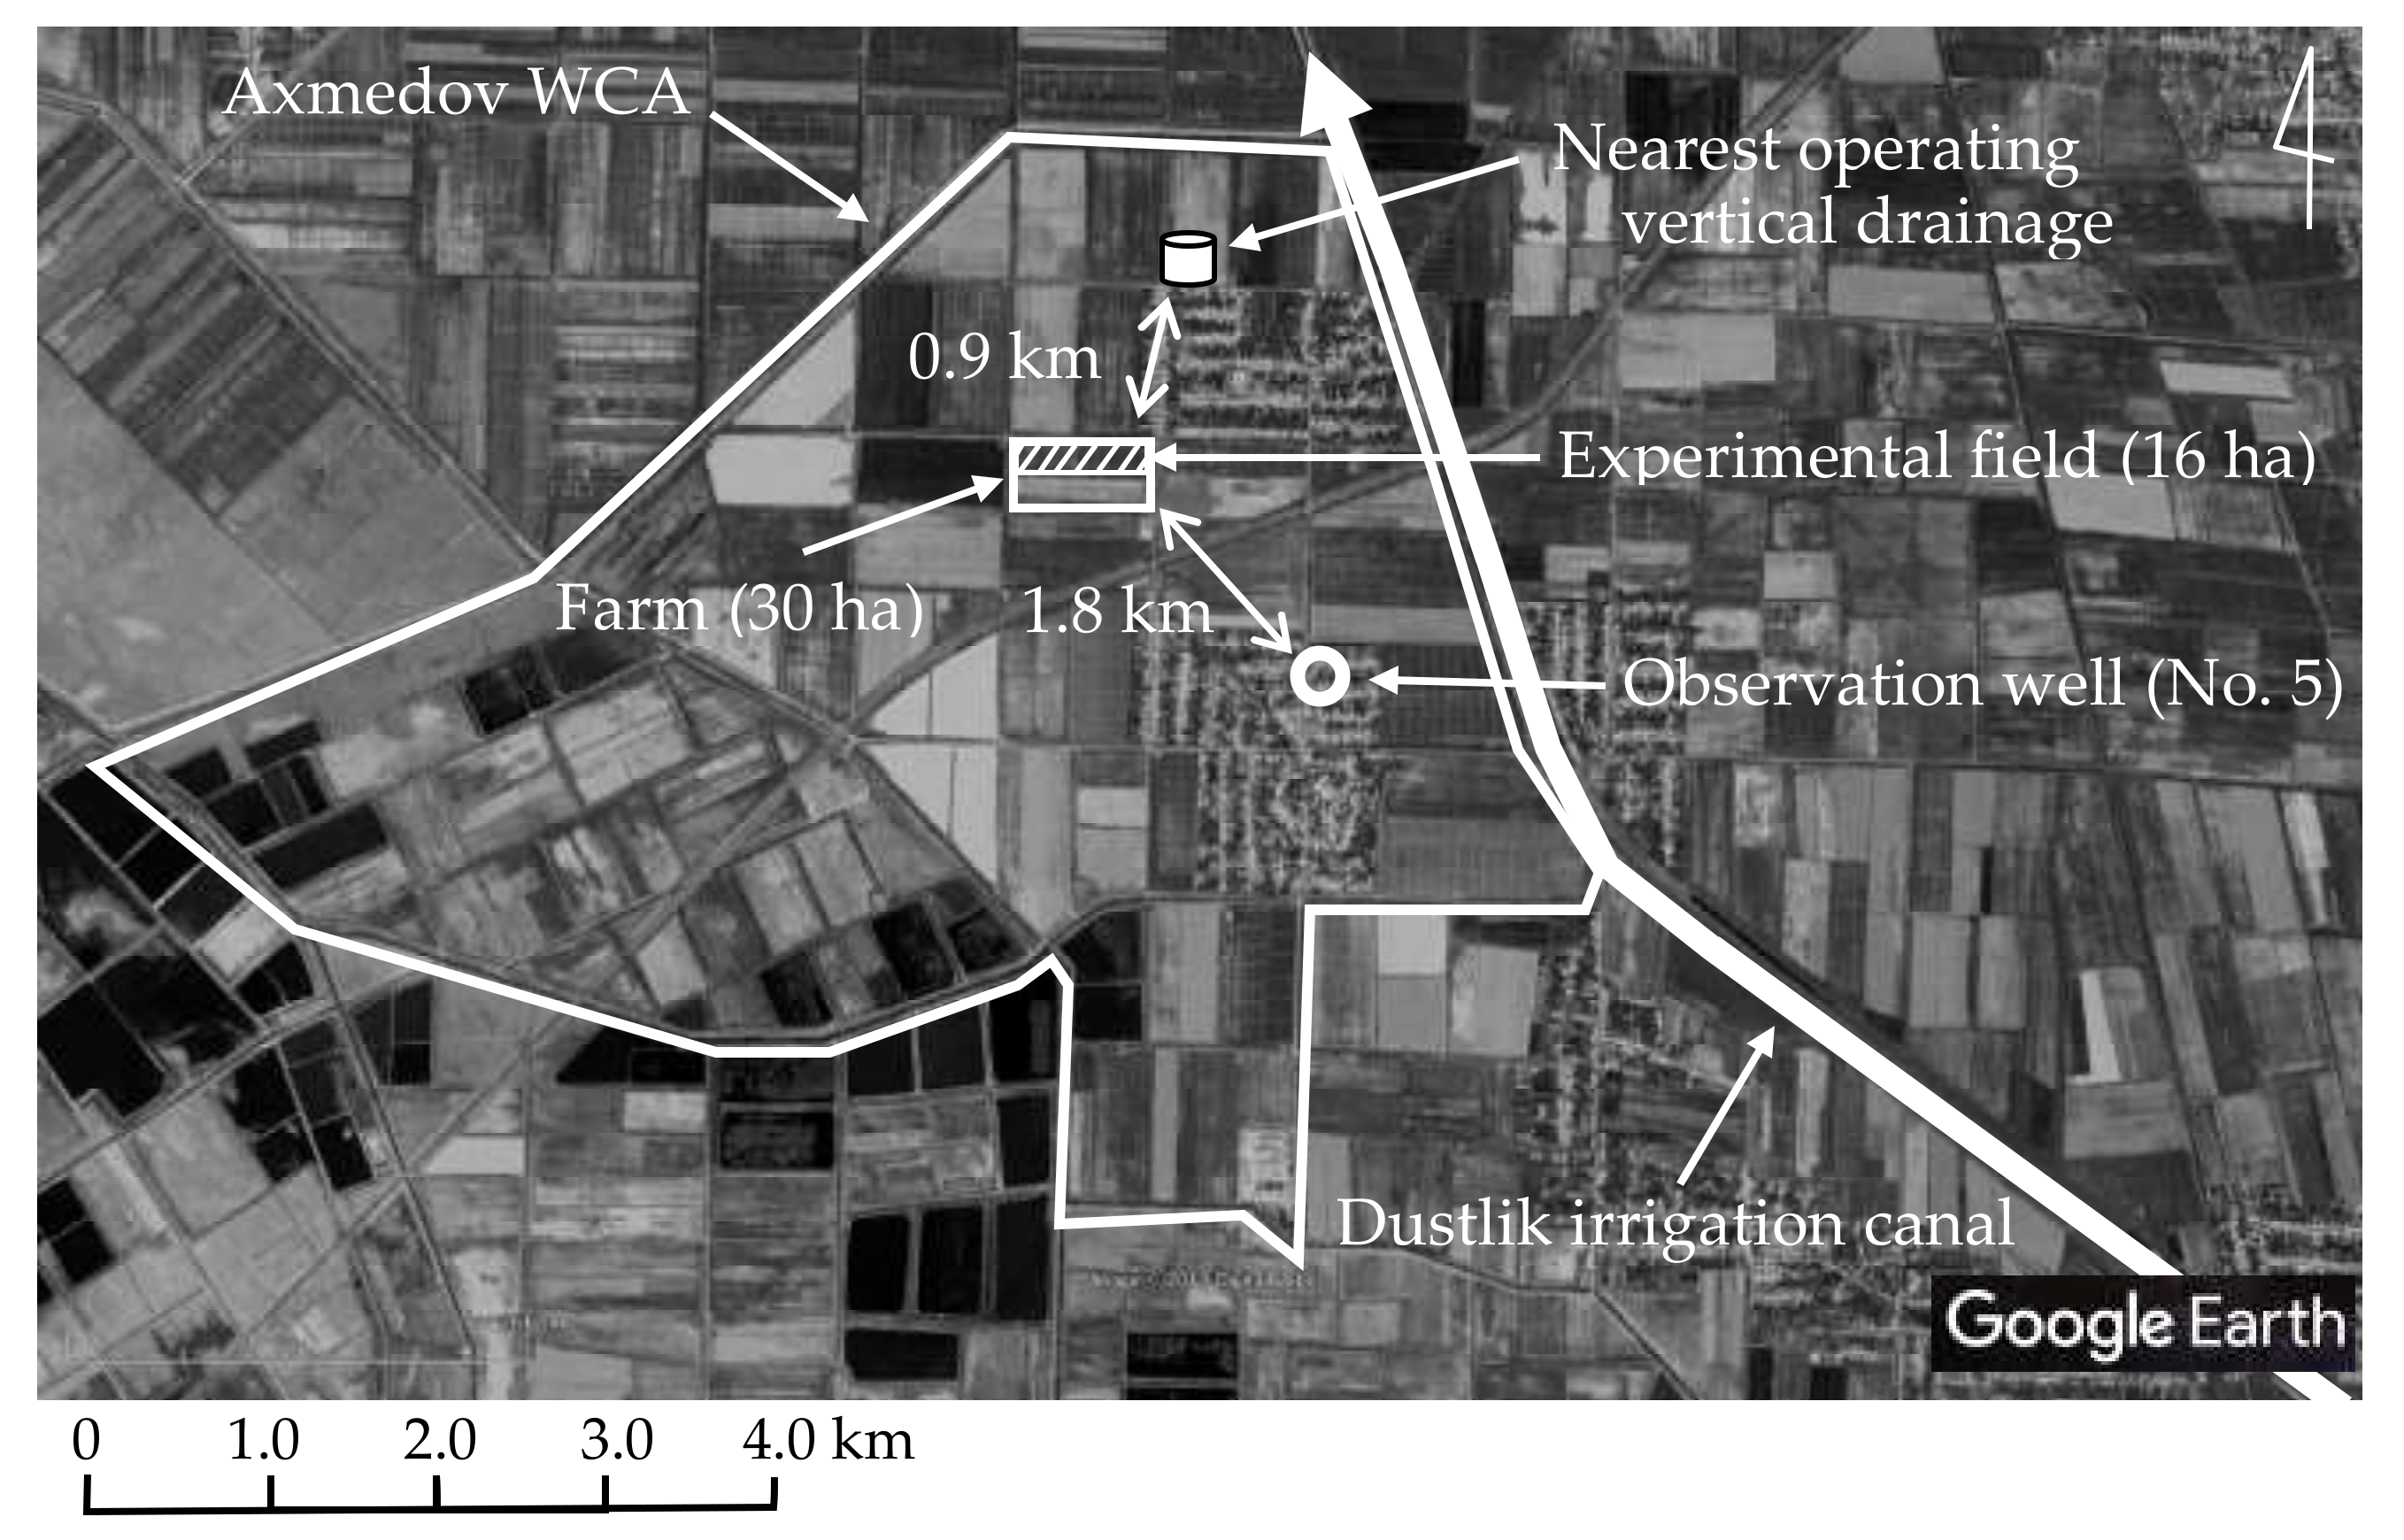
2.1. Outline of the Study Area
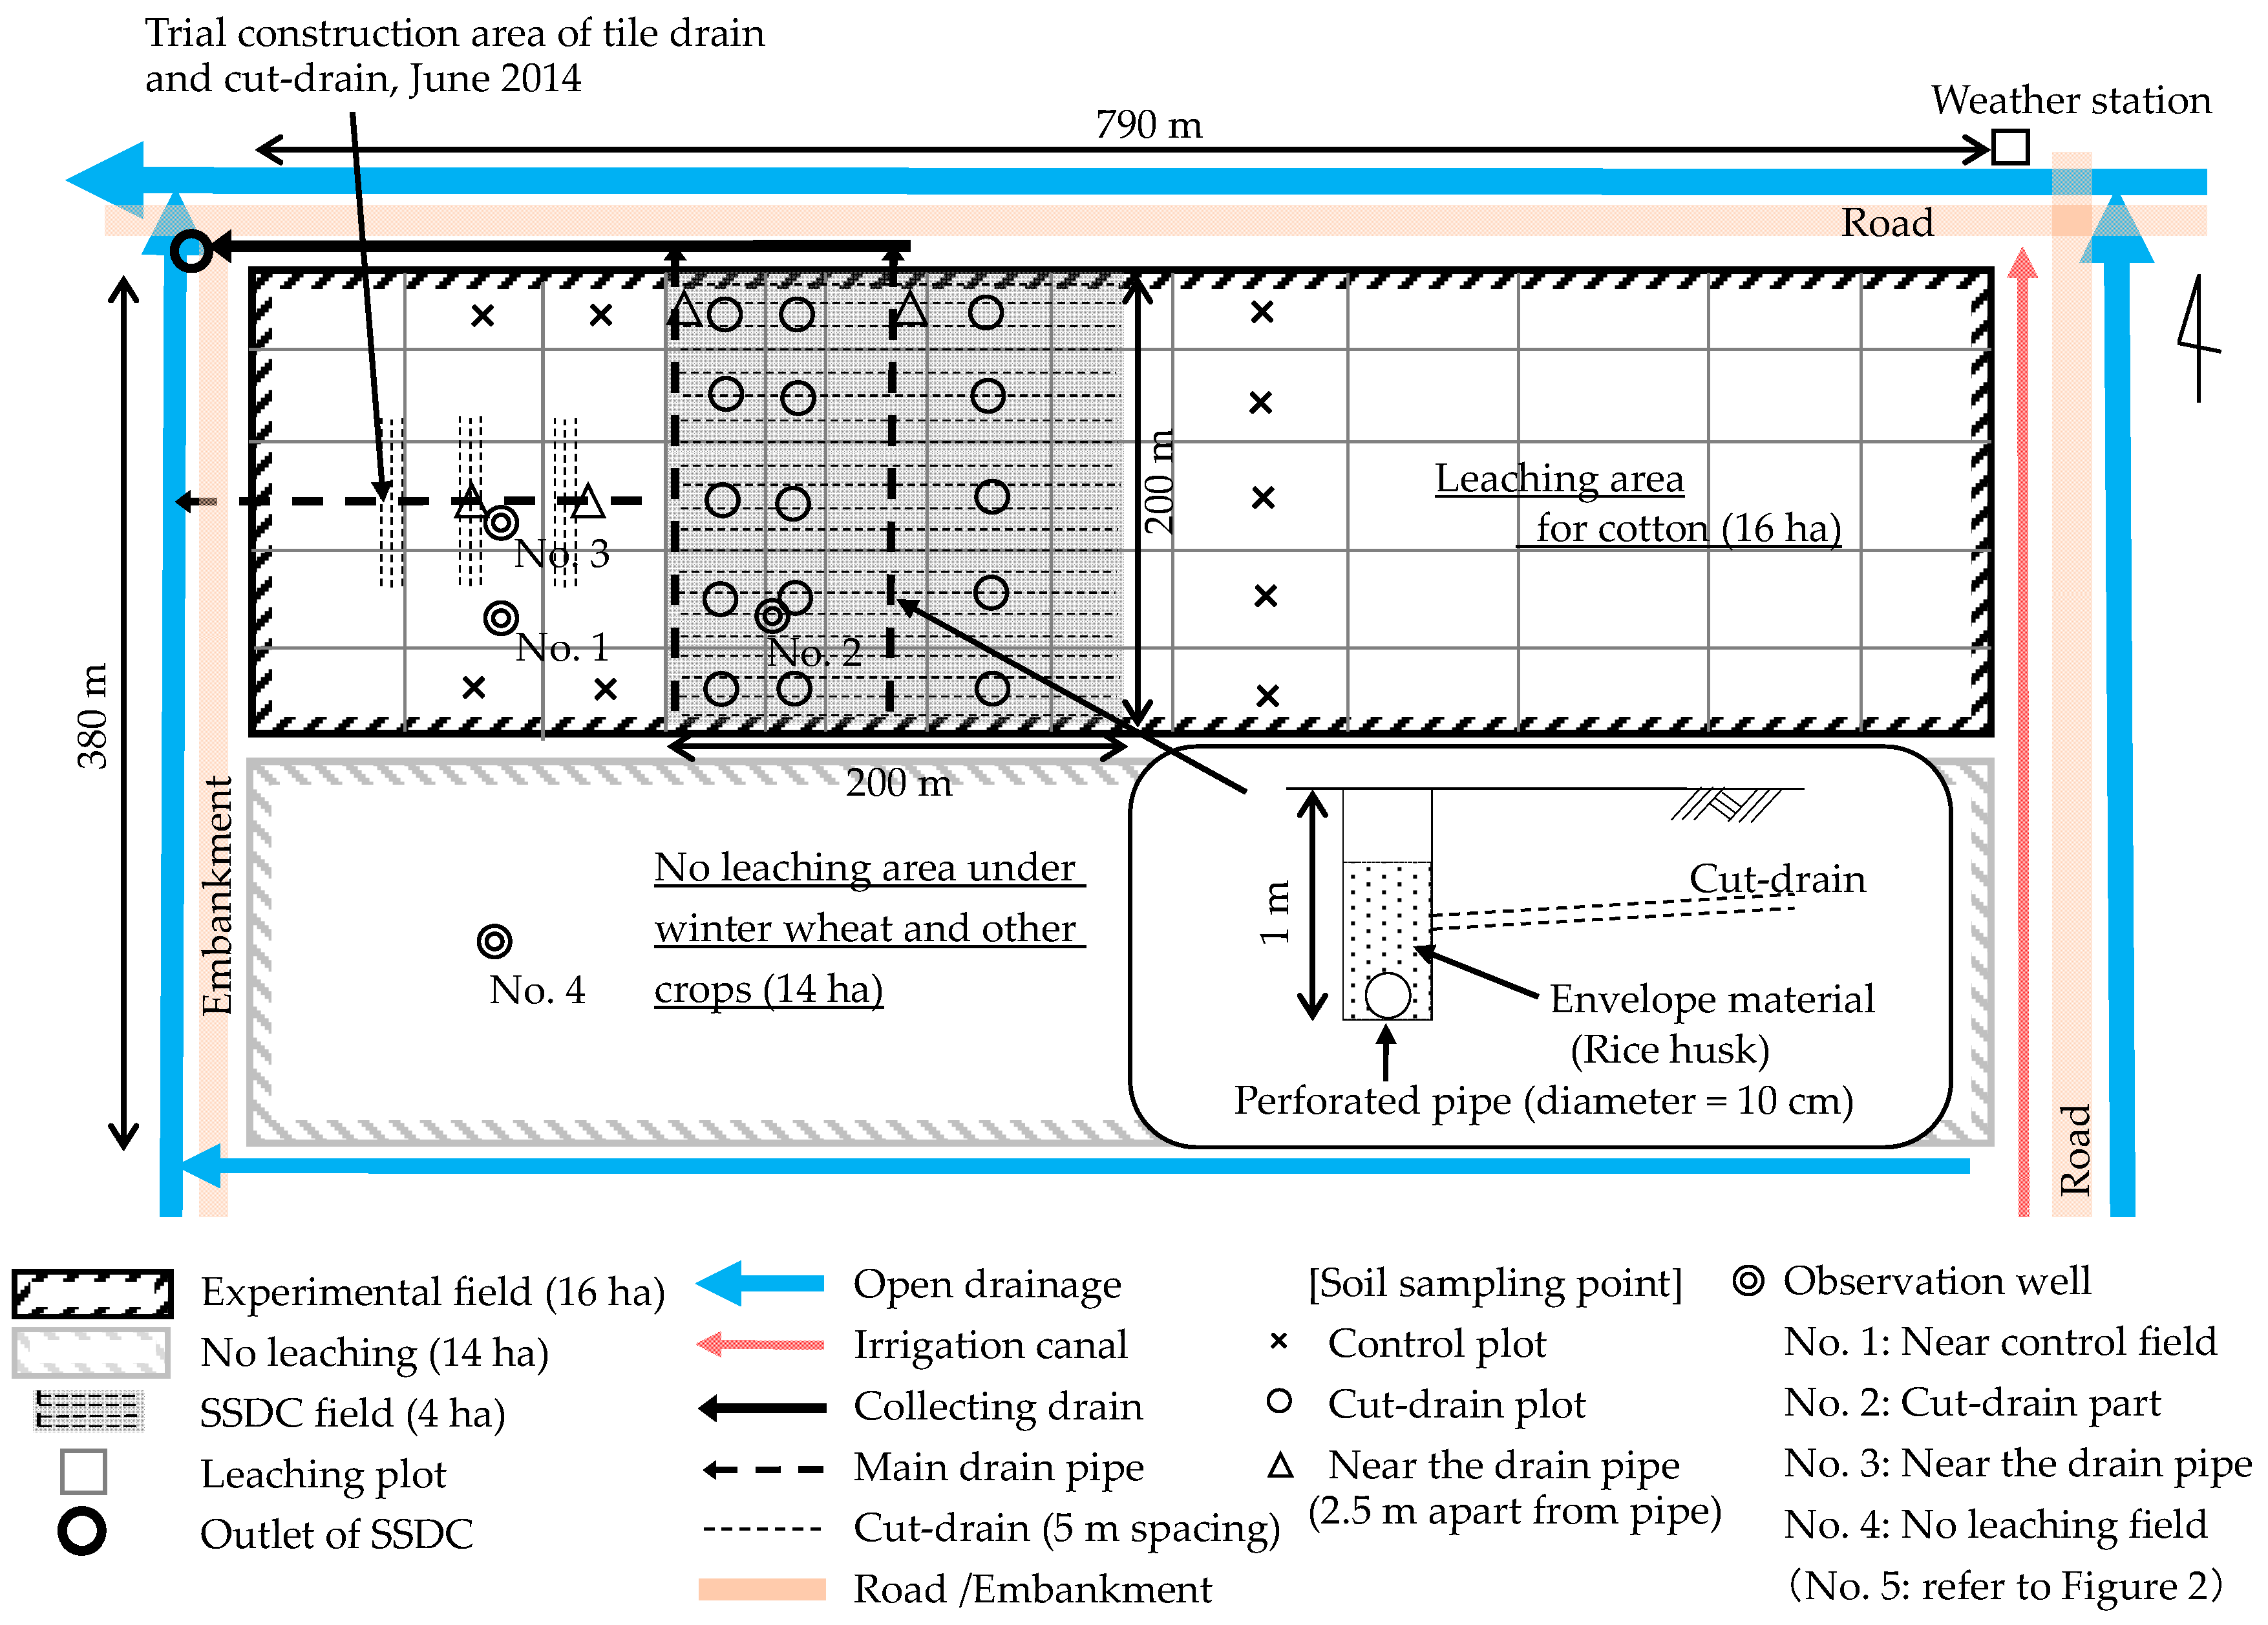
2.2. Experimental Set-Up
2.3. Analysis
2.3.1. Water and Salt Balance
2.3.2. Measurement/Presumption of Data
- Soil moisture: Ws1, Ws2
- Leaching water: Wi
- Precipitation: Wr
- Groundwater inflow to the root zone (0–100 cm) from outside: Wg1
- Groundwater outflow from SSDC: Wg2
- Seepage from the field to the open drainage: Wg3
- Evapotranspiration: Wet
- Salinity in the water: Si, Sr, Sg1, Sg2, Sg3
- Salinity in the soil: Ss1, Ss2
3. Results
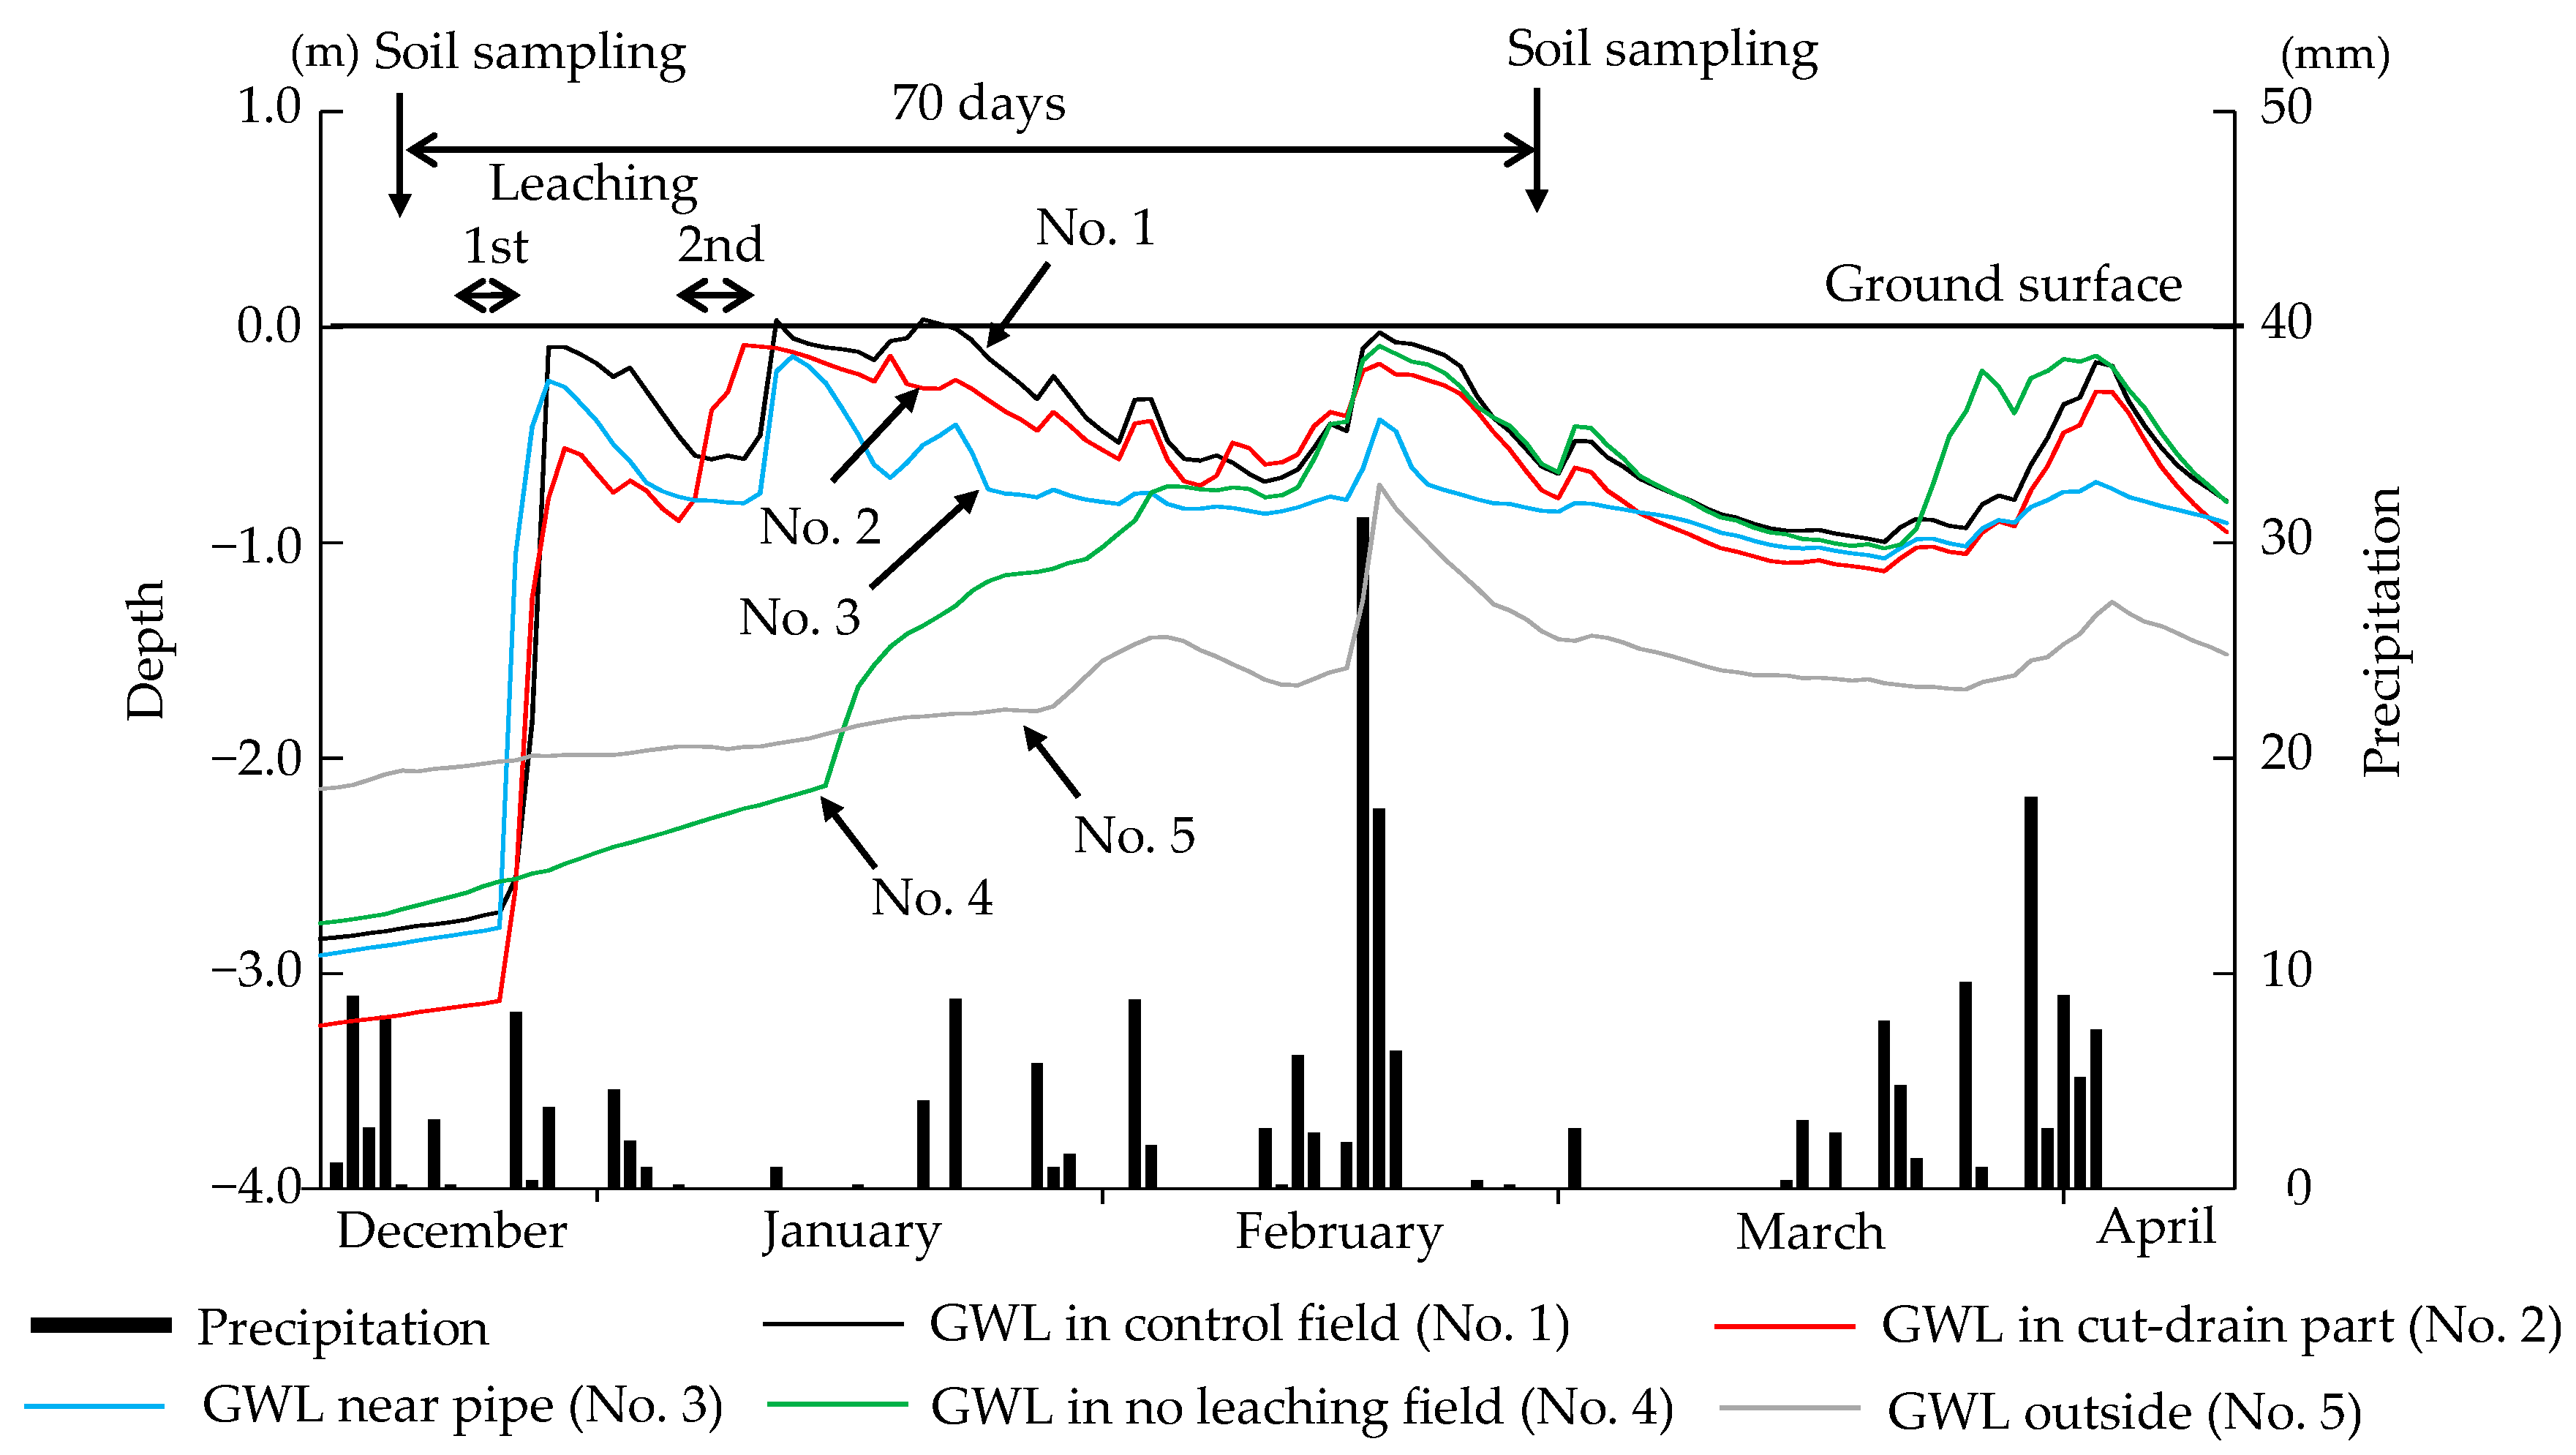
3.1. Data Analysis
- Soil moisture: Ws1, Ws2
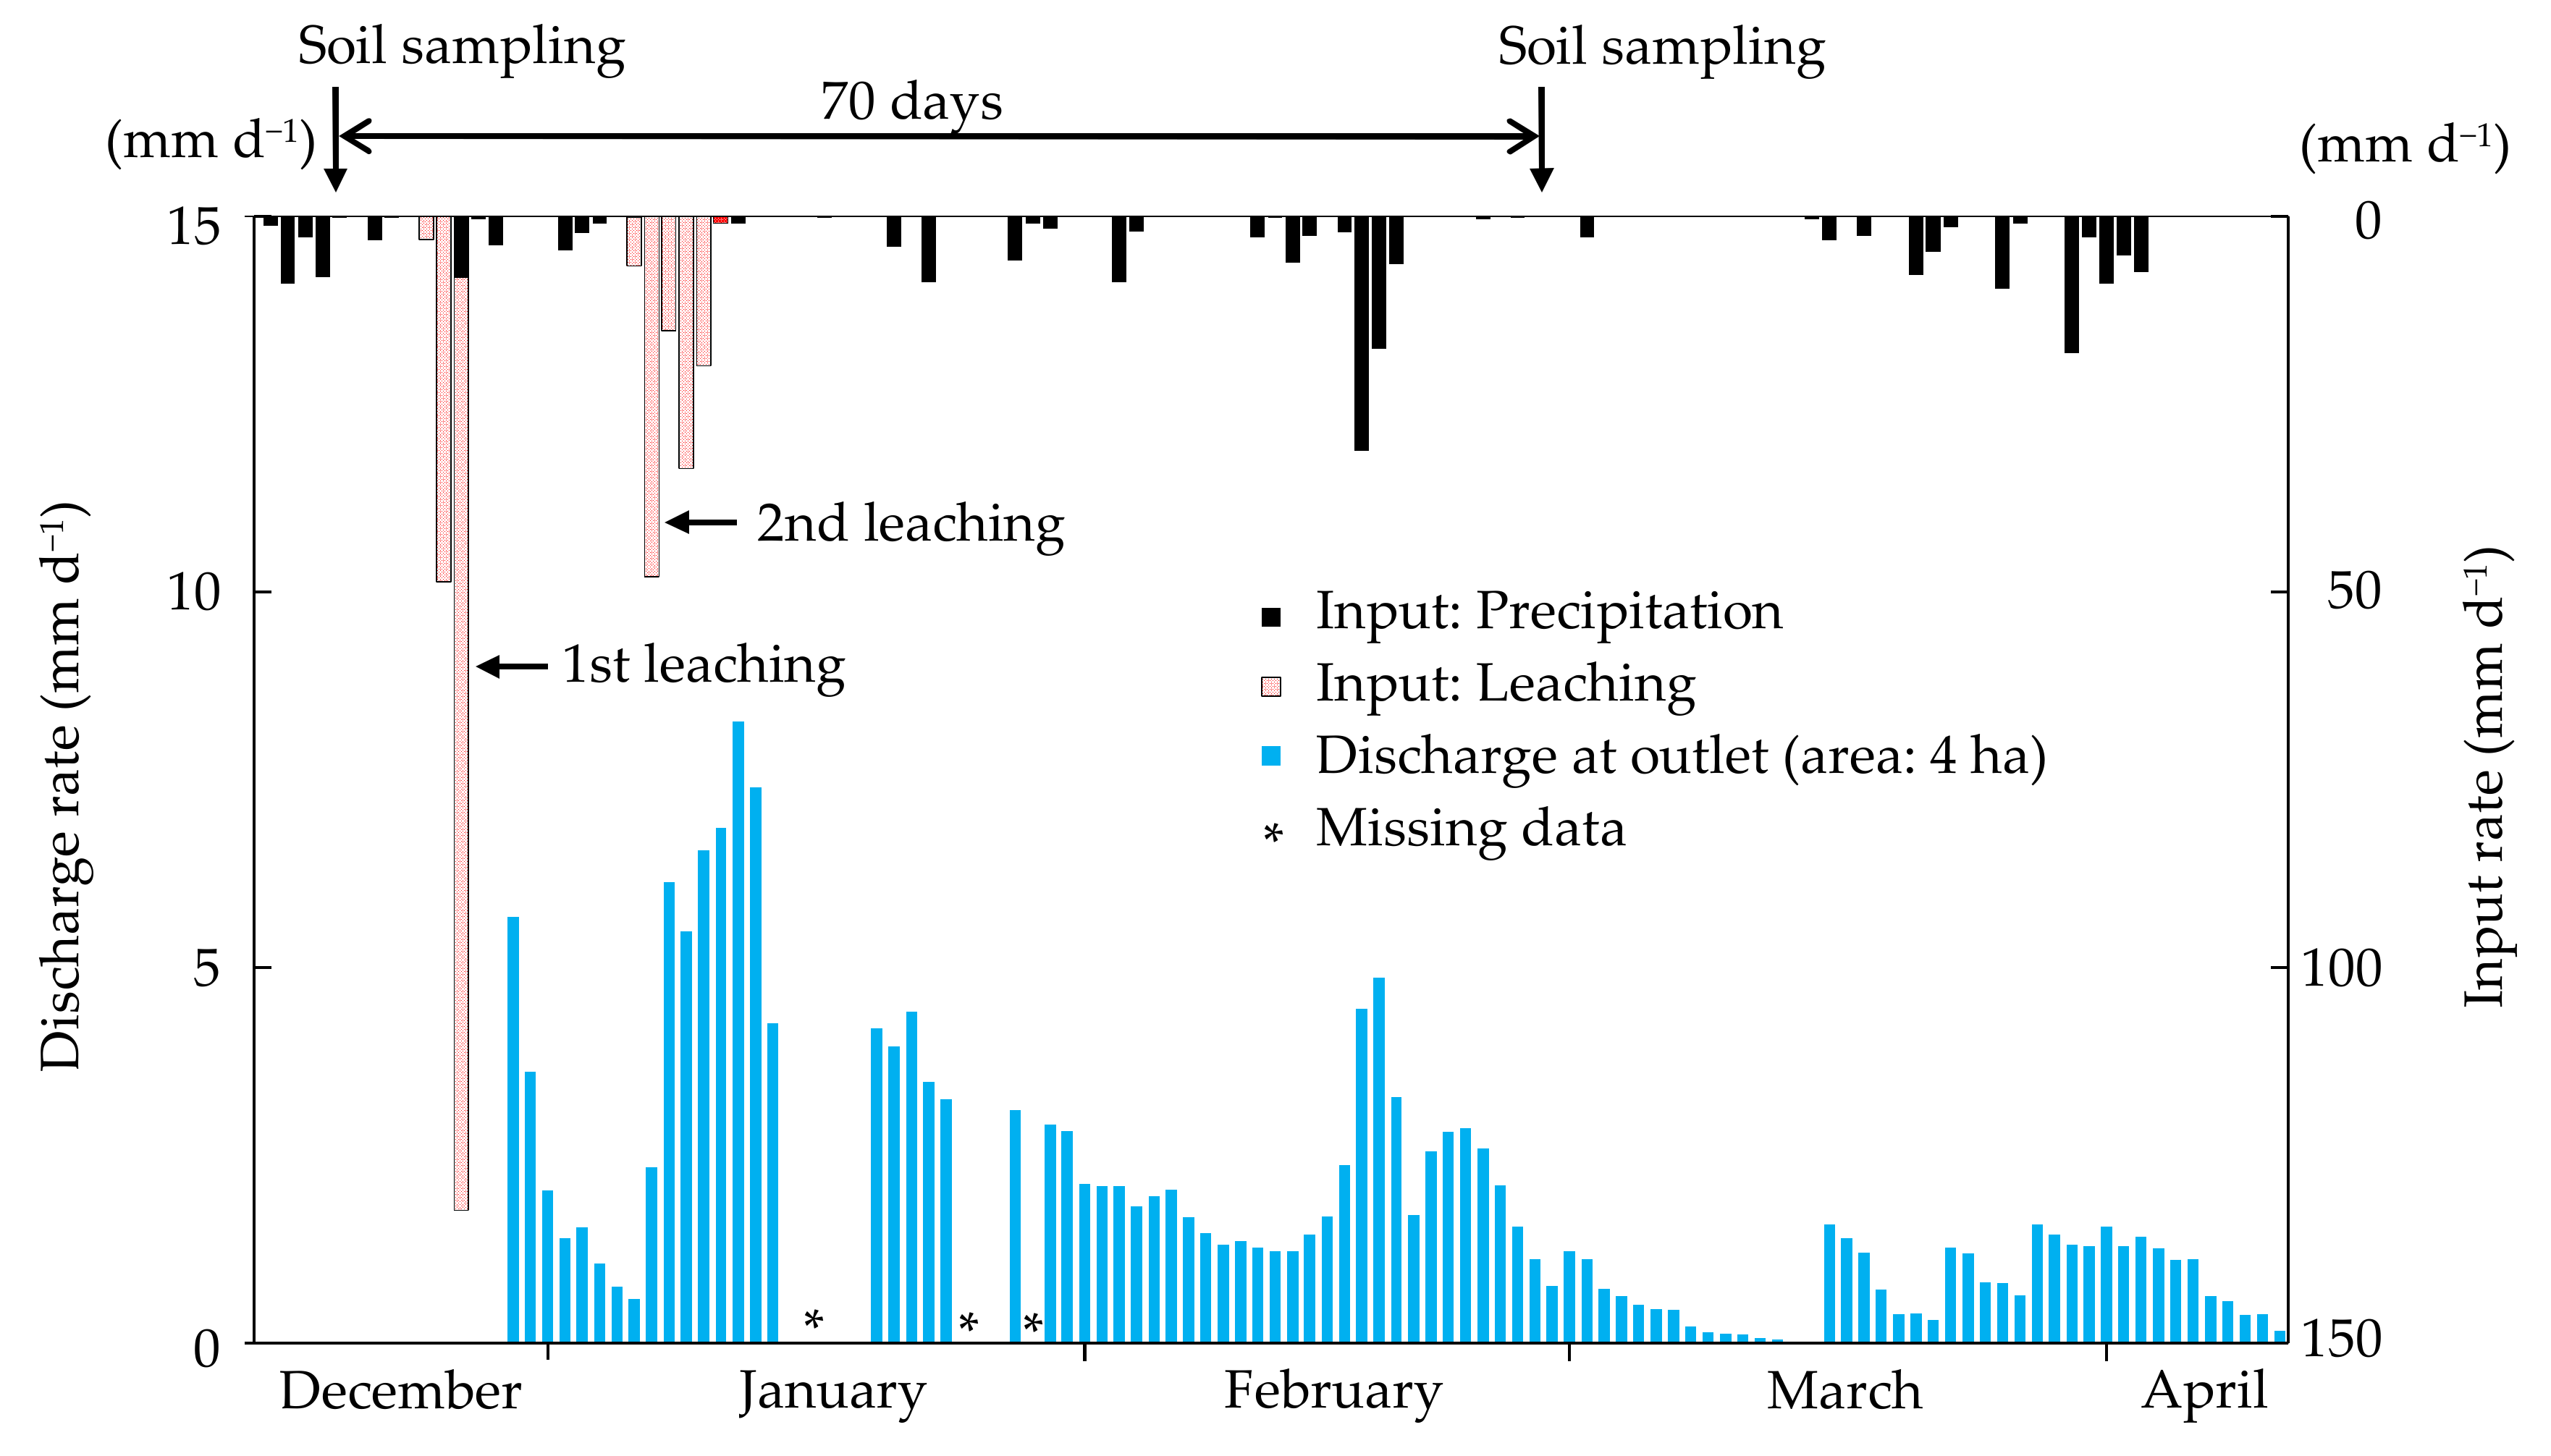
- Leaching water: Wi
- Precipitation: Wr
- Groundwater inflow to the root zone from outside: Wg1
- Groundwater outflow from SSDC: Wg2
- Seepage from the field to the open drainage: Wg3
- Evapotranspiration: Wet
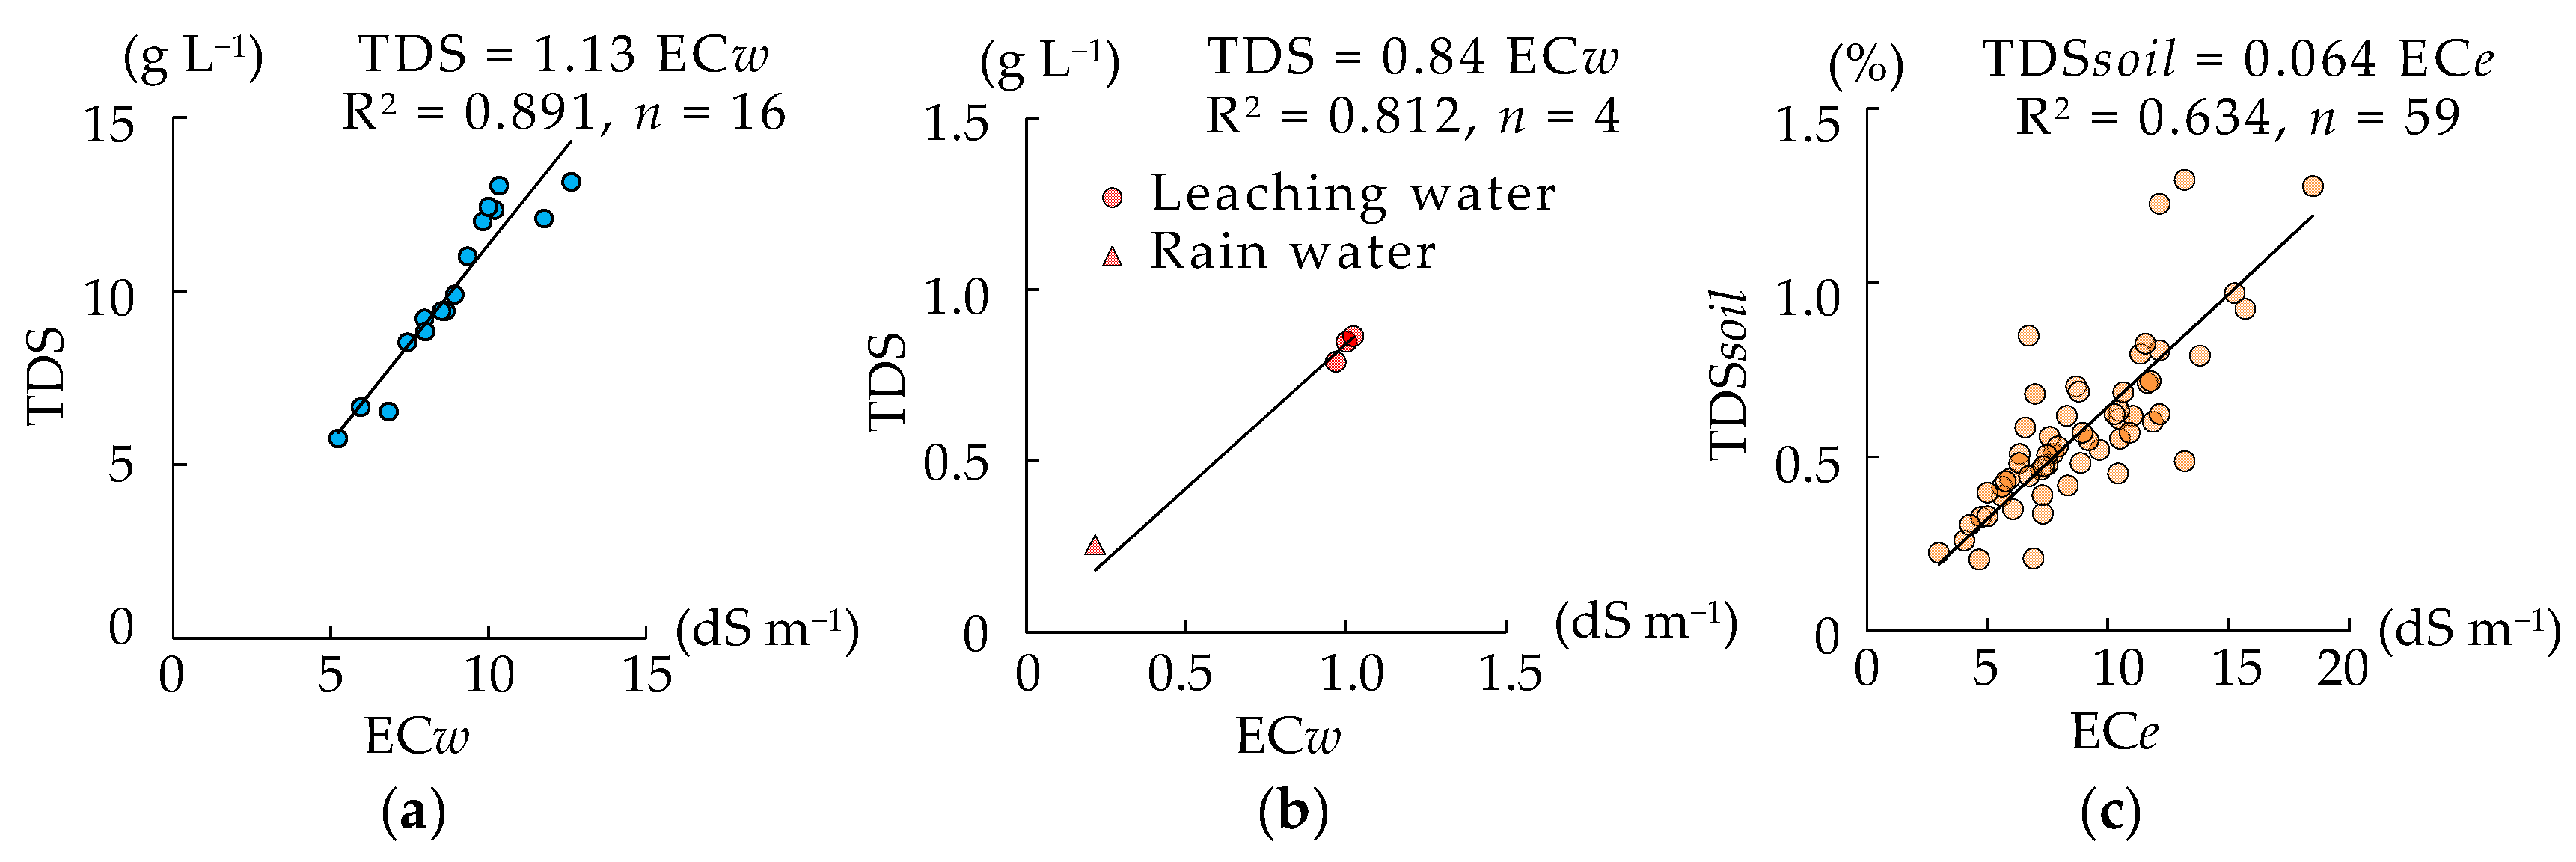
- Salinity in the water: Si, Sr, Sg1, Sg2, Sg3
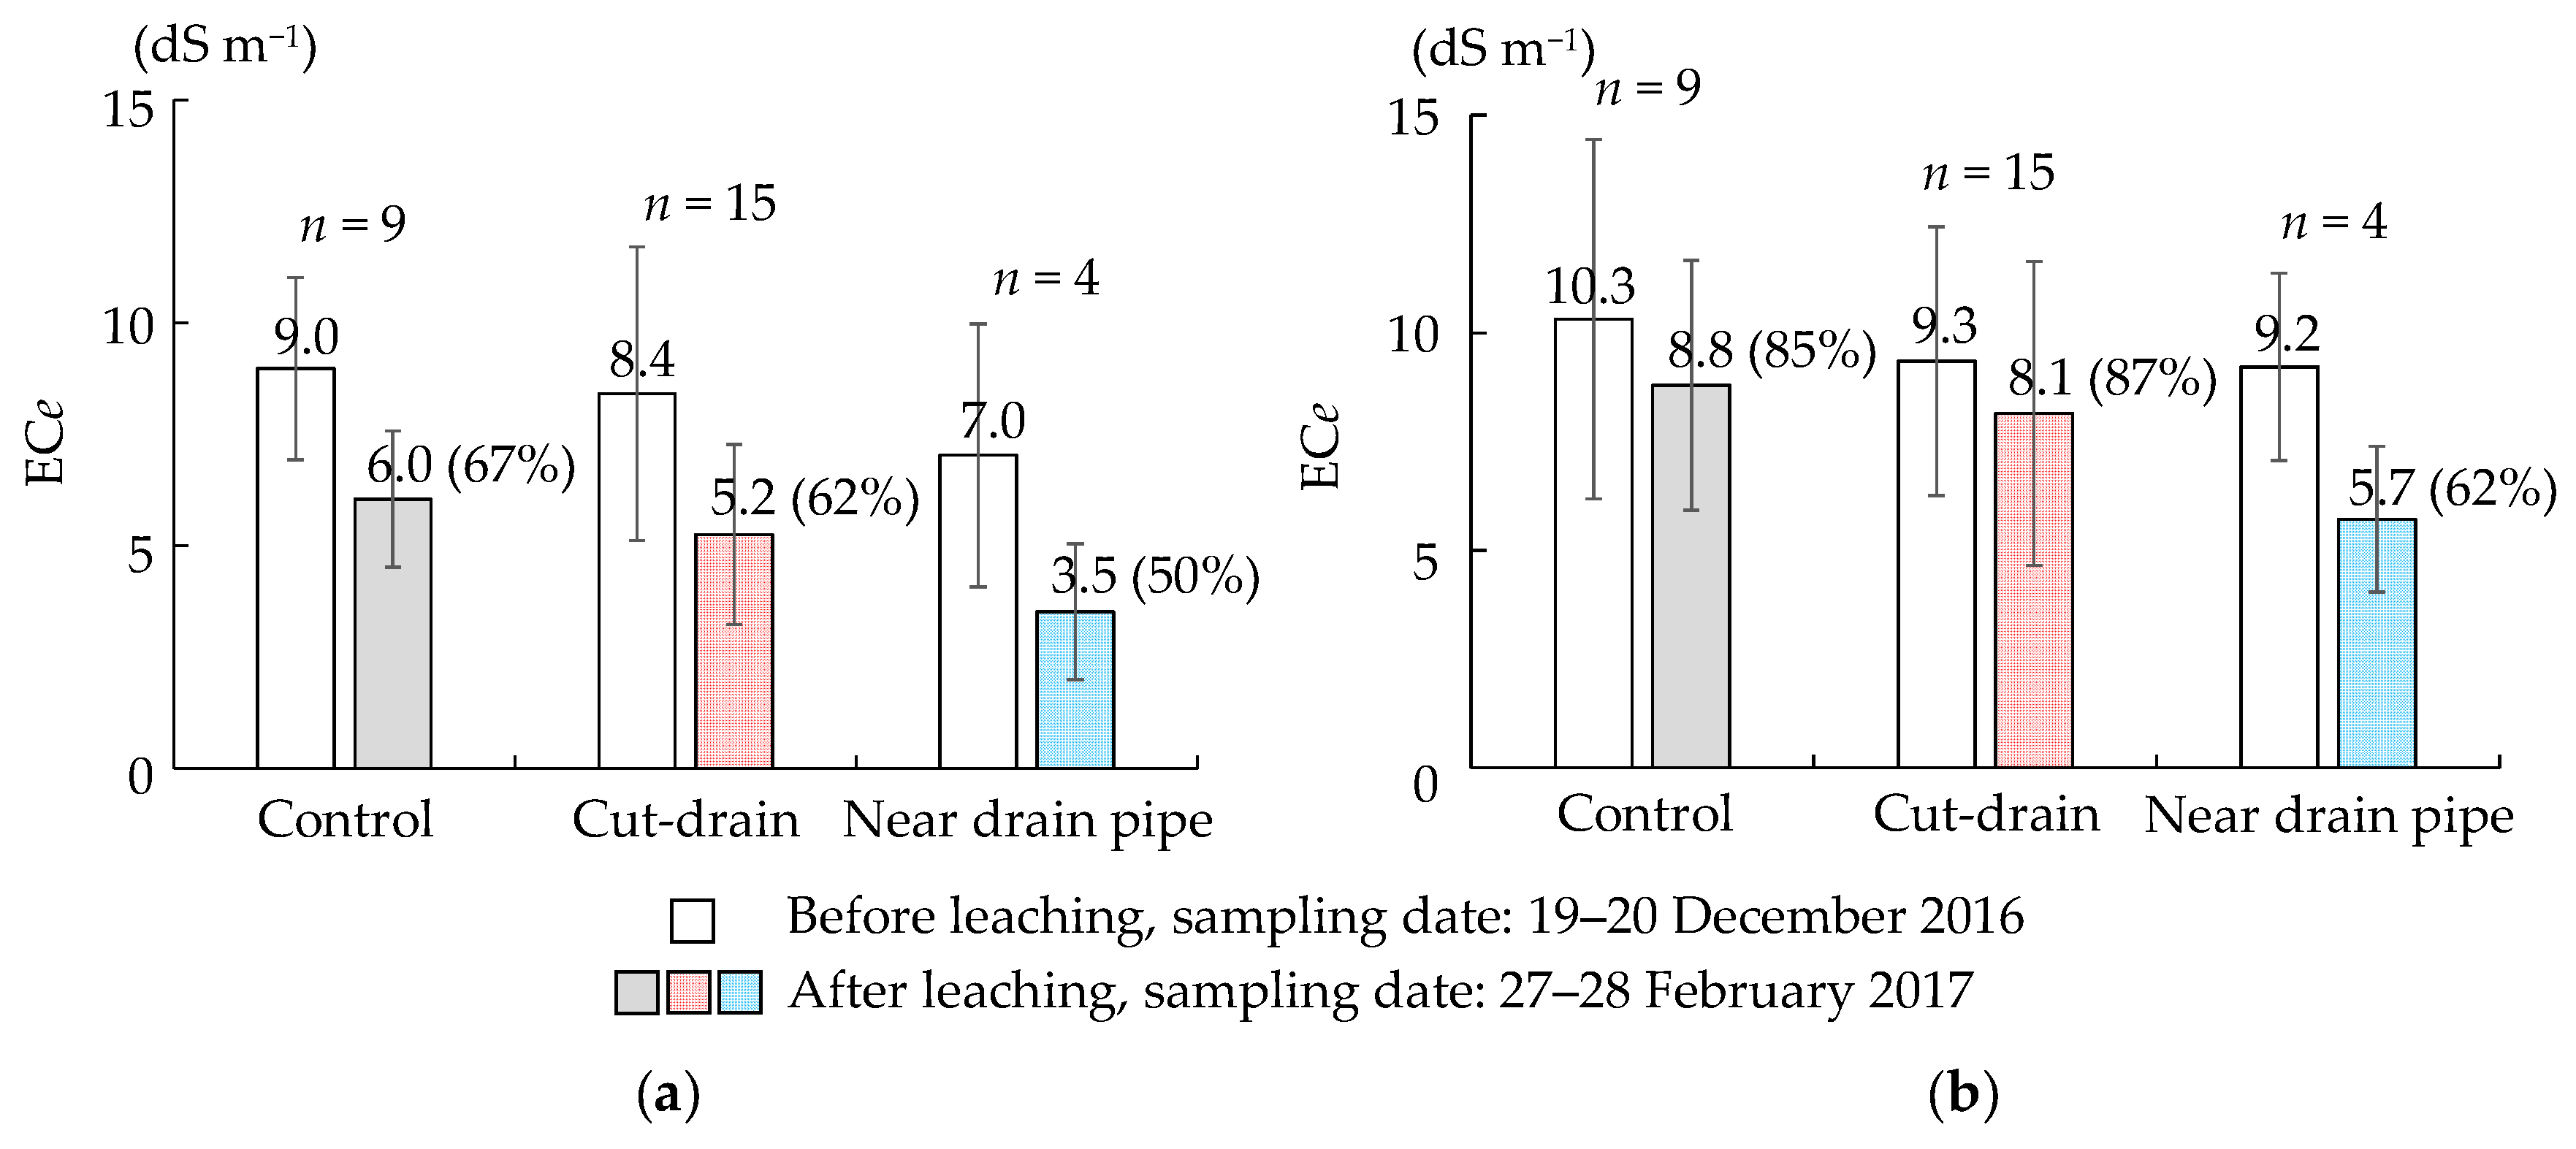
- Salinity in the soil: Ss1, Ss2
3.2. Water and Salt Balance
- Remaining water in the fields: Ws2 + Wg4
- Remaining salt in the fields: Ss2 + Sg4
4. Discussion
4.1. Water and Salt Balance
4.2. Future Development of the SSDC
5. Conclusions
Supplementary Materials
Author Contributions
Funding
Acknowledgments
Conflicts of Interest
Abbreviations
| DWL | Drainage water level |
| ECe | Electric conductivity of a saturated extract |
| EC1:1 | Electric conductivity of a 1:1 suspension |
| ET | Evapotranspiration |
| ET0 | Reference evapotranspiration |
| GWL | Groundwater level |
| SDGs | Sustainable Development Goals |
| Sg1 | Salt mass in groundwater inflow to the root zone (0–100 cm) |
| Sg2 | Salt mass in groundwater outflow from the outlet of the SSDC |
| Sg3 | Salt mass in groundwater outflow by seepage from the field to the open drainage |
| Sg4 | Salt mass in groundwater outflow from the root zone (0–100 cm) into the deeper zone or neighboring field |
| Si | Salt mass in irrigation water |
| Sr | Salt mass in rain water |
| Ss1 | Salt mass in root zone (0–100 cm) before leaching |
| Ss2 | Salt mass in root zone (0–100 cm) after leaching |
| SSDC | Shallow subsurface drainage with cut-drains |
| TDS | Total dissolved solid in the water |
| TDSsoil | Total dissolved solid in the soil |
| WCA | Water Consumers’ Association |
| Wd | Amount of water of surface discharge water from the field |
| Wet | Amount of water of evapotranspiration |
| Wg1 | Amount of groundwater inflow to the root zone (0–100 cm) |
| Wg2 | Amount of groundwater outflow from the outlet of the SSDC |
| Wg3 | Amount of groundwater outflow by seepage from the field to the open drainage |
| Wg4 | Amount of groundwater outflow from the root zone (0–100 cm) into the deeper zone or neighboring field |
| Wi | Amount of irrigation water |
| Wr | Amount of rain water |
| Ws1 | Amount of water in root zone (0–100 cm) before leaching |
| Ws2 | Amount of water in root zone (0–100 cm) after leaching |
References
- Dukhovny, V.; Umarov, P.; Yakubov, H.; Madramootoo, C.A. Drainage in the Aral Sea Basin. Irrig. Drain. 2007, 56, 91–100. [Google Scholar] [CrossRef]
- Dukhovny, V.A.; Yakubov, K.I.; Umarov, P.D. Drainage and salinity control: Review of related problems in Central Asia. In Irrigation Management for Combating Desertification in the Aral Sea Basin. Assessment and Tools; Pereira, L.S., Dukhovny, V.A., Horst, M.G., Eds.; Vita Color: Tashkent, Uzbekistan, 2005; pp. 249–270. [Google Scholar]
- Qushimov, B.; Ganiev, I.M.; Rustamova, I.; Haitov, B.; Islam, K.R. Land Degradation by Agricultural Activities in Central Asia. In Climate Change and Terrestrial Carbon Sequestration in Central Asia, 1st ed.; Lal, R., Suleimenov, M., Stewart, B.A., Hansen, D.O., Doraiswamy, P., Eds.; Taylor & Francis: London, UK, 2007; pp. 137–146. [Google Scholar]
- Kulmatov, R. Problems of Sustainable Use and Management of Water and Land Resources in Uzbekistan. JWARP 2014, 6, 35–42. [Google Scholar] [CrossRef]
- Bucknall, J.; Klytchnikova, I.; Lampietti, J.; Lundell, M.; Scatasta, M.; Thurman, M. Irrigation in Central Asia, Social, Economic and Environmental Considerations; World Bank: Washington, DC, USA, 2003. [Google Scholar]
- UNCCD. Global Land Outlook, 1st ed.; United Nations Convention to Combat Desertification: Bonn, Germany, 2017; pp. 246–269. [Google Scholar]
- Keesstra, S.; Mol, G.; de Leeuw, J.; Okx, J.; Molenaar, C.; de Cleen, M.; Visser, S. Soil-Related Sustainable Development Goals: Four Concepts to Make Land Degradation Neutrality and Restoration Work. Land 2018, 7, 133. [Google Scholar] [CrossRef]
- Keesstra, S.D.; Bouma, J.; Wallinga, J.; Tittonell, P.; Smith, P.; Cerdà, A.; Montanarella, L.; Quinton, J.N.; Pachepsky, Y.; van der Putten, W.H.; et al. The significance of soils and soil science towards realization of the United Nations Sustainable Development Goals. Soil 2016, 2, 111–128. [Google Scholar] [CrossRef]
- Khamraev, S.R.; Dukhovny, V.A.; Kadyrov, A.A.; Sokolov, V.I. (Eds.) Water Resources Management in Uzbekistan, 1st ed.; GWP CACENA: Tashkent, Uzbekistan, 2011; pp. 25–65. [Google Scholar]
- Frenken, K. Irrigation in Central Asia in figures AQUASTAT Survey-2012. FAO Water Rep. 2013, 39, 183–197. [Google Scholar]
- Okuda, Y.; Onishi, J. Current Status and Problems of Farmland Damage from Salinization in Uzbekistan. J. JSIDRE 2012, 80, 3–6. (In Japanese) [Google Scholar]
- Okuda, Y.; Onishi, J.; Omori, K.; Oya, T.; Fukuo, A.; Kurvantaev, R.; Shirokova, Y.; Nasonov, V. Current Status and Problems of the Drainage System in Uzbekistan. Trans. JALS 2015, 25, 81–84. [Google Scholar]
- Okuda, Y.; Onishi, J.; Omori, K. Actual Condition of Vertical Drainage for Farmland Salinization in Republic of Uzbekistan. J. JSIDRE 2015, 83, 21–24. (In Japanese) [Google Scholar]
- Kaneko, T.; Murakawa, M.; Kozai, N.; Mitsugi, K. Desalting Technique for Illuviated Salts Soil at Paddy Field by Using Underdrainage. J. JSIDRE 2002, 70, 27–30. (In Japanese) [Google Scholar]
- Chiba, K.; Kato, T.; Togashi, C.; Kanmuri, H. Effectiveness of Desalinization by Infiltration of Water and Desalinization of Tsunami-hit Farmlands in Miyagi Prefecture. J. JSIDRE 2012, 80, 3–6. (In Japanese) [Google Scholar]
- Ritzema, H.P.; Satyanarayana, T.V.; Raman, S.; Boonstra, J. Subsurface drainage to combat waterlogging and salinity in irrigated lands in India: Lessons learned in farmers’ fields. Agric. Water Manag. 2008, 95, 179–189. [Google Scholar] [CrossRef]
- Kitagawa, I.; Tsuneta, D.; Haraguchi, N.; Wakasugi, K. Low-cost Drainage Technologies of Realizing Agricultural Infrastructure Improvements for High-Yielding Farm Land. J. JSIDRE 2010, 78, 7–10. (In Japanese) [Google Scholar]
- Lu, P.; Zhang, Z.; Feng, G.; Huang, M.; Shi, X. Experimental Study on the Potential Use of Bundled Crop Straws as Subsurface Drainage Material in the Newly Reclaimed Costal Land in Eastern China. Water 2018, 10, 31. [Google Scholar] [CrossRef]
- Kitagawa, I.; Takeuchi, H.; Kotani, H.; Chiba, Y. Efficacy and Applicability of the Cutting Drain Method in Excavating Underdrains. Trans. JSIDRE 2010, 267, 11–16. (In Japanese) [Google Scholar]
- Cavelaars, J.C.; Vlotman, W.F.; Spoor, G. Subsurface Drainage Systems. In Drainage Principles and Applications, 2nd ed.; Ritzema, H.P., Ed.; ILRI: Wageningen, The Netherlands, 1994; pp. 827–929. [Google Scholar]
- Yannopoulos, S.I.; Grismer, M.E.; Bali, K.M.; Angelakis, A.N. Evolution of the Materials and Methods Used for Subsurface Drainage of Agricultural Lands from Antiquity to the Present. Water 2020, 12, 1767. [Google Scholar] [CrossRef]
- Bezborodov, G.A.; Shadmanov, D.K.; Mirhashimov, R.T.; Yuldashev, T.; Qureshi, A.S.; Noble, A.D.; Qadir, M. Mulching and water quality effects on soil salinity and sodicity dynamics and cotton productivity in Central Asia. Agric. Ecosyst. Environ. 2010, 138, 95–102. [Google Scholar] [CrossRef]
- Onishi, J.; Okuda, Y.; Paluashova, G.K.; Shirokova, Y.I.; Kitamura, Y.; Fujimaki, H. Salt pushing effect to the side of the ridge by fixed skip furrow irrigation—Case study in the Republic of Uzbekistan. Trans. JALS 2018, 28, 155–158. [Google Scholar]
- Djumaboev, K.; Hamidov, A.; Anarbekov, O.; Gafurov, Z.; Tussupova, K. Impact of Institutional Change on Irrigation Management: A Case Study from Southern Uzbekistan. Water 2017, 9, 419. [Google Scholar] [CrossRef]
- Kitamura, Y.; Yano, T.; Honna, T.; Yamamoto, S.; Inosako, K. Causes of farmland salinization and remedial measures in the Aral Sea basin—Research on water management to prevent secondary salinization in rice-based cropping system in arid land. Agric. Water Manag. 2006, 85, 1–14. [Google Scholar] [CrossRef]
- Okuda, Y.; Onishi, J.; Shirokova, Y.I.; Kitagawa, I.; Kitamura, Y.; Fujimaki, H. Salt removal technology by shallow subsurface drainage in combination with a cut-drain. Trans. JALS 2018, 28, 127–130. [Google Scholar]
- Okuda, Y.; Goto, K.; Kitagawa, I. A Trail of Desalinization by Using Mole-Drain in Republic of Uzbekistan. J. JSIDRE 2015, 83, 7–10. (In Japanese) [Google Scholar]
- Okuda, Y.; Fujimaki, H.; Kitamura, Y.; Kitagawa, I. Problems and Measures for the Adoption of Cut-drain and Its Applicability to Soil Conditions in Uzbekistan. Trans. JSIDRE 2017, 305, II_83–II_90. (In Japanese) [Google Scholar]
- Okuda, Y. Studies on Applicability and Effect of Shallow Subsurface Drainage with Cut-Drain for Salinized Irrigated Land in Central Asia. Ph.D. Thesis, Tottori University, Tottori, Japan, 13 September 2019. (In Japanese). [Google Scholar]
- Shirokova, Y.; Forkutsa, I.; Sharafutdinova, N. Use of electrical conductivity instead of soluble salts for soil salinity monitoring in Central Asia. Irrig. Drain. Syst. 2000, 14, 199–205. [Google Scholar] [CrossRef]
- Visser, S.; Keesstra, S.; Maas, G.; de Cleen, M.; Molenaar, C. Soil as a Basis to Create Enabling Conditions for Transitions towards Sustainable Land Management as a Key to Achieve the SDGs by 2030. Sustainability 2019, 11, 6792. [Google Scholar] [CrossRef]
- Kitamura, Y.; Oweis, T.Y. Agricultural Water Management in the Drylands: New Paradigm to Cope with Scarcity and Climate Change; GIHODO SHUPPAN Co., Ltd.: Tokyo, Japan, 2018; pp. 179–194. [Google Scholar]


| Layer | Ks | Bulk Density |
|---|---|---|
| cm s−1 | g cm−1 | |
| Plow layer (0–20 cm) | 1.3 × 10⁻⁵ | 1.60 |
| Hard layer (20–40 cm) | 5.0 × 10⁻⁶ | 1.65 |
| Lower layer (40–80 cm) | 3.8 × 10⁻⁵–7.7 × 10⁻⁵ | 1.45–1.54 |
| Treatment | Input | Groundwater Inflow | Outlet of SSDC | Seepage to Drainage | ET | Root Zone 0–100 cm | Remaining Portion | |||
|---|---|---|---|---|---|---|---|---|---|---|
| Before Leaching | After Leaching | Diff. | Total in Field | Outside of the Zone 0–100 cm | ||||||
| Water balance (mm) | ||||||||||
| Wi + Wr | Wg1 | Wg2 | Wg3 | Wet | Ws1 (%) | Ws2 (%) | Δ | Ws2 + Wg4 | Wg4 | |
| Control field | 437 | 0 | 0 | 52 | 56 | 261 (100) | 384 (100) | 123 | 590 (100) | 206 (100) |
| SSDC field | 437 | 0 | 149 | 52 | 56 | 259 (99) | 379 (99) | 120 | 439 (74) | 60 (29) |
| Salt balance (Mg ha−1) | ||||||||||
| Si + Sr | Sg1 | Sg2 | Sg3 | Set | Ss1 | Ss2 | SΔ | Ss2 + Sg4 | Sg4 | |
| Control field | 3.3 | 0 | 0 | 6.0 | 0 | 93.4 (100) | 69.7(100) | −23.7 | 90.7 (100) | 21.0 (100) |
| SSDC field | 3.3 | 0 | 17.2 | 6.0 | 0 | 85.4 (91) | 60.4 (87) | −25.0 | 65.5 (72) | 5.1 (24) |
Publisher’s Note: MDPI stays neutral with regard to jurisdictional claims in published maps and institutional affiliations. |
© 2020 by the authors. Licensee MDPI, Basel, Switzerland. This article is an open access article distributed under the terms and conditions of the Creative Commons Attribution (CC BY) license (http://creativecommons.org/licenses/by/4.0/).
Share and Cite
Okuda, Y.; Onishi, J.; Shirokova, Y.I.; Kitagawa, I.; Kitamura, Y.; Fujimaki, H. Water and Salt Balance in Agricultural Lands under Leaching with Shallow Subsurface Drainage Used in Combination with Cut-Drains. Water 2020, 12, 3207. https://doi.org/10.3390/w12113207
Okuda Y, Onishi J, Shirokova YI, Kitagawa I, Kitamura Y, Fujimaki H. Water and Salt Balance in Agricultural Lands under Leaching with Shallow Subsurface Drainage Used in Combination with Cut-Drains. Water. 2020; 12(11):3207. https://doi.org/10.3390/w12113207
Chicago/Turabian StyleOkuda, Yukio, Junya Onishi, Yulia I. Shirokova, Iwao Kitagawa, Yoshinobu Kitamura, and Haruyuki Fujimaki. 2020. "Water and Salt Balance in Agricultural Lands under Leaching with Shallow Subsurface Drainage Used in Combination with Cut-Drains" Water 12, no. 11: 3207. https://doi.org/10.3390/w12113207
APA StyleOkuda, Y., Onishi, J., Shirokova, Y. I., Kitagawa, I., Kitamura, Y., & Fujimaki, H. (2020). Water and Salt Balance in Agricultural Lands under Leaching with Shallow Subsurface Drainage Used in Combination with Cut-Drains. Water, 12(11), 3207. https://doi.org/10.3390/w12113207