1. Introduction
Accurate estimates of extreme and rare floods have been a fundamental problem in flood hydrology since pioneer work by Foster [
1], and it is still present among the scientific and engineering communities in numerous papers and reports. Stedinger and Griffis [
2] evaluate critical issues on flood frequency methods, recommending practical developments, among others, on: (i) extending flood records with historical and non-standard flood data (e.g., palaeofloods), which can be called non-systematic information [
3]; (ii) generation of flood data from rainfall records using conceptually based and spatially fully distributed watershed models; and (iii) advances in setting realistic physical limits on precipitation and flows in a given catchment. These research topics seek to gain knowledge about the tail of the frequency distribution describing the extremes, particularly in data-poor regions, either by using regional flood methods [
4], extending the flood registers [
5], and improving parameter estimates related to the distribution shape with upper bounds (e.g., [
6]) or identifying low outliers in flood data [
7]. Traditional flood studies (e.g., for the design of sensitive infrastructures) were based in either flood frequency analysis (FFA) for gauged basins or deterministic procedures, mainly based on the design storm, for ungauged basins. This latter approach draws from the premise that return periods of concurrent rainfall and peak discharge are assumed to be the same and that the design flood of a given return period can be estimated based on a single rainfall duration that generates the highest peak discharge (see the classical Chow et al. [
8] or the Flood Estimation Handbook [
9]). However, we now know that this approach is uncertain since peak discharges and hydrographs are strongly dependent on the spatio-temporal distribution of the precipitation [
10] and on the initial conditions of the basin [
11]. In recent years, different continuous hydrologic modeling approaches have emerged (see, for example, Grimaldi et al. [
12]). An alternative method widely adopted is to combine statistical and deterministic methods in a continuous synthetic simulation (CS). The procedure involves the generation of synthetic discharge data series obtained from a stochastic weather generator (WG) combined with a hydrological model (HM). Many studies can be found in the literature following this approach with different nuances. In an early work, Cameron et al. [
13] combined a modified WG developed by Eagleson [
14] with the semi-distributed HM TOPMODEL. Other examples include WG synthetic datasets from Neyman–Scott rectangular pulse [
15] or spatiotemporal Neyman–Scott processes [
16] integrated on semi-distributed or fully distributed hydrological models. A review of different continuous synthetic simulation approaches can be found in Boughton and Droop [
17].
Continuous synthetic simulation procedures can generate long series of discharges where flood quantiles can be easily interpolated from the empirical plotting positions rather than having to parameterize the discharges data series as in the traditional flood frequency analysis. Nevertheless, WGs require representative data series of observed extreme precipitation in order to perform adequately [
18]. In most of the cases, there may not be sufficient extreme rainfall records, meaning that results from stochastic WG may not generate reliable extreme floods [
19,
20]. This problem has been addressed by several authors who have proposed different alternatives to improve the WG performance. For example, Furrer and Katz [
21] distinguished the type of precipitation by fitting low to moderate intensities to a gamma distribution and high intensities to generalized Pareto distribution. Evin et al. [
22] proposed the use of a heavy-tailed distribution function (E-GPD) and the integration of information from more extensive regional studies for the parametrization of the WG.
In the context of Mediterranean ephemeral rivers, WG and FFA implementation involve a number of practical problems, mostly related to frequent zero or very small flows for the entire year, a large variability of flood peak discharges, and often short observation records [
7]. In arid/semiarid rivers, Metzger et al. [
23] applied synthetic flood records to FFA, concluding that streams with a small number of events per year and a large coefficient of variation of the flood peaks produced the largest errors in the estimated quantiles. Regional regression models were used to improve at-site frequency curves [
24], but their performance in arid/semiarid environments is not as satisfactory as in humid regions because of the higher degree of hydrological variability. The fact that longer records provide less biased estimates, as indicated by Metzger et al. [
23], calls for the inclusion of historical and other non-standard flood data [
25,
26]. These include historical observations, interval data (estimates of flood peaks within specified ranges of magnitude and time), and palaeoflood records [
27]. Palaeoflood data provide physical evidence of flooding over secular time scales and typically consist of fine-texture sediment layers accumulated on valley sides [
28] and durable botanical evidence, such as scars produced by impacting floating debris and stones on riparian trees [
29]. By providing information beyond the systematic records, it is generally possible to extend the observations beyond the 100-year return period and therefore reduce the estimated quantile uncertainty (e.g., [
30,
31,
32]).
The main objective of this paper was to develop a methodology for a better estimation of extreme flooding based on a daily multisite WG and a fully distributed HM supported by a regional extreme precipitation study and non-systematic flood information, validating its results in a case study. Although we integrated both sources of additional information in this research, different variants of this methodology can be applied if only one source of information is available, which will depend on the type of information available.
Under- or overestimation of flood quantiles has always been a problem in flood modeling studies. The main reason behind this is the short length of the available hydrometeorological data series. Most of the former works based in the CS approach do not account for this problem and, although solving the abovementioned issues of the initial conditions of the river basin and the characterization of the spatio-temporal distribution of the precipitation, the estimated higher quantiles still present high uncertainties. This methodology aims to contribute in this sense, obtaining better estimates of the higher flood quantiles and reducing their uncertainty by adding two extra sources of additional information for the implementation of the WG and the validation of the resulting discharges.
2. Case Study and Data Collection
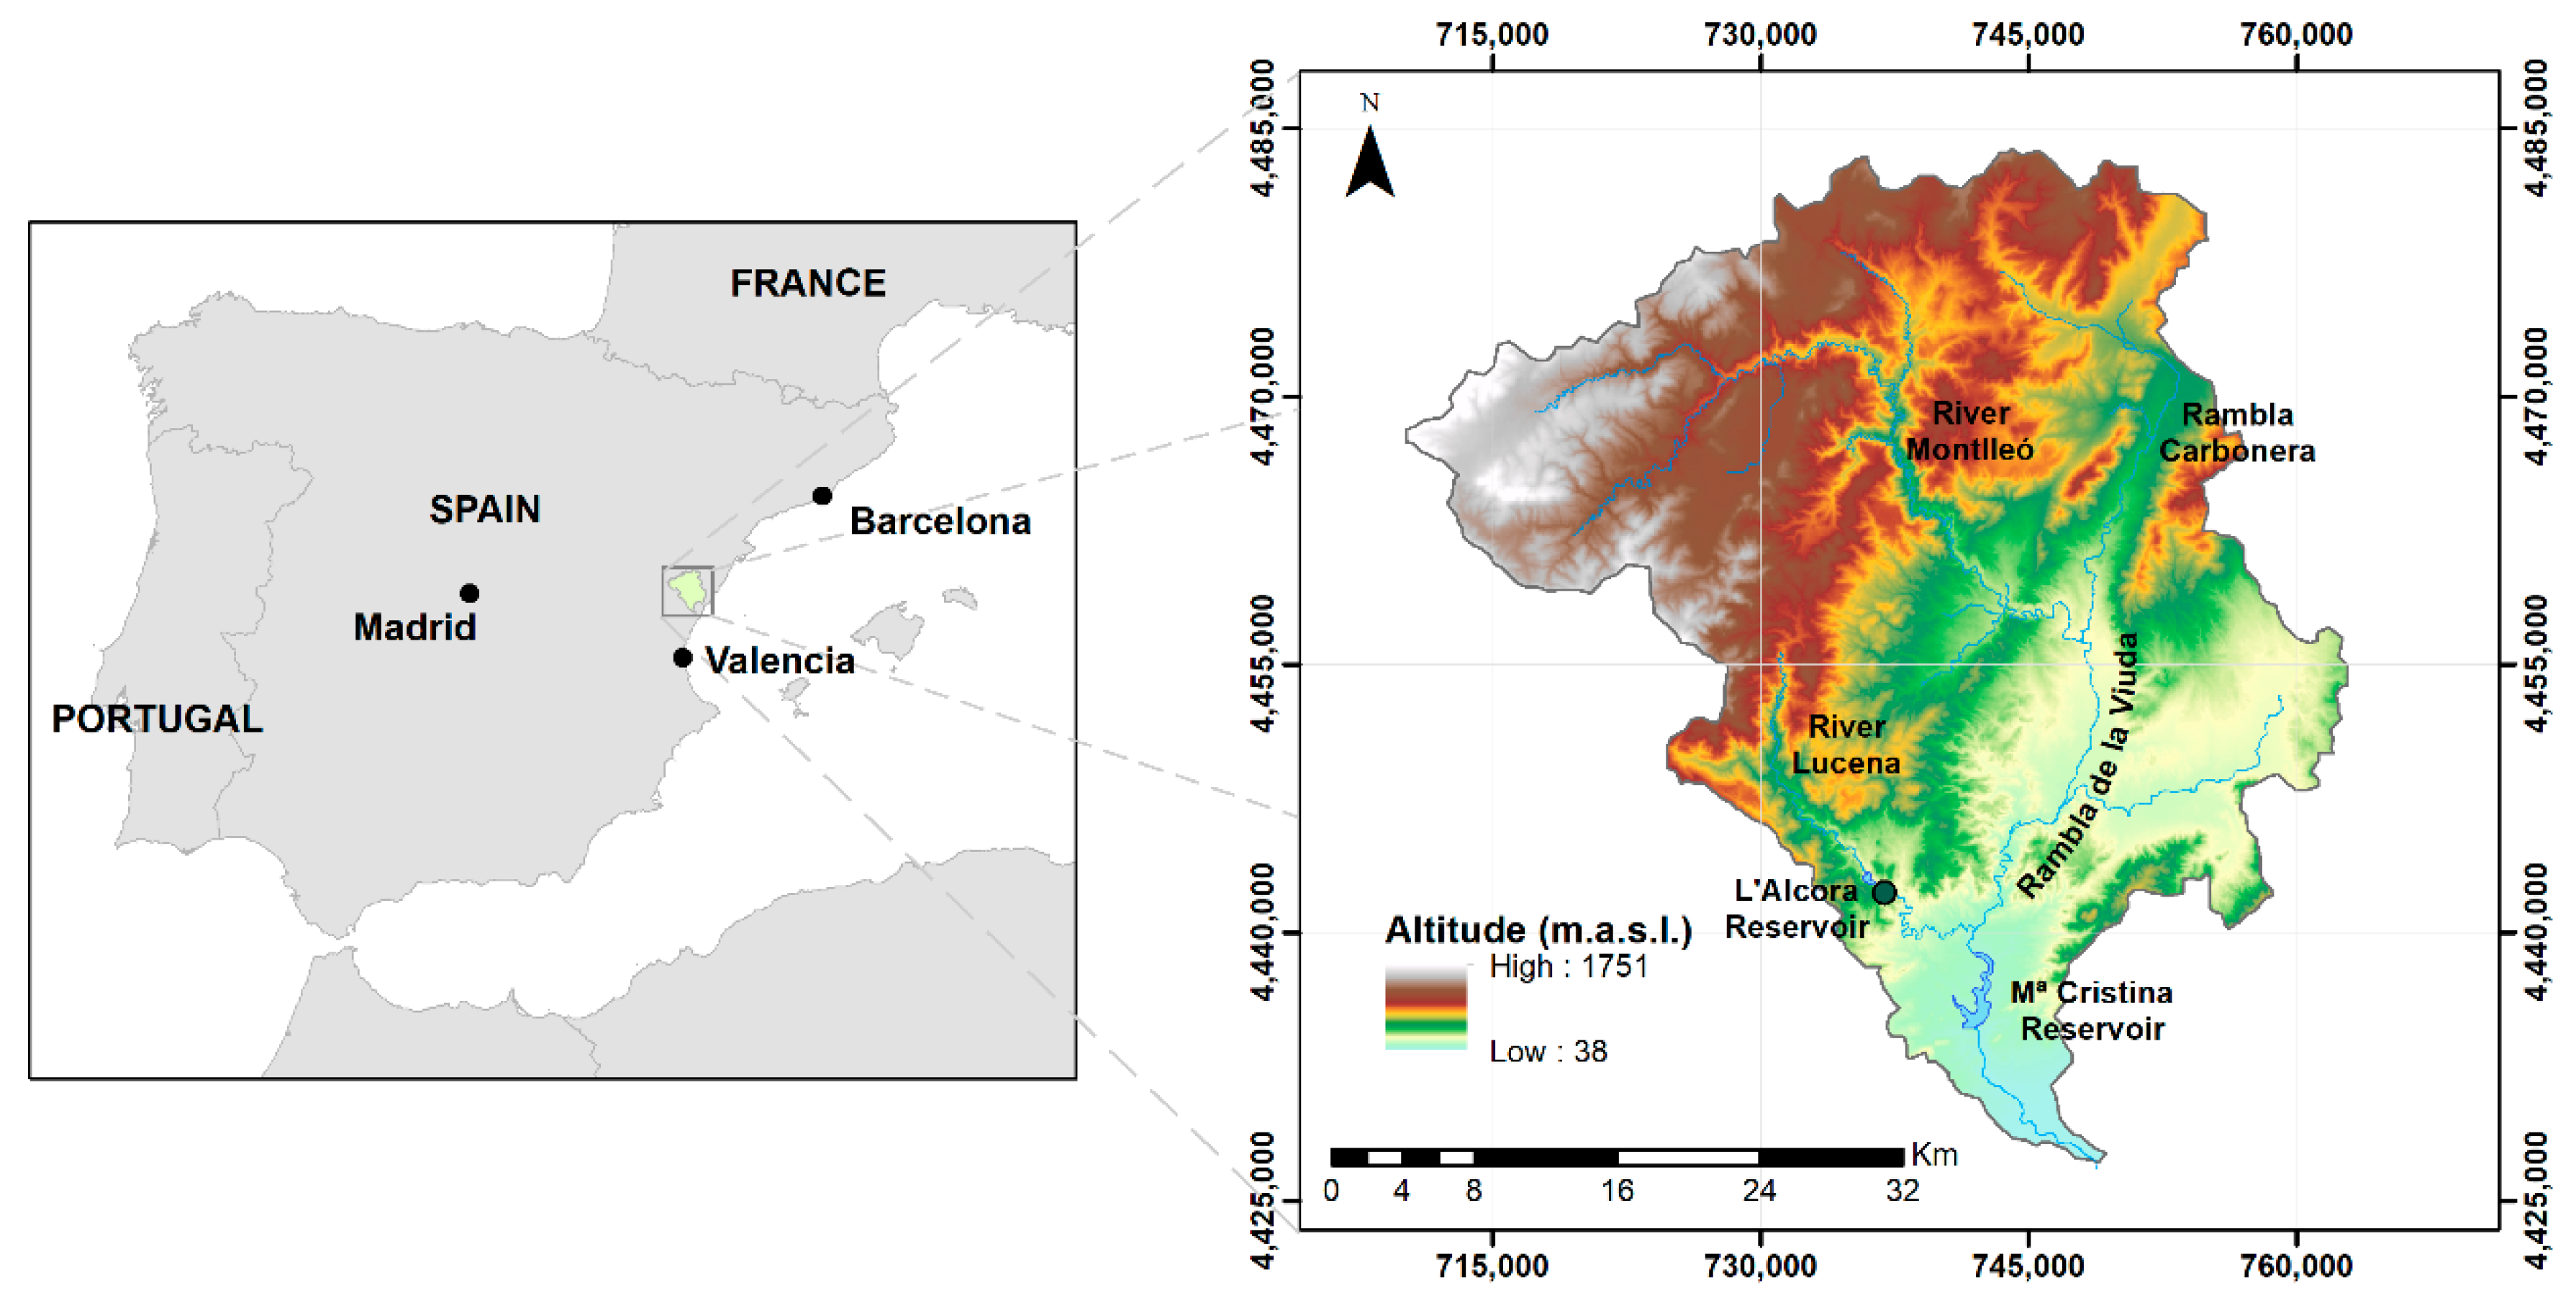
The proposed approach was implemented and evaluated in the catchment of Rambla de la Viuda, a typical Mediterranean ephemeral river located in eastern Spain. The river is ca. 36 km in length and 1513 km
2 in catchment surface, and it originates at the confluence of River Montlleó and Rambla Carbonera, flowing into River Millars near its mouth in the Mediterranean Sea (
Figure 1).
Their headwaters are located at the Iberian Range Mountains at an elevation of 1750 m above sea level, with a substrate dominated by Jurassic and Cretaceous limestones and marls affected by the Alpine tectonic reactivated during the Neogene [
33]. This bedrock lithology favors karstification processes, leading to high infiltration and percolation rates into a deep karst aquifer disconnected from the stream channels. The lower part of the catchment is located in the coastal plain where the Rambla joins the Millars River to find its way to the Mediterranean Sea. This coastal plain consists of alluvial fan deposits (mainly gravels) of Tertiary and Pleistocene age. In the upper catchment, the river channel is embedded in deep and narrow valleys, whereas in the lower part, it develops a wide alluvial channel bed, with a width-to-depth ratio of ~100 times [
34].
The observed average annual rainfall is approximately 550 mm. The precipitation annual pattern consist of (i) autumn rains (September to November) recording the highest daily and monthly rainfall amounts; (ii) frontal systems linked to Atlantic zonal flow during winter (December to January) and spring (March to May), with spring giving the secondary monthly rainfall maximum; and (iii) occasional convective storms in summer, which is mostly dry [
34,
35]. Rambla de la Viuda streamflow patterns are strongly marked by the Mediterranean rainfall regime, high bedrock permeability due to the dominance of karstified limestones, and high channel transmission losses. As a result, streamflow occurs with an average of 31 days per year, often lasting only 2–3 days and associated with accumulated rainfall amounts larger than 70 mm [
34].
Large floods are a significant element of this irregular hydrological regime, producing up to 80% of annual discharge volume [
36]. Heavy rainfalls leading to extraordinary and extreme floods are related to autumn mesoscale convective systems (MCSs) [
37] fed by Mediterranean moisture and enhanced by orographic effect of the Iberian Range Mountains close to the coast. For example, the rainfall event of October, 1962, recorded ca. 300 mm in 24 h that led to severe flash flooding with a peak flow of 1500 m
3 s
−1 at Maria Cristina Dam. This floodwater overflowed the spillway (capacity for 600 m
3 s
−1) and spilled over the dam wall with a depth of 0.7 m. Comparable large floods overflowing the dam took place in 1920 (during dam construction), 1962, 1969, and 2000.
Meteorological records were obtained from different sources. The daily max. and min. temperatures as well as the daily precipitation series were obtained from the Spain02-v5 reanalysis dataset [
38]. A total of 20 grid points (
Figure 2) covering the catchment area with daily records from 1951 to 2015 (66 years). Sub-daily temperature and precipitation records (5-min) for 13 stations were obtained from the Júcar River Basin Authority (CHJ) through the Júcar Automatic Hydrological Information System (SAIH), which started recording sub-daily measurements from 1991.
In terms of hydrological data, these were recorded in four points with available daily and 5-min discharge information directly from the CHJ and from the SAIH, respectively, namely two continuous flow gauges (Vall d’Alba and Montlleó) and two stations at dams (Alcora and Maria Cristina) where discharges were estimated from the balance of the reservoir level and the outflow records (
Figure 2). The length of the daily discharge series ranged between 57 years at Maria Cristina dam and 14 years at Montlleó flow gauge. With regards to the 5-min records, only three high flow events (i.e., 2000, 2015, and 2018) were registered from 1991. In addition, 5-min discharge records at both Vall d’Alba and Montlleó showed strong inconsistencies and therefore they were only used to validate dry/wet conditions on the river channel.
Further information on extremes was obtained from a regional study of maximum daily precipitation [
39] that was used for the additional calibration of the weather generator. In addition, non-systematic flood data were collected from documentary datasets and palaeoflood studies [
27,
40] in two sites, which were integrated for the validation of the GW-hydrological model methodology.
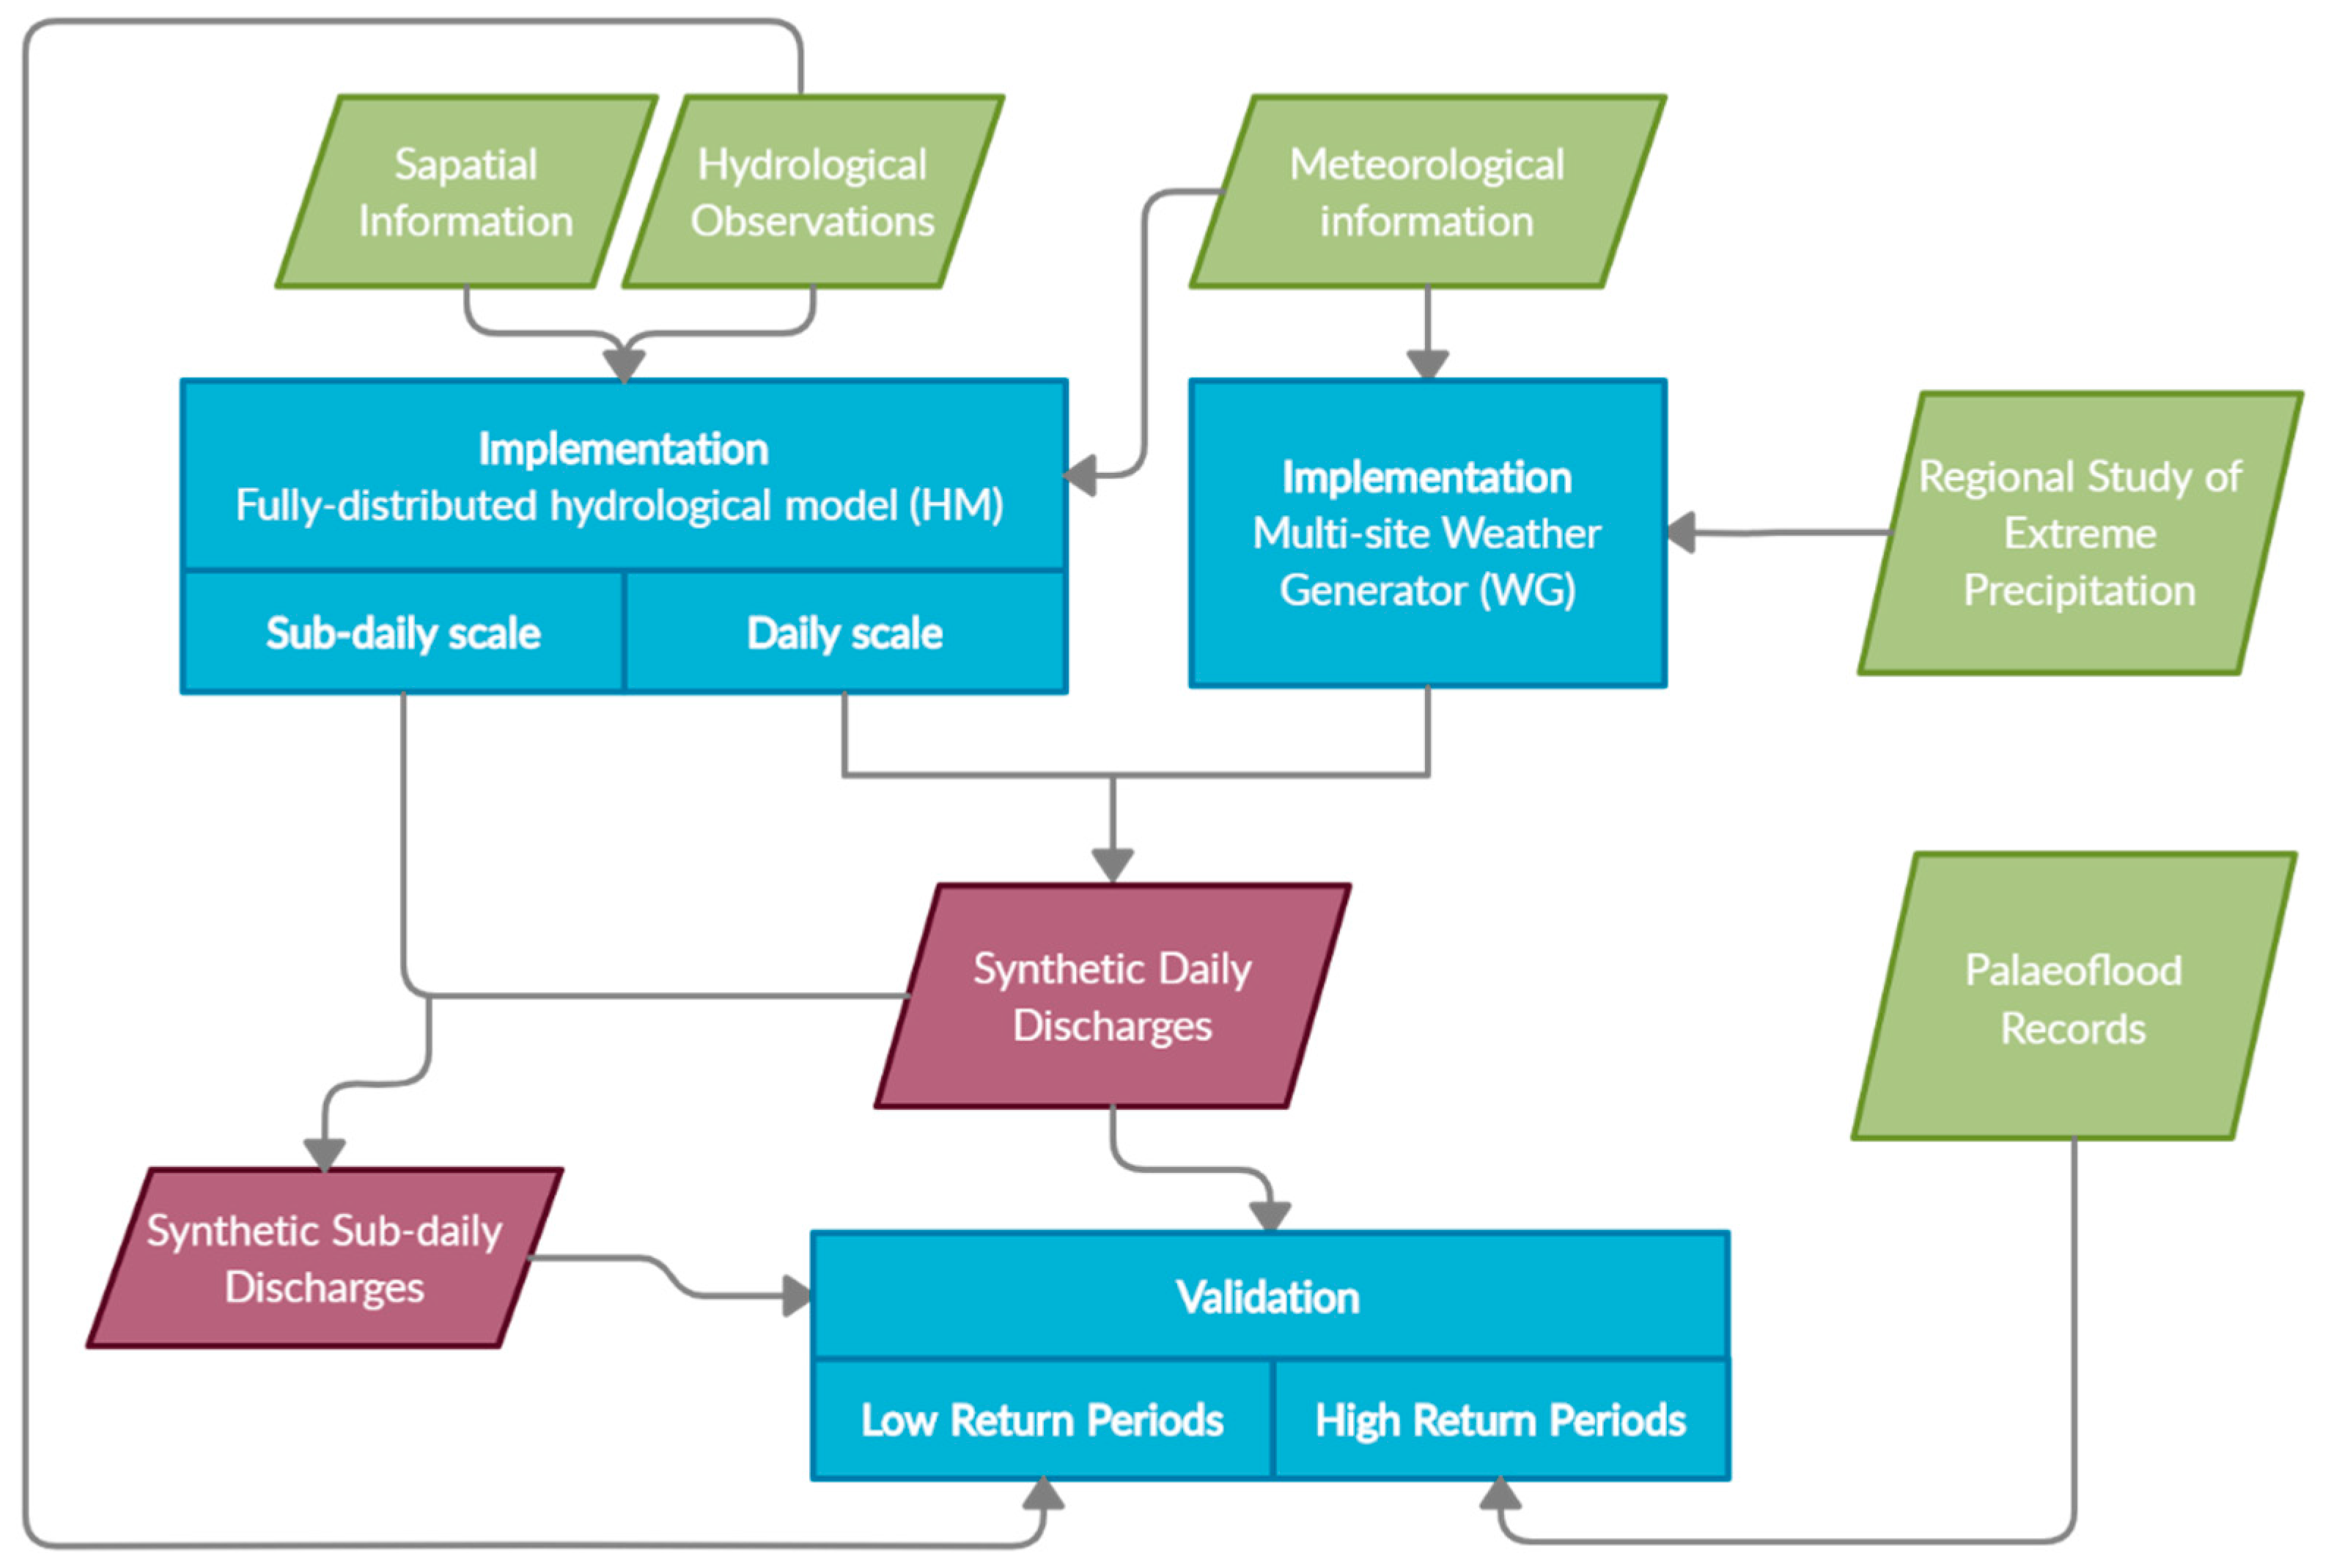
3. Methodology
The methodology consisted of four steps: (1) application of a weather generator for simulating daily precipitation and temperatures with an additional calibration of the parameters related to the extremes using a regional annual maximum rainfall study to deal with the limited length of precipitation records; (2) implementation at a daily and sub-daily scale of a fully-distributed hydrological model that can cope with the spatial variability of rainfall and catchment characteristics; (3) simulation of daily flows of the synthetic rainfall dataset in the fully distributed rainfall-runoff model; (4) comparison of the performance of flood frequency analysis from observed and synthetic flood series; and (5) incorporation of palaeoflood discharge estimates covering the past 500 years to validate synthetic discharges for high return periods in other ungauged locations but with non-systematic information. A workflow diagram of the methodology can be observed in
Figure 3.
In the present study, the eco-hydrological model TETIS [
41] was used. It is conceptual (i.e., tank structure) but with physically based parameters, and fully distributed in the space. It is a parsimonious model thanks to the incorporation of a split effective parameter structure that allows a significant reduction in the number of variables to be calibrated (only nine correction factors) facilitating the model calibration stage using an optimization algorithm [
41]. Several maps were used to feed the model with the catchment geomorphological characteristics, such as slope, flow directions, and flow accumulation, which were obtained from a digital elevation model with a 100-m resolution obtained from National Geographic Institute (IGN). The hydraulic conductivity of the soil was obtained from the European Soil Database (ESDB). Capillary water content capacity of the upper soil was estimated from ESDB and by reclassifying the CORINE land use map. Hydraulic conductivity of saturated rock (used for the percolation capacity) was estimated using the map reclassified to lithological units from the Spanish Geological and Mining Institute (IGME).
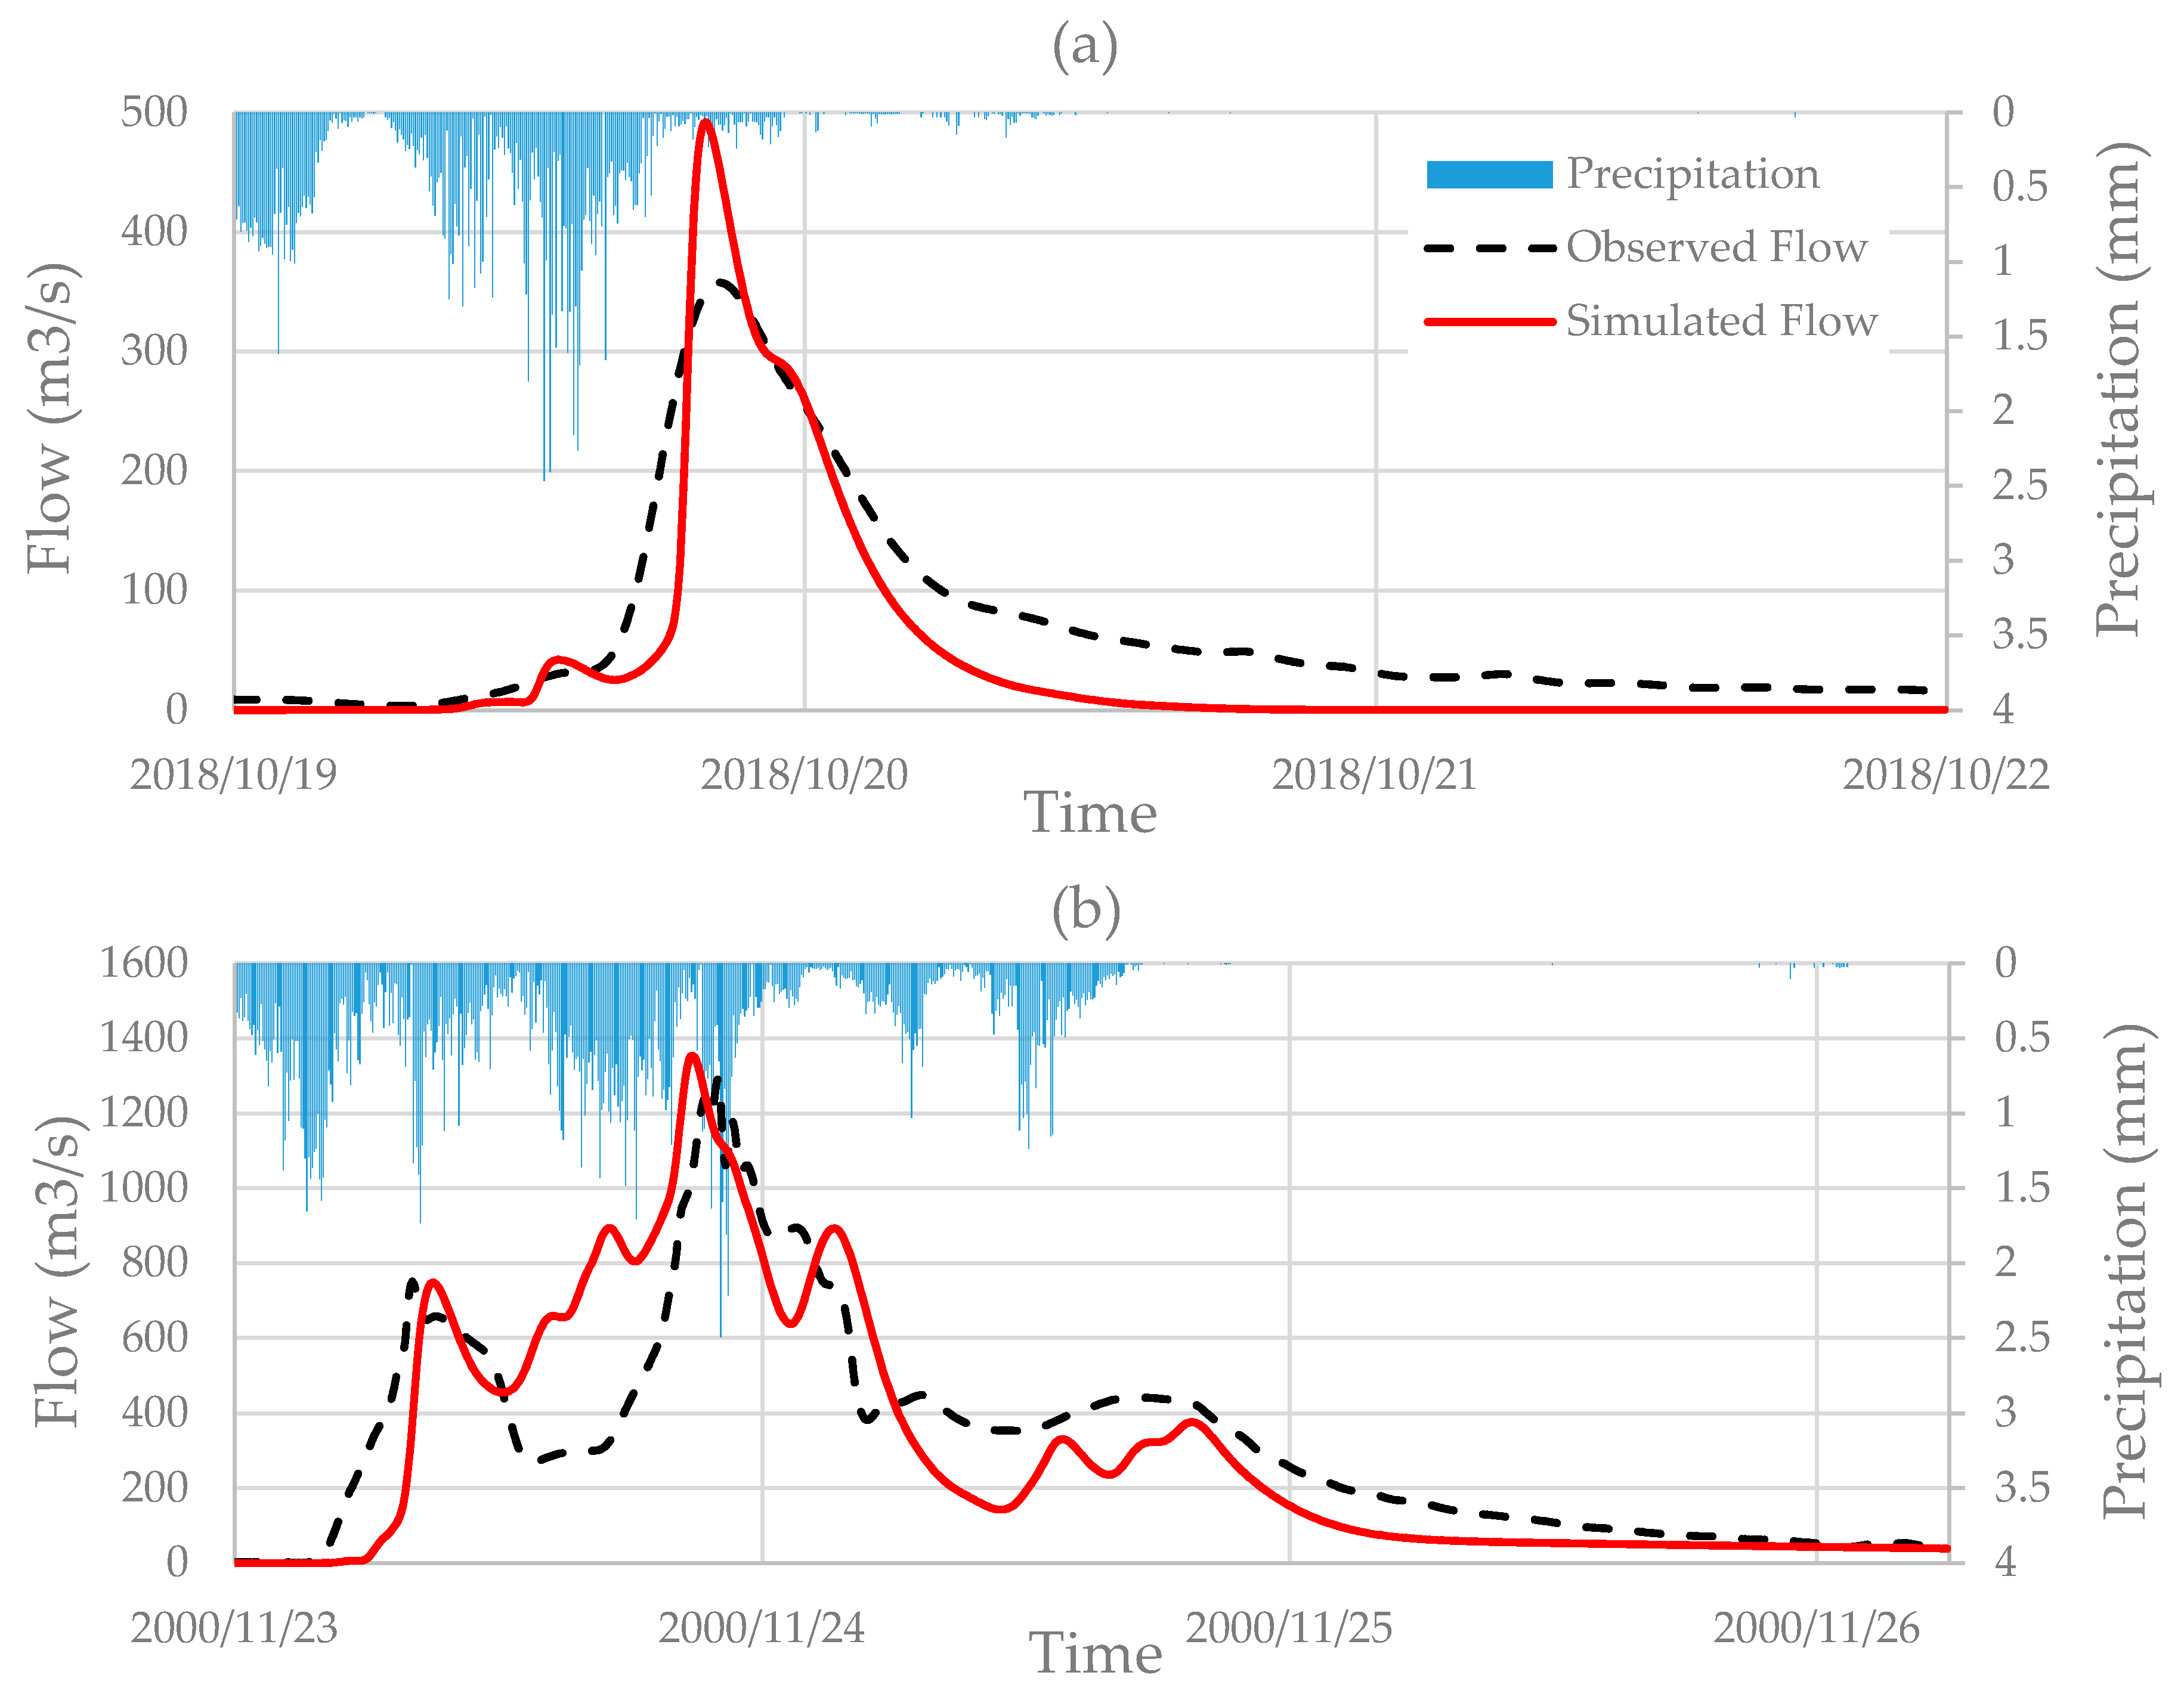
Model implementation was carried out at two temporal resolutions. On the one hand, the model was implemented on a daily scale and this was used to obtain the long data series of discharges. On the other hand, a 5-min temporal resolution model was also implemented. This allowed the relation between peak and daily discharges at any point in our study area to be obtained.
With regards to the WG, after testing different models, GWEX [
22] was selected. This WG was designed to focus on extreme events and incorporates a heavy-tailed distribution function for the precipitation amounts: the E-GPD [
42]. It offers the possibility to introduce a tail dependence between at-site extremes by using a student copula to represent the dependence structure of innovations. Additioinally, and what is more important, it is possible to simulate precipitation in 3-day periods for then being disaggregated to a daily scale by the method of fragments. This latter feature was particularly interesting for our case study given that the extreme events that take place in our study area last between 2 and 3 days on average.
Long synthetic data series of precipitation and temperatures were generated. These, in turn, fed the daily hydrological model obtaining the resulting discharge data series. Finally, the results were validated in two stages: (1) comparison of the flows associated with low quantiles with the observed flows at Maria Cristina Dam; and (2) comparison of the quantiles of the upper part of the distribution function with the non-systematic records previously converted into daily values.
As previously mentioned, non-systematic data were collected from previous studies reporting documentary floods and palaeoflood analysis [
27,
40]. Historical floods were collected from scientific and technical reports; local history books and non-systematic compilations by historians, such as Balbás [
43], Fogués [
44], and Fontana Tarrats [
45]; and from recent compilations by Camarasa Belmonte and Segura Beltrán [
34], Sánchez Adell et al. [
46], and Beltrán Manrique [
47]. The Rambla de la Viuda documentary flood evidence reports a total 19 large floods since CE1378, although continuous and homogeneous data started in 1959. Palaeoflood records were reconstructed on the basis of sedimentary evidence at two sites (
Figure 2), namely in Rambla de la Viuda upstream of the Maria Cristina Reservoir [
40] and in the Monlleó River [
27]. Palaeoflood data result from the analysis of palaeostage indicators consisting of stratigraphic sequences of fine-flood sediments (mainly sand and silt), each representing an individual flood event [
40]. Hydraulic studies were performed to relate the elevation of sediment layers to palaeoflood discharges, and flood age was obtained by geochronological analysis (see Ballesteros-Canovas et al. [
29]). In Rambla de la Viuda, the palaeoflood record contains a total of 17 floods above a threshold of 500 m
3 s
−1 since CE1378, whereas in the Monlleó River, it comprises 10 floods above a threshold of 470 m
3 s
−1 since CE1475.
5. Discussion
5.1. Flood Frequency with Weather Generators and a Regional Precipitation Study
Available discharge and precipitation records are still far from being sufficiently robust for an adequate estimation of extreme events with a high return period. Traditional purely statistical studies using systematic records have been proved to involve high uncertainty, resulting in either over- or underestimations of the simulated flood quantiles [
53] and, in any case, they can only be applied in the location of the flow gauge station.
Later studies focusing on individual synthetic storms have been used for many years for infrastructure design [
54]. Again, great uncertainty surrounded these studies since not necessarily the biggest storm should result in the highest flows, and these would depend upon the spatio-temporal distribution of the storm and the initial conditions of the catchment, which these studies do not rigorously account for.
A continuous synthetic simulation approach using a WG and a fully-distributed HM seems to be becoming one of the potential candidates to deal with this challenge and its use is rapidly increasing over recent years [
55]. The possibility of extending the records beyond the available ones using a WG reduces the uncertainty of the calculated flood quantiles. Yet, the quality of the precipitation input data series (length, spatial density, reliability, and completeness) is critical to obtain reliable results and, therefore, extra tools and additional information must be integrated to complement their current short length and improve the performance of the WG. For example, in our case study, taking into account that the characteristic high precipitation events have an approximate return period of 7/8 years on average and these are of extreme magnitude every 20/30 years, 66 years of observed precipitation was not enough information for the WG to satisfactorily reproduce extreme events.
Traditionally, WGs have used light-tailed distribution functions to model precipitation amounts, such as the exponential, gamma, or combinations of both. However, these types of distribution where the tails exponentially decay result in underestimations in the precipitation of the most extreme events [
20]. GWEX, instead, incorporates a heavy-tailed distribution function for modeling the precipitation amounts. This, along with the 3-day precipitation amounts modeling, improved the performance of the WG, reducing the underestimations of the higher flows, and, as demonstrated in the present study, could be considered as a good option when dealing with arid/semiarid climates where most of the precipitation is concentrated in few days, as in the case of the Spanish Mediterranean coastal catchments [
34,
35].
Evin et al. [
22] suggest that robust studies are needed to adequately estimate certain weather generator parameters, particularly when trying to capture extremes. In our case and following the same approach, we incorporated the information from an available regional study of maximum annual precipitation from CEDEX [
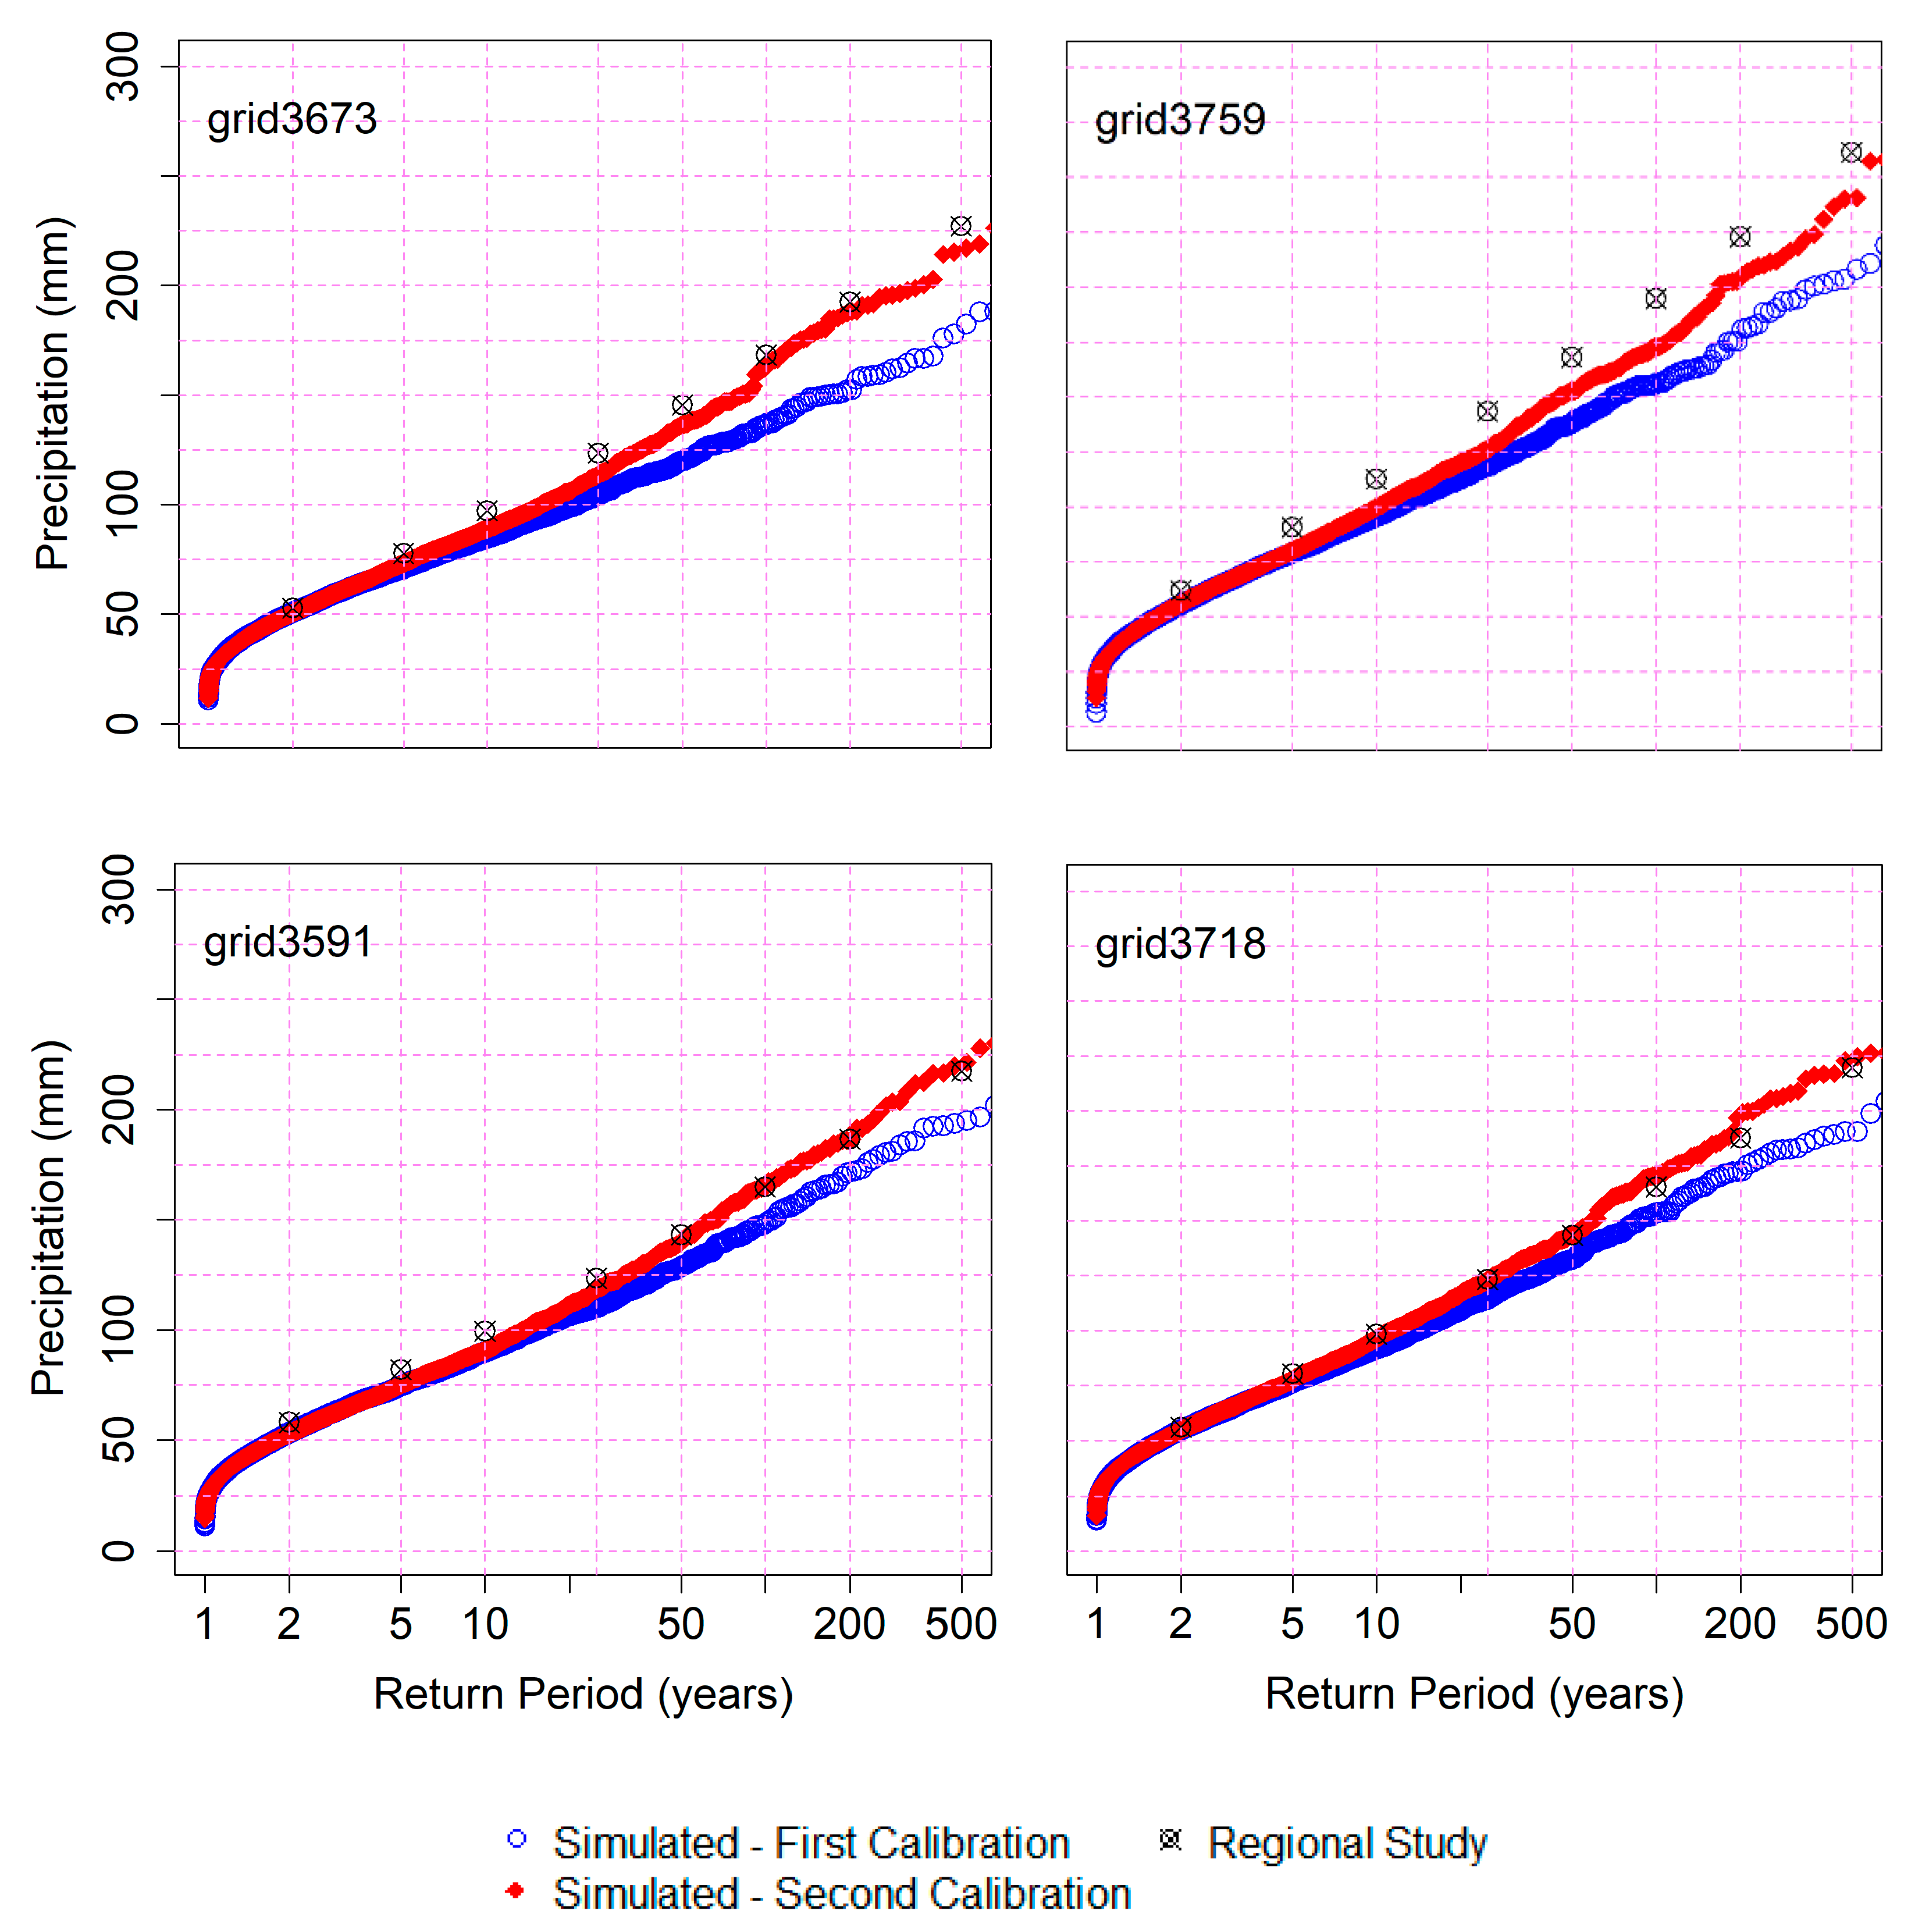
52] for a better calibration of the shape parameter ξ. This regional study substantially improved the performance of the WG, especially for high return periods, where the underestimation was more evident (
Figure 6).
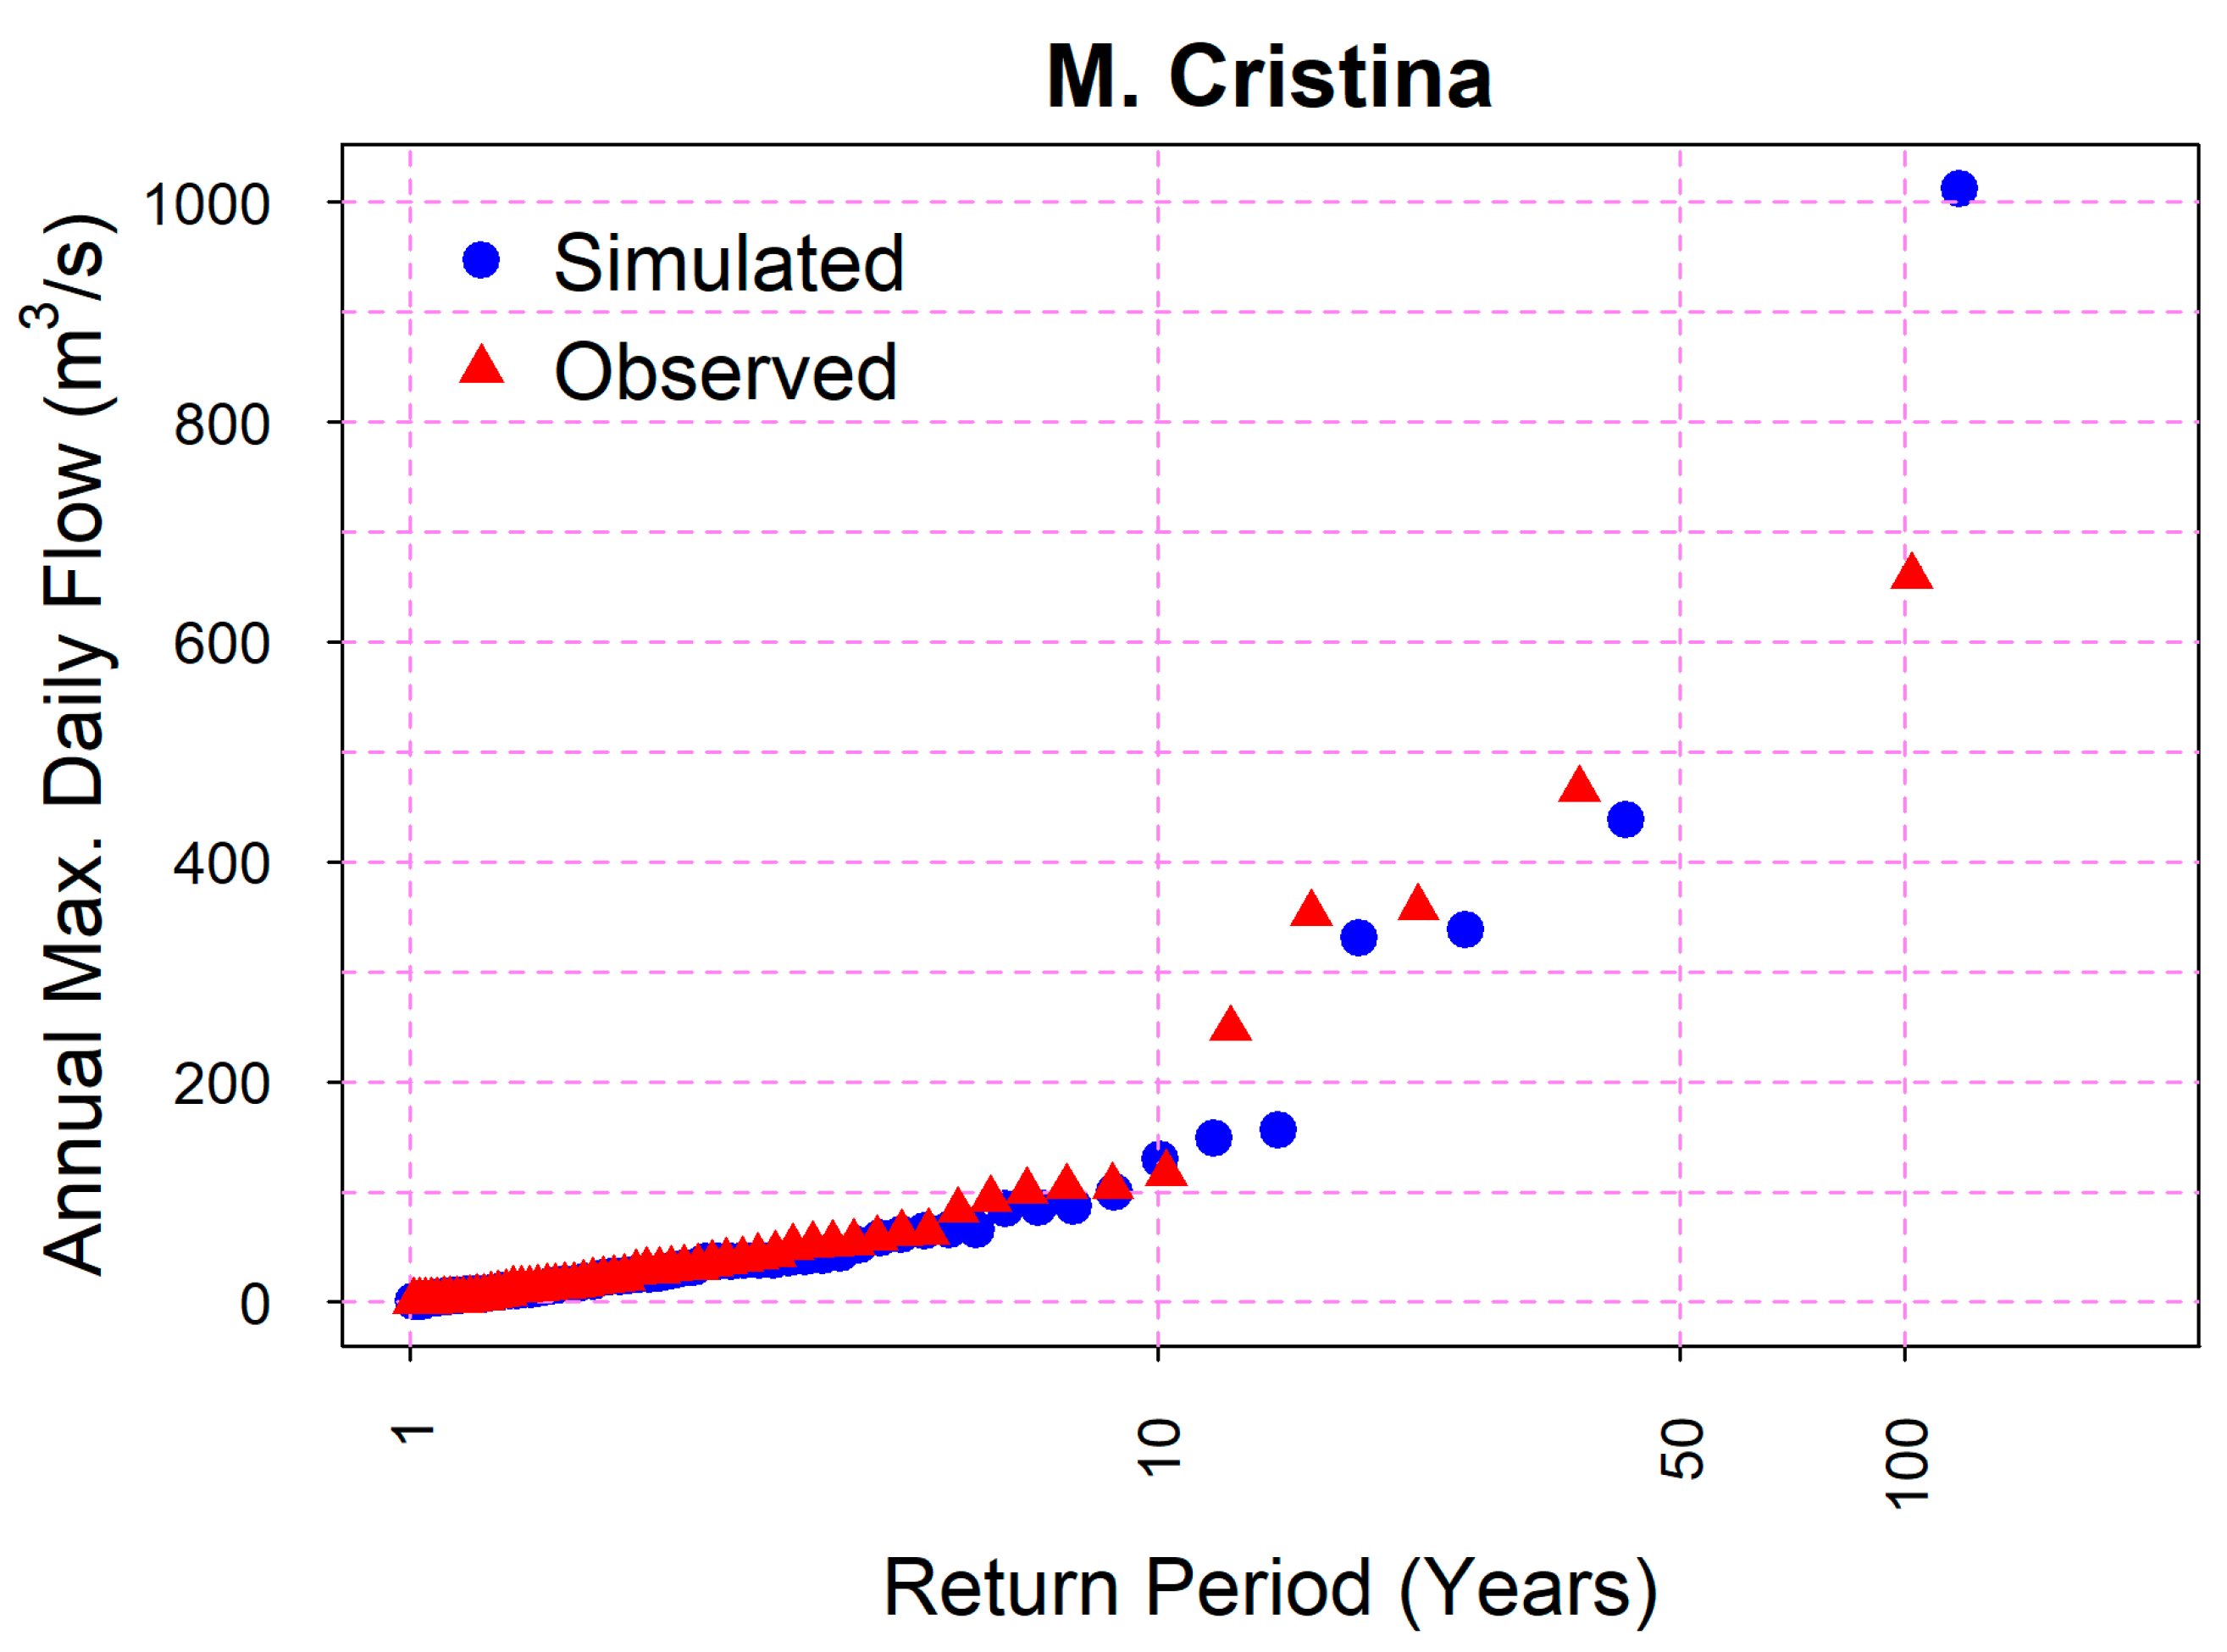
The better reproduction of precipitation data series was also reflected in the results obtained with the HM (
Figure 8). However, it would not have been possible to validate the low-frequency events only with the observed discharge information, since with a systematic flood records’ length of 57 years in the case of Maria Cristina dam, only flood quantiles up approximately T = 50 years would have been possible to obtain with a minimum of confidence. The integration of palaeoflood records was key to validate the upper tail of the distribution function.
5.2. Non-Systematic Information
Palaeoflood information provides data on individual extreme hydrological events. Robust palaeodischarge estimations were obtained from sedimentological evidence of floodwater elevations reached by past floods [
56]. By providing information beyond systematic records, it is generally possible to extend the flood frequency curve over the 50-year return period and, therefore, reduce the uncertainty of the highest quantiles. In the study carried out by Francés [
3] for the Turia river basin, it was concluded that errors in the estimation decreased as the amount of information used to estimate the flood quantile of 1000 years increased, observing that the use of historical information reduced the estimation error by approximately 50% in his case study. Lam et al. [
57] concluded that the uncertainty associated with estimated discharge for the 100-year return period flood was reduced by more than 50% when including palaeoflood information.
In the present study, the analysis of the reduction of the uncertainty associated with the flood quantile estimates was not in the scope. Nevertheless, the reliability of the calculated flood quantiles decreases as the return period increases [
6]. In our case, only with the observed precipitation (66 years), despite being able to calculate the plotting position up to approximately T = 50 years, the uncertainly surrounding return periods higher than 10 years was too high to deem them valid.
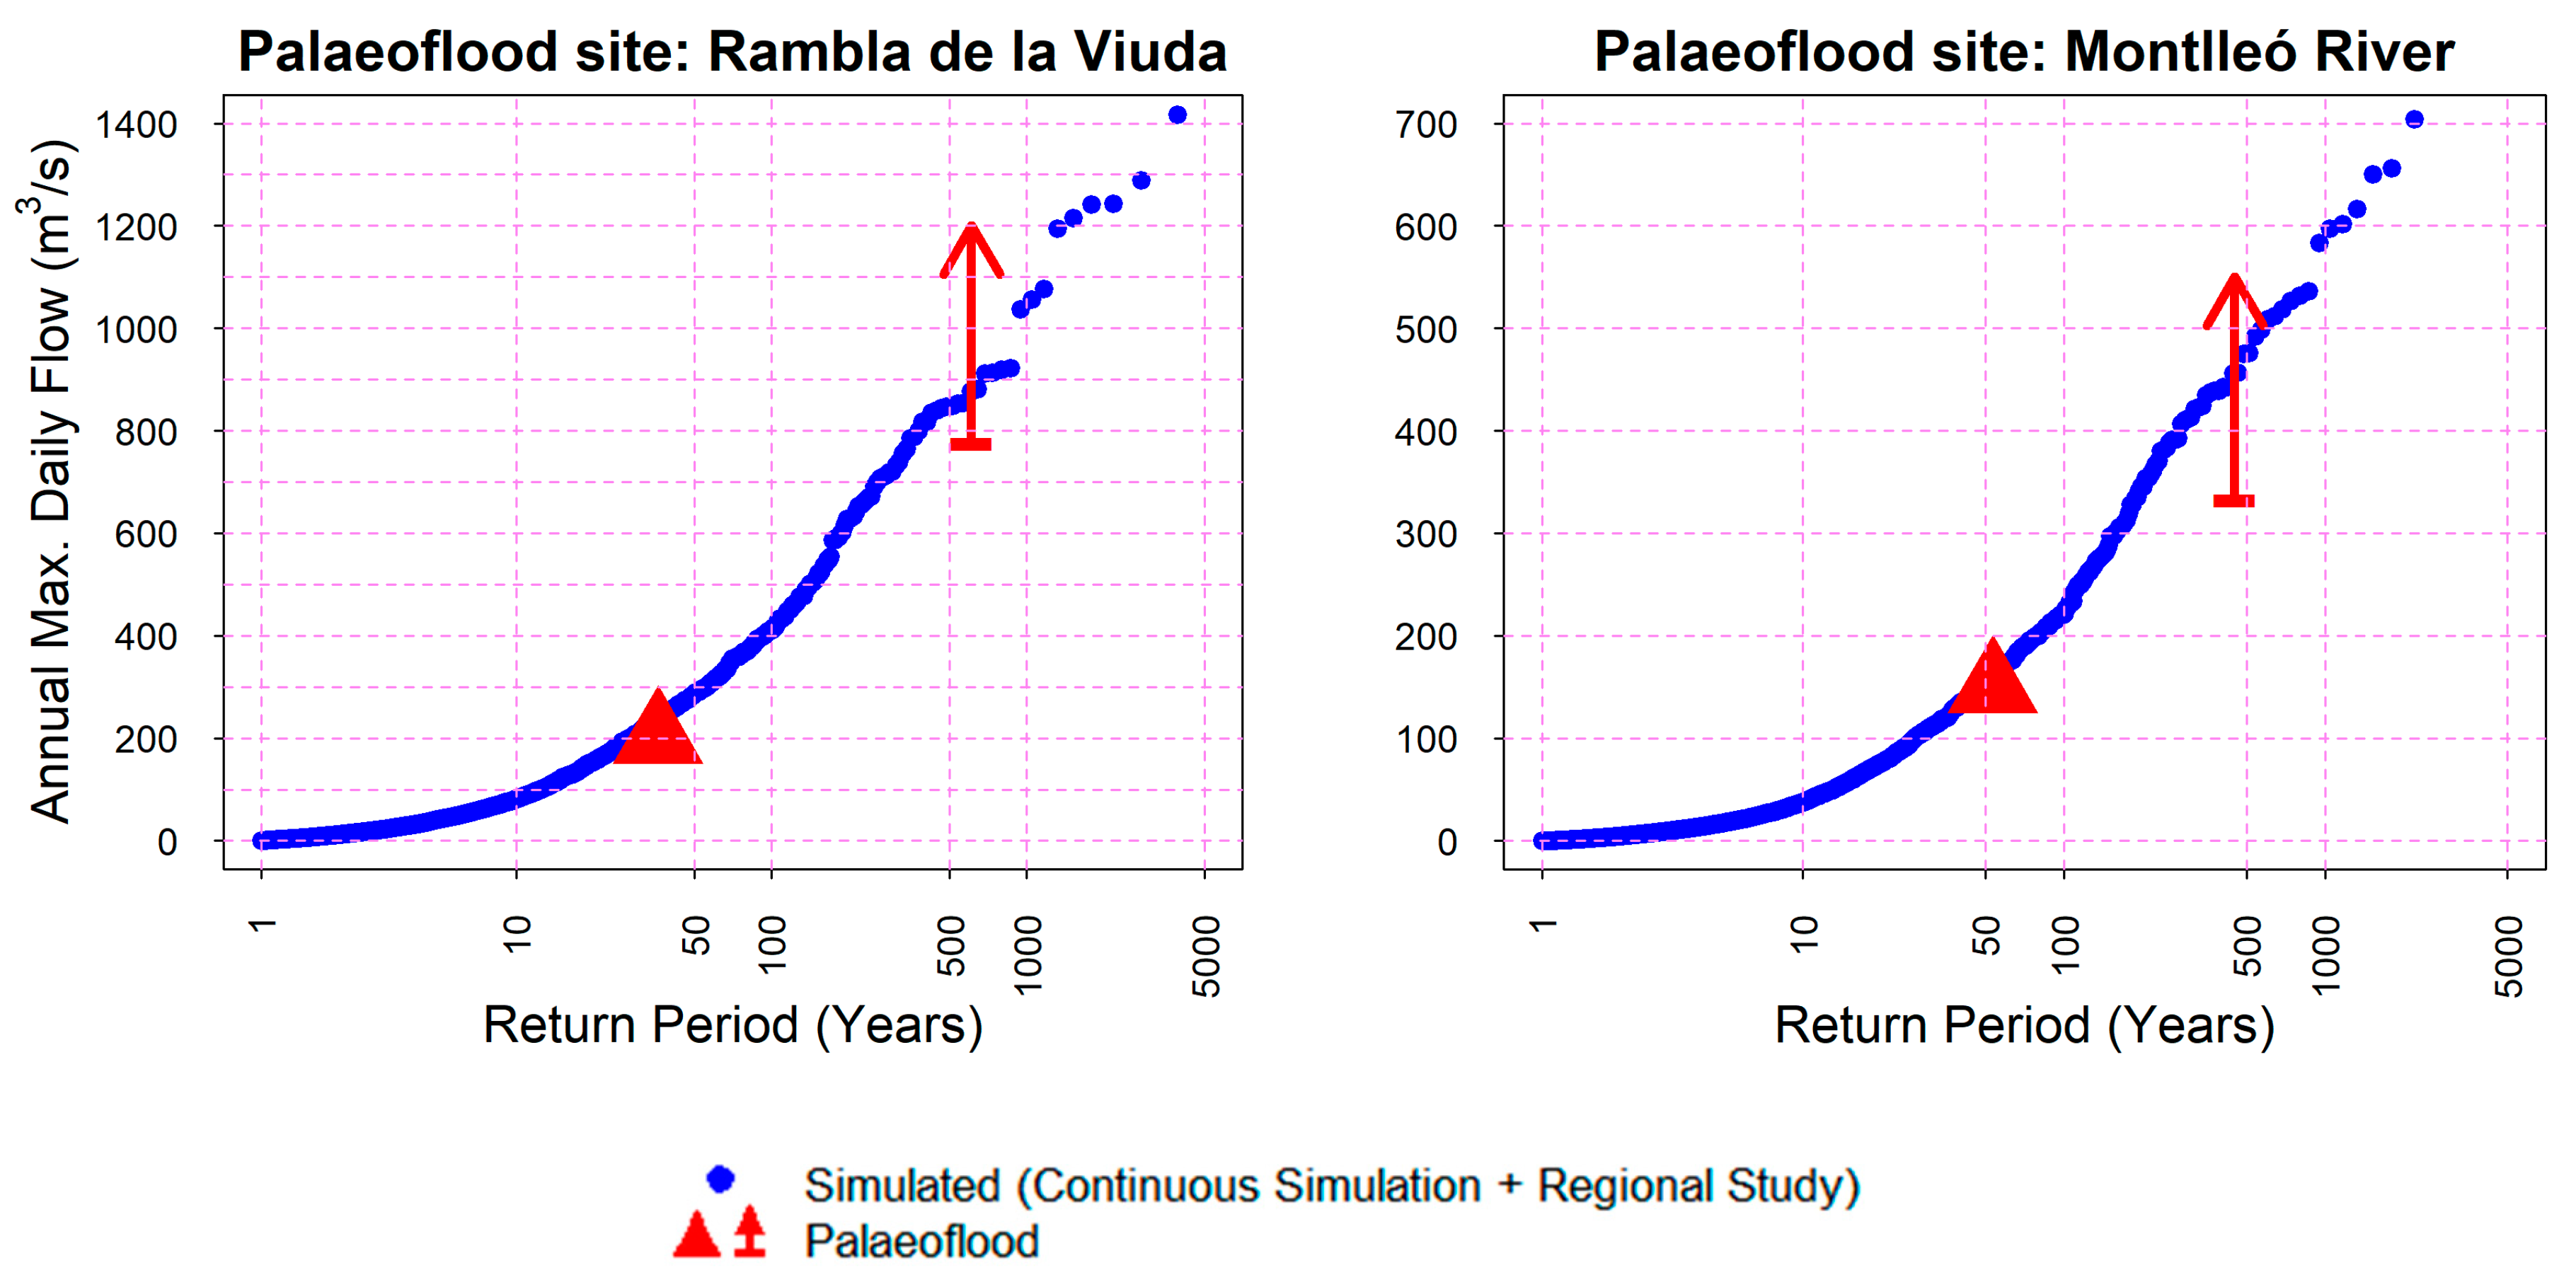
However, the palaeoflood records from the studies of [
27,
40] provided extra information at the upper tail of the probability function. Specifically, the plotting position of the common censoring threshold (represented by a triangle in
Figure 8), which was calculated with the number of high flow events exceeding a threshold of 470 and 500 m
3 s
−1, allowed more robust estimates of the flood quantiles of T = 36 years and T = 53 years, respectively, to be obtained. Furthermore, it was also possible to obtain the plotting position of the lower bound of the maximum flood (represented by an arrow in
Figure 8), with associated return periods of approximately T = 500 years at both sites.
On the other hand, palaeoflood information is usually related to the peak of the flood. Therefore, daily data series of generated flows must be converted into instantaneous flows or vice versa in order to be able to compare the results. Traditionally, this transformation has been based on empirical methods as in Fuller [
58] or in deterministic methods [
59,
60]. Fathzadeh et al. [
61] compared four different approaches, concluding that, although some of the tested methods (i.e., adaptive neuro-fuzzy inference systems and artificial neural networks) could obtain better results, it is necessary to have a robust subset of data to train more sophisticated models. In other words, the existence of robust datasets is more important than the method used.
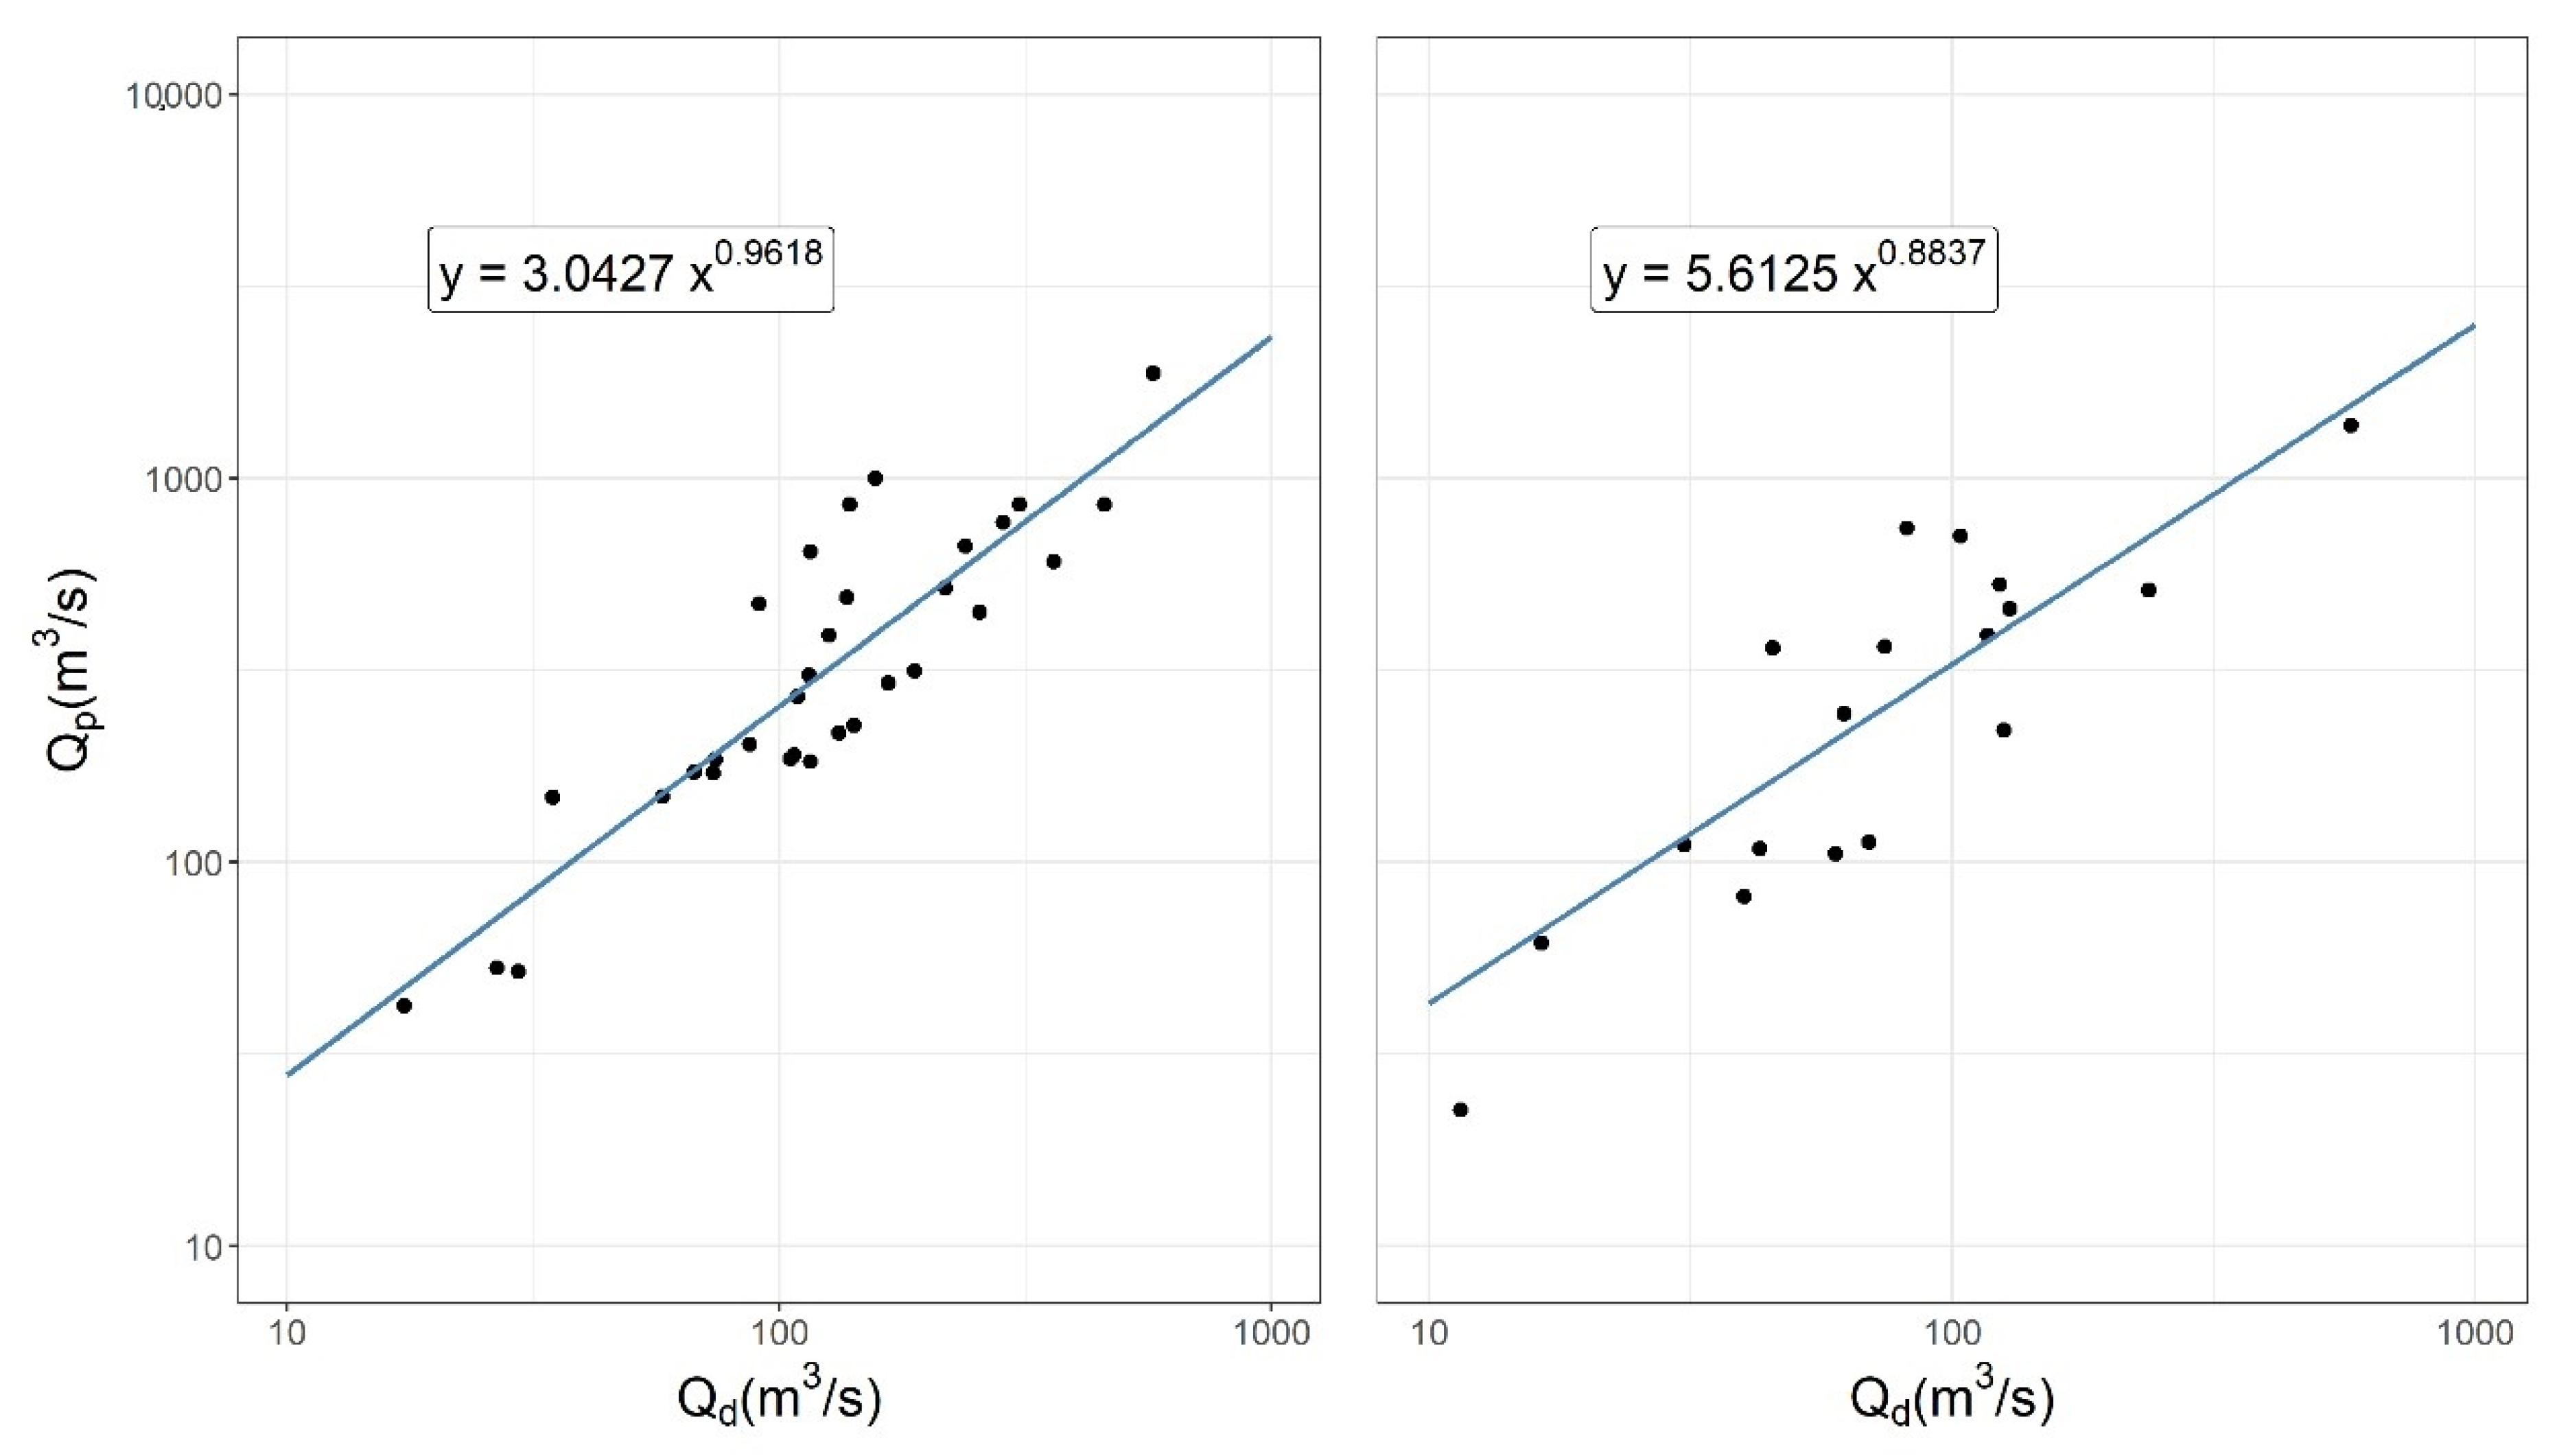
Since these were not available in our study area, it was decided to implement the HM in a sub-daily temporal resolution (5-min). Simulating different synthetic rain events, it was possible to obtain for each the relation between daily and peak discharges at both locations where palaeoflood information was available. All these values were fitted to a potential function, obtaining satisfactory Pearson’s correlation coefficients (i.e., 0.8174 and 0.8207) (
Figure 7).
5.3. A Holistic Methodological Approach to Estimate Extreme Floods
The methodology presented in this case study is an extension of the continuous synthetic simulation model. Apart from the benefits of this approach discussed before (i.e., initial conditions of the catchment and spatio-temporal distribution of the storm), we propose the integration of additional information to deal with the estimation bias on the flood quantile resulting from the short length of the existing hydrometeorological data series. This methodology can be implemented in any region regardless of its size or its climate; however, the more remarked climate variability, the greater the need to add extra sources of information due to their erratic hydrology.
In our case, an existing regional study of extreme precipitation was used to improve the calibration of the WG and palaeoflood records were included to validate the discharge series. However, this is not the only option; it is possible to apply the present methodology only having one source of information. In the case of having only the regional study of extreme precipitation, the WG can be calibrated with this; however, the resulting discharges cannot be validated. Conversely, in the case of only having palaeoflood records, although not being so straight forward, the WG can be calibrated by comparing the resulting discharge series with the palaeoflood records.
Additionally, due to their ephemeral or temporary nature, most of the streams that lead to catastrophic floods over the months of SON in the Mediterranean coast are either ungauged or only equipped with sensors capable of detecting flow for flood warning purposes. The selection of a deterministic (fully distributed and physically based) HM here was of upmost importance to capture local infiltration losses and gains. TETIS, being a fully distributed HM where the parameters are physically based, preserves the spatiotemporal distribution of the storm and allows the discharge information at any point of the catchment to be known unlike in the case of lumped or semi-distributed HMs. Thus, fully distributed models allow improvement of the understanding of flood extreme regimes in parts of the catchment where discharge records are not available, leading to better estimations of extreme floods, which, in turn, could result in improvements on the flood design of sensible infrastructures or early flood warning protocols. Furthermore, integrating them is an indispensable condition if palaeoflood information is to be incorporated, since this is limited to certain parts of the river where these records can be obtained and usually not in the same location where the flow gauge stations are located.
It is a fact, however, that many of the extreme precipitation events could have a duration lower than a day (i.e., flash floods) and some can argue that lower temporal scales are needed in order to account for these phenomena. However, simulating long series of precipitation and discharges at sub-daily temporal resolution is, to date, not operational for medium and large catchments due to the lack of appropriate WGs and the need in any case of supercomputers, which are not to everyone’s reach. Nevertheless, the case study presented in this paper showed that a daily temporal resolution could produce satisfactory results, especially in those areas where extreme event duration is typically longer than one day as in the Spanish Mediterranean coast.
6. Conclusions
The reliability of flood estimates depends upon long and trustworthy input data series (i.e., precipitation and/or discharges). Most ephemeral rivers worldwide lack long-term and spatially fully distributed hydrometeorological information, which leads to inaccurate estimations of flood quantiles, especially those associated with high return periods. Continuous synthetic simulation models have been gaining ground over recent years to the detriment of statistical or deterministic approaches. The use of continuous stochastic meteorological models coupled with a fully distributed hydrological simulation provided a realistic approach, enabling the recreation of multiple and different situations at any point within the catchment, thus completing the frequency distributions of discharges along with the whole river network. Yet, though, long and reliable input data series of precipitation and discharges are necessary for the correct implementation of the WG and the HM, which in practice are rarely available.
The methodology presented in this paper was applied in a typical Mediterranean ephemeral river and combined a long synthetic meteorological data series within a continuous synthetic simulation approach, with the additional inclusion of a regional study of extreme precipitation and palaeoflood data, with the objective of improving the flood quantile estimations, especially those associated with low probabilities.
Our results show that the integration of more robust precipitation studies for the WG implementation clearly improved its performance. In our case, the integration of an existing regional study of annual maximum precipitation allowed reproduction of the precipitation quantiles with high return periods, where the bias was more significant.
This improvement was transferred to the simulation of discharge data series with the fully distributed HM. Here, the available palaeoflood records gave extra flood information up to T = 500 years as opposed to the highest quantile of T = 50 years obtained only with the systematic information. By having this extra information at the upper tail of the distribution, it was possible to validate the simulated extreme discharges and, at the same time, the proposed methodology.
Moreover, these estimates are not limited to the sites where flow gauge stations are located or where the palaeoflood information is available. The fully distributed HM provides reliable data on extreme flood discharges at any point of the catchment, thus leading to better knowledge of its hydrology compared with the traditional methodologies based on at site flood frequency analysis of recorded discharges or the HM modeling of a design storm.
Finally, the importance of incorporating two different sources of additional information in the methodology when trying to estimate extreme flooding was demonstrated. Whilst adding one source of additional information is essential for a better calibration of the WG, adding a second one allows for validation of the simulated discharges, thus improving the robustness of the methodology and providing higher confidence in the flood quantile estimates. These findings have important implications towards a more efficient and balanced flood risk management in general, but especially in poorly monitored catchments with high variability in their flood regime.


