Abstract
The migration of hazardous substances in a bentonite barrier layer is a key issue for the safety of nuclear waste storage. This study develops a thermo-hydro-mechanical coupling model to simulate the contaminant migration in a bentonite barrier layer of the nuclear waste storage chamber. In particular, the Richard’s equation is used to describe the groundwater flow in the bentonite barrier layer with variable saturation. Thermal diffusion and concentration diffusion are coupled with the layer deformation and fluid flow. The migration rate and diffusion range of hazardous substances in the bentonite barrier layer are numerically simulated. These numerical simulations show that the heat release from nuclear waste can induce a temperature gradient and deformation, and thus significantly affects both transfer rate and concentration distribution of dilute substances. These multi-physical couplings under different initial saturation may significantly modify the sealing efficiency of an unsaturated bentonite barrier layer and thus this model is of great significance in the safety evaluation of a nuclear waste disposal repository.
1. Introduction
The contaminant migration in a landfilling barrier is a key issue for the safety of nuclear waste storage [1,2,3]. The deposition and condensation of contaminants were found in the cap of a sealed disposal facility [4]. The landfilling barrier is usually a bentonite backfilling layer for the leakage prevention of radioactive contaminants. This leakage prevention or sealing capacity of a barrier layer evolves under the combination actions of seepage, temperature and loading. The path and speed of contaminant transport may be significantly modified in the nuclear waste storage process [5,6]. The mechanism of contaminant migration in the barrier layer is complicated, including convection, diffusion and adsorption and their interactions [7], and should be investigated with multi-physical couplings.
Many models have been developed for this contaminant migration problem. For example, Zhang et al. [8] derived an equation for the longitudinal convection and diffusion of contaminants in compressible unsaturated porous media. They investigated the coupling of contaminant transport and porous medium deformation based on the one-dimensional Biot’s consolidation equation. Pu et al. [9] used piecewise functions to describe the contaminant transport in fully saturated soils. Wu et al. [10] established dynamic saturation and water conductivity models and studied the effects of dynamic water conductivity and dynamic saturation on the solute transport in unsaturated soils. In the long-term storage process, the nuclear waste releases heat and produces a temperature gradient in the barrier layer. This may induce the deformation and solute conduction in the barrier layer and significantly modify the transport properties of the barrier layer. However, the mechanism of modification on the sealing capacity of a barrier layer is still unclear so far.
The contaminant migration in an unsaturated porous medium includes the couplings of thermal, hydraulic and deformation processes. Chen et al. [11] derived a fully coupling thermo-hydro-mechanical (THM) model based on the multiphase flow in porous media. Rutqvist et al. [12,13] studied the coupling effects of temperature, hydraulic and deformation processes on the permeability and fluid flow in a sparse fractured rock mass. Zheng et al. [14] developed a thermo-hydro-mechanical-geochemical coupling model for a lengthy process. The effect of chemical reaction on the porosity and permeability of rock mass was introduced into the THM coupling model and the long-term performance of the repository safety was evaluated. Dual porosity medium models were also proposed to describe the permeability evolution of rock mass [15,16]. Jia et al. [17] investigated the role of the THM process in sparse rock fractures by developing two different constitutive models: viscoelastic model of geological formation and Von Mises model of steel lining. Their models described the mechanical properties and deformation behavior of the corroded steel lining. Their non-linear viscoelastic damage model is actually based on a modified Mohr–Coulomb criterion and considers the effects of strain, confining pressure, and pore water saturation during damage [18]. This model can describe the self-healing phenomenon of clay in the creep and seepage process. However, the above studies are all based on the assumption of fully saturated porous media. The surface natural soil or rock is usually unsaturated [19,20,21]. The degree of saturation may significantly impact the contaminant migration in the sedimentary rock repository during the nuclear waste storage. In the unsaturated porous medium, water, gas and solid particles may follow different laws of evolution. A thermo-hydraulic-chemical coupling model is necessary to describe the contaminant transport in unsaturated porous media [22,23,24,25,26]. This model can evaluate the long-term migration process of nuclear waste contaminants in the backfilling layer and even in the surrounding rock mass.
This paper proposes a thermo-hydro-mechanical coupling model for the contaminant migration in an unsaturated bentonite barrier layer. This is a multi-physical coupling model which includes the thermal diffusion, convection and other effects of temperature such as thermal deformation on pollutant diffusion. Furthermore, the concentration gradient, water flow and initial water saturation in the porous medium are also included in the mechanism for contaminant transport. In nuclear waste storage, minor solute transport at a molecular level is still not negligible. This model also considers the Soret effect as a thermal diffusion phenomenon at a molecular level, where Fick’s law is used to introduce the solute transport at the pore scale or the Soret effect. The long-term performance of the barrier layer is evaluated after model validation and key parameters are explored to identify their impacts on the permeability, porosity and pore water pressure in the bentonite barrier layer. Finally, the suitability and accuracy of this thermo-hydro-mechanical coupling model are investigated for an actual transport of contaminants.
2. A Thermo-Hydro-Mechanical Coupling Model
2.1. Multi-Physical Process Analysis and Basic Assumptions
This thermo-hydro-mechanical coupling model describes the interaction of multi-physical processes in the bentonite barrier layer for nuclear waste disposal. The bentonite barrier layer is usually an unsaturated porous medium, where water moisture transports under gravity, pressure gradient and thermal gradient. This transport of water moisture modifies the saturation degree and permeability, and in turn affects the permeation rate. On the other hand, the change of saturation degree and permeation rate modifies the moisture transport and heat transfer processes. Pressure gradient and non-homogeneous temperature gradient may induce the barrier deformation and thus modify the porosity and intrinsic permeability. For pore water, the change of temperature affects the viscosity coefficient and thermal diffusion coefficient of water. The change of hydraulic conductivity affects the thermal conductivity and the solute transport rate. Thus, the physical process in the barrier layer includes heat transfer, water flow, and solute transport. The interactions among the three physical processes are presented in Figure 1, where the denotes the dynamic viscosity of fluid, is the volumetric flow rate of water, is the thermal conductivity of fluid, is the permeability of porous medium, is the porosity of porous of medium, is the thermal diffusion coefficient, and is the saturation degree of water in the porous medium.
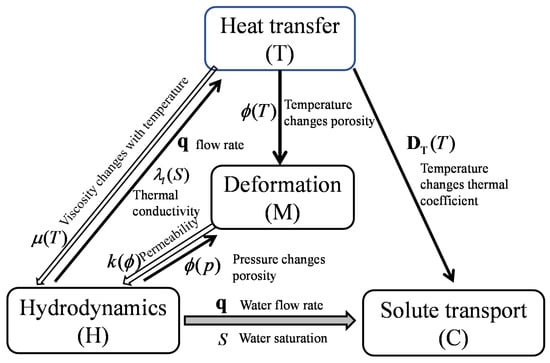
Figure 1.
Coupling in heat-flow deformation solute transport model.
The following assumptions are made in this study:
- The bentonite barrier experiences infinitesimal strain and small deformation when exposure to the radioactive waste.
- The barrier is a mixture of clay particles and water. The backfilling bentonite and water can be treated as two non-overlapping continuums.
- Soil pores contain only aqueous water and air.
- The bentonite barrier is connected to atmosphere, thus the gas pressure is the atmospheric pressure and the gas phase has no flow in porous medium.
2.2. Governing Equation for Water Flow in the Barrier
The mass conservation law in an unsaturated porous medium can be expressed as:
The first term is the mass change rate in the barrier:
where is the water density (kg∙m−3) and is the source sink term(kgw∙m−3∙s−1).
The differential of water density is:
The volumetric flow rate is described by the extended Darcy’s law as:
where is the water pressure to be approximated by the capillary pressure () since the gas pressure is kept at the atmospheric pressure. is the intrinsic permeability, is the relative permeability related to the saturation of water in the barrier, and is the gravity. The hydraulic conductivity is related to the permeability with .
The dynamic viscosity of water changes with temperature as:
The evolution of intrinsic permeability usually follows a cubic law as [27]:
where is the initial permeability at the initial porosity of .
The compression coefficient of water and the thermal expansion coefficient of water are defined as:
Therefore, the equation for water flow in unsaturated porous medium is obtained from Equations (2), (4), and (7) as:
2.3. Water Retention Curve and Relative Permeability
The saturation process of backfilling bentonite is approximately described by a simplified van Genuchten model [28,29]. Its capillary pressure is:
where and m are two parameters and the effective saturation is:
This study uses the following Van Genuchten’s relationship:
where and are constants. is the pressure head and is . is the residual saturation in porous medium. In this study, the residual saturation is taken as 0. The compressibility is 1/Pa for water and 1/Pa for clay particles.
The relative permeability is represented by the water retention curve as:
2.4. Energy Conservation Law for Heat Transfer
The heat transfer in porous medium follows the energy conservation law as:
where and are the specific heat capacity of porous medium and water, respectively.
The specific heat capacity of porous medium is expressed as:
where is the density of clay particles. is the specific heat capacity of clay particles.
Similarly, the thermal conductivity of a porous medium has two components as:
where and are the thermal conductivity of clay particles and water, respectively.
Therefore, the equation for heat transfer in the unsaturated bentonite barrier layer is:
The specific heat capacity and thermal conductivity of water vary with temperature as:
2.5. Solute Transport in the Unsaturated Bentonite Barrier Layer
The solute transport in the unsaturated bentonite barrier layer can be described by:
where c is the solute concentration, is the source term, is the water content of porous medium and . is the effective diffusion coefficient tensor of the solution in porous medium. Its diffusion coefficient component for water can be expressed as:
where is a tortuosity factor to describe the resistance of molecular diffusion from porous medium relative to free water. is the molecular diffusion coefficient. The Millington quirk model gave the effective diffusion coefficient of liquid as .
A temperature gradient in the barrier layer drives the solute diffusion. This phenomenon is called the thermal diffusion or Soret effect. This effect is a molecular-level diffusion induced by a temperature difference in the porous medium. The concentration difference also induces diffusion. Usually, the effect of temperature on solute diffusion can be ignored if the temperature changes a little. However, this study does not ignore the effect of temperature on diffusion.
The thermal diffusion can be expressed as:
where the thermal diffusion coefficient tensor is expressed as:
where is the Soret coefficient related to the concentration of solute.
The governing equation of solute transport after including the thermal diffusion effect is:
On the right-hand side of this equation, the first term represents the pollutant concentration with the convection and conduction of fluid, the second term is the diffusion caused by concentration gradient, and the third term is the Mole–Coulomb diffusion caused by temperature gradient.
2.6. Mechanical Deformation of Bentonite Barrier Layer
The momentum conservation equation of porous medium is:
The principle of effective stress gives:
where is the stress tensor (tensile stress is positive), is the effective stress tensor and is the Kronecker delta tensor. is the Biot’s coefficient.
If the effect of thermal expansion is under the non-isothermal condition in porous medium, the stress-strain relationship for the elastic porous medium is:
where is the fourth-order tangential elastic modulus tensor, is the strain tensor, K is the bulk modulus, is the coefficient of thermal expansion of clay particles.
The geometrical relationship between strain and displacement is:
The final form for the conservation of momentum is:
2.7. Mass Conservation Equation of Clay Particles
The solid phase or clay particles should also satisfy the mass conservation law as:
The above equation can be further expressed as:
where is the absolute velocity of soil particles.
Since radioactive waste is inherently exothermic, the temperature in the barrier layer is non-isothermal. Under non-isothermal conditions, the ratio of bentonite density to its initial one can be expressed by temperature, mean pore pressure, and volumetric strain as:
Differentiating both sides of Equation (31) with respect to time yields:
On the other hand, the effective stress is the total stress minus pore pressure but plus temperature stress. Therefore, the last term in the above equation can be expressed as:
Combining Equations (30)–(32), we can obtain:
where is the volumetric strain, is the bulk modulus, and is the coefficient of thermal expansion of soil, is the mean pore pressure and is:
Substituting Equation (33) into Equation (29) and neglecting the smaller terms yield the derivative of porosity with respect to time as:
and the porosity is obtained as [30]:
3. Validation of Proposed Thermo-Hydro-Mechanical Coupling Model
3.1. Example 1—Coupling of Temperature and Concentration Diffusions in Experiments
The coupling of temperature and concentration diffusions is validated by the experimental data in Roanne’s article [31]. His experimental specimen was a clay cylinder of 15 mm in diameter and 2 mm in length. Concentration and temperature were independently applied at both ends of the specimen. The solute in the clay was a sodium chloride solution. The temperature and the concentration in the specimen were measured in terms of duration. This study builds a one-dimensional numerical model with the same dimensions as the experimental specimen. Experimental parameters and boundary conditions are given according to Roanne’s article. Two cases are used for comparison: The first case is that the temperature difference and the concentration difference are in opposite directions. The second case is that the temperature difference and the concentration difference are in the same direction.
Numerical simulation results are compared with those of Roanne’s experimental data. Figure 2 shows the concentration of the transverse section at two different times. Figure 2a is the comparison when the concentration difference and temperature difference are in the same direction. Figure 2b is the results when the concentration difference and temperature difference are in the opposite direction. This is the distribution of concentration diffusion along the penetration direction at times of 0.88 h and 1.31 h. The numerical solutions are generally in good agreement with the experimental results. The diffusion speed is faster for a higher temperature difference. The temperature has an obvious influence on the concentration diffusion. Therefore, the model can describe the coupling of temperature and concentration diffusions.
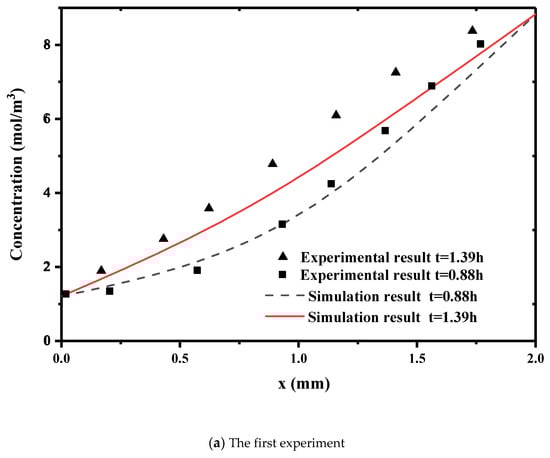
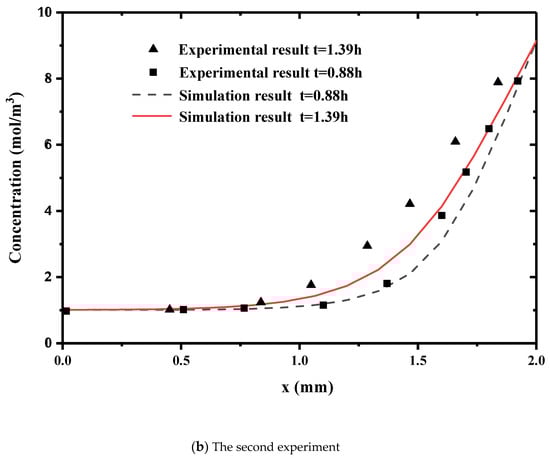
Figure 2.
Comparison of our numerical simulations with experimental data. ((a) the Concentration distribution in the same direction as temperature difference. (b) Concentration distribution in the opposite direction of the difference in concentration and temperature).
3.2. Example 2—Coupling of Water Flow and Deformation in Biot’s 1D Consolidation Problem
Biot’s consolidation problem is a typical hydro-mechanical coupling problem. Figure 3 presents a soil column fully saturated with water. This is a 1D Biot’s consolidation problem. The top boundary is applied by a constant load but is free drainage. Both sides are fixed in horizontal displacement and free in vertical displacement. They have no flux for water flow. The model parameters and analytical solutions were given in many references such as [32,33]. This column is 15 m in height.
Figure 3.
One-dimensional consolidation problem in clay.
Our numerical solution and the analytical solution at different times are compared in Figure 4. Figure 4a is the displacement along the vertical direction. Figure 4b is the profile of pore pressure. These figures show that our numerical solution is in good agreement with analytical solution. This model can describe the coupling between seepage and deformation of clay.
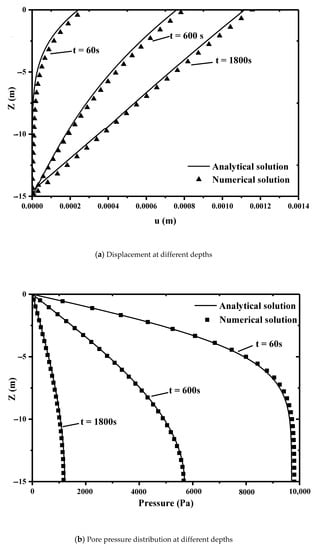
Figure 4.
Comparison of our simulations with analytical solutions. ((a) the relationship between depth and displacement. (b) the relationship between depth and pressure).
4. Numerical Model for Heat and Mass Transfer in Barrier Layer
4.1. Computational Model for the Contaminant Migration in the Barrier Layer
A conceptual model is presented in Figure 5a for a radioactive underground repository. This is a schematic diagram for a nuclear waste storage chamber. The middle chamber is for nuclear waste storage. The outer edge of this chamber is a layer of bentonite backfilling, which is used to separate the nuclear waste from the surrounding rock mass. This bentonite backfilling layer wraps the radioactive waste and is called a barrier layer. In order to simplify the calculation process, we do not simulate the entire nuclear waste storage chamber. Instead, the bentonite at the bottom of the nuclear waste storage chamber is used for simulation and only vertical seepage is considered. That simplified computational model is shown in Figure 5b. The contaminant at the top spreads downward as water percolates through the soil. The z-axis is downward.
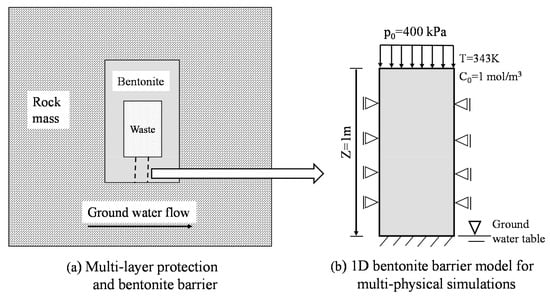
Figure 5.
Diagram of the nuclear waste repository cavern and computational model. ((a) Schematic of multiple safeguards for nuclear waste storage. (b) Schematic diagram of multi-physical field coupling simulation of bentonite).
4.2. Boundary and Initial Conditions
The top boundary of this computational model is impermeable to water but has a load of 400 kPa and a concentration C = 1 mol/m3. The bottom boundary is free drainage but fixed for displacement. The bottom boundary is at the groundwater table. The side boundaries have no flux and can only move freely in the vertical direction. The initial temperature is T0 = 293.15 K and the initial concentration is Ci = 0 mol/m3. The temperature at the outer surface of nuclear waste is mainly based on Guo’s paper [34]. His research shows that the exothermic process of nuclear waste probably lasts for tens of thousands of years and the near-field temperature range of nuclear waste is between 293 K and 373 K. After the early decay, the near-field temperature at the surface may remain between 343 K and 363 K. In order to facilitate our calculation, the temperature at the top boundary of the computational model is specified as 343 K.
4.3. Computation Procedure
The numerical simulation for the couplings is carried out by solving a series of non-linear partial differential equations. The governing equations for the seepage process and solute transport are of the first-order non-linearity in time domain and the second-order non-linearity in space domain. These complete coupling equations are implemented within the framework of COMSOL Multiphysics, a powerful partial differential equation solver. The computational parameters for this bentonite barrier are listed in Table 1.

Table 1.
Parameters for numerical simulations.
5. Numerical Simulation Results and Analysis
5.1. Numerical Solutions
The evolutions of porosity and permeability in the bentonite barrier layer are simulated here. The safety performance of bentonite backfilling for nuclear waste storage is evaluated through parametric study. First, the time dependence of pollutant concentration at the bottom of the model is presented in Figure 6. This is the variation of concentration in the saturated bentonite with different hydraulic conductivity. This figure shows that larger hydraulic conductivity has faster increase of concentration in the early stage. The hydraulic conductivity has an obvious influence on the pollutant diffusion rate. Figure 7 is the evolution of concentration at the bottom when initial saturation is different. This figure clearly shows that the concentration at the bottom rises faster for larger initial saturation. Thus, the initial saturation has a significant effect on the diffusion rate of contaminant concentration.
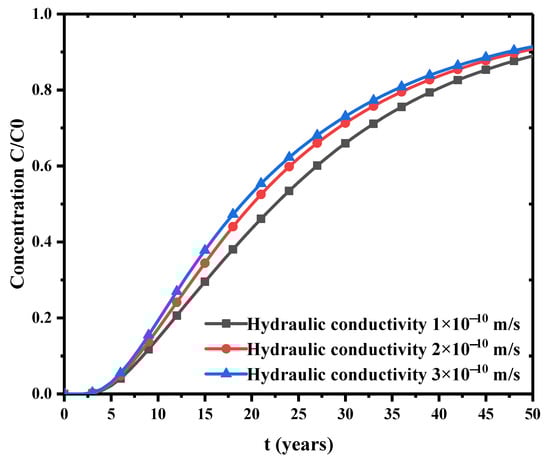
Figure 6.
Effect of hydraulic conductivity on concentration change.
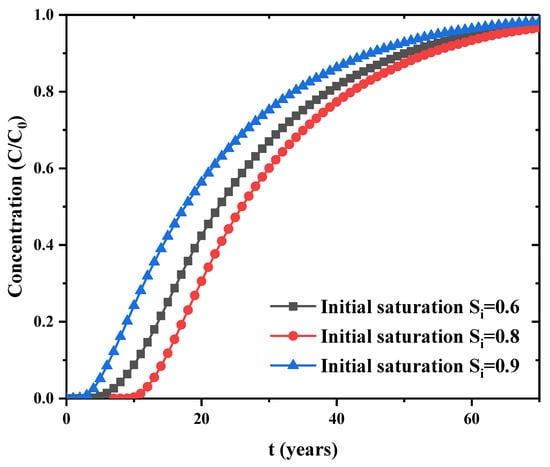
Figure 7.
Effect of initial saturation on concentration at bottom point.
5.2. Effect of Initial Saturation
The initial saturation Si was taken as 0.9, 0.8, 0.6 to simulate a percolation process for a time span of 150 years. Other parameters and initial conditions were kept the same. The lowermost point of this model is selected for observation. Figure 8 is the percolation rate at the bottom of the layer. This figure indicates that initial saturation has significant impacts on percolation rate. Higher initial saturation degree has faster early percolation rate of water at the bottom of the bentonite barrier layer. The percolation rate decreases with the consolidation time of the bentonite layer. The bottom of this barrier layer is gradually saturated by the infiltration of water and the Darcy percolation rate is increasing. The initial saturation has a strong influence on the breakdown time of the contaminant. Larger saturation corresponds to shorter breakdown time, thus the waste is due to less protection from the barrier.
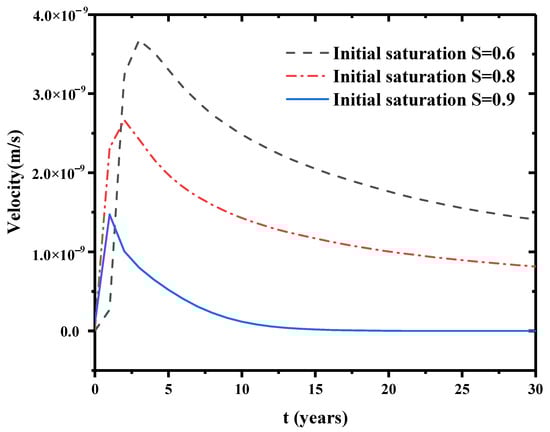
Figure 8.
Flow velocity variation at the bottom.
The effect of initial saturation on the relative permeability is shown in Figure 9. The relative permeability shows a rapid upward trend in the early stage and gradually approaches to a steady state for further time. Thus, initial saturation directly affects the final steady relative permeability. Higher initial saturation usually has higher steady relative permeability. A dimensionless concentration is defined as the cumulative pollutant emissions divided by the lower boundary flux. Figure 10 is the variation of cumulative pollutant emissions at the three initial saturations. In the first 20 years, lower initial saturation has faster increase in the cumulative contaminants. At lower saturations, the capillary pressure in the internal pores of the bentonite is higher. This facilitates the flow of the solution in the pores. At higher initial saturation, the capillary pressure is lower, the concentration gradient diffusion dominates the concentration transport, and the cumulative release of contaminants is greater in a longer time scale (see, 40 years in Figure 10) due to the filling of contaminant liquid in the pores. Further, Figure 11a is the relationship between the displacement at the top point and the initial saturation. The initial saturation has significant effects on the consolidation of bentonite barrier layer. Higher initial saturation will take longer consolidation time and the displacement is lower. Figure 11b shows the breakdown of the bedding layer as a first buffer layer at different initial saturation degrees. At an initial saturation of 0.6, the concentration at the bottom of the layer remains zero until t = 14 years. At higher initial saturation degree, the concentration of contaminants penetrates into the bottom of the layer earlier.
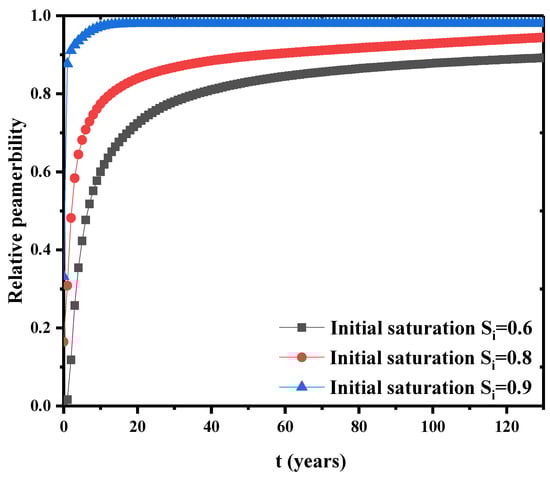
Figure 9.
Change of relative permeability at the bottom under different initial saturations.
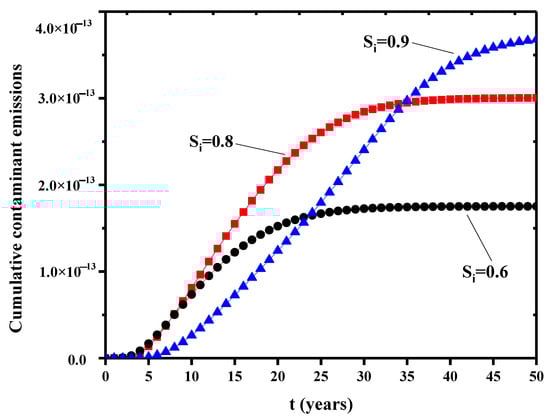
Figure 10.
Variation of cumulative pollutant emissions at different initial saturations.
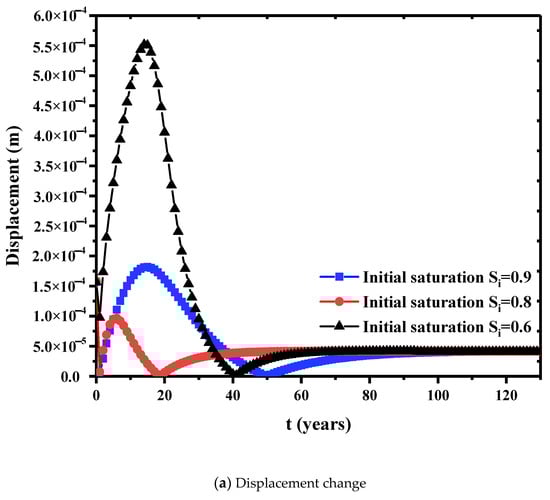
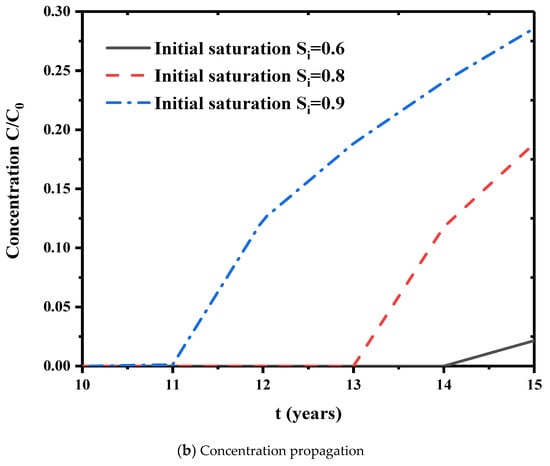
Figure 11.
Effects of initial saturation on displacement change and concentration propagation. ((a) Displacement change. (b) Concentration propagation.).
5.3. Evolution of Intrinsic Porosity
The top and bottom points in the bentonite barrier layer were selected to observe the evolution of porosity. Figure 12 shows the evolution of porosity when Si = 0.6. At the top, the porosity is almost unchanged and kept at 0.375. However, a more pronounced change of porosity is observed at the bottom of this barrier layer in the early stage. Then, the porosity value at the bottom gradually approaches to the porosity value at the top. This is due to the occurrence of drainage at the bottom in the early stage. With further water drainage and consolidation, the porosity has an increase in the later stage. With further water drainage and consolidation, the porosity has an increase in the later stage. The porosity at the bottom is consistently smaller than that at the top. This is because the top is the temperature boundary of the model. The temperature effect induces this small difference in porosity.
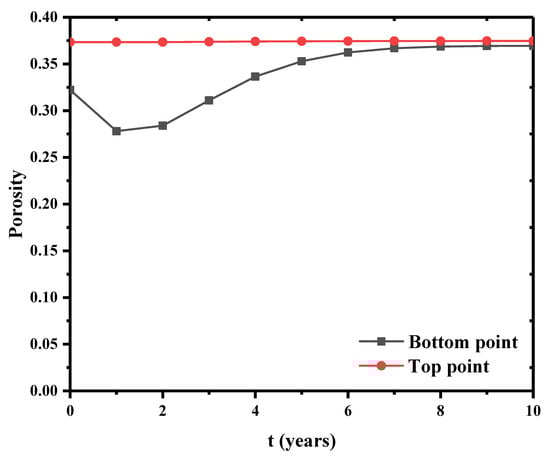
Figure 12.
Porosity evolution at bottom and top boundaries.
5.4. Effect of Temperature on Hydraulic Conductivity
The effect of temperature on the hydraulic-mechanical coupling is investigated. The evolution of hydraulic conductivity is presented in Figure 13, where the THM has the thermal process but the HM has no thermal process. The hydraulic conductivity is slightly larger when thermal process is included. Their difference is only observed in the early stage. Therefore, the thermal strain has weak effect on the hydraulic conductivity, particularly in the early stage. Therefore, the thermal strain has weak effect on the hydraulic conductivity, particularly in the early stage. Since the hydraulic conductivity is described by Equation (6), it can be inferred that a heat source can retard concentration transport at the pore scale when temperature has an effect on porosity, thus modifying the hydraulic conductivity.
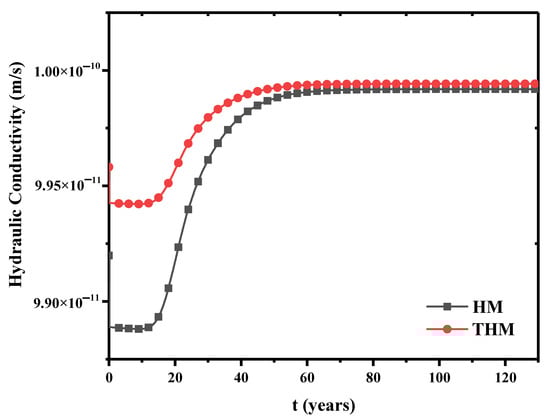
Figure 13.
The effect of temperature on hydraulic conductivity.
5.5. Evolution of Saturation Degree
This model considered the groundwater infiltration from the bottom, thus the water saturation continuously increases with consolidation time. Figure 14 presents the profile of water saturation at the 1, 2 and 5 years. The water saturation is evolving with the discharge of water at the top in a short period of early time. Later, the capillary pressure affects the suction from the bottom. This water infiltration induces the increase of overall water saturation. At the initial saturation of Si = 0.8, it can be seen that the unsaturated portion of the pores in the layer is gradually filled with upward permeating water after 5 years, while the contaminants diffuse down through the solution driven by a concentration gradient and break through the barrier.
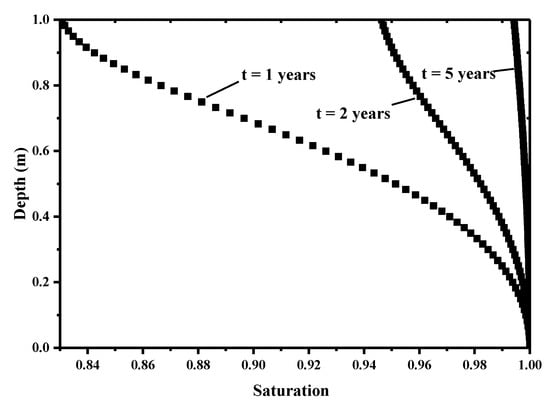
Figure 14.
Saturation profile at different consolidation times.
5.6. Effect of Boundary Temperature on Water Saturation
The effect of boundary temperatures at the top during water saturation is investigated. The boundary temperature at the top is taken as 293 K, 323 K, 343 K, respectively. The temperature of 293 K is the same as initial temperature. Figure 15 presents the change of water saturation under different boundary temperatures. This boundary temperature has significant effects on the water saturation in the early stage. As the heat transfer in the bentonite barrier layer is in equilibrium at the beginning, higher boundary temperature has more obvious impact on water flow and thermal strain. This generates higher thermal stress and greater capillary pressure. The change of capillary pressure causes the change of saturation. When this thermal non-equilibrium induced by different boundary temperatures is completed within some time, the water saturation approaches the same value.
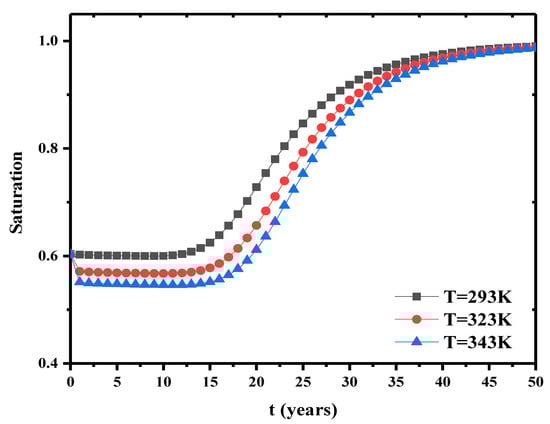
Figure 15.
Saturation change under different initial temperatures.
6. Conclusions
In this study, a thermo-hydro-mechanical coupling model was developed for solute transport in an unsaturated bentonite barrier. After verification, this model was used to evaluate the contaminant transport in the bentonite backfilling barrier layer for radioactive waste storage. The contaminant transport was investigated under the combination of thermal and water pressure loadings. From these studies, the following understandings and conclusions can be drawn.
First, the thermal diffusion has significant effect on the concentration transport in an unsaturated porous medium. This proposed model has the capacity to describe the thermal diffusion effect through the extension of the traditional hydraulic-mechanical model.
Second, exothermic radioactive waste storage can drive the water migration in the barrier layer. The saturation of water increases within the bentonite layer and accelerates the transport of contaminants.
Third, the initial water saturation in the bentonite barrier can influence the total emission of contaminants. Higher saturation can produce a higher total emission of contaminants and a slower consolidation rate.
Finally, the reduction of initial saturation is an effective approach to prolong the transport time of contaminants in the barrier layer. Therefore, the bentonite layer should be drained of as much water as possible at an early stage. In addition, the bottom of the waste storage chamber should be insulated as much as possible to reduce the thermally driving diffusion rate of contaminant.
Author Contributions
Q.W. derived the model, implemented numerical simulations, and prepared the draft of manuscript; J.W. designed and modified the theoretical framework, the structures of manuscript, and improved English. All authors have read and agreed to the published version of the manuscript.
Funding
This research was funded by National Natural Science Foundation of China, grant number 51674246.
Acknowledgments
The authors thank the editor and reviewers for their constructive comments.
Conflicts of Interest
The authors declare no conflict of interest.
References
- Zhang, H.; Wang, X.; Ping, L. Sealing and healing of compacted bentonite block joints in HLW disposal. Chin. J. Rock Mech. Eng. 2016, 35, 3605–3614. [Google Scholar]
- Liu, Y.; Cai, M.; Wang, J. Thermal properties of buffer material for high-level radioactive waste disposal. Chin. J. Rock Mech. Eng. 2007, 26, 3891–3896. [Google Scholar]
- Reijonen, H.M.; Alexander, W.R.; Marcos, N. Complementary considerations in the safety case for the deep repository at Olkiluoto, Finland: Support from natural analogues. Swiss J. Geosci. 2015, 108, 111–120. [Google Scholar] [CrossRef]
- Arega, F.; Hayter, E. Coupled consolidation and contaminant transport model for simulating migration of contaminants through the sediment and a cap. Appl. Math. Model. 2008, 32, 2413–2428. [Google Scholar] [CrossRef]
- Bai, B.; Xu, T.; Guo, Z. An experimental and theoretical study of the seepage migration of suspended particles with different sizes. Hydrogeol. J. 2016, 24, 1–16. [Google Scholar] [CrossRef]
- Barry, D.A.; Sposito, G. Analytical solution of a convection-dispersion model with time-dependent transport coefficients. Water Resour. Res. 1989, 25, 2407–2416. [Google Scholar] [CrossRef]
- Bai, B.; Shi, X. Experimental study on the consolidation of saturated silty clay subjected to cyclic thermal loading. Geomech. Eng. 2017, 12, 707–721. [Google Scholar] [CrossRef]
- Zhang, H.J.; Jeng, D.S.; Seymour, B.R.; Barry, D.A.; Li, L. Solute transport in partially-saturated deformable porous media: Application to a landfill clay liner. Adv. Water Resour. 2012, 40, 1–10. [Google Scholar] [CrossRef]
- Pu, H.; Fox, P. Model for coupled large strain consolidation and solute transport in layered soils. Int. J. Geomech. 2016, 16, 04015064. [Google Scholar] [CrossRef]
- Wu, S.; Jeng, D.S.; Seymour, B.R. Numerical modelling of consolidation-induced solute transport in unsaturated soil with dynamic hydraulic conductivity and degree of saturation. Adv. Water Resour. 2019, 135, 103466. [Google Scholar] [CrossRef]
- Chen, Y.; Zhou CJing, L. Modeling coupled THM processes of geological porous media with multiphase flow: Theory and validation against laboratory and field scale experiments. Comput. Geotech. 2009, 36, 1308–1329. [Google Scholar] [CrossRef]
- Rutqvist, J.; Deborah Barr Birkholzer Jens, T.; Fujisaki, K.; Kolditz, O.; Liu, Q.S.; Fujita, T.; Wang, W.Q.; Zhang, C.Y. A comparative simulation study of coupled THM processes and their effect on fractured rock permeability around nuclear waste repositories. Environ. Geol. 2009, 57, 1347–1360. [Google Scholar] [CrossRef]
- Rutqvist, J.; Chijimatsub, M.; Jing, L.; Millard, A.; Nguyen, T.S.; Rejeb, A.; Sugita, Y.; Tsanga, C.F. A numerical study of THM effects on the near-field safety of a hypothetical nuclear waste repository-BMT1 of the DECOVALEX III project. Part 3: Effects of THM coupling in sparsely fractured rocks. Int. J. Rock Mech. Min. Sci. 2005, 42, 745–755. [Google Scholar] [CrossRef]
- Zheng, L.; Samper, J. A coupled THMC model of FEBEX mock-up test. Phys. Chem. Earth 2008, 33, 486–498. [Google Scholar] [CrossRef]
- Kuráž, M.; Mayer, P.; Havlíček, V. Dual permeability variably saturated flow and contaminant transport modeling of a nuclear waste repository with capillary barrier protection. Appl. Math. Comput. 2013, 219, 7127–7138. [Google Scholar]
- Hu, B.; Wang, J.G.; Zhang, K.; Ye, Z. A new triple-porosity multiscale fractal model for gas transport in fractured shale gas reservoirs. J. Nat. Gas Sci. Eng. 2020, 78, 103335. [Google Scholar] [CrossRef]
- Jia, Y.; Bian, H.B.; Duveau, G.; Shao, J.F. Parametric study of thermo-hydro-mechanical response of claystone with consideration of steel corrosion. J. Rock Mech.Geotech. Eng. 2017, 9, 449–462. [Google Scholar] [CrossRef]
- Jia, S.P.; Zhang, L.W.; Wu, B.S.; Yu, H.D.; Shu, J.X. A coupled hydro-mechanical creep damage model for clayey rock and its application to nuclear waste repository. Tunn. Undergr. Space Technol. 2018, 74, 230–246. [Google Scholar] [CrossRef]
- Fityus, S.G.; Smith, D.W.; Booker, J.R. Contaminant transport through an unsaturated soil liner beneath a landfill. Can. Geotech. J. 1999, 36, 330–354. [Google Scholar] [CrossRef]
- Hsu, J.R.C.; Jeng, D.S.; Lee, C.P. Oscillatory soil response and liquefaction in an unsaturated layered seabed. Int. J. Numer. Anal. Methods Geomech. 2010, 19, 825–849. [Google Scholar] [CrossRef]
- Tong, F.G.; Jing, L.R.; Robert, W. A fully coupled thermo-hydro-mechanical model for simulating multiphase flow, deformation and heat transfer in buffer material and rock masses. Int. J. Rock Mech. Min. Sci. 2010, 47, 205–217. [Google Scholar] [CrossRef]
- Fall, M.; Nasir, O.; Nguyen, T.S. A coupled hydro-mechanical model for simulation of gas migration in host sedimentary rocks for nuclear waste repositories. Eng. Geol. 2014, 176, 24–44. [Google Scholar] [CrossRef]
- Nardi, A.; Idiart, A.; Trinchero, P.; Luis Manuelde, V.; Jorge, M. Interface COMSOL-PHREEQC (iCP), an efficient numerical framework for the solution of coupled multiphysics and geochemistry. Comput. Geosci. 2014, 69, 10–21. [Google Scholar] [CrossRef]
- Wu, S.; Jeng, D.S. Numerical modeling of solute transport in deformable unsaturated layered soil. Water Sci. Eng. 2017, 10, 184–196. [Google Scholar] [CrossRef]
- Wu, S.; Jeng, D.S. Effect of dynamic soil permeability on the wave-induced seabed response around a buried pipeline. Ocean Eng. 2019, 186, 106132. [Google Scholar] [CrossRef]
- Bai, B.; Rao, D.; Xu, T. SPH-FDM boundary for the analysis of thermal process in homogeneous media with a discontinuous interface. Int. J. Heat Mass Transf. 2018, 117, 517–526. [Google Scholar] [CrossRef]
- Wang, J.G.; Hu, B.; Liu, H.; Han, Y.; Liu, J. Effects of ‘soft-hard’ compaction and multiscale flow on the shale gas production from a multistage hydraulic fractured horizontal well. J. Pet. Sci. Eng. 2018, 170, 873–887. [Google Scholar] [CrossRef]
- Jacinto, A.C.; Villar, M.V.; Espina, R.G.; Ledesma, A. Adaptation of the van Genuchten expression to the effects of temperature and density for compacted bentonites. Appl. Clay Sci. 2009, 42, 575–582. [Google Scholar] [CrossRef]
- Aakesson, M.; Kristensson, O.; Boergesson, L. THM modelling of buffer, backfill and other system components. In Critical Processes and Scenarios; Swedish Nuclear Fuel & Waste Management Co.: Stockholm, Sweden, 2010. [Google Scholar]
- Zhu, W.C.; Wei, C.H.; Liu, J.; Qu, H.Y.; Elsworthd, D. A model of coal-gas interaction under variable temperatures. Int. J. Coal Geol. 2011, 86, 213–221. [Google Scholar] [CrossRef]
- Rosanne, R.; Paszkuta, M.; Tevissen, E.; Adler, P.M. Thermodiffusion in compact clays. J. Colloid Interface Ence 2003, 267, 194–203. [Google Scholar] [CrossRef]
- Ferronato, M.; Castelletto, N.; Gambolati, G. A fully coupled 3-D mixed finite element model of Biot consolidation. J. Comput. Phys. 2010, 229, 4813–4830. [Google Scholar] [CrossRef]
- Wang, J.G.; Liu, G.R.; Lin, P. Numerical analysis of Biot’s consolidation process by radial point interpolation method. Int. J. Solids Struct. 2002, 39, 1557–1573. [Google Scholar] [CrossRef]
- Guo, R. Thermal response of a Canadian conceptual deep geological repository in crystalline rock and a method to correct the influence of the near-field adiabatic boundary condition. Eng. Geol. 2017, 218, 50–62. [Google Scholar] [CrossRef]
Publisher’s Note: MDPI stays neutral with regard to jurisdictional claims in published maps and institutional affiliations. |
© 2020 by the authors. Licensee MDPI, Basel, Switzerland. This article is an open access article distributed under the terms and conditions of the Creative Commons Attribution (CC BY) license (http://creativecommons.org/licenses/by/4.0/).